Abstract
A series of unconsolidated-undrained triaxial tests and unconfined compressive strength (UCS) tests for cemented soils with different curing times were carried out in this research. In total, three cemented soil mixtures with different cement contents were adopted in the tests, and the confining pressure was controlled in the range of 100–1600 kPa. The influence of curing time, cemented soil mixture ratio and confining pressure on the compressive and shear capacity of cemented soil was analyzed based on the test results. The test results indicate that the cement content and curing time both had a great influence on the strength of cemented soil, the UCS of the cemented soil increased linearly with the curing time under the semi-logarithmic coordinate, the cemented soil exhibited strain softening characteristics in the axial shear tests, and the maximum deviatoric stress of the cemented soil increased with the increase in confining pressure. A linear correlation was found between the cohesion and the UCS of cemented soil, and the cohesion was about 0.40 times the compressive strength.
1. Introduction
Deep cement mixing (DCM) columns are widely used in soil treatment all around the world. The physical and mechanical properties of cemented soil have been investigated by many researchers [1,2,3]. The experimental results indicate that cemented soil strength grows with the cement content and curing time. Moreover, an optimum water content for cemented soil was found for a certain cement content. Cao et al. analyzed the influence of water content, cement content, curing time, and porosity rate on the cemented soil strength based on a series of laboratory tests, and a formula was proposed to predict the strength of the cemented soil [4,5]. The influence of confining pressure on the stress–strain development law of the cemented soil was also studied by some scholars through triaxial compression tests [6,7,8]. The test results showed that the deviatoric stress of cemented soil was positively correlated with confining pressure, while the growth rate was very limited. The consolidated undrained shear tests for cemented soil showed that when the confining pressure is small, the shear strength of the cemented soil is mainly provided by the strength of cement-solidified soil. When the confining pressure exceeds the yield strength of cement-solidified soil, the confining pressure is the dominant factor of the shear strength [9]. The peak deviatoric stress increases with the confining pressure when the cemented soil is in the unsaturated state [10]. Yang et al. established a model that could describe the mechanical behavior of cemented unsaturated loess and found that it was also suitable for the mechanical behavior of unsaturated cemented soil [11]. Yapage extended the Mohr–Coulomb model through the peak strength index and residual strength index, and suggested that the peak strength index would decrease to the residual strength index with a linear trend in the softening process [12].
In recent years, a new kind of composite pile foundation, called the pre-bored grouted planted (PGP) pile, has been developed in China. A pre-stress high concrete (PHC) pile was inserted into the cemented soil column, and was surrounded by the cemented soil when the PGP pile was installed [13]. Moreover, the water content of the cemented soil should be very large, which guarantees that the cemented soil column could be stirred homogeneously in the construction process. In the load transfer process of the PGP pile, the load applied on the pile head was transferred from the PHC pile to the surrounding cemented soil through the PHC pile–cemented soil interface, and then transferred to the surrounding soil through the cemented soil–soil interface [14]. The compressive and uplift bearing capacity of the PGP pile was demonstrated to be better than that of the conventional bored pile [15,16,17]. Moreover, the pile–soil interface shear test results showed that the strength of the cemented soil had a great influence on the shaft resistance at the PHC pile–cemented soil interface [18]. Hence, the properties of the cemented soil would also affect the behavior of the PGP pile.
In this research, a series of unconsolidated-undrained triaxial tests and UCS tests of cemented soil with different ratios were conducted. The mechanical characteristics of cemented soil were further analyzed based on the test results. The experimental results could offer a basis to the design of the DCM pile, jet grouting pile, and PGP pile.
2. Experimental Process
2.1. Cemented Soil Specimen Preparation
The materials adopted to make cemented soil samples in this test were Hangzhou soft clay and P.O. 52.5 Portland cement. Some basic parameters of the Hangzhou soft clay and P.O. 52.5 Portland cement are presented in Table 1 and Table 2, respectively. The water content of the cemented soil specimen was around 60%, according to practical projects. In the cemented soil specimen manufacture process, the soft clay should be dried in the oven first. The soft clay particles should go through a 2 mm sieve after being crushed to make sure the cemented soil specimen can be stirred evenly. The soft clay particles and P.O. 52.5 Portland cement grains were stirred for 5 min, and then water was added and continuously stirred for 5 min. The diameter of the mold was 50 mm, and the height was 100 mm. The specimens were placed in water at a controlled temperature (20 ± 1 °C) for curing. The curing time was set to 3, 7, 14, and 28 days, respectively.

Table 1.
Parameters of soft clay.
Table 2.
Parameters of the P.O. 52.5 Portland cement.
2.2. Test Plan and Test Apparatus
In total, three groups of tests for cemented soil with different cement content were conducted. The cement content of the cemented soil mixture was 6%, 12%, and 18%, respectively. According to the local specification [19], the consolidation and drainage process of cemented soil was not considered because of its poor permeability. Hence, the unconsolidated-undrained triaxial tests of the cemented soil were conducted in this study. The confining pressure for the unconsolidated-undrained triaxial tests were set at 100 kPa, 200 kPa, 400 kPa, 800 kPa, and 1600 kPa, respectively. The UCS and triaxial shear tests were all conducted in the GDS shear test apparatus, which could provide a maximum confining pressure of 5 MPa. The pictures of test specimens and the shear test apparatus were presented in Figure 1 and Figure 2, respectively. The specimens were saturated by vacuum saturation and the B value was greater than 0.9 by applying back pressure before the shear tests. For some hard clays with poor permeability, the specimen could be considered to reach the relative saturation state under this condition [20]. The loading rate was controlled at 0.5 mm/min, and tests were terminated when the axial strain reached 15%.
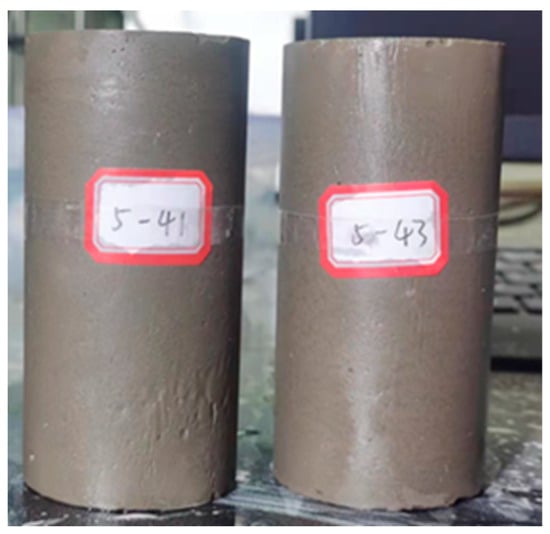
Figure 1.
Photograph of cemented soil specimen.
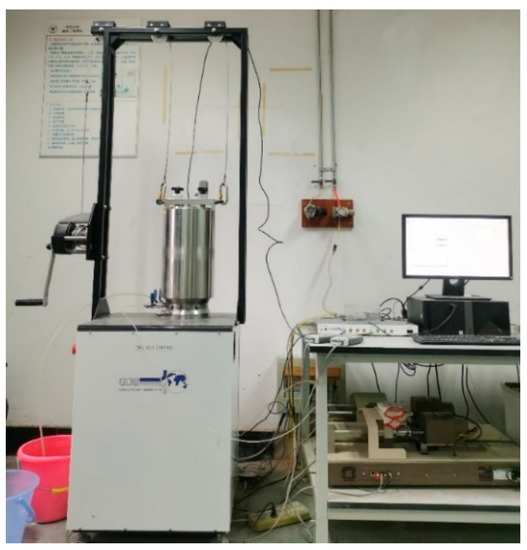
Figure 2.
Photograph of GDS triaxial shear apparatus.
3. Test Results
3.1. Stress–Strain Curve
The stress–strain curves of the cemented soil with 18% cement content after being cured for 28 days are shown in Figure 3, where ε is the axial strain, q is the deviatoric stress and σ3 is the confining pressure. As shown in Figure 3, the stress–strain curves of cemented soil under different confining pressures all showed softening behavior, and the stress–strain curve could be divided into three stages. In the first stage, the deviatoric stress initially grew linearly with strain; in the second stage, the deviatoric stress exhibited elastic–plastic characteristics when approaching the peak strength, and the brittle failure then occurred; in the third stage, the deviatoric stress almost remained stable as the strain kept increasing. Furthermore, the deviatoric stress of the cemented soil increased with the confining pressure in the first stage, while the growth rate decreased with confining pressure. The maximum deviatoric stress increased from 2353 kPa to 2605 kPa when the confining pressure increased from 0 to 400 kPa. The maximum deviatoric stress increased from 2605 kPa to 2738 kPa when the confining pressure increased from 400 kPa to 1600 kPa. Moreover, Figure 3 also indicates that the residual strength of deviatoric stress also increased with confining pressure.
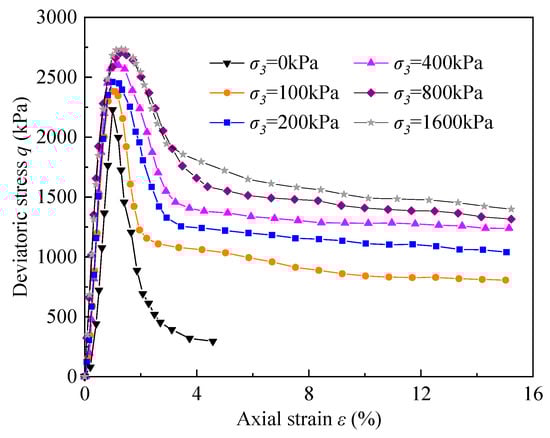
Figure 3.
Stress–strain curves of cemented soil after being cured for 28 days (cement content: 18%).
The stress–strain curves of cemented soil with different cement content are shown in Figure 4. The specimens were all under a 400 kPa confining pressure after being cured for 28 days. According to Figure 4, the cement content had a great impact on the peak strength of the cemented soil. The maximum deviatoric stress was 1047 kPa when the cement content was 6%, and the maximum deviatoric stress increased to 1977 kPa when the cement content was 12%. The maximum deviatoric stress finally increased to 2633 kPa when the cement content was 18%. Moreover, the softening feature also increased with the cemented soil strength. The residual deviatoric stress of cemented soil with 6% cement content was 774 kPa when the axial strain reached 15%, and the value of the residual/peak deviatoric stress was 0.74. The value of the residual deviatoric stress was 1110 kPa, and the value of residual/peak deviatoric stress decreased to 0.56 when the cement content of the cemented soil was 12%. The residual deviatoric stress was 1243 kPa, and the value of the residual/peak deviatoric stress was only 0.47 when the cement content of the cemented soil was 18%.
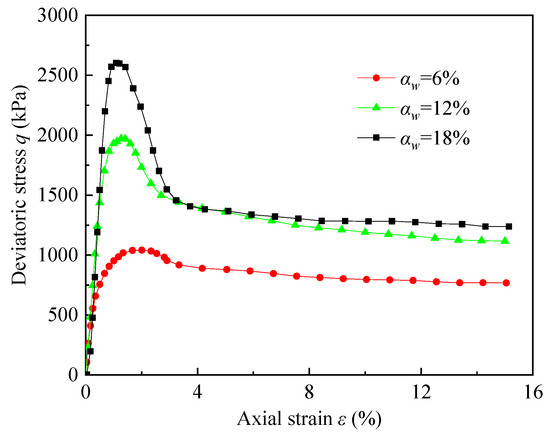
Figure 4.
Stress–strain curves of the cemented soil under a 400 kPa confining pressure (curing time: 28 days).
The stress–strain curves of the cemented soil under 400 kPa confining pressure when the cement content was 18% are presented in Figure 5. As shown in Figure 5, the cemented soil strength increased with curing time. The maximum deviatoric stresses were 1440 kPa, 1929 kPa, 2284 kPa, and 2605 kPa, respectively, when the curing time was 3, 7, 14, and 28 days. Moreover, the softening feature of the cemented soil was more obvious with the increase in its strength. The values of the residual/peak deviatoric stress were 0.69, 0.67, 0.57 and 0.47, respectively, as the curing time increased from 3 to 28 days.
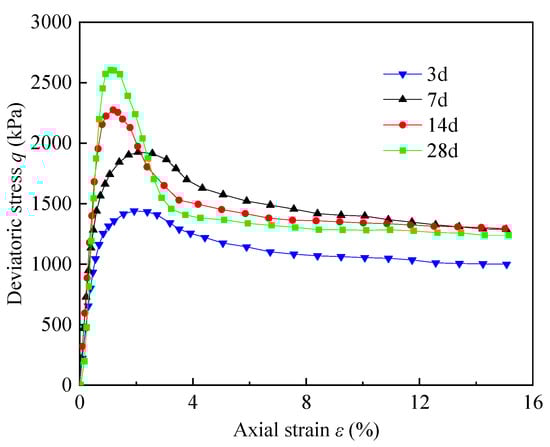
Figure 5.
Stress–strain curves of the cemented soil under a 400 kPa confining pressure (cement content: 18%).
Sariosseiri and Muhunthan introduced the concept of the brittleness index IB to quantify the behavior of a sharp decrease in the cemented soil after reaching the peak value [21], as shown in Equation (1):
where qp is the peak strength of cemented soil and qr is the residual strength of cemented soil. The brittleness index indicates the brittleness of the cemented soil.
The variation in the brittleness index of the cemented soil with confining pressure is presented in Figure 6. The cemented soil specimens were all cured for 28 days.
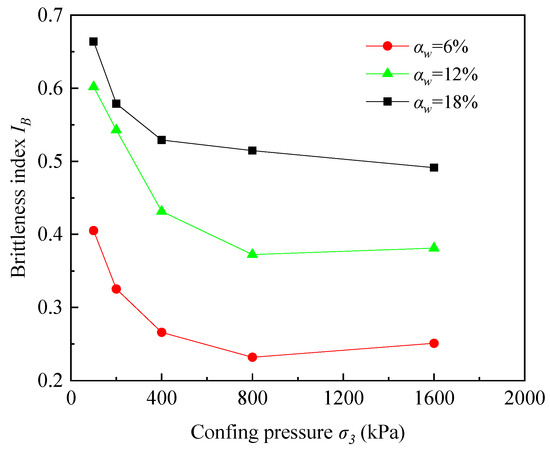
Figure 6.
Variation in the brittleness index with confining pressure (curing time: 28 days).
According to Figure 6, the brittleness index decreased rapidly with the confining pressure when the confining pressure increased from 100 kPa to 400 kPa. For the cemented soil with 18% cement content, the brittleness index decreased from 0.664 to 0.529 as the confining pressure increased to 400 kPa from 100 kPa. It can also be seen in Figure 6 that the brittleness index almost remained stable as the confining pressure grew to 1600 kPa from 400 kPa. For the cemented soil with 18% cement content, the brittleness index was in the range 0.515–0.529 as the confining pressure grew to 1600 kPa from 400 kPa. Furthermore, the brittleness index of the cemented soil could also increase significantly with the cement content. The brittleness index of the cemented soil with a cement content of 6%, 12%, and 18% was 0.405, 0.602, and 0.664, respectively, as the confining pressure reached about 100 kPa. The brittleness index of cemented soil with an 18% content was 64% and 10.3% higher than that of cemented soil with 6% and 12% cement content, respectively.
3.2. UCS Test Results
The UCS tests were carried out after the cemented soil specimens were cured to the planned time. The test results of the specimens with different cement content and different curing times are shown in Table 3. The influence of curing time on the UCS of cemented soil is shown in Figure 7. As shown in Figure 7a, the strength of the cemented soil with different cement content all increased with curing time. Nevertheless, the growth rate gradually slowed down as the curing time increased. For the cemented soil specimen with 12% cement content, the UCS increased from 900 kPa to 1330 kPa when the curing time increased from 3 to 7 days, and the strength increased by 32.3%. The UCS increased from 1330 kPa to 1694 kPa when the curing time increased from 7 to 28 days, and the strength increased by 27.3%. As shown in Figure 7b, the UCS of cemented soil with a different cemented content had an approximate linear correlation with curing time under the semi-logarithmic coordinate.
Table 3.
The UCS test results.
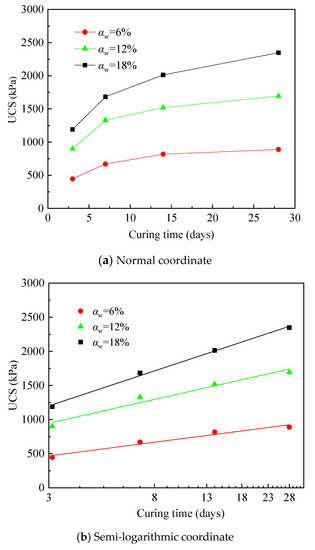
Figure 7.
Correlation between UCS and curing time.
The correlation between the UCS of the cemented soil and cement content is presented in Figure 8. This figure indicates that there was a linear correlation between the UCS and cement content. Figure 8 also shows that when the curing time was 7 days, the UCS of the cemented soil with 12% cement content increased by 98.8% compared with that of the cemented soil with 6% cement content, and the UCS of the cemented soil with 18% cement content was 26.5% higher than that of cemented soil with 12% cement content.
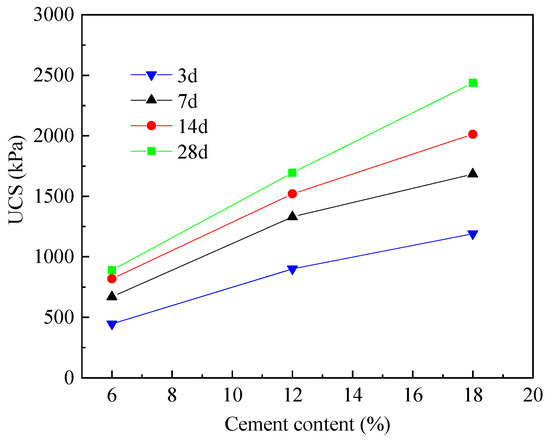
Figure 8.
Correlation between the UCS and cement content.
The correlation between the deformation modulus and UCS of cemented soil is shown in Figure 9. The deformation modulus E50 is the ratio of the 50% peak strength of cemented soil to the corresponding strain. Figure 9 shows that when the cemented soil strength was in range of 447–2353 kPa, the corresponding deformation modulus was in the range 47.2–225.3 MPa. The ratio of the deformation modulus E50 and cemented soil strength qu was in the range 71–119. The local specification suggests that the ratio of the deformation modulus E50 and the cemented soil strength E50 was in the range 100–120. It could be considered that the test result in this study was close to the proposed values of the local specification [22]. Moreover, the recommended value of E50/qu was 95 according to the experimental results.
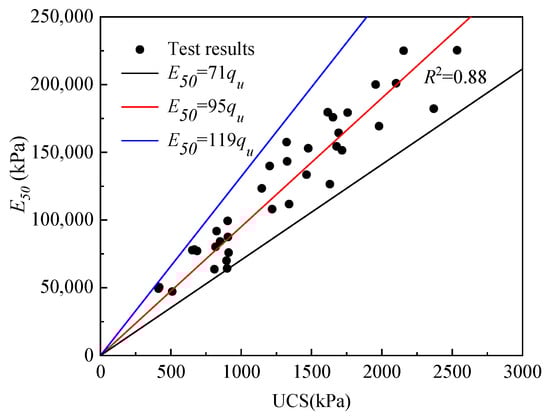
Figure 9.
Correlation between the deformation modulus and UCS of the cemented soil.
3.3. Cemented Soil Failure Mode Analysis
The photographs of typical failure modes of the cemented soil specimens are presented in Figure 10. The specimens had a cement content of 18% and were cured for 28 days. The confining pressures were 0 kPa, 100 kPa, 200 kPa, and 400 kPa, respectively. As shown in Figure 10, four typical failure modes occurred in this study. In the UCS tests (the confining pressure was 0), the vertical crack occurred in the cemented soil specimen, as shown in Figure 10a. It can be considered that the tension failure occurred in the UCS tests. The photograph of the cemented soil specimen under the confining pressure of 100 kPa after the test is shown in Figure 10b. The failure mode was between the tension failure and shear failure, which was similar to the test results of Sariosseiri [21]. It can be considered as a transition mode between tensile failure and shear failure. When the confining pressure reached 200–400 kPa, the single shear failure or conjugate shear failure occurred in the cemented soil shear tests, as shown in Figure 10c,d. In this research, the failure angle in the cemented soil specimen after single shear failure was basically between 63° and 72°, which indicates that in the unconsolidated-undrained triaxial test, the failure mode will change from tensile failure to shear failure as the confining pressure increases.
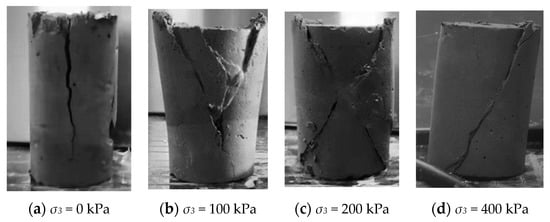
Figure 10.
Photographs of cemented soil specimens after test. (a) Tension failure; (b) Tensile shear failure; (c) Conjugate shear failure; (d) Single shear failure.
4. Analysis and Discussion
4.1. The Effect of Confining Pressure on Maximum Deviatoric Stress
The correlation between the maximum deviatoric stress and confining pressure for cemented soil with a cement content of 18% is shown in Figure 11. As shown in the figure, the maximum deviatoric stress presented a nonlinear growth correlation as the confining pressure increased.
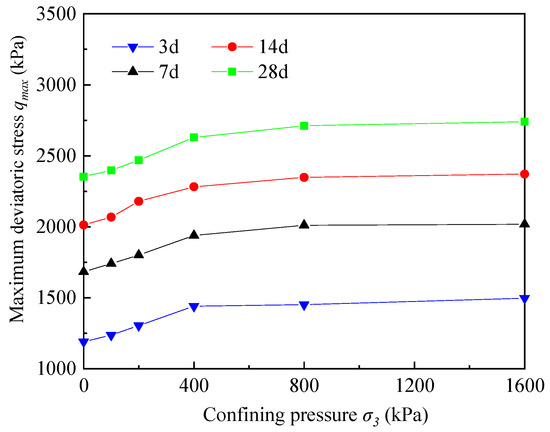
Figure 11.
Correlation between the maximum deviatoric stress and confining pressure (cement content: 18%).
The structure of the cemented soil was very dense and it was difficult for the penetration of water due to the hydrolysis and hydration reaction between the water, soil, and cement. The cemented soil was probably not fully saturated in the experiments and actual engineering project [23,24]. Therefore, the effective stress on the cemented soil increased with confining pressure, and the consolidation process made the maximum deviatoric stress of cemented soil increase when the confining pressure increased from 0 to 400 kPa. This phenomenon was very common in unconsolidated-undrained triaxial tests of cemented soil [25]. The air in the void spaces were highly compressed when higher confining pressure was applied and the solubility of void air in the void water was increased. Therefore, the increase in the maximum deviatoric stress of the cemented soil was small due to the increase in the sample saturation when the confining pressure was between 400 and 1600 kPa. This is consistent with the phenomenon for unsaturated soft clay [26,27].
4.2. Shear Index
The confining pressure of the cement mixing pile in engineering is generally smaller than 400 kPa. Therefore, the total shear index obtained by using the test data within the confining pressure of 400 kPa was more of guiding significance to the actual project in the unconsolidated-undrained triaxial test of the cemented soil. The failure principal stress line method was adopted to calculate the shear indices in this study [28]. The vertex of Mohr’s circle (σ1 + σ3/2, σ1 − σ3/2) under different confining pressure was considered as the failure point. The failure point of the Mohr’s circle was fitted with the least square method to obtain the failure stress line. The expression of the failure stress line is shown in Equation (2). The internal friction angle and cohesion of the cemented soil can be obtained by converting the intercept and slope of the principal stress line and the specific calculation method of the index is shown in Equations (3) and (4).
where Kf is the failure stress line obtained by fitting failure points; a is the intercept of the failure stress line; tanα is the slope of the failure stress line; φ is the angle of the internal friction; and c is the cohesion. Relevant parameters obtained by the method of fitting the failure principal stress line are listed in Table 4, where φ and c are the shear index of the cemented soil.
Table 4.
Shear index of the cemented soil.
As shown in Figure 12, the value of the internal friction angle was almost not affected by the curing time and increased slightly with the cement content.
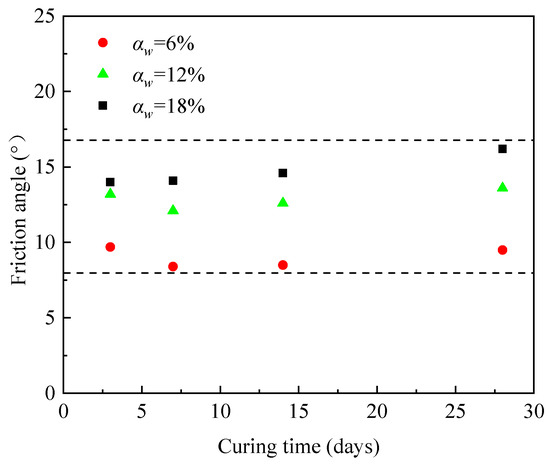
Figure 12.
Correlation between the internal friction angle and cement content.
The correlation between the cohesion of the cemented soil and cement content is shown in Figure 13. This figure shows that the cohesion increased stably when the cement content increased. Moreover, the cohesion also increased with the curing time. Figure 13 also shows that when the specimens were cured for 28 days, the cohesions were 375.1 kPa, 675.3 kPa, and 894 kPa when the cement contents were 6%, 12%, and 18%, respectively. The cohesion increased to 894 kPa as the curing time reached 28 days when the cemented content was 18%.
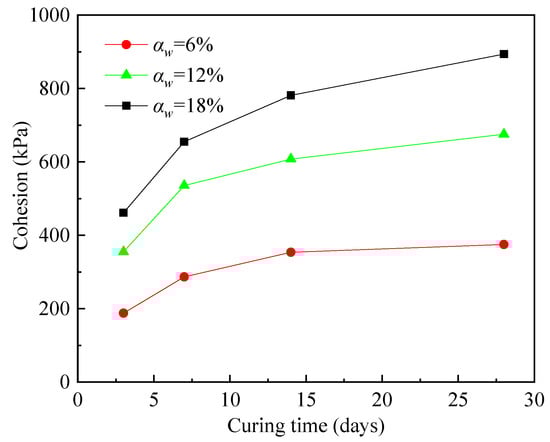
Figure 13.
Correlation between the cohesion and cement content.
The shear strength of the cemented soil was an important factor in the process of load transfer for the DCM pile, jet grouting pile, and PGP pile. The correlation between the shear strength and the compressive indices of the cemented soil also needs to be investigated. In the unconsolidated-undrained triaxial test, the shear resistance of the cemented soil was mainly provided by the bonding force. The internal friction angle of cemented soil was 1.45–2.34 times that of the intact soil in this study. In contrast, the cohesion of the cemented soil increased significantly with the curing time and cement content. The cohesion of cemented soil was 13.4–68.8 times that of the intact soil in this study. When the UCS of the cemented soil increased from 447 kPa to 2353 kPa, the corresponding cohesion increased from 188.2 kPa to 894 kPa.
The correlation between the UCS and cohesion of cemented soil is arranged as shown in Figure 14. As shown from the picture, the cohesion grew almost linearly with the UCS of the cemented soil. The UCS was about 2.38–2.63 times that of the cohesion in the unconsolidated-undrained triaxial tests. The fitted curve c = 0.37qu + 36.7 could be gained from the tests, and the cohesion of the cemented soil was estimated based on this equation.
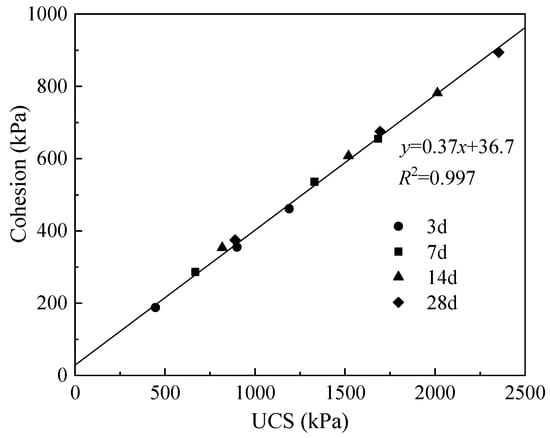
Figure 14.
Correlation between the cohesion and UCS.
5. Conclusions
Based on the UCS test and the unconsolidated-undrained triaxial test results of the cemented soil, the following conclusions can be obtained:
- (1)
- The brittle failure feature of cemented soil decreased with the confining pressure. Due to the extremely poor permeability of the cemented soil, the sample was probably not fully saturated, and the peak deviatoric stress of the cemented soil increased with confining pressure.
- (2)
- The evenly mixed cemented soil was in a liquid state when the water content exceeded 60% for Hangzhou soft clay, and its strength was greatly improved with the increase in the cement content. The UCS of the cemented soil increased from 889 kPa to 2353 kPa when the cement content increased from 6% to 18% after being cured for 28 days.
- (3)
- There was a good linear correlation between the cohesion and UCS of the cemented soil. The UCS of the cemented soil was about 2.38–2.63 times that of the cohesion in the unconsolidated-undrained triaxial tests.
Author Contributions
Conceptualization, J.Y. and J.Z.; Data curation, Z.M.; Formal analysis, J.Y. and Z.M.; Funding acquisition, J.Y. and J.Z.; Investigation, Z.M. and Z.Y.; Methodology, J.Y., J.Z. and X.G.; Project administration, J.Y.; J.Z. and X.G.; Resources, J.Y. and J.Z.; Software, Z.M.; Supervision, X.G.; Validation, Z.M. and X.L.; Visualization, Z.M.; Writing—original draft, Z.M.; Writing—review & editing, J.Y. and J.Z. All authors have read and agreed to the published version of the manuscript.
Funding
This research was funded by the National Natural Science Foundation of China (51978610 and 52108350), and the Scientific and Technological Innovation 2025 Major Special Projects of Ningbo (2022Z030).
Conflicts of Interest
The authors declare no conflict of interest.
References
- Junjie, Y.; Mengrong, D. Forecast formula for strength of cement-treated clay. Soils Found. 2019, 59, 920–929. [Google Scholar]
- Ribeiro, D.; Néri, R.; Cardoso, R. Influence of Water Content in the UCS of Soil-Cement Mixtures for Different Cement Dosages. Procedia Eng. 2016, 143, 59–66. [Google Scholar] [CrossRef]
- Kamruzzamana, H.M.; Chews, H.; Leef, H. Structuration and Destructuration Behavior of Cement-Treated Singapore Marine Clay. J. Geotech. Geoenvironmental Eng. 2009, 135, 17. [Google Scholar] [CrossRef]
- Zhiguo, C.; Dingwen, Z. Key parameters controlling UCS of soil-cement mixtures. Chin. J. Rock Mech. Eng. 2015, 34, 3446–3454. (In Chinese) [Google Scholar]
- Wang, D.S.; Yang, J.J.; Dong, M.R.; Su, X.T.; Wang, X.J. Laboratory test on the prediction of cement soil strength. Period. Ocean Univ. China 2018, 48, 96–102. (In Chinese) [Google Scholar]
- Azneba, S.; Banerjee, S.; Robinsonr, G. Shear strength of cement-treated marine clay under triaxial and plane strain conditions. Proc. Inst. Civ. Eng.-Ground Improv. 2021, 174, 143–156. [Google Scholar] [CrossRef]
- Bian, X.; Cao, Y.-P.; Wang, Z.-F.; Ding, G.-Q.; Lei, G.-H. Effect of Super-Absorbent Polymer on the Undrained Shear Behavior of Cemented Dredged Clay with High Water Content. Am. Soc. Civ. Eng. 2017, 29, 04017023. [Google Scholar] [CrossRef]
- Jianjun, L.; Renwang, L. Research on compression strength and modulus of deformation cemented soil. Rock Soil Mech. 2009, 30, 473–477. [Google Scholar]
- Horpibulsuk, S.; Miura, N.; Bergadod, T. Undrained Shear Behavior of Cement Admixed Clay at High Water Content. J. Geotech. Geoenvironmental Eng. 2004, 130, 1096–1105. [Google Scholar] [CrossRef]
- Wang, W.; Li, J.; Hu, J. Triaxial Mechanical Properties and Micromechanism of Calcareous Sand Modified by Nanoclay and Cement. Geofluids 2021, 2021, 6639602. [Google Scholar] [CrossRef]
- Yang, C.; Cui, Y.; Pereira, J. A constitutive model for unsaturated cemented soils under cyclic loading. Comput. Geotech. 2008, 35, 853–859. [Google Scholar] [CrossRef]
- Yapagen, N.S.; Liyanapathiranad, S. A review of constitutive models for cement-treated clay. Int. J. Geotech. Eng. 2019, 13, 525–537. [Google Scholar] [CrossRef]
- Jiajin, Z.; Kuihua, W.; Xiaonan, G.; Rihong, Z. Bearing capacity and load transfer mechanism of a static drill rooted nodular pile in soft soil areas. J. Zhejiang Univ.-Sci. A 2013, 14, 705–719. [Google Scholar]
- Jiajin, Z.; Xiaonan, G.; Rihong, Z.; El Nagar, M.H.; Wang, K.-h. Field behavior of pre-bored grouted planted nodular pile embedded in deep clayey soil. Acta Geotech. 2020, 15, 1847–1857. [Google Scholar]
- Jiajin, Z.; Xiaonan, G.; Kuihua, W.; Zhang, R.-h.; Yan, Y.-y. Testing and modeling the behavior of pre-bored grouting planted piles under compression and tension. Acta Geotech. 2017, 12, 1061–1075. [Google Scholar]
- Jiajin, Z.; Xiaonan, G.; Rihong, Z. Model tests to compare the behavior of pre-bored grouted planted piles and wished-in-place concrete pile in dense sand. Soils Found. 2019, 59, 84–96. [Google Scholar]
- Jiajin, Z.; Jianlin, Y.; Xiaonan, G.; Yan, T.-l. Field tests on behavior of pre-bored grouted planted pile and bored pile embedded in deep soft clay. Soils Found. 2020, 60, 551–561. [Google Scholar]
- Jiajin, Z.; Jianlin, Y.; Xiaonan, G.; El Nagar, M.H.; Zhang, R. The effect of cemented soil strength on the frictional capacity of precast concrete pile—Cemented soil interface. Acta Geotech. 2020, 15, 3271–3282. [Google Scholar]
- JGJ/T 233-2011; Specification for Mix Proportion Design of Cement Soil. Ministry of Housing and Urban-Rural Development of the People’s Republic of China: Beijing, China, 2011.
- BS 1377.8-1990; Soils for Civil Engineering Purposes. Part8: Shear Strength Tests (Effective Stress). British Standards Institution: London, UK, 1990.
- Sariosseiri, F.; Muhunthan, B. Effect of cement treatment on geotechnical properties of some Washington State soils. Eng. Geol. 2009, 104, 119–125. [Google Scholar] [CrossRef]
- JGJ79-2002; Technical Code for Ground Treatment of Buildings. China Architecture and Building Press: Beijing, China, 2002.
- Benjiao, Z.; Bin, H.; Xu-dong, F.; Lei, X. An experimental study of strength and deformation properties of cemented soil core sample and its constitutive relation. Rock Soil Mech. 2015, 36, 3417–3424. (In Chinese) [Google Scholar]
- Arroyo, M.; Amaral, M.; Romero, E. Viana da Fonseca. Isotropic yielding of unsaturated cemented silty sand. Can. Geotech. J. 2013, 50, 807–819. [Google Scholar] [CrossRef]
- Wang, W.; Zhang, C.; Guo, J.; Li, N.; Li, Y.; Zhou, H.; Liu, Y. Investigation on the Triaxial Mechanical Characteristics of Cement-Treated Subgrade Soil Admixed with Polypropylene Fiber. Appl. Sci. 2019, 9, 4557. [Google Scholar] [CrossRef]
- Zongjian, W.; Chang, L.; Liang, X.; Liang, L. Triaxial Test Study on Reinforcement Effect of Reinforced Cohesive Soil. J. Chongqing Jiaotong Univ. 2021, 40, 99–106. (In Chinese) [Google Scholar]
- Holtz, R.D.; Kovacs, W.D. Introduction to Geotechnical Engineering; Prentice Hall: Hoboken, NJ, USA, 1981; 733p. [Google Scholar]
- Das, B.M.; Sobhan, K. Principles of Geotechnical Engineering; Cengage Learning: Boston, MA, USA, 2010; 481p. [Google Scholar]
Disclaimer/Publisher’s Note: The statements, opinions and data contained in all publications are solely those of the individual author(s) and contributor(s) and not of MDPI and/or the editor(s). MDPI and/or the editor(s) disclaim responsibility for any injury to people or property resulting from any ideas, methods, instructions or products referred to in the content. |
© 2023 by the authors. Licensee MDPI, Basel, Switzerland. This article is an open access article distributed under the terms and conditions of the Creative Commons Attribution (CC BY) license (https://creativecommons.org/licenses/by/4.0/).