1. Introduction
In recent years, the treatment of black and odorous water has been a difficult issue in the field of civil engineering and environmental protection. Sediment dredging, as a common method, generates a large amount of contaminated dredged sediment during the treatment process [
1,
2]. This type of sediment is mainly composed of fine-grained silty clay, which is difficult to dehydrate [
3]. Moreover, it contains contaminant metals, among which Cu is one of the main contaminants in dredged sediment from lakes and rivers [
4,
5]. Direct landfill or secondary use of this kind of dredged sediment can pose a risk to the surrounding environment and human health [
6]. Thus, the treatment of contaminated dredged sediment should include dehydration to achieve reduction and heavy metal removal to achieve remediation.
For the reduction of contaminated dredged sediment, some scholars have introduced vacuum preloading in the field of foundation treatment into sediment treatment. The advantage of this method is the simple construction technology and low cost [
7,
8,
9]. However, as a traditional mechanical dehydration method, the vacuum preloading method has a long construction period, and the treatment effect is difficult to meet the requirements [
10]. Additionally, the electro-osmosis method can be used to reduce the volume of dredged sediment, and has a better edge in dealing with this kind of fine-grained clay. By means of applying an electric field to the soil, water is transferred from the anode to the cathode under the function of electro-osmosis [
11]. However, studies have demonstrated that electro-osmosis is limited by contact resistance, electrode corrosion, cracks, and other issues [
12,
13]. Therefore, some workers have combined vacuum and electro-osmosis, taking into account the benefits of both dehydration and reduction treatment, and obtained relatively positive achievements [
14,
15,
16]. However, the presence of contaminant metals will inevitably change the microscopic properties of the sediment, and there is still a lack of investigation into the dehydration reduction characteristics of contaminated dredged sediment. It is essential to evaluate the effect of the presence of contaminants on dehydration reduction and to clarify its influence mechanism.
The remediation of the contaminated dredged sediment can also be accomplished with an external electric field. Electrokinetic remediation displays better behaviors in terms of metal mobilization and low repeated pollution [
17]. Under the operation of the external electric field, heavy metal ions, are pooled under the simultaneous function of electro-osmosis, electro-migration, diffusion, and other mechanisms [
18,
19,
20]. The interactions between multiple driving forces are complex and still need further clarification. Most of the single electrokinetic remediation experiments are based on the anode and cathode electrolytic cells to achieve the gathering of contaminants, which are inconvenient to discharge directly [
21,
22,
23]. The intervention of the vacuum preloading method has made it a possibility to simultaneously pool and discharge heavy metal. Nevertheless, as dehydration proceeds, the impact of the stress field change on contaminant migration after consolidation and deformation of the sediment remains to be identified. The influence characteristics of dehydration reduction on the pollutant removal mechanism need to be evaluated and the pollutant removal should be analyzed. The influence of dehydration on the removal mechanism of contaminant metals needs to be estimated and the contaminant removal should be also analyzed. The current studies are mostly conducted in a single reduction or remediation condition. For the simultaneous operation conditions, on the one hand, there are common influencing factors, such as potential, current, and cracks between the two, but there are differences in the degree of influence [
24]. Consequently, the assessment of their respective operating mechanism characteristics under simultaneous conditions is of crucial importance for the optimization of the integrated design of reduction and remediation. On the other hand, the interaction mechanism between reduction and remediation will also have an impact on the final treatment effect, and it is particularly necessary to conduct experiments to evaluate the interaction between the two.
Hence, in this study, laboratory experiments on dredged sediment from Tai Lake with and without copper contamination were carried out. Vacuum preloading, electro-osmosis, and vacuum electro-osmosis method were adopted, and a detachable test system was made. The operating characteristics of the integrated design of reduction and remediation were analyzed, and the interaction laws between reduction and remediation were emphasized. Meanwhile, considering the difficulties of contaminant monitoring in practical engineering, a correlation model based on electrical conductivity, moisture content, and the concentration of contaminant metals was established. The scientific rationale is expected to be provided for the engineering application of this composite technology.
2. Materials and Methods
2.1. Materials
The sediment samples in this study are divided into pollution-free samples and Cu-contaminated samples. Original pollution-free dredged sediment is taken from Tai Lake, Jiangsu, China, and its location is shown in
Figure 1. Due to the continuous discharge of pollutants from sewage treatment plants around lakes, the concentration of pollutants in the sediment is much higher than the general standard. According to China’s Discharge Standard of Pollutants for Municipal Wastewater Treatment Plants (GB 18918-2002), the maximum allowable levels of copper in acidic and non-acidic sediments are 800 and 1500 mg/kg, respectively. An artificially Cu-contaminated sediment of copper concentration 1600 mg/kg is produced by adding the copper(II) nitrate to the treated in situ sediment. The measured copper content of the contaminated sediment is 1640 mg/kg after sample preparation.
The basic physical and chemical characteristics of test sediment are shown in
Table 1. The moisture content of the sediment in the dredging project is generally high. In order to better demonstrate the vacuum electro-osmosis characteristics of the actual contaminated dredged sediment, samples are prepared with a moisture content of 75%.
2.2. Test Devices
In this study, a detachable test system is developed for vacuum electro-osmosis experiments, as shown in
Figure 2.
From the left to the right, there is a monitoring system, electro-osmosis system, sample tank, and vacuum system. For a single vacuum test, only the electro-osmosis system in the scheme needs to be turned off. For a single electro-osmosis test, only the bottom of the internal model tank is perforated to discharge water, while the vacuum control system is turned off.
The monitoring system includes a SIN-R5000C paperless recorder, a sensor set, and monitoring software to monitor the soil potential distribution and current intensity in real time. It also includes a soil conductivity detector, pH detector, vane shear strength, and other devices to collect post-test parameters. The bottle of water collection serves as a water separation device for the vacuum pump, on the one hand, and collects the drained pore water for quantitative analysis of drainage, on the other hand.
The electro-osmosis system includes MS3010-DS direct current power supply, wire, electrokinetic geo-synthetics (EKG) drainage board, etc. The DC power supply has a coarse and fine adjustment function, which is convenient to adjust and control the voltage. EKG drainage board is made of geo-synthetic material and metal wire, similar in shape to ordinary plastic drainage board, which can also serve as a conductive electrode, and is durable and corrosion resistant.
The sample tank includes two components, the internal plexiglass sample tank is designed for filling the sediment sample. The internal size is 300 mm × 200 mm × 200 mm. The external plexiglass sample tank is designed for forming a gap with the internal sample tank to function as a sealing ditch. The sealing ditch is available to prevent the edge of the vacuum membrane from squeezing the small size specimen in the vacuum process. The internal size of the external sample tank is 350 mm × 250 mm × 250 mm. This study utilizes the vacuum membrane to apply vacuum pressure to the sample and inserts the vacuum membrane into the gap between the internal and external sample tank. Holes are created in the upper part of the vacuum membrane to allow for the passage of monitoring wires, and the air-tightness of the system is ensured by means of a mud seal.
The vacuum system includes Jiabaoli-550D oil-free vacuum pump, vacuum controller, vacuum connecting pipe, vacuum membrane, etc. When the vacuum pump starts working to the upper threshold, it will stop running. When the vacuum degree decreases below the lower threshold with the influence of the incomplete air-tightness of the environment, the vacuum pump will start running again. It cannot only save energy, but also control the vacuum degree to be always stable at the design vacuum degree to meet the test requirements.
2.3. Experimental Design
The experimental design of this study is shown in
Table 2, which contains six groups of experiments. The novel EKG drainage board is used as the test electrode. Considering the size of the sample and the energy consumption control, combined with the results of the previous experimental attempts, the potential gradient is set to 1 V/cm in this paper. While the test time is set to 48 h, and the vacuum degree is controlled at −75 KPa to 80 KPa.
2.4. Experimental Process
Samples and the required instruments need to be arranged before the test, while the monitoring and analysis of macroscopic test parameters need to be prepared. The arrangement of measurement points is shown in
Figure 3, and the specific experimental process is described below.
2.4.1. Preparation of Soil Samples
Pollution-free soil sample: The dredged sediment in Tai Lake is dried and crushed, then the soil is mixed with distilled water to produce the experimental soil with a moisture content of 75%;
Contaminated soil sample: The raw soil after the above treatment is weighed, and then the mass of copper(II) nitrate required to form the contaminated soil with a copper content of 1600 mg/kg is calculated. Corresponding masses of copper(II) nitrate crystals are weighed. The solution is poured into a mixing drum and mixed well, and left to stand until natural deposition is complete;
A small number of samples are taken out and entrusted to professional institutions to test the content of contaminants and composition of substances. Copper content is determined by flame atomic absorption spectrometry (AAS), while sodium, aluminum, silicon, and calcium are determined by inductively coupled plasma optical emission spectrometer (ICP-OES).
2.4.2. Electro-Osmosis Test
Potential monitoring device fabrication: A model of the measurement point along the cathode to the anode is made to mark the location of the point to be measured. The potential measurement points are fixed to the measurement point site. Then, the direct current power supply is turned on and each measurement point is confirmed to be working properly;
Placement of sample tank: The electro-osmotic model tank is taken, the drainage board is installed and connected to the DC power supply, the water collection bottle is connected, and the electronic scale and camera are arranged;
Sample loading: The prepared pollution-free sediment or contaminated sediment is filled into the model tank in layers, and the potential monitoring device is fixed at 5 cm from the bottom of the sample tank. The sediment is filled to the top of the box and smoothed out. A layer of geotextile was laid on the top of the sediment sample, followed by a 20 mm thick layer of permeable sand;
Experiments set-up and data acquisition: All equipment power and monitoring system software is turned on and the sand cushion is removed after forty-eight hours of treatment. Soil morphological characteristics are observed, in situ measurements of settlement, shear strength, pH, and temperature are taken, and samples are taken to measure moisture content and material composition.
2.4.3. Vacuum Test
Vacuum system fabrication: The drainage board is connected to the vacuum pipe using a hand-type connector, and the vacuum pipe is connected in series with the hand-type connector, vacuum membrane water collection bottle, and vacuum pump, to form a complete vacuum drainage system. The air-tightness of each connection part is checked and tested;
Placement of sample tank: Vacuum model tank pair is taken and the internal sample tank is put inside the external sample tank. The drainage board is installed in the internal sample tank, the vacuum tube is connected to the water collection bottle after passing through the vacuum membrane. Moreover, the electronic scale and camera are arranged;
Sample loading: Same as described in electro-osmosis test;
Sealing: The vacuum membrane is inserted into the gap between the two sample tanks and the holes around and at the top are filled with dredged sediment to ensure the overall air-tightness of the device;
Start of experiments and data acquisition: The same as the electro-osmosis method.
2.4.4. Vacuum Electro-Osmosis Test
Vacuum electro-osmosis system fabrication: The potential device is made the same as the electro-osmosis test, and the vacuum device is made the same as the vacuum test;
Placement of sample tank: Same as vacuum test;
Sample loading: Same as electro-osmosis test;
Sealing: It is necessary to seal the hole after passing the potential measurement wire through the vacuum membrane. The rest of the sealing is the same as the vacuum test;
Experiments set-up and data acquisition: The same as what was described in the electro-osmosis test.
3. Results
3.1. Analysis of Water Displacement, Moisture Content, Shear Strength
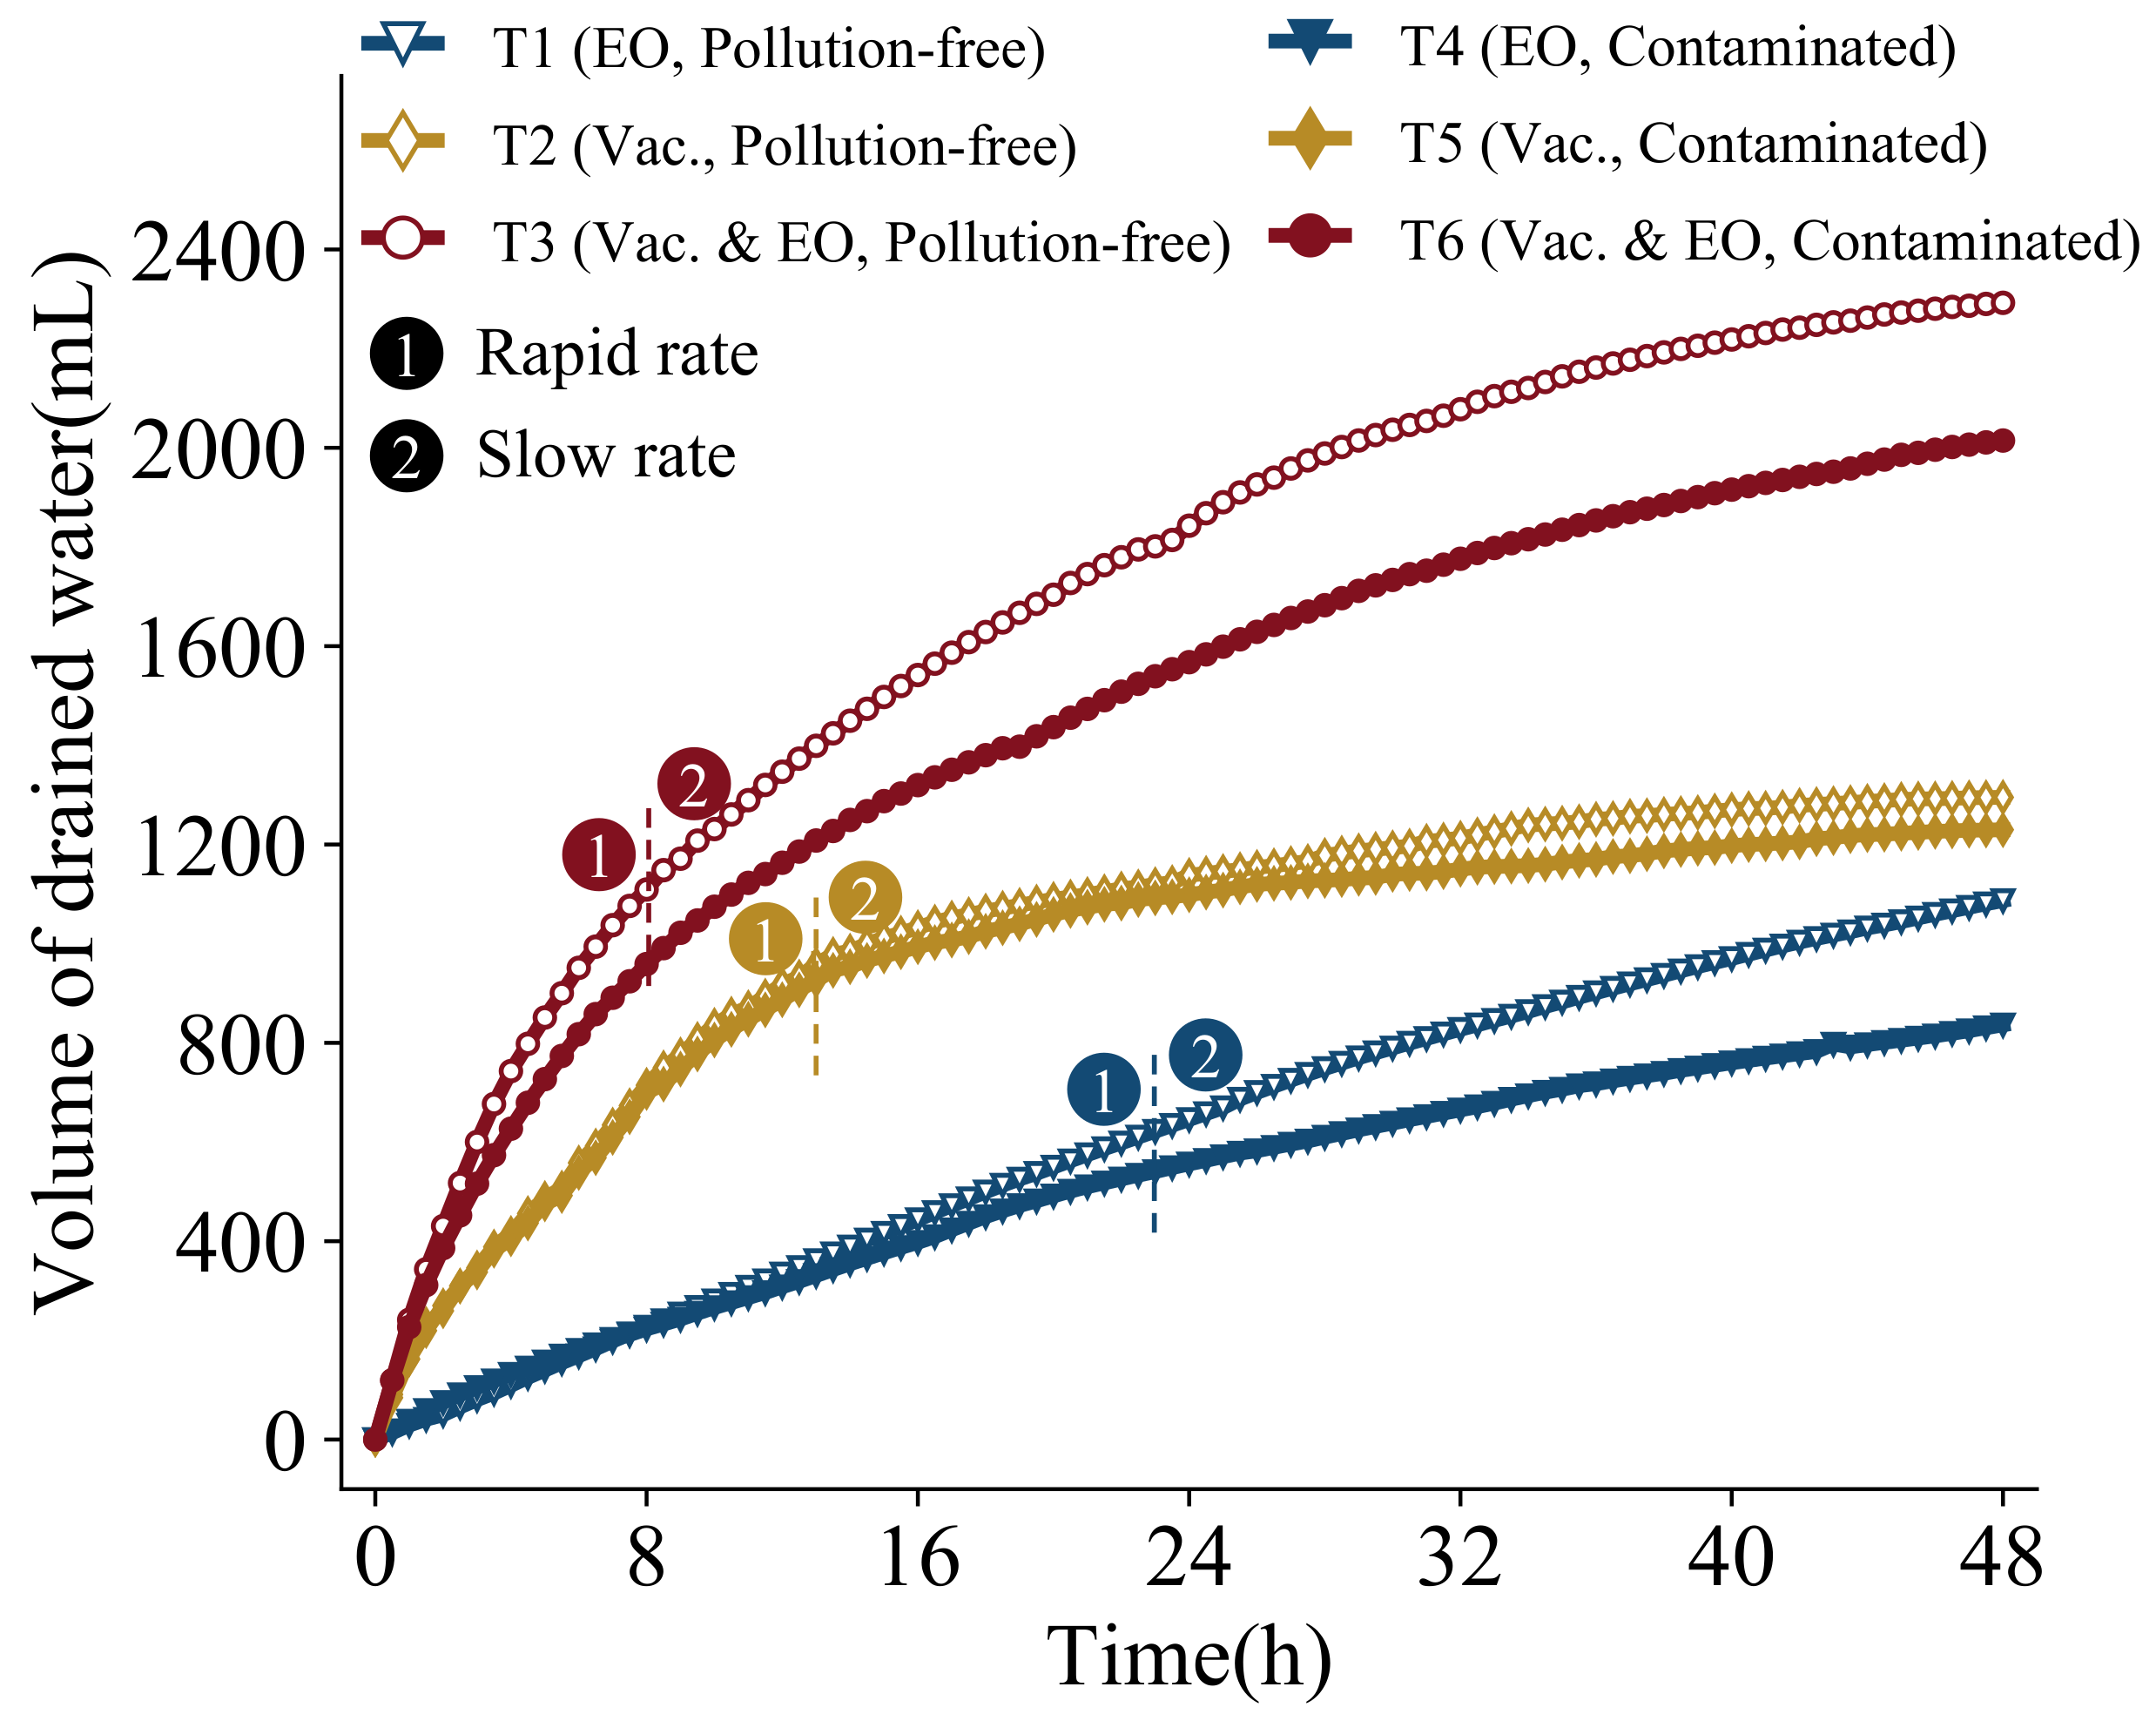
Figure 4 shows the change curve of volume of drained water with time. The final volumes of drained water of the tests in groups T1–T6 are 1087.01 mL, 1295.10 mL, 2292.38 mL, 836.26 mL, 1229.76 mL, and 2014.66 mL, respectively. Comparison of T1–T3 or T4–T6 group tests shows that: electro-osmosis drainage < vacuum < vacuum electro-osmosis, and vacuum electro-osmosis significantly increases the final drainage compared to single electro-osmosis and single vacuum. In addition, it can be seen from the figure that the growth of the discharge volume goes through a rapid and then slow phase. From T1 and T4, it can be seen that the drainage growth of the electro-osmosis method is more stable, and the drainage rate only slightly decreases until about 24 h. From T2 and T4, it can be seen that the vacuum method can be divided into two stages, first rapid drainage until about 12 h, the drainage growth continues to slow down to almost no more growth. From T3 and T6, it can be seen that the vacuum electro-osmosis method can likewise be divided into two stages, with rapid drainage up to about 8h in the early stage, when the drainage rate is the fastest, followed by a slow attenuation to nearly parallel to the growth of electro-osmosis drainage, i.e., at essentially the same rate. Consequently, it can be stated that the effect of vacuum is mainly reflected in the early stage of rapid drainage, while the later stage of drainage is mainly controlled by electro-osmosis. It is mainly due to the fact that—in the early stage—when the blockages inside the soil and near the drainage board are not severe, the water is discharged faster under the action of the vacuum. After the later blockage occurs, the degree of soil compaction increases, and the drainage effect decreases rapidly. The effect of electro-osmosis is less affected by it; hence, vacuum electro-osmosis can combine the advantages of both to achieve the best treatment effect. As can be seen in the figure, the trend of drainage volume in the presence or absence of contaminants is basically the same for any one engineering method, indicating that the presence or absence of contaminants in the soil does not affect the above law. However, it can be seen from the graph that the final discharge: T1 < T4, T2 < T5, T3 < T6. It suggests that the discharge of either engineering method in the case with pollution is smaller than its counterpart in the case without pollution. It indicates that the presence of contaminants reduces the final drainage volume and the impacts of the contaminant metals on the electro-osmosis method are more significant than that on the vacuum method.
At the end of each group test, three points are taken evenly along the vertical direction of the anode, middle, and cathode positions to measure the moisture content and vane shear strength, as shown in
Figure 3. The average value of the corresponding three points is the moisture content and shear strength at that location.
Figure 5 and
Figure 6 show the distribution law of the moisture content and shear strength of the soil, respectively. The moisture content was 75% before the test, and after treatment, the moisture content at the anode ranged from 40.6% to 52.5%, the moisture content at the middle position ranged from 48.1% to 66.6%, and the moisture content at the cathode position ranged from 43.1% to 60.6%. It can be observed that regardless of the soil contamination, both sides have a lower moisture content and the middle position has a higher moisture content. As the water at the anode is moving to the cathode, the cathode drains on one side and the moisture content is low on both sides, and the water is mostly gathered in the middle position and the moisture content is high in the middle. As can be seen in
Figure 5, the moisture content of the contaminated soil is greater than that of the pollution-free soil, which is consistent with the law of drainage. Combined with the shear strength in
Figure 6, the shear strength before the test is nearly zero, and the anode shear strength after the test is the highest. The shear strength of pollution-free soil is higher than that of contaminated soil, which is roughly negatively correlated with the distribution law of moisture content. The difference in moisture content is about 3% to 4% and the difference in shear strength is about 3 to 5 KPa, both of which indicate that the treatment of contaminated soil is slightly less effective than that of pollution-free soil. Moreover, the best results are obtained by the vacuum electro-osmosis method, which is consistent with the above drainage law.
From the above law, the trends of drainage volume, moisture content, and shear strength with and without pollution are similar. The overall effect of the vacuum electro-osmosis method is also optimal, but the drainage effect of contaminated soil is slightly worse than that of pollution-free soil, and the effect of the electro-osmosis method is greater. Combined with
Table 1, the presence of contaminants does not increase the actual drainage efficiency, although it makes the initial electric permeability coefficient and hydraulic permeability coefficient greater. Although the presence of contaminants brings about a change in the initial soil properties, the gradual discharge of contaminants and the internal electrochemical reactions during the integration of reduction and remediation make their effect on the drainage effect dynamically variable. The reasons for the smaller final volume can be divided into two aspects, on the one hand the electric field distribution and the copper content of the copper-contaminated soil are correlated compared to the pollution-free soil. With the discharge of copper ions, it is difficult to maintain the initial conductivity, and the decay of its electro-osmosis effect will be faster, which in turn leads to worse drainage benefits under the action of its electric field, affecting the drainage capacity of electro-osmosis and vacuum electro-osmosis. On the other hand, the copper ions present in large quantities in the contaminated soil are adsorbed and precipitated in the treatment process to block the pore drainage channels and affect the permeability inside the soil. To a certain extent, pore water discharge is also inhibited. In addition, the precipitates generated by the reaction of copper ions inside the soil will agglomerate the soil particles, which will lead to the rapid attenuation of the electric and hydraulic permeability coefficients. The drainage efficiency of the contaminated soil decreases more rapidly compared to the pollution-free soil and, thus, the final drainage effect is slightly worse than that of the pollution-free case.
3.2. Analysis of Settlement and Cracks
After the test, the settlement at each location is measured, and the settlement distribution is shown in
Figure 7. It can be seen from the figure that the settlement distribution shows a distribution of high in the middle and low on both sides, regardless of the presence or absence of copper contaminants. Settlement range from 1.58 to 7.00 mm in the middle position, from 1.40 to 3.00 mm at the anode, and from 1.45 to 2.80 mm at the cathode. Settlement increases with the increase of distance from the middle position, and the whole shows saddle-shaped distribution with obvious sinking in the middle position. The cause of saddle-shaped inhomogeneous distribution is due to soil consolidation and shrinkage after the transport and discharge of pore water, along with the significant reduction in soil volume. The inhomogeneity of settlement under vacuum is more obvious, and the difference between the settlement in the middle and on both sides is about 3 mm, and that of electro-osmosis is smaller. Under the vacuum action, the vacuum membrane shrinks inward to squeeze the soil sample, and the outer vacuum membrane is obstructed by the rigid boundary of the sample tank leading to a larger squeezing effect in the middle than in the sides. Moreover, the electric field effect and cathode direct discharge cause high moisture content and low shear strength in the middle position, which makes the middle position easier to compress and sink. Thus, the settlement is greater than the two sides, and the frictional resistance between the soil sample and the side wall hinders the sinking of the soil sample to a certain extent. For the contaminated soil sample, the magnitude of its saddle-shaped distribution is smaller than that of the pollution-free soil, which is due to the smaller drainage volume of the soil sample on the one hand. On the other hand, the precipitation generated by the reaction of copper ions inside the contaminated soil filled the soil pores and encroached on part of the pore volume, reducing the compressible volume of the soil volume. The copper ions, which are co-transported with the pore water, precipitate and accumulate in the middle position, increasing the volume of the soil sample in the middle, and enhancing the soil strength to some extent. Thus, the settlement in the middle position of the contaminated soil is smaller than that of the pollution-free soil, resulting in a smaller magnitude of the saddle-shaped distribution.
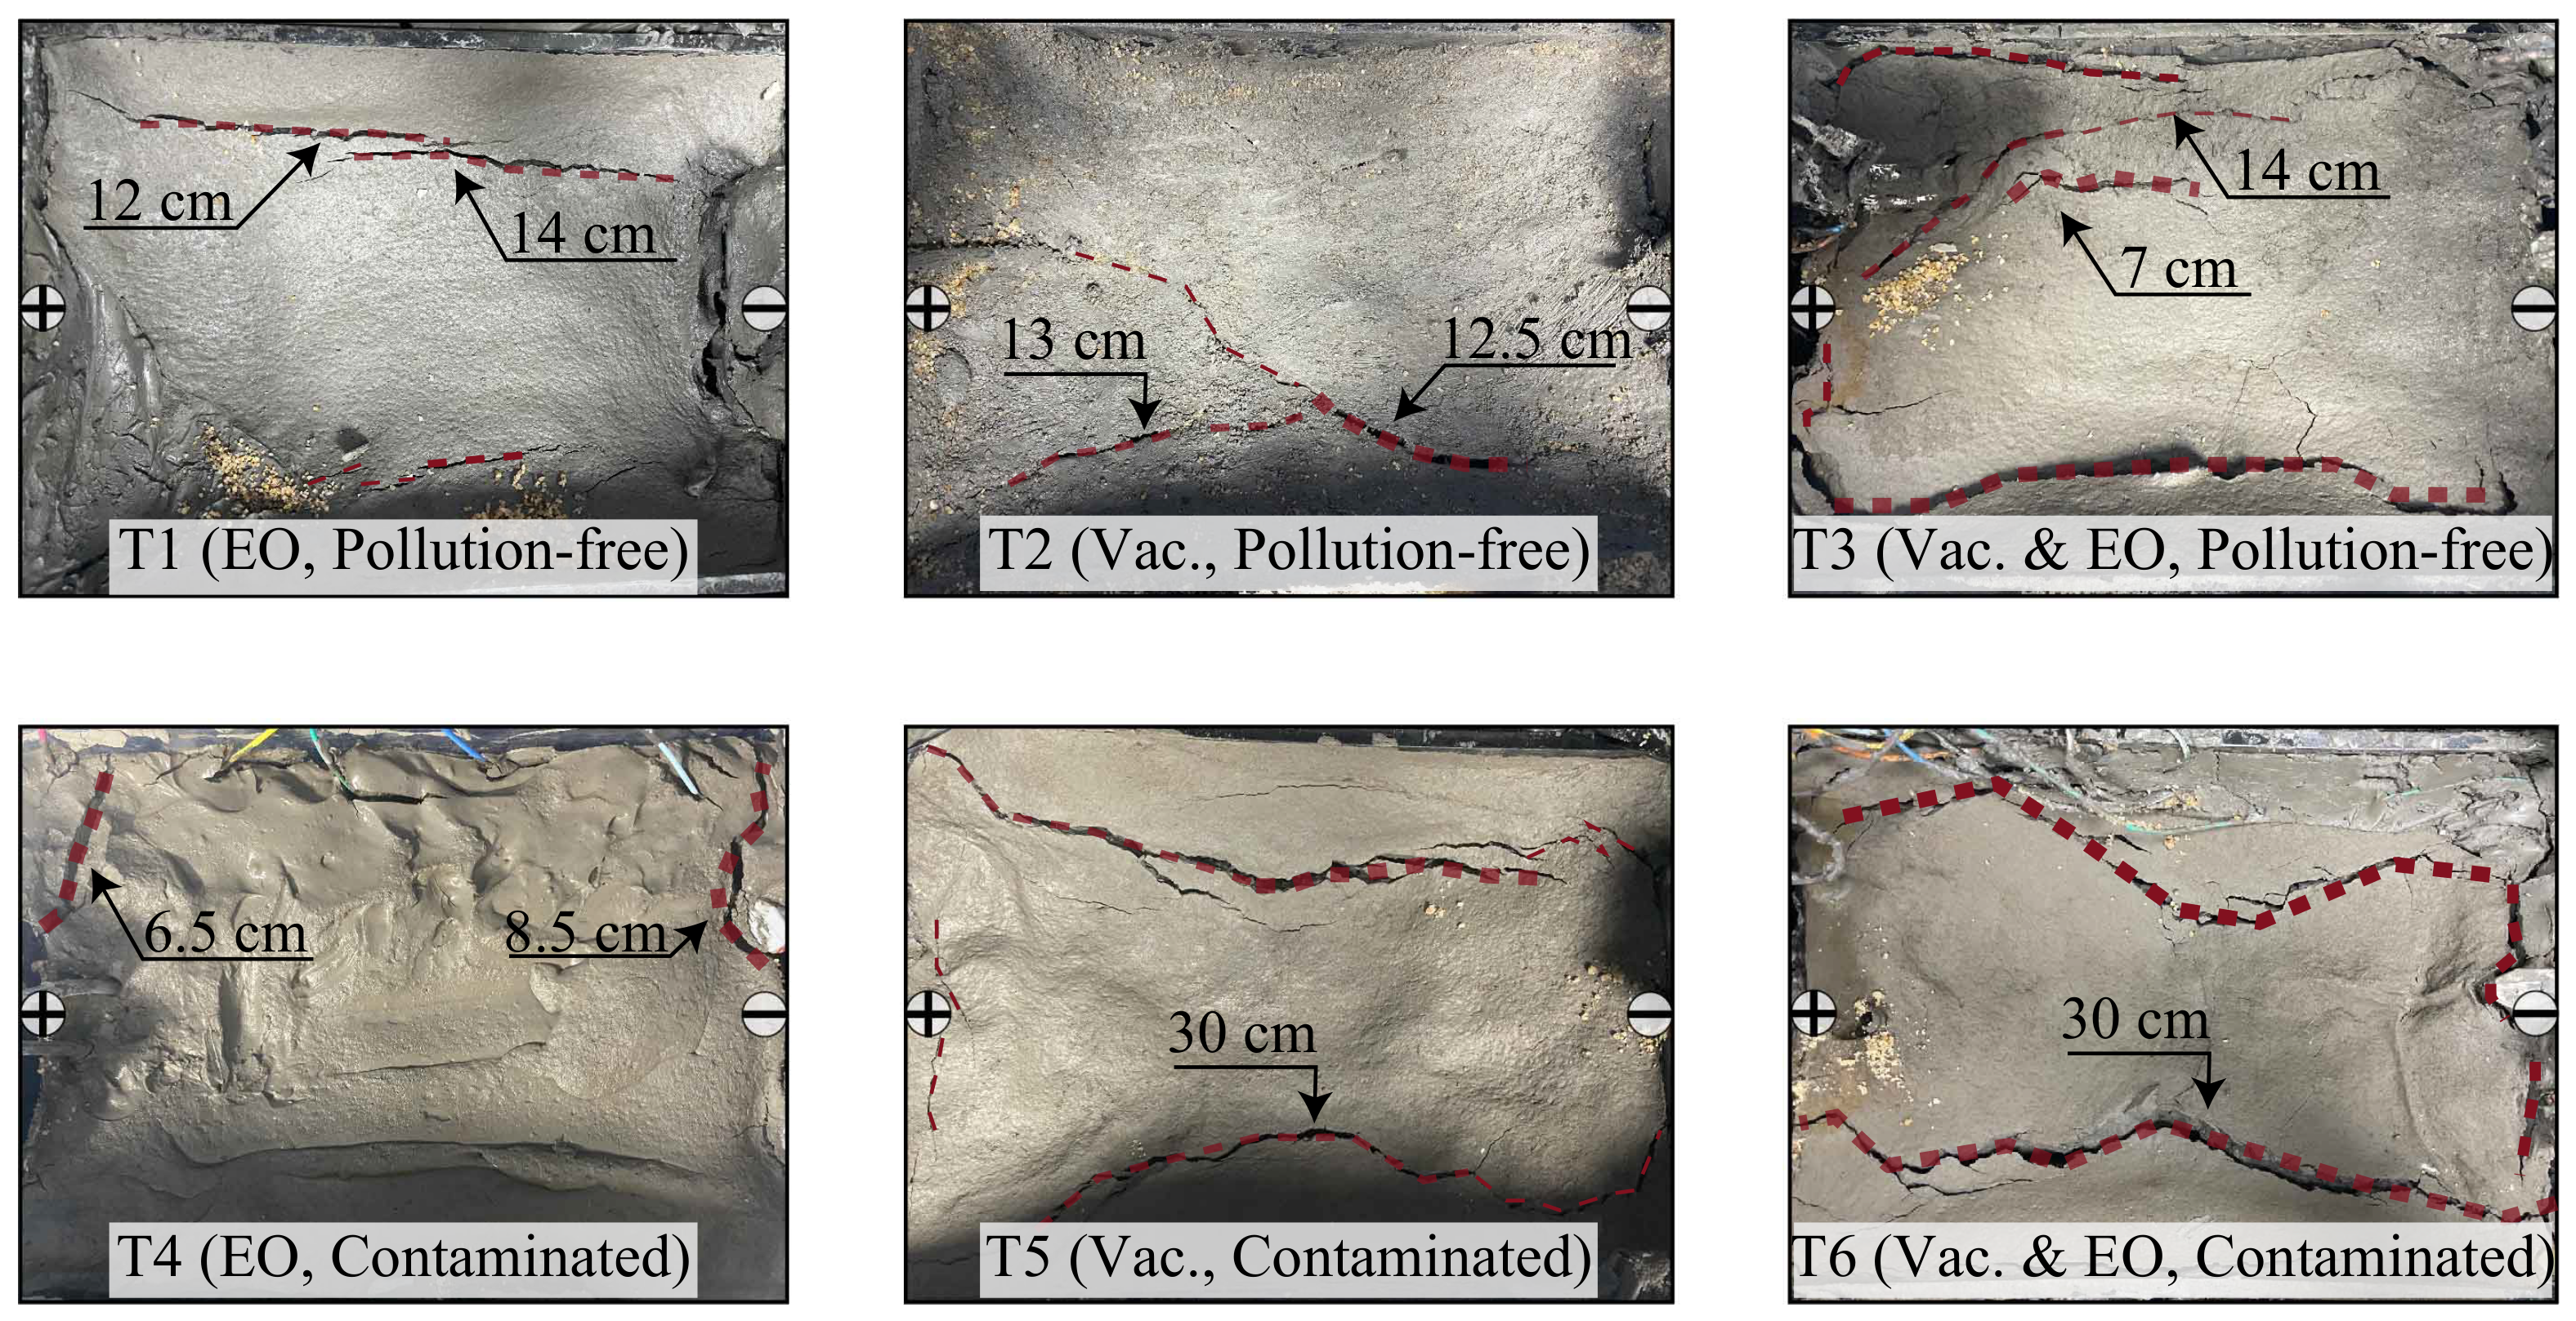
Figure 8 shows the figure after the test for the T1–T6 groups, where the soil all cracked to different degrees, with the more obvious cracks marked in red. The cracks in groups T1–T3 and T4–T6 are gradually expanding. The electro-osmosis method produces the least cracks, due to the small drainage volume and uniform drainage rates. The directional flow of pore water occurs under the action of the electric field, and the moisture content of the soil changes more uniformly. Comparing T1 and T4, it can be seen that the longitudinal cracks are both relatively small, while the transverse cracks of the contaminated soil are larger and the detachment of the contaminated soil from the drainage board is more obvious. As for the vacuum method, it is evident that the longitudinal cracks are wider and longer. Comparing T2 with T4, it can be found that there are longitudinal penetration cracks on both sides of the contaminated soil, i.e., the length of the cracks is approximately equal to 30 cm of the length of the sample tank. The cracks are wider, while the detachment from the drainage board is not obvious. The vacuum electro-osmosis method has the most extensive cracks, and a comparison of T3 and T4 shows that the same wider and larger longitudinal penetration cracks exist in the contaminated soil and that detachment cracks from the drainage board exist in the transverse direction. In general, transverse cracks are mainly produced by the electro-osmosis method, longitudinal cracks are mainly produced by the vacuum method, and the development of cracks in contaminated soil is much more serious. The formation of transverse cracks is mainly due to the directional movement of pore water making the anode moisture content drop faster. Moreover, under the action of the electric field, the soil temperature rises and a crack occurs, producing separation from the drainage board. In turn, the transverse cracks around the drainage board with a length of about 7–8 mm are produced. Due to the higher copper ion content in the contaminated soil, the current is larger and the thermal effect is more pronounced, leading to more severe cracking and separation from the drainage board. Longitudinal cracks extend along the sidewalls of the sample tank, and due to consolidation and settlement of the intermediate soil, there is frictional resistance between the soil and the sidewalls, resulting in the detachment of the soil near the sidewalls from the intermediate soil. The more pronounced development of longitudinal cracks in the contaminated soil may be attributed to the increased friction between the soil and the sidewalls of the sample tank. Meanwhile, copper ions combine with hydroxide ions in the electrochemical reaction to generate precipitated substances to cause soil embrittlement, which makes it more likely to produce cracks.
3.3. Analysis of Copper Concentration
Figure 9 describes the distribution of copper ion concentration in the cathode and anode, and the initial copper concentration in the contaminated soil is 1640 mg/kg. After treatment, the copper concentration at the anode of T4–T6 groups decreases to 1040, 1241, and 900 mg/kg, and the removal ratios are 36.6%, 24.3%, and 45.1%, respectively. Copper concentration at the cathode decreases to 1520, 1180, and 820 mg/kg, and the removal ratios are 7.3%, 28.1%, and 50.0%, respectively. The order of treatment effect at the anode: T6 > T4 > T5. It indicates that electro-osmosis method contributes more to the treatment of Cu-contaminated soil compared to the vacuum method. It is mainly because, under the function of the electric field, the directional flow of water carries part of the copper ions dissolved in water and part of the soil particles adsorbed with copper to move together At the same time, the copper ions with positive charges will also be driven by electro-migration, moving from the anode to the cathode directionally. For the vacuum method, there is no applied electric field, and the soil drains and consolidates under the negative vacuum pressure while carrying copper ions for transport. In comparison to electro-osmosis, it lacks an external driving force. As for the treatment effect at the cathode, due to the function of the applied electric field, water and copper are mainly transported from the anode to the cathode, accumulating at the cathode, resulting in the highest concentration of copper at the cathode by electro-osmosis.
Moreover, under the function of the electric field, the water is electrolyzed and a large amount of hydroxide ions are released from the cathode, which generates the precipitation of copper hydroxide flocculant when it meets copper ions. In turn, this leads to the obstruction of cathode drainage and the accumulation of contaminants. Thus, the copper concentration at the cathode is higher for electro-osmosis.
The reaction equation is shown as follows:
For the vacuum method using the cathode direct discharge system, the cathode acts as a channel for the direct action of the vacuum and the cathode drainage is smoother. The contaminants are discharged from the anode with the water flow to the cathode, and the difference in the concentration of contaminants between the two levels is small. The vacuum electro-osmosis method has the advantages of both, with the best decontamination effect, and the concentration of contaminants at the cathode and anode is relatively close, which means the treatment effect is more uniform. Therefore, it is concluded that the adoption of the electro-osmosis method is capable of achieving the directional transport of contaminants and the partial discharge of contaminants combined with the vacuum method, which proves the feasibility of the integration of reduction and remediation by vacuum electro-osmosis method.
3.4. Analysis of Substance Composition
Figure 10 shows the change ratio of Na, Al, Si, and Ca at the cathode and the anode after the test. Its calculation formula is as follows:
The contents of Na, Al, and Si in the soil were reduced. As an active element, sodium plays a dominant role in electro-osmosis. Sodium ions are discharged from the soil with electro-osmosis flow, where the smallest percentage of sodium ions change in the contaminated soil, both at the anode and cathode. This partially attributes to the drainage volume of the contaminated soil being small. On the other hand, the contaminated sediment contains much more copper ions than sodium ions, which to some extent weakens the transport of sodium ions. Calcium in pollution-free soils, on the other hand, shows a significant increase after the test. This is due to the high initial calcium content of 1.52% in the soil. The saddle-shaped settlement is particularly prominent due to the reduction in pollution-free soil. The soil in the middle position is squeezed to the two sides, and the water accumulates in the middle, which in turn leads to the forced transport of calcium elements in the soil to the two sides. Moreover, the internal pH is weakly alkaline after the test, and calcium elements accumulated in the form of calcium hydroxide precipitation at both poles. As for the contaminated soil, due to the high content of copper ions, combined with a large number of hydroxide ions resulting in less precipitation of its calcium elements. Soil settlement and extrusion are not obvious, and calcium elements are mostly discharged from the soil with seepage. For aluminum and silicon, a significant difference can be found between the reduction in pollution-free and contaminated soils, and no increase in their content can be observed. The highest change ratios for aluminum and silicon in pollution-free soils are −54.3% and −42.6%, respectively, while the maximum in contaminated soils are −22.9% and −8.2%. The reason for this is both the higher copper content and the fact that the oxide forms of aluminum and silicon are more stable and less active inside the soil than the metallic and calcium elements. The aluminate and silicate are mostly dissolved in the pore water and discharged from the soil with the process of soil reduction, which in turn leads to the turbidity of the discharged liquid.
3.5. Analysis of Conductivity
Figure 11 shows the changes in the soil conductivity of pollution-free soil. The initial conductivity of the pollution-free soil is 281
S/cm. For the pollution-free soil, the conductivity of the middle position decreases the least, which is mainly because the anode moisture is transported to the cathode and discharged at the cathode, and after the cathode is blocked, the moisture is gathered in the middle. This is consistent with the law of moisture content, and the vacuum electro-osmosis has the most significant change of −103
S/cm, with an attenuation of 36.7%.
For pollution-free soil, the conductivity is principally influenced by moisture content. Based on the experimentally measured soil conductivity and moisture content,
Figure 12 is drawn. The vertical axis is the conductivity and the horizontal axis is the moisture content, and it can be found that the conductivity is positively correlated with the moisture content. The relationship can be fitted using a quadratic function, and the fitted expression is as follows:
where
is the soil conductivity without contaminants, and the unit is
S/cm.
is the soil moisture content, and the unit is %.
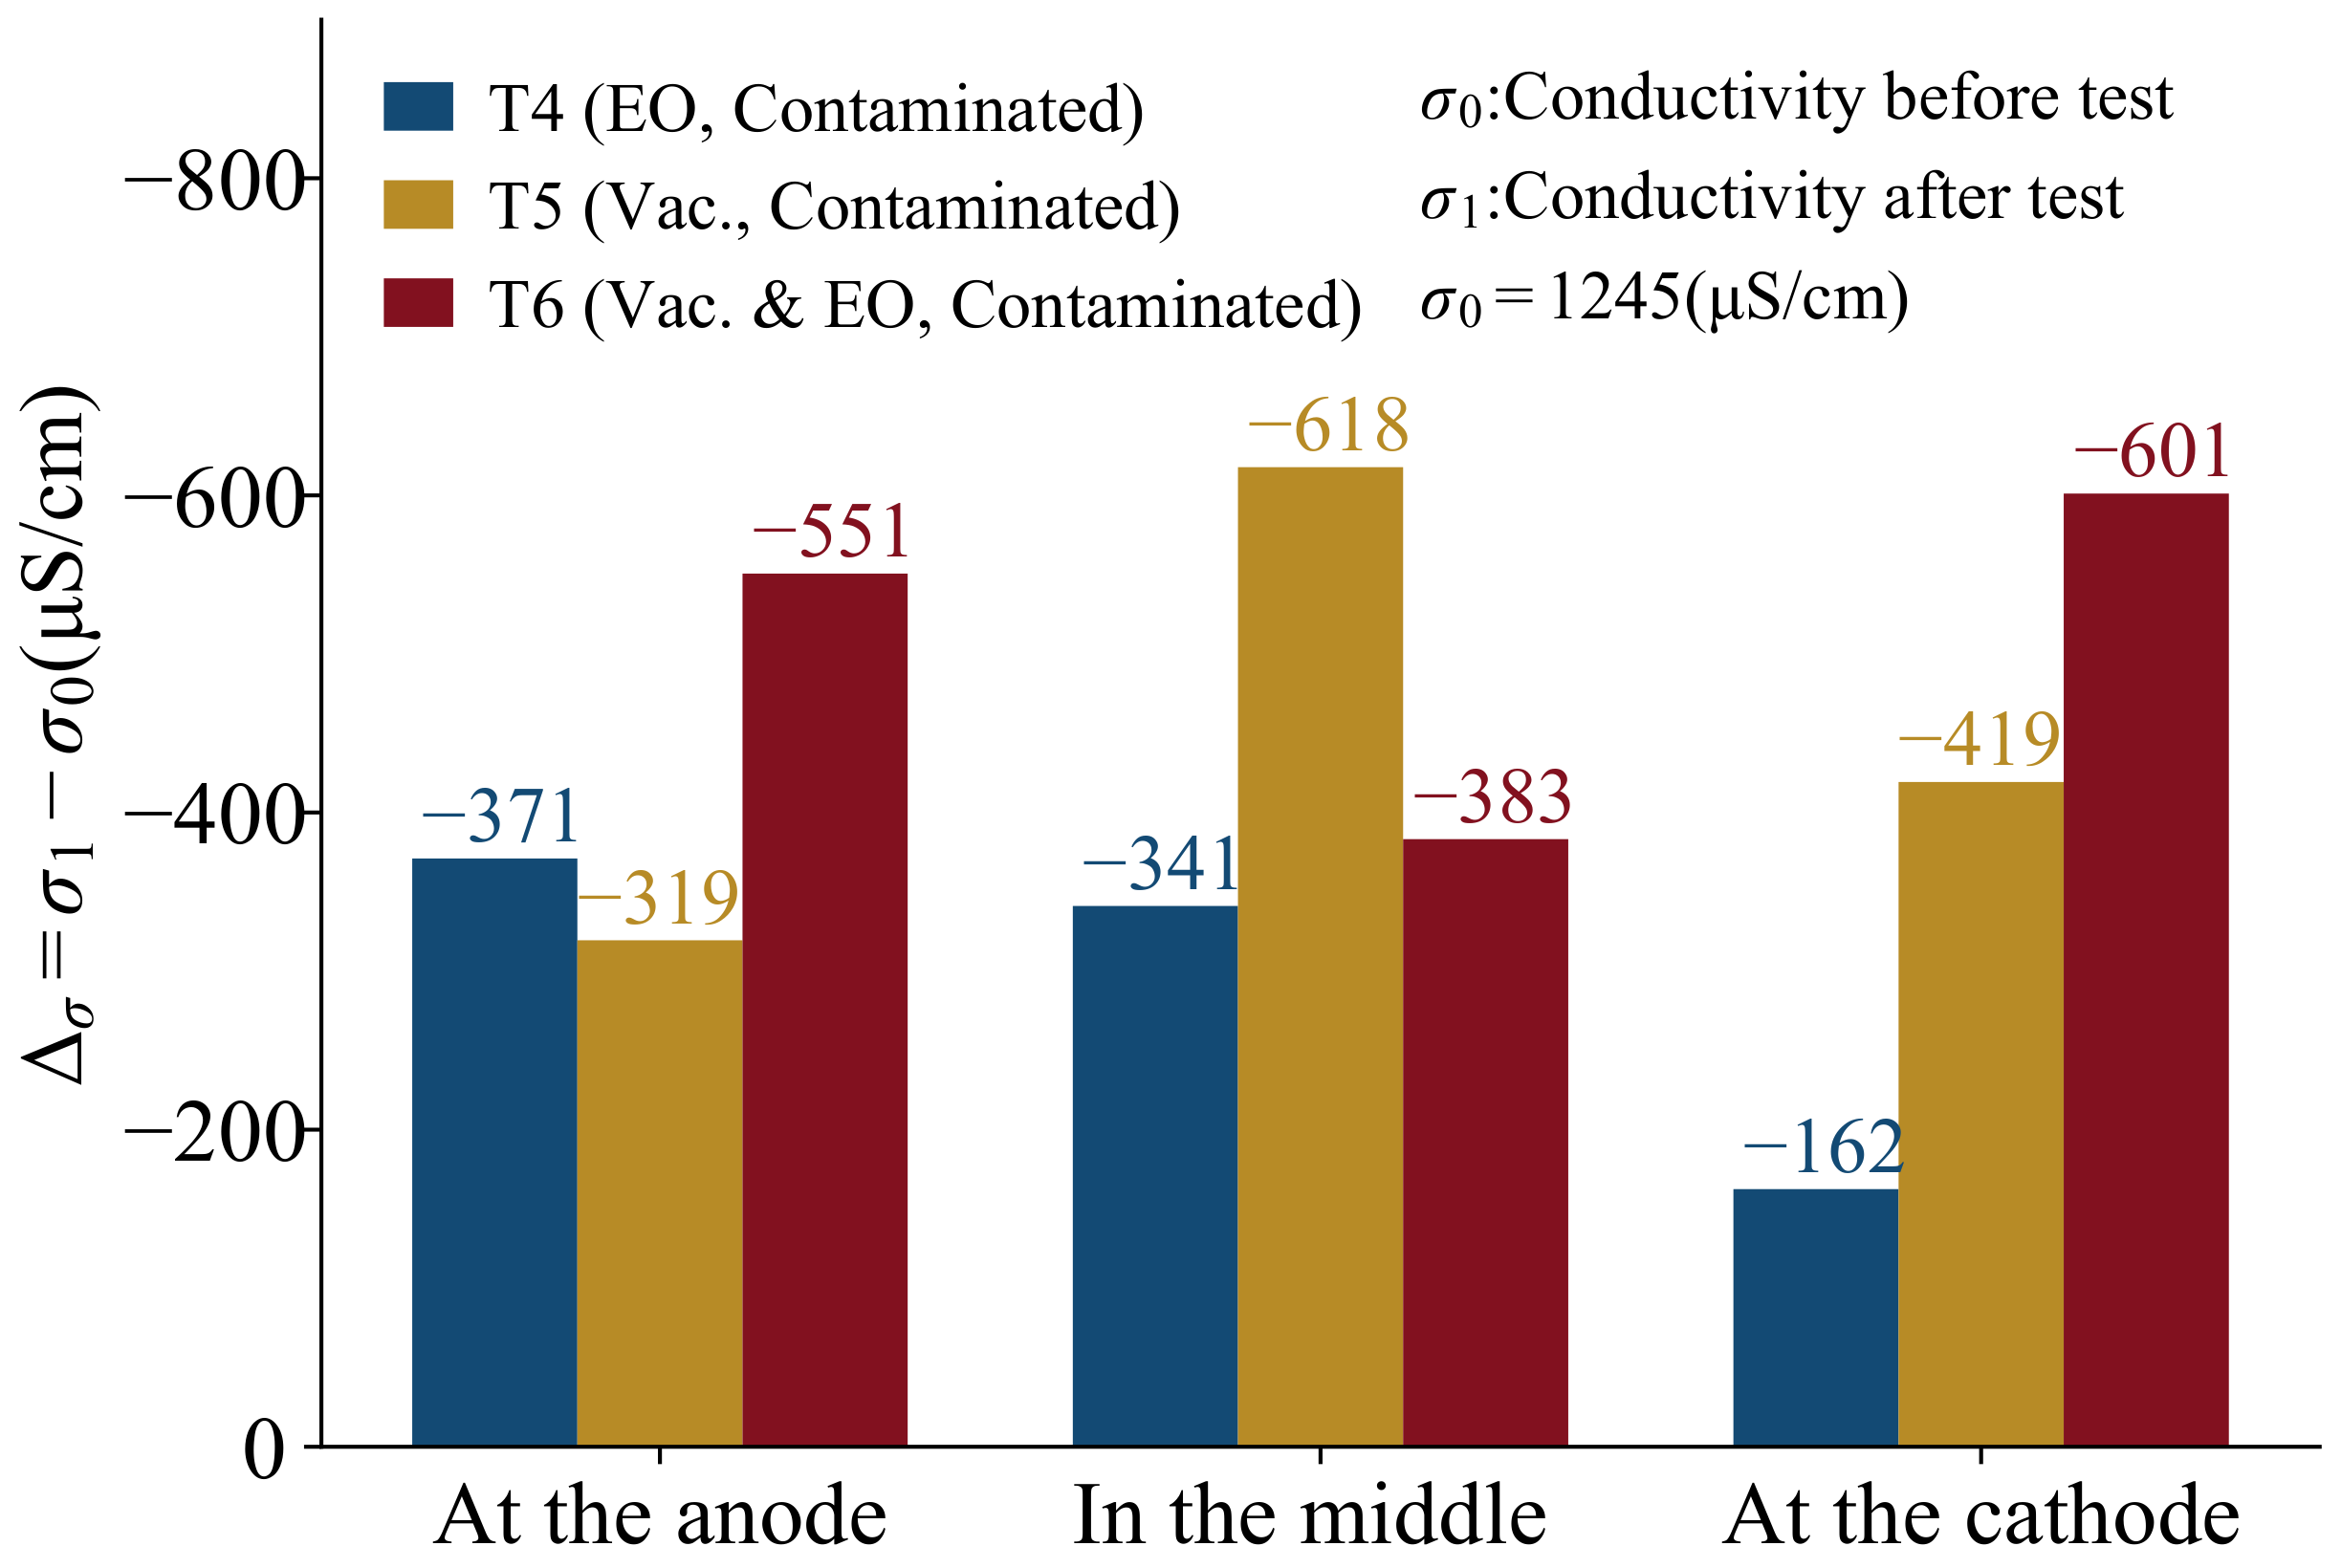
The initial conductivity of the contaminated soil is 1245
S/cm, which is 4.4 times higher than that of the pollution-free soil, as shown in
Figure 13. The presence of copper substantially improves the conductivity of the soil, and for contaminated soils, the change in the amount of soil conductivity is more uniform at the three locations. On the one hand, the difference in moisture content in the three locations is not significant. On the other hand, the accumulation of copper ions in the middle location also further increases the conductivity of the middle location. Thus, the conductivity of the three places tends to be even. Overall, the attenuation of the vacuum electro-osmosis method is still the largest, with a maximum attenuation of −601
S/cm, which is nearly 48.3%.
It also indicates that the conductivity of the contaminated soil is more attenuated by the migration of copper ions. For the electro-osmosis method, the conductivity attenuates more at the anode and the vacuum method attenuates more at the cathode, which is consistent with the variation pattern of copper content. Consequently, for contaminated soils, the soil conductivity is influenced by both the moisture content and the concentration of copper ions in the soil. Hence, based on the relationship between conductivity and moisture content under pollution-free conditions and the experimentally measured copper concentration, the effect of copper ion concentration is considered and the relationship between conductivity and copper ion concentration is drawn in
Figure 14. Obviously, the measured conductivity is approximately linear with copper concentration, and the equation is as follows:
where
and
are the soil conductivity with and without contaminants, respectively, and the unit is
S/cm.
is the soil moisture content, and the unit is %.
is the soil copper concentration, and the unit is mg/kg.
The above equation establishes the relationship between copper concentration, conductivity, and moisture content. Usually, it is difficult to measure the concentration of copper contaminants inside the soil in real time in practical projects. Based on the above formula, the dynamic prediction of the concentration of contaminants can be calculated based on the changes of real-time conductivity and moisture content inside the soil. The conductivity may be calculated from the measured potential current of the soil, and the equation is as follows:
Therefore, the calculated equation for the copper contaminant concentration
in the soil is as follows:
where
is the soil conductivity, and the unit is
S/cm; where
l is the spacing of the potential measurement points, and the unit is m; where
I is the current in the electric circuit, and the unit is A; where
a,
b are the length and width of the soil cross-section, and the unit is m; where
V is the potential difference between the potential measurement points, and the unit is V.
3.6. Analysis of Current and Potential
As stated before, the electric field plays a key role in the integration of reduction and remediation. Therefore, the potential and current are analyzed for groups T1, T3, T4, and T6 to understand the changes in the electrical parameters of Cu-contaminated and pollution-free soils and to assess the benefits of their integrated decontamination.
Figure 15 presents the change curve of current with time under electro-osmosis and vacuum electro-osmosis tests. All four groups show a trend of rapid decline followed by a slow decline. The current fitting equations are obtained for the four groups of tests based on exponential function-fitting as follows:
The fitted R-squares are 0.970, 0.987, 0.983, and 0.993, respectively, indicating that the current shows a significant exponential decay trend. The initial current is larger in the first period, and the initial values for T3 and T6 are 0.34 A and 0.36 A under vacuum electro-osmosis methods. While the initial values for T1 and T4 are 0.12 A and 0.25 A under electro-osmosis method. First, a more significant improvement in the current occurred in the process of vacuum electro-osmosis in comparison to the process of electro-osmosis, which is consistent with the law of drainage. It is demonstrated that for different methods, the improvement of the current brings an intuitive influence on the discharge capacity. Secondly, the initial current in the contaminated soil also increased compared to that in pollution-free, indicating that copper ions enhanced the conductivity of the soil. However, it does not lead to a larger volume of drained water of the contaminated soil, thus the effect of the presence of contaminants on the volume of drained water is underestimated in the magnitude of the current.
Combined with the amount of change in current, for pollution-free soil, the current attenuation is 0.09 A for T1 and 0.29 A for T3. The attenuation of current is related to both electro-osmosis and vacuum, and is strongly influenced by the moisture content of the soil. For contaminated soil, the current attenuation is 0.22 A for T4 and 0.23 A for T6, and the current attenuation is less correlated with vacuum than with electro-osmosis. It is mainly attributed to the fact that the conductivity of contaminated soil is primarily influenced by the copper ion content. Copper ions in the electric field are under the functions of both electro-osmosis and electro-migration; thus, the conductivity changes with the change in ion concentration. Moreover, the current attenuation of electro-osmosis for contaminated soil is much larger than that for polluted soil, indicating that the effect of electro-migration is greater than that of electro-osmosis drainage for copper ions.
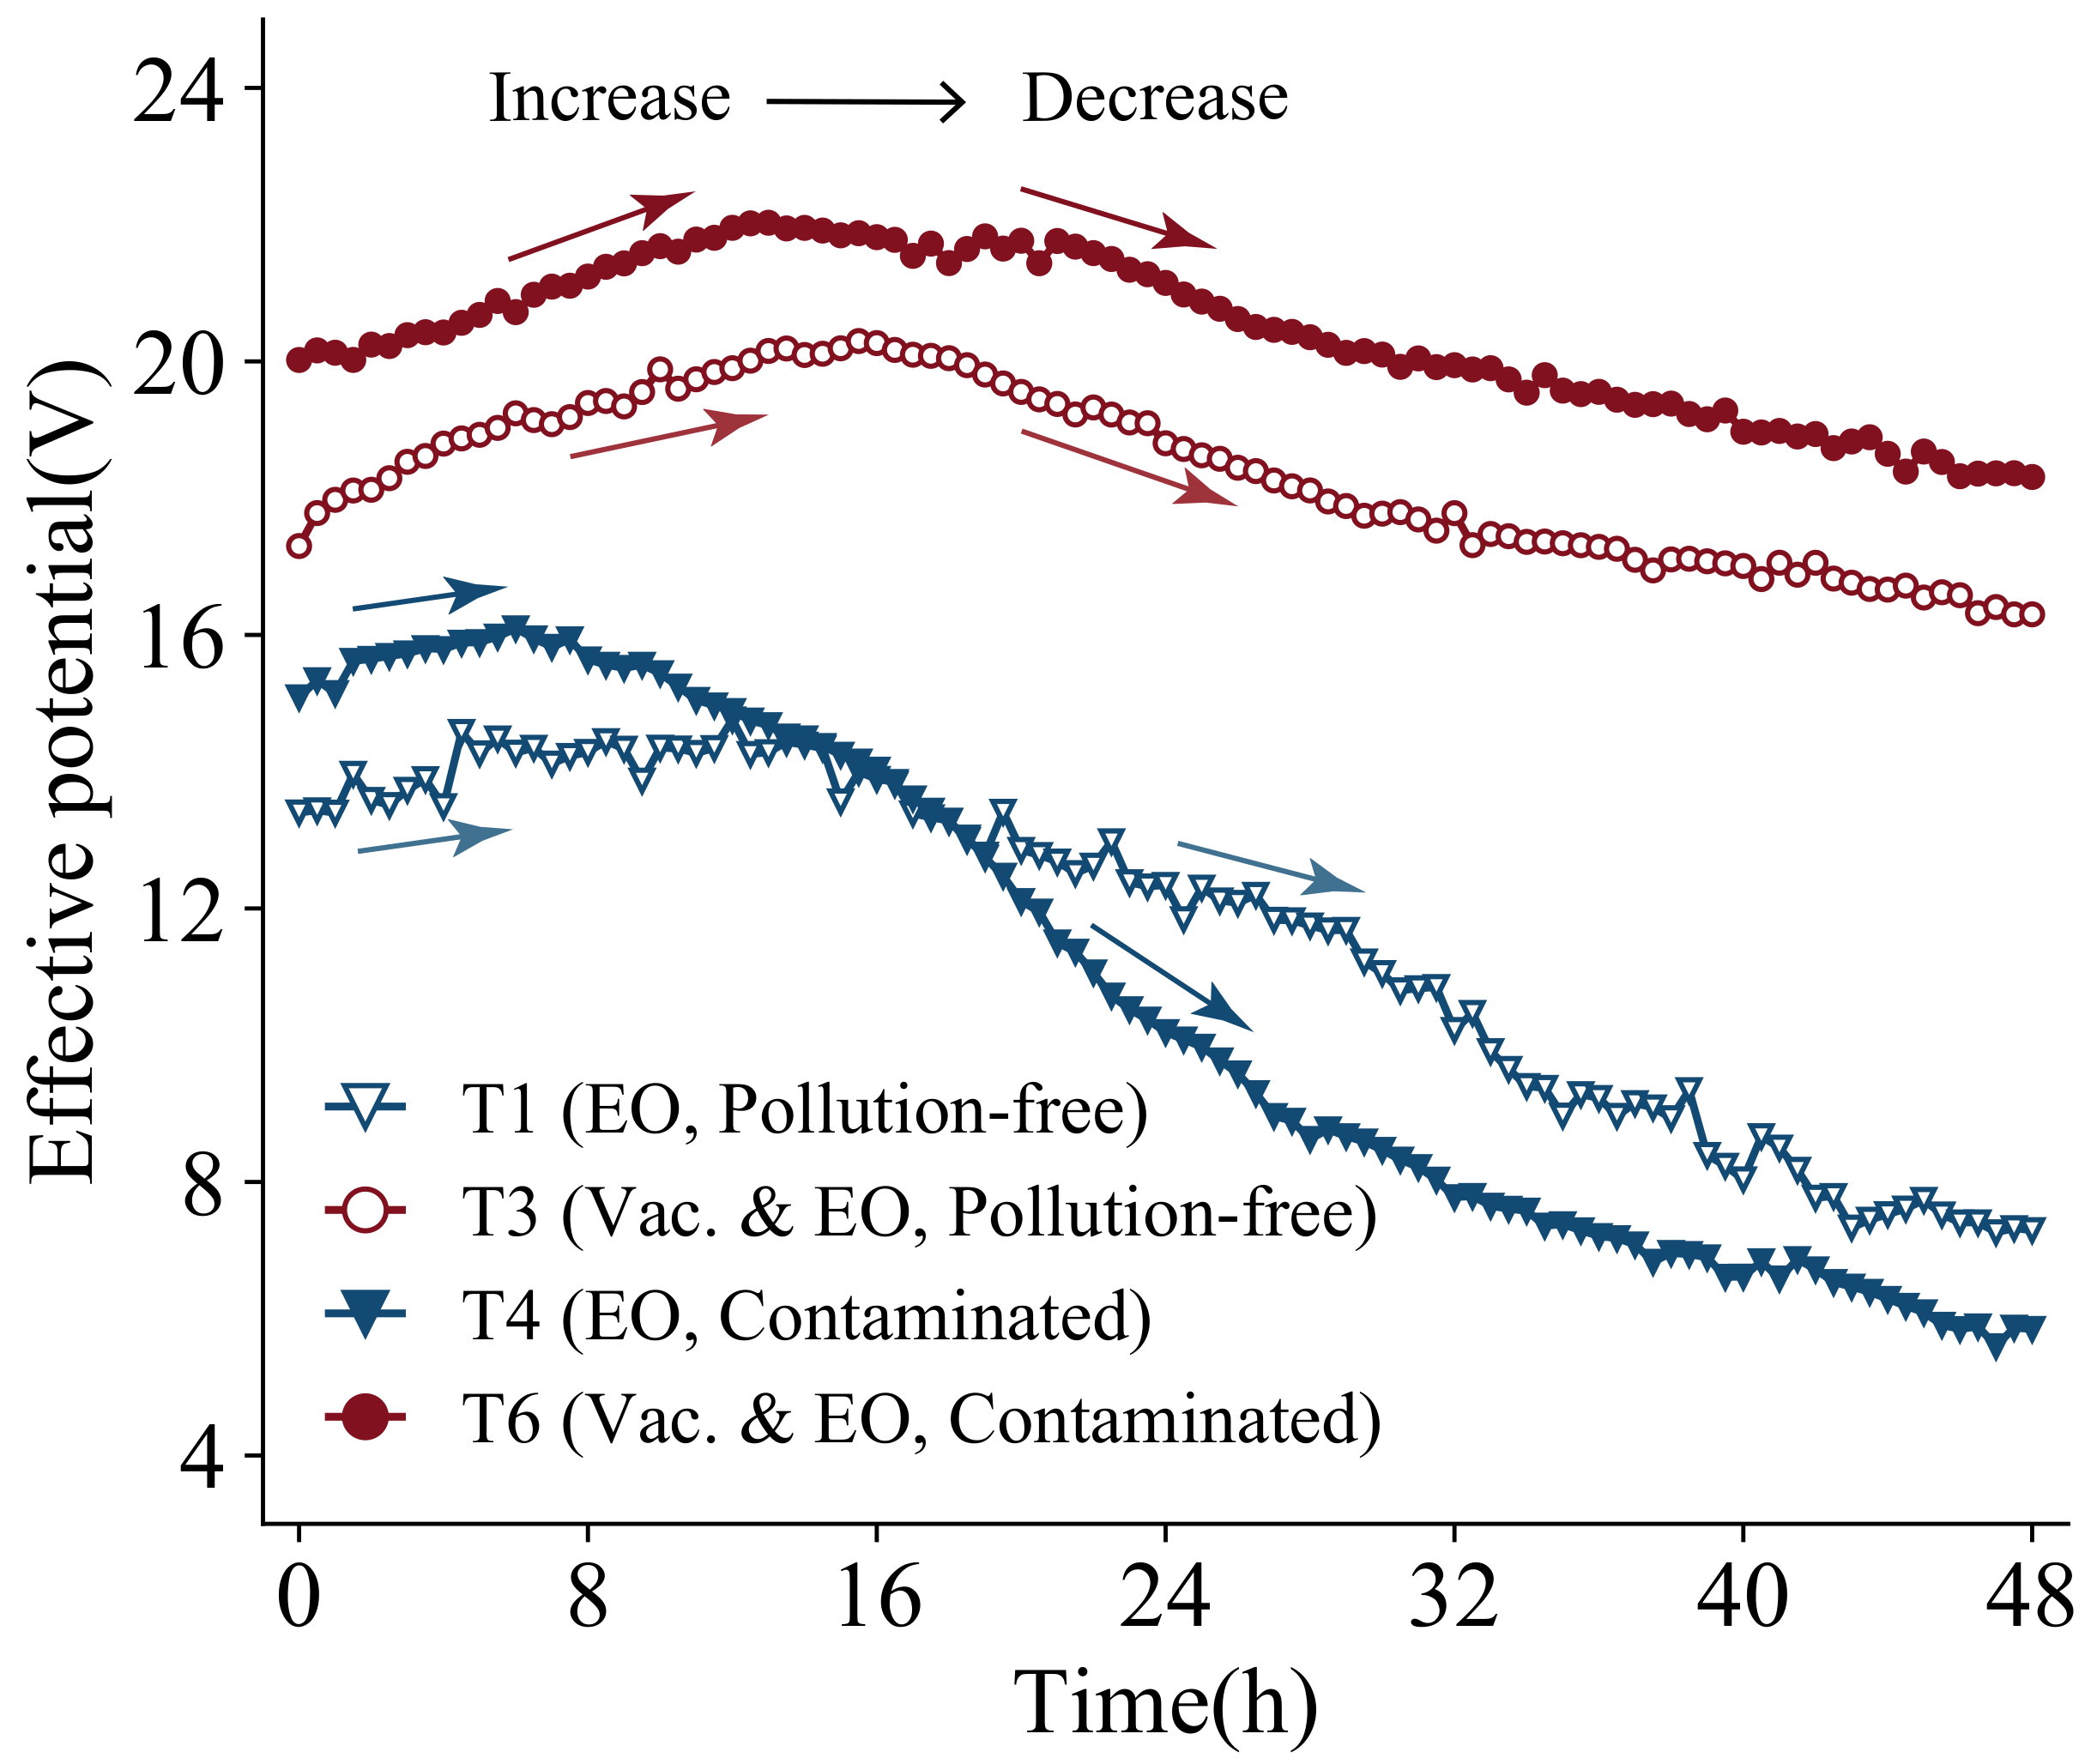
Figure 16 shows the change curve of effective potential with time for groups T1, T3, T4, and T6. The applied voltage of this test is 30 V, and due to the existence of interfacial resistance between the electrode and the soil, the potential reachiing the soil body will be discounted. The actual potential on both sides of the soil is the effective potential. As can be seen from the figure, the four groups of effective potentials show increasing and then decreasing trends. It is probably due to the fact that at the early stage of treatment, the soil is compressed and the volume becomes smaller. The drainage board is in close contact with the soil, the contact resistance becomes smaller and, thus, the effective potential of the soil increases slowly. Afterward, the moisture content of the soil near the anode decreases significantly. The soil dries, cracks, and detaches from the anode drainage board. The interface resistance becomes larger and the effective potential decreases rapidly. The effective potential of T1 and T4 electro-osmosis tests decreases significantly. While T3 and T6 vacuum electro-osmosis tests limit the development of cracks at the anode board due to the vacuum pressure, the loss of potential is not as large in comparison. The effective potential of T4-contaminated soil decreases the most, which also proves that the treatment effect of contaminated soil decreases rapidly with time under the function of the electric field. Even though the initial values of electric field parameters tend to be larger than those of pollution-free soil due to the presence of a large number of copper ions, the discharge is not necessarily better.
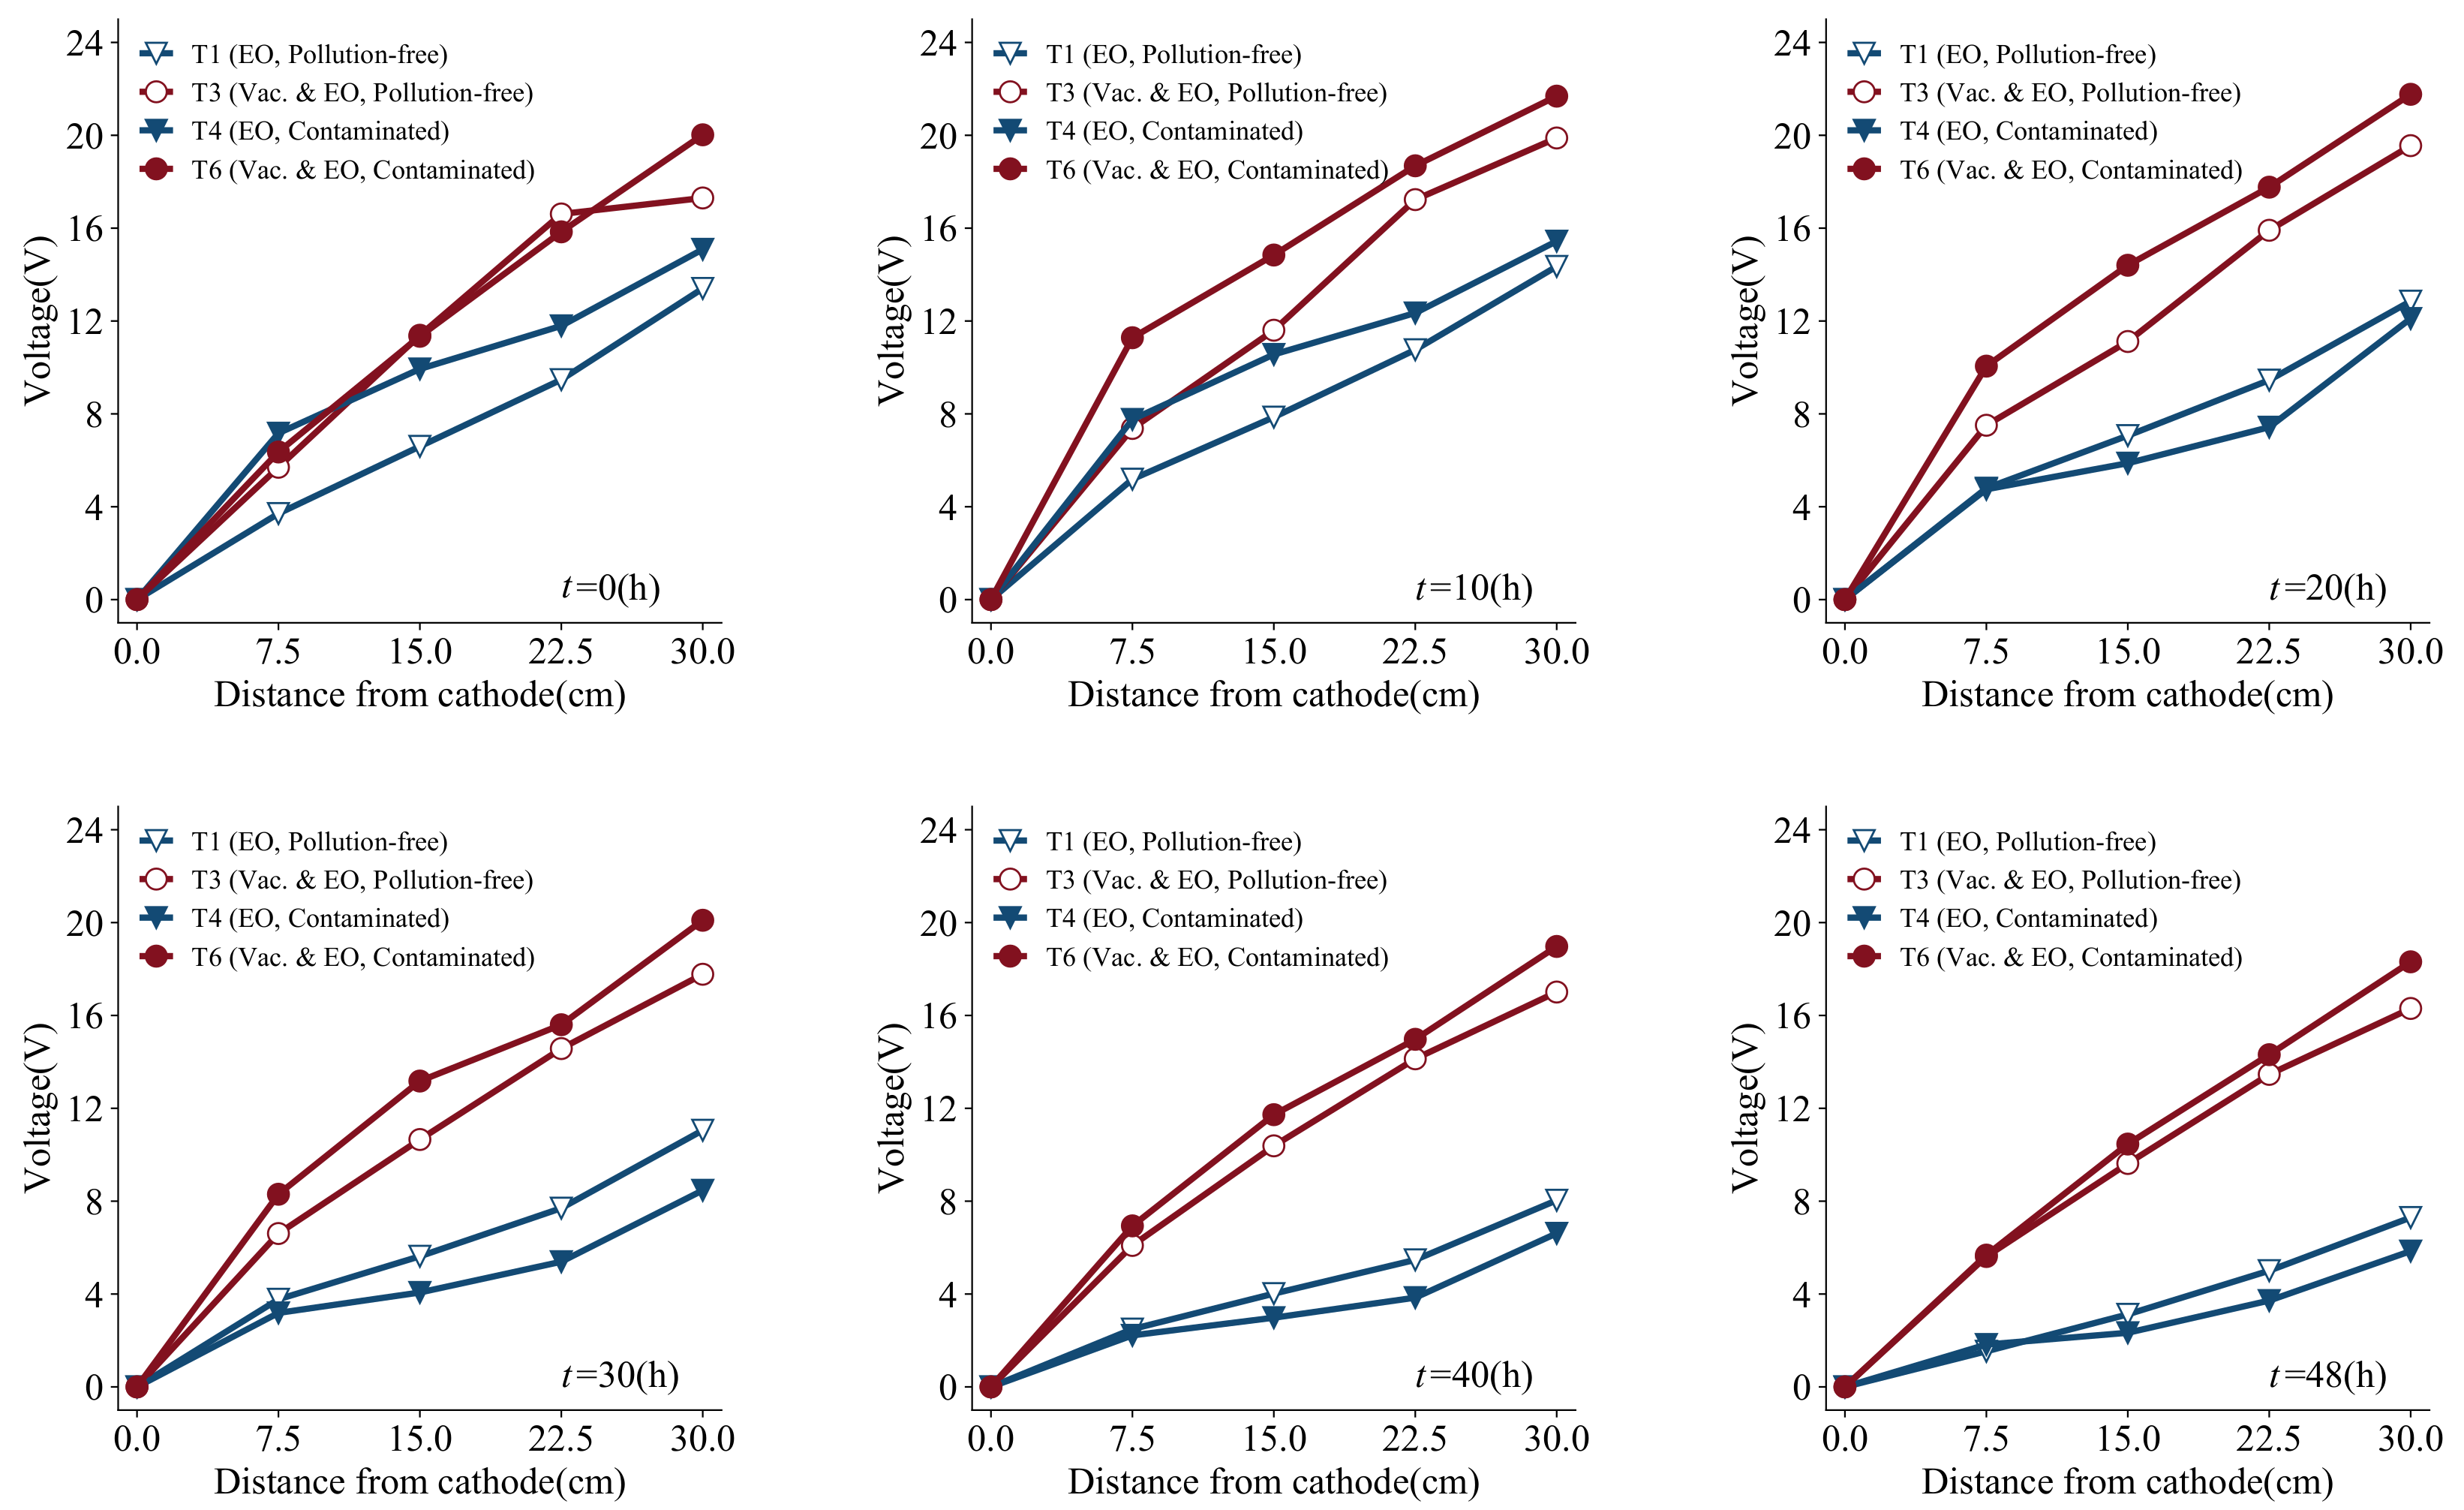
Figure 17 shows the potential distribution of the soil at different timse, and The horizontal coordinate is the distance from the cathode. From the figure, it can be seen that the potential distribution is approximately linear and uniform at the beginning, indicating that the internal resistance of the soil is uniformly distributed. At the later stage, the loss of potential near the anode is greater, and the linear characteristics of the potential distribution inside the soil weaken, indicating that the resistance distribution inside the soil is no longer uniform. Since the water is transported from the anode to the cathode under the function of the electric field and is drained from the single side of the cathode, the water inside the soil body is no longer uniformly distributed, resulting in no longer uniformly distributed resistance. In the case of contaminated soils, the copper ions move both with the water transport and under electro-migration. The rearrangement of copper ions makes the conductivity inside the soil vary, and the development of internal cracks also makes the potential distribution inside the soil less uniform. Compared with T1, T3 or T4, and T6, the uniformity of potential distribution brought by single electro-osmosis is worse than that of vacuum electro-osmosis, under which the cracks are less developed and the uniformity of potential distribution is better. While comparing the case with and without contaminants, it can be seen that—for vacuum electro-osmosis—the difference between the two is minor. However, for electro-osmosis, the potential distribution of the contaminated soil is more inhomogeneous than that of pollution-free soil. This is consistent with the law of current, the electric parameters of the contaminated soil are more influenced by the effect of electro-migration.
4. Conclusions
In this study, based on a detachable vacuum electro-osmotic indoor model experiment system, dredged sediment from Tai Lake was used to conduct vacuum, electro-osmosis, and vacuum electro-osmosis reduction, and remediation experiments with and without copper contamination. The experimental rules are summarized in three dimensions: reduction (drainage, moisture content, strength, settlement, and cracks), remediation (contaminant concentration, substance composition, and electrical conductivity), electrodynamic characteristics, and electrical energy losses (current and potential). The operating properties of vacuum and electro-osmosis under the integrated conditions of reduction and remediation were illustrated, and the interaction between reduction and remediation was characteristically analyzed. Furthermore, under this circumstance, considering the difficulty of contaminant concentration determination, a prediction model of contaminant concentration based on conductivity and moisture content was given.
The following conclusions are specifically drawn:
For different methods, regardless of the sediment with or without copper, the law of reduction is similar, and the effect of vacuum electro-osmosis is optimal. However, the copper in the contaminated sediment will generate precipitation to block the sediment pore space during the treatment process, which in turn leads to the effect of reduction on contaminated sediment being worse than that on the pollution-free sediment with the counterpart method. The contaminants have the most significant effect on the electro-osmosis method, indicating that the applied electric field is the main reason for the precipitation.
The electric field enables the directional migration of copper contaminants from the anode to the cathode, while the vacuuming at the cathode facilitates the discharge of copper ions from the cathode position. Vacuum electro-osmosis can accomplish the migration and discharge of copper contaminants by combining the benefits of both methods. The removal rate at the anode can reach 45.1% and the removal rate at the cathode can reach 50.0%. After the test, the content of sodium, aluminum, and silicon underwent different degrees of reduction. Sodium plays a critical part in both electro-osmosis and electro-migration, while calcium and copper are more preferable to aluminum and silicon for the formation of precipitates.
The presence of copper ions in the contaminated sediment improves the electrodynamic properties of the sediment. The conductivity of dredged sediment is strongly related to the moisture content and contaminant concentration. Based on the relationship between conductivity and moisture content of pollution-free soil, the correlation equation of conductivity with moisture content and contaminant concentration is established by considering the contaminant concentration correction. This equation can be applied to predict the dynamic changes in copper contaminant concentrations under reduction and remediation conditions.
Electro-migration is the dominant factor in governing the remediation process. Nevertheless, the reduction will lead to a decrease in sediment moisture content, which will influence the electric field distribution of the sediment and weaken the remediation effect. The current in the sediment attenuates exponentially, whereas the effective potential rises transiently and then falls rapidly. Although the electrical parameters of contaminated sediment may be better, the sediment is susceptible to precipitation due to the alkaline environment. For the single electro-osmosis method, the electrodynamic parameters attenuate more rapidly and the inhomogeneity of electric field distribution is more obvious, which affects the effect of reduction and remediation.
5. Discussion
The object of this study is the reduction and remediation of dredged sediment. Reduction refers to the dewatering and drying of the sediment to reduce its moisture content while making it smaller in volume and occupying less space when placed in a yard. Remediation refers to reducing the contaminant content of the contaminated sediment so that it no longer poses a continuing environmental hazard when placed in a yard. The conclusions of this study demonstrate the possibility to carry out reduction and remediation simultaneously, but there are still some issues that deserve to be discussed.
First, the occurrence of blockage during vacuum electro-osmosis treatment may affect the transfer of vacuum pressure inside the soil samples [
8]. Due to the limitation of the test conditions, the vacuum degree is not measured in this study. Changes in vacuum degree may affect the treatment of vacuum electro-osmosis, and an analysis of the vacuum degree can also evaluate the reduction effect. Moreover, the composition of the blockage substances varies with the composition of the contaminants. The conclusions obtained in this study are only applicable to Cu-contaminated dredged sediment.
On the other hand, pH is also one of the main causes of precipitation, and the real-time change in pH can also predict the electrochemical reaction inside the soil, and the simultaneous reduction and remediation will inevitably affect the distribution of pH. Since this study focuses on the interaction between the two, the real time change of pH of the soil is not analyzed, but this does not mean that pH has no effect on vacuum electro-osmosis [
25].
In addition, this study focuses only on the copper content of the soil before and after treatment and, thus, the copper content of the soil after the test is measured to obtain the copper removal rate. However, most of the removed copper is left in the discharged water. In this research, the contaminant content in the discharge water was not measured, and no further treatment was done. Copper ions in water samples can also cause secondary pollution to the environment if they are not treated properly [
26]. How the contaminants are further treated after discharge from the soil can still be further refined.
Lastly, the presence of copper ions greatly improves the electrical conductivity of the soil, while the presence of other contaminants does not necessarily do so. The electrochemical reactions occurring within the soil are also different, and the integration of reduction and remediation under other pollutant conditions is still to be explored. Due to the limitation of cost, microscopic tests on the soil were not conducted in this study. Because of the electrochemical reactions occurring inside the soil, more changes may occur in the microstructure of the soil, and the analysis of the reduction and remediation from the microscopic level is also a worthy direction for future research.


