Abstract
The digitalization of music has led to increased availability of music globally, and this spread has further raised the possibility of plagiarism. Numerous methods have been proposed to analyze the similarity between two pieces of music. However, these traditional methods are either focused on good processing speed at the expense of accuracy or they are not able to properly identify the correct features and the related feature weights needed for achieving accurate comparison results. Therefore, to overcome these issues, we introduce a novel model for detecting plagiarism between two given pieces of music. The model does this with a focus on the accuracy of the similarity comparison. In this paper, we make the following three contributions. First, we propose the use of provenance data along with musical data to improve the accuracy of the model’s similarity comparison results. Second, we propose a deep learning-based method to classify the similarity level of a given pair of songs. Finally, using linear regression, we find the optimized weights of extracted features following the ground truth data provided by music experts. We used the main dataset, containing 3800 pieces of music, to evaluate the proposed method’s accuracy; we also developed several additional datasets with their own established ground truths. The experimental results show that our method, which we call ‘TruMuzic’, improves the overall accuracy of music similarity comparison by 10% compared to the other state-of-the-art methods from recent literature.
1. Introduction
Music plagiarism refers to the illicit copying or close imitation of another musician’s composition. It is the fundamental cause of enormous losses in revenue for original artists in the music industry. Moreover, with the rise of social media platforms such as YouTube and Soundcloud, plagiarism accusations have also become more prevalent. These social platforms allow users to comment on the piece of music, this is where terms and phrases describing plagiarism accusations are often formulated. There is a constant stream of these, often in the form of click-bait lists. The number of accusations appearing only in the US more than doubled from 2010–2019 compared to 2000–2009. Fink et al. [1] claimed that the loss of sales from the U.S. economy was approximately 58 billion USD a year. This also resulted in the loss of 373,000 jobs, and the resulting loss of revenue from those jobs amounted to an additional 16.3 billion USD. Furthermore, tax collection was reduced by 2.6 billion USD. Another report, “Innovation Policy and the Economy” [2], claims that global music sales have decreased from 40 billion USD in 1995–1996 to 15 billion USD in 2014 due to music plagiarism. Moreover, there are other issues such as stealing musical ideas, not crediting the original contributors, and false accusations that need to be addressed by the music industry, for example, Bruno Mars, had six separate accusers that his song “Uptown funk” was plagiarized [3]. All this means that the classification of similarity, which refers to the degree of plagiarism between two songs, is a critical issue, since knowing how similar two songs are help in discerning intentional copies from unintentional copies. To resolve these issues, several organizations function as bridges by offering a platform for artists and other businesses to interact and secure their work concerning the relevant copyright laws. The ASCAP (American Society of Composers, Authors, and Publishers), which is a world leader in performing rights and advocacy for music creators, reported higher domestic revenues of 1.27 billion USD in 2019, a 47 million USD increase over 2018. Other organizations that are similar to ASCAP, such as SACEM (Society of Authors, Composers, Editors, and Musicians) and BMI (Broadcast Music Incorporation), work in their own countries and regions, performing similar roles. One of the main aims of these organizations is to help in the decision-making process once complaints about plagiarism surface. Music plagiarism cases sometimes end in voluntary, out-of-court settlements. However, these settlements are not usually guaranteed to be successful for the artist that has been copied due to the different dynamics involved in monopoly negotiations. In addition, the long delay between the original accusation judgment is also a critical issue, even in successful ASCAP, SACEM, or volunteer settlements [3]. Nevertheless, a substantial number of songs have been copied, and this malpractice continues at a fast pace. Detecting plagiarism is a challenging task. For instance, in 2004, SACEM was only able to verify 18,000 out of 250,000 registered complaints [4]. Unfortunately, with the increasing number of plagiarism cases, this gap is only getting wider every year.
In the past two decades, the music industry has witnessed several technological advancements that directly or indirectly contribute to music plagiarism. First, the digitalization and compression techniques used for storing, processing, collecting, and querying music make listening to music vastly more affordable and accessible. Discogs is a crowdfunded database that offers 1.5 billion tracks [5]. While other music databases or services, such as YouTube or SoundCloud also provide easy access to a vast amount of music. Second, the influx of software-based music editing tools over recent years has allowed musicians (even novices) to customize original pieces of music that many then go on to claim as their own unique work. Third, high-speed internet and progress with music-related middleware tools have improved the accessibility of music around the world while also speeding up composers’ workflows. The current global accessibility of music, which has been facilitated by these advances, is among the fundamental reasons that have contributed to the growth of the music business. However, these advances also raise significant challenges for the music industry regarding music plagiarism. Novel methods and tools are needed to efficiently and transparently measure indications of plagiarism. Typically, when music plagiarism cases are brought to court, they often ask music experts and musicologists to analyze the similarities between two songs, the final judgments then rely entirely on whose subjective opinion of the court fact-finders choose to believe. Plagiarism claims are very challenging to verify because music experts are not reliable, especially as they are being paid by each side to support their case, and with the thousands of cases being registered, it is not practically feasible to recruit the enormous numbers of unbiased music experts needed. Hence, a technical tool for music similarity analysis between two songs can play the vital role of a scientific reference for decision-making, speeding up the analysis process, and assisting in faster judgments being made. Therefore, a computer-based approach to musical similarity comparisons is needed to detect plagiarism efficiently.
Thus far, various similarity approaches have been applied to music retrieval techniques. However, few pieces of research have addressed detecting when music has been copied, including [6,7,8], respectively. Due to the limitations of the current state-of-the-art methods, the accuracy of the comparison results is often limited. Existing similarity models also find it challenging to address another issue: computing the degree of plagiarism present. In real-world music comparison, it is not enough to just determine if a song is similar to another one, we must also know how similar it is (using a score/measure), to help determine if the similarity is intentional or not. In addition to straight plagiarism, there is another issue of stealing from coworkers or not giving them proper credit. In their paper, Cameron et al. [3] raised the question of how to determine the various contributions from each member of a music group. The research objectives of this work are as follows:
- To develop a solution that allows users to accurately compare two pieces of music, with accuracy being the main goal of the model above other considerations.
- Use a provenance-based approach, which can further help to identify the source’s trustworthiness and determine the contribution of a musician or a group of musicians to a piece of music.
- To find a deep learning-based solution that learns from expert knowledge regarding similarity comparison and then classifies the similarity level of any two given songs.
- To compare the similarity among the various musical features, our model identifies the given pieces of music and also discovers the right weights for those features.
Our provenance-based method focuses on the origin of the music as well as the authenticity of the sources. Provenance, when it comes to music data, provides authentic information about the history of the musical piece and its composer. This information improves the overall accuracy of our process and helps the model identify plagiarism without hesitation or long deliberation.
In this paper, we present a novel music plagiarism detection approach called TruMuzic that exploits provenance information in music as well as the music content itself. Music theory states that there are weak and strong beat positions in musical composition [9]. Music plagiarism detection is a complicated issue; plagiarism should not only be judged in quantitative terms but also be looked at from a qualitative point of view. For example, n copied notes in the middle of a song do not have the same impact as the same number of copied notes at the beginning of the song. Most similarity comparison methods fail to properly address this issue as they merely compare the overall amount or degree of similar notes. Therefore, we present a theme-based comparison method, where notes are stored in smaller musical units called “phrases”. These phrases can be compared and weighed individually or all together based on their overall similarity scores. We can then generate our final similarity scores based on a combination of both. The final similarity score for two sets of musical notes depends on three things: (1) the frequency of copied notes, (2) the location of those copied notes, and (3) the overall percentage of the copied notes. In addition, the scores generated can also be influenced by comparing pitch, census, and provenance data. TruMuzic works as follows, it computes the similarity between two pieces of music based on four types of data: musical notes, pitch, census, and provenance data. We then compare two pieces of music looking for similarities, and this results in generating a similarity score. Our simple mulitilayer model with five nodes uses a deep learning-based method to weigh the importance of these four individual data types. These weights can be adjusted to further improve the model’s overall precision when giving a similarity score.
We developed a comprehensive framework that uses a combination of musical and provenance data to evaluate the similarity between two given pieces of music. The fundamental notion behind data provenance is the process of tracing and recording the origins and development path of the musical data. This recorded data can be applied as an additional tool for evaluating the trustworthiness of a given piece of data [10]. We also use a 12-tone composition comparison method on the notes in the songs being evaluated, this eliminates the possibility of ignoring similar notes during the comparison. Another issue with evaluating the accuracy of any similarity measurement model is developing a ground truth dataset to serve as the basis for making similarity comparisons. To evaluate comparison methods, we first establish the ground truth with the help of music experts, this ground truth then serves as training data for our deep learning-based weight distribution model. Next, in this paper, we compare TruMuzic with other state-of-the-art (SOTA) music similarity comparison methods for recent and established research [9,11,12,13,14,15]. Experimental analysis shows that our model is better at making similarity evaluations, by 10% in terms of overall accuracy, compared to the existing SOTA models. We summarize the contributions of our work as follows.
- We introduce TruMuzic, a deep learning-based music similarity comparison model that computes the similarity scores between any two given pieces of music based on several data types (musical properties).
- We present the significance of using provenance data in making music similarity comparisons.
- An extensive evaluation of the performance of TruMuzic was performed to look into the importance of the various calculated musical features.
- We also evaluate the overall accuracy and efficiency of our model compared to other traditional and SOTA methods.
The rest of this paper is organized as follows: Section 2 presents related work along with the history and evaluation of music information retrieval (MIR), music plagiarism, and data provenance. Section 3 describes the basic concepts and working mechanisms of our model. It also explains the proposed model’s similarity score generation for both musical sources and musical data. Section 4 presents the experimental results of our research, while in Section 5, we discuss the results achieved by our model. Finally, we conclude the paper in Section 6.
2. Related Work
This research work combines various technologies and musical concepts. Hence, in this section, we will cover all these areas and discuss their specific aspects that relate to music. We classify the related work into 3 Sections; first, in Section 2.1, we describe the music plagiarism detection works, while in Section 2.2, we discuss data provenance-based trust evaluation methods. In Section 2.3, we describe how deep learning-based music similarity comparison research works. Finally, in the concluding part of this section, we present the distinctive attributes of our model in comparison to existing works. Moreover, we address a pertinent query: can the aforementioned related methodologies effectively incorporate our dataset for the purpose of similarity analysis?
Music similarity comparison models use a wide variety of approaches for measuring the distance between given pieces of music. These approaches often comprise both the selection of musical features and the choice of an appropriate distance function. Generally, the similarity methods used can be put into one of two broad categories: (1) note-based and (2) frame-based methods. The following describes a more granular categorization of the various approaches used in this problem: (1) string matching approach, (2) geometric approach, (3) n-gram-based approach, (4) ground truth-based approach, (5) probability-based similarity, and (6) hybrid approach [16]. Recently, many research works, including those by Son et al. [17], and Buckers et al. [18], have again addressed MIR. However, most of the research work on MIR in recent times has been based on deep learning, as we will explore in Section 2.3.
2.1. Music Plagiarism Detection
Music plagiarism is the process of presenting another musician’s work as your own. According to Keyt et al. [19], the basic framework of a plagiarism lawsuit requires proving three elements. First, whether a valid copyright protects the piece of music. Second, whether the piece of music is “copied” or not. Third, whether the copying can be considered beyond the question of coincidence. From a technical point of view, a reliable music plagiarism detection framework makes it possible to prove the second and third elements from above, as it makes it possible to confirm whether a piece of music has been copied and to what degree. According to Dittmar et al. [6], music plagiarism can be further categorized into three subcategories. The first is sampling plagiarism, which refers to the reuse of a small part of a previously recorded piece of music [20]. In other words, sampling creates a “song within a song.” To use these samples in new, original pieces of music, the samples are manipulated in pitch or tempo, mixed with additional instruments, or rearranged in a loop with cropped portions, taking the new piece beyond recognition of the original from which the sample was taken. The second is rhythm plagiarism, which refers to the copying of a piece of music but making modifications to the original rhythm. In other words, it focuses on adjustments in the periodic pattern of beats in the various frequency bands. There has not been much work done on rhythmic plagiarism, but some researchers, such as Paulus et al. [21] and Foote et al. [22], have presented rhythmic similarity, estimation models. The third is melody plagiarism, which is a gray area, where similarity comparisons are challenging. A melody can be considered copied, even if it is transformed into another key, slowed down, or sped up in tempo. Muller et al. [23] have presented solutions for melody plagiarism detection techniques.
Another approach for music plagiarism detection is called the “visualization approach,” where the goal is to translate two pieces of music’s similarity into visual terms [15]. Similarly, graph-based representations have been created, but generally for the readability and effectiveness of nodes, for example [15,24]. In the paper by Muelder et al. [25], the authors presented a graph-based visual interface for exploring a library of music, where the music content was analyzed rather than the tag information. In the graph, each node represents a song, and the connection between nodes is weighted according to a Fourier Transform-based similarity measure. Furthermore, using the graph matching-based approach, [9] proposed a method that treated melodies as graphs with consecutive nodes; in this work, the melodies being compared are transformed into bipartite graphs. The similarities between melodies can then be determined based on maximum weight matching and edit distance algorithms. In another recent work, Six et al. [26] described duplicate detection techniques and presented a metadata-based solution to detect duplicate digital audio in an archive, while Borker et al. [7] proposed an audio fingerprinting and segment matching-based model for music plagiarism detection. Garcia et al. [27] present an audio spectrogram-based method for detecting the similarity between two musical pieces. Malandrino et al. [28] propose a hybrid method combining text-similarity and clustering-based methods to generate similarity between two songs.
2.2. Data Provenance-Based Music Trustworthiness
Provenance is a combination of techniques to evaluate the trustworthiness of data that works by analyzing the origin and paths taken by the music data. According to Hu et al. [29], data provenance is the analysis of metadata derived from tracking the paths and sources of that data. Historically, trustworthiness evaluation frameworks have been built around the following aspects: data integrity, data quality, systems, and data provenance.
Data provenance is a slightly new concept compared with the other three. Buneman et al. [30] presented the “why and where” concept of data provenance. Data provenance works on the notion of “why” a piece of data exists and from “where” this data has emerged. Widom [31] introduced a Trio system that works using information management regarding data provenance and data accuracy. They associated both accuracy and provenance as an integrated part of their data management and query processing.
Gupta et al. [32] proposed a trustworthiness framework, called TRUTHFINDER, that focuses on the trustworthiness of Web services. Liang [33] presented a data provenance architecture using blockchain technology. In recent data provenance-based works, Aichroth et al. [34] presented a study of audio forensics and provenance analysis technologies, while McGarry et al. [35] proposed a provenance-based study of the music production domain to understand and support music production systems.
2.3. Deep Learning in MIR Data
We now describe a brief history of deep learning-based contributions to MIR. Deep learning is mainly used in fields such as image classification and text generation. In music-based research, deep learning has only been introduced recently. Lee et al. [36] presented a deep convolutional network for extracting features from music in a genre classification framework. Briot et al. [37] presented a survey that reviewed the deep neural-based architectures used for generating monophonic and polyphonic music. In some other recent works; Pacha et al. [38], aimed to provide a baseline for detecting musical symbols using deep learning, and Oramas et al. [39], present a multimodel-based approach to classify music genres. Schedl [40] reviews the music recommendation systems based on deep learning. Zheng et al. [41] present a deep learning-enabled music genre classification method, and Majidi et al. [42] propose a deep learning-based method for automatic music generation. Yang et al. [43] present a deep learning-based method for music content recognition and recommendation system, Lee et al. [44], propose a deep metric learning-based music similarity evaluation system, Elbir et al. [45], introduce MusicRecNet, a CNN-based model which is trained for music similarity analysis, Yesiler et al. [46] and Du et al. [47] present deep learning based methods for identifying cover songs, Thome et al. [48] presented a CNN-based music similarity-based search engine, to help find similar songs for video production and Dhand et al. [49] proposed a system that detects the mood of the user and is further trained with a logistic regression-based model to recommend music based on the user’s facial expressions.
In music similarity analysis, a predominant focus emerges on two primary types of comparative data: music notes and musical pitch. This trend is underscored by the methodology employed in MESMF [9], Borkar et al. [7], and SiMPle [12] methods, as elucidated in Section 3.2 and Section 4. These approaches use music notes for their similarity analysis. However, an intriguing observation arises when examining the utilization of census and provenance data within these related works. Remarkably, these two datatypes remain relatively unexplored in the context of music similarity analysis. A distinct avenue of exploration unveils itself through research works such as in the case of Holten [24] and Muelder [25], which uses graphical visualization methods. Furthermore, Malandrino [28] and Yang [43] introduce text and content-based similarity analysis techniques. The customization of these diverse methodologies in association with notes-based methods can opens up possibilities for adapting them to the potential use of census and provenance data. The main idea behind TruMuzic is that we focus mainly on accuracy of the plagiarism detection, hence we include all these types data. A detailed explanation of these technical comparisons is provide in Section 4 of the paper. In the next section, we explain the concept of our model in detail.
3. TruMuzic: Deep Learning and Data Provenance-based Plagiarism-Detection
In this section, we explain the concept behind TruMuzic and look at the working mechanism of its approach. First, we describe how musical features and their presentation are used in our framework in Section 3.1. Next, we explain the methods used in computing the similarity of these features in Section 3.2. In Section 3.3, we introduce a deep neural network-based embedded solution to improve the overall accuracy of the model and provide the right distribution of feature weights. Finally, in Section 3.4, we define the overall functionality of the proposed solution.
3.1. Music Feature Representation
Generally, music comes in one of two digital formats. The first format is the acoustic representation, where the audio intensity is recorded about the time while being sampled at a particular frequency. Examples of acoustic music formats include mp3, mp4, and .au files. The second format is the structural representation, where music is described by musical scores, which give information such as pitch values or duration of notes. Examples of structured music formats include MIDI and humdrum data. Score-based musical data are quite suitable for similarity-based computation in MIR. In this paper, we use structured music data for plagiarism detection. We classify the musical data used into three categories: (1) musical notes, (2) pitch data, and (3) census data. We also introduce the use of provenance data in music similarity comparison as a fourth category to consider in comparisons, as shown in Figure 1. In this paper, we use a combination of music data through “http://kern.ccarh.org/ (accessed on 20 May 2018)”, provided by the Center for Computer-Assisted Research in the Humanities (CCARH) at Stanford University. It hosts a large collection of music scores in the Humdrum file format, which is a plain-text file format used for representing musical data.
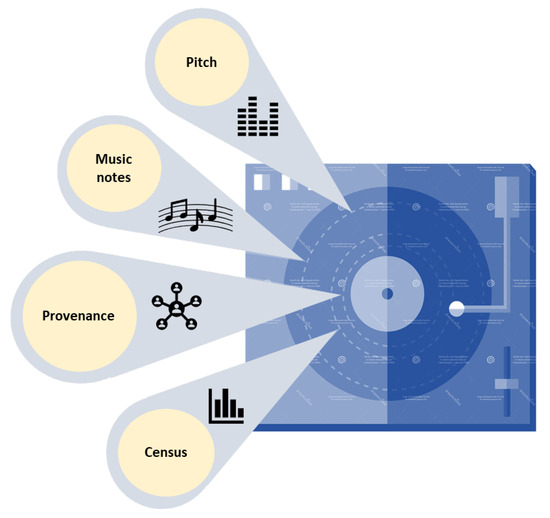
Figure 1.
Main categories of music feature representation.
All four of these features are used in TruMuzic, their similarity comparisons are explained below.
3.1.1. Musical Notes
A note in music is a symbol that represents the sound of the music. The notes used in composing a musical piece are the most important and most used data types in MIR applications. Our model also uses the 12-tone theory to cluster similar notes, this 12-tone-based classification helps in copying detection where similar-sounding notes are used instead of the original notes. The notes data used in this paper is accessed from the “http://kern.ccarh.org/ (accessed on 20 May 2018)”, website hosts a collection of music scores in the Humdrum file format. The Humdrum format is a plaintext representation of music, which is mainly used for research purposes. We store the musical notes in small musical units called phrases, each consisting of 16 beats. This allows us to direct our similarity comparisons to the desired locations in the two given songs.
3.1.2. Pitch and Census Data
Pitch in music is the measurable value of a music note by which we can determine whether a note is high or low. A musical note that has a steady frequency with a qualitative hertz value is said to have a definite pitch. In this paper, we use these definite pitch notes in our similarity comparisons. Census data in music refers to metadata related to musical pitch and notes. The process of generating the census data provided in this paper involves analyzing and extracting specific musical characteristics from a given musical composition. Census data provides a concise summary of key characteristics of the musical composition, such as the number of notes, pitch range, note duration, loudness, and mood. We also include intensity and spirit scores in our evaluations, these scores represent the loudness and mood of the music, respectively. A song with an intensity score of 9 or 10 would be very loud and intense, and similarly, a song with a high spirit score would be a very happy and positive song. Table 1 and Table 2 present sample sets of the census and pitch data used in our model. Moreover, the properties of both the pitch and census data are similar; hence, we use cosine similarity for calculating the similarity between two pieces of music. Although in experimental evaluations, we also used both these features separately. Generating census data requires human expertise and interpretation, especially for subjective measurements like mood and intensity.

Table 1.
Sample Census data extracted from music samples.
Table 2.
Sample Pitch data extracted from music samples.
3.1.3. Provenance Data
Provenance refers to the history and source of the data in question. In the field of music, this often consists of the history of the song including information on the composers, the origin of the music, parental work, time, country, and the group of countries involved in the composition. As we will see in the experimental results, provenance data by itself does not improve accuracy, but it allows significant improvements in combination with other data types. This paper classifies provenance data into two categories: (1) data-oriented provenance shown in Table 3 and (2) source-oriented provenance shown in Table 4. Data-oriented provenance refers to the history and path of a song, for example, the country of composition, related parental work (folk), the genre of the song, etc. In source-oriented provenance, provides a score to the composer based on his/her copying history as shown in Table 5. The data-oriented provenance data is accessed from the “http://kern.ccarh.org/ (accessed on 20 May 2018)” website and the source-oriented provenance data is generated by our music experts. Generating provenance data in music involves a combination of archival research, historical documentation, musicological analysis, expert knowledge, and sometimes subjective interpretation. Moreover, we also consider copying patterns based on whether the copying pattern matches the other song or not. We keep the categories and their marking soft to improve score computation; Table 3 and Table 4 show the data and source-oriented provenance data, respectively. For example, according to Cameron et al. [3], Ed Sheeran faces four accusations of plagiarism, while Adele has only one for her song “A Million Years Ago”, hence, the source trustworthiness scores may differ in the cases of Ed Sheeran and Adele.
Table 3.
Sample data-oriented provenance data.
Table 4.
Sample source-oriented provenance data.
Table 5.
Source-oriented provenance and trustworthy scores for compositions.
3.2. Similarity Score Computation from Music Data
To compute the similarities between the above-explained features in the two songs, we use three different methods, each based on the individualistic nature of the related data type. Below, we describe the similarity computing methods for each data type, one by one. To select similarity measurements, while also looking at their suitability to use with the given data type, our model also considers these methods’ simplicity, effectiveness, and ability to optimize. We use Cosine similarity for pitch and census data, this computes the cosine of the angle between two vectors. The advantage of this metric is that it helps overcome the issue of size variance, where due to size differences between the two pieces of music some features may appear far apart in terms of Euclidean distance, even if they are similar. Similarly, we use Jaccard similarity when analyzing provenance data as it is suitable for the data type and effective for text mining of two sets of data. For musical notes we use a Dynamic time wrapping (DTW)-based approach for making similarity comparisons, this helps to deal with incompatibility between the initiative and calculated distances between music notes. DTW is a commonly used distance measurement for speech processing, bioinformatics, and other time-series data analysis. DTW helps to recover optimal alignment, which minimizes the cumulative distance between two sets of musical notes. As shown in the internal comparison in Section 4, using DTW improves the accuracy of similarity comparisons. Our model evaluations come closest to the ground truth along with the MESMF [9], Borkar et al. [7], and SiMPle [12] methods.
3.2.1. Musical Notes Data
To calculate the DTW between the data song P and query song Q, the following steps are performed. Let be any two series with lengths of n and m, respectively; these series are to be used for similarity comparisons. Hence, an n × m matrix can be defined to represent the note-to-note correspondence relationship between P and Q, where the elements in this matrix indicate the Euclidean distance between and which is defined as:
The alignment and warping between each note in P and Q can be represented by a time-warping path . The element represents the alignment and the matching relationship between .
The criterion to meet the lowest-cost path between the given series is:
where .
Therefore, the dynamic time warping can be defined as:
A dynamic programming method based on the accumulated distance matrix is implemented. The algorithm is constructed based on the above equation.
The final similarity score is given by .
3.2.2. Pitch and Census Data
Cosine similarity is equal to the cosine of the angle between the two-time series, i.e., it determines whether the series are pointing in the same direction. Mathematically, it is defined by the inner product of the time series. The comparison between P and Q songs is created using the cosine similarity function as follows:
The function returns the similarity scores, , for pitch and census data, respectively, as shown in Algorithms 1–3.
| Algorithm 1 Computing the DTW for musical note data. |
| Input: Pair of songs ; Notes divided into ‘themes’ of songs P and Q. Output: Similarity scores () Function: DTW Steps:
|
| Algorithm 2 Computing the Cosine Similarity for pitch and census data. |
| Input: Pair of songs . Sets of pitch datasets of census data for songs P and Q. Output: Pitch and census data similarity scores () Function: Cosine Sim Steps:
return |
| Algorithm 3 Computing the Jaccard similarity for the provenance data. |
| Input: Pair of songs ; Set of provenances for both data Pd and source Ps. Output: Provenance similarity scores () Function: JaccardSim Steps:
return Spr = Pd + Ps |
3.2.3. Provenance Data
Considering the nature of provenance data, we used a token-based Jaccard similarity method to compare two sets of such data, P and Q. We used a hash map-based Jaccard method to avoid overlap issues [50].
Consider the two strings to be compared, P and Q, where P = {Germany, Classical} and Q = {Ravel, Germany, Classical}. Here, the JAC (d,q) = 2/3. We compute the overlap size by building a hash map for each token. The Jaccard similarity coefficient compares two sets of time series data and produces a score based on shared features among the two provided sets of data. It is computed as an intersection over a union, i.e.,
where is the weight of the maximal matching for the biograph. Let the provenance score, based on the Jaccard function, be . After computing the provenance score, we combined both the data and source-oriented scores into the final score, Spr (Pd + Ps = Spr).
We have also considered the other data features, but the four data types used were chosen for two reasons. First, they make significant contributions to the accuracy of the final similarity scores our model generates. Second, they have measurable properties that make them suited to similarity comparisons. In the following subsection, we define the problems for and explain the working mechanism of TruMuzic.
3.3. Optimization Using Deep Learning-Based Weight Adjustment
Music similarity score calculation is a complex task. Hence, we need an advanced solution to accurately evaluate similarity that adjusts the weights of features used in the model. As such, we used a multimodal approach to train our model, where four levels of similarity are provided by music experts as the ground truth and provide the similarity scores for the four features used in the first phase of TruMuzic’s process. As shown by experimental results using a linear regression-based approach, we were able to find the proper weight distribution of similarity features in our model. In this subsection, we explain our deep learning-based classification solution in this regard.
Our model uses the ground truth of similarity levels generated by the experts as training data to learn each individual feature’s weight, as shown in Figure 2. To generate ground truth training data, we first developed a dataset of paired songs along with a questionnaire. The questionnaire was used to label the similarity of each paired song, more details of which are provided in Appendix A.
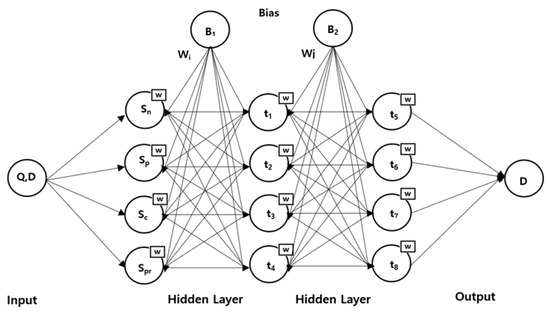
Figure 2.
Deep neural network-based weight-adjustment function.
Neural networks are composed of interconnected layers of computational units called neurons. These networks transform data until the right weights and correct classifications are found, so the network outputs good predictions. The neurons multiply an initial value with randomly generated weights, and as we train the model on more paired songs with their similarity level, the model adjusts the weights of each neuron’s biases based on the output results. The network functions according to an iterative learning process that adjusts the values of the weights of the network each time in reference to the ground truth as shown in Algorithm 4. This process continues until the right combinations of weights are found.
| Algorithm 4 DNN-based weight distribution |
| Input: Similarity scores of four features for given data songs Q and P. Weights generated through ground truth-based classification. Desired results of the comparisons Rd. Default (zero) weights Output: Final weights of given four features to adjust the final similarity scores (w1, w2, w3, w4) Function:
|
As shown in Figure 3, the feature similarity results, Sn, Sp, Sc, and Spr, are produced by comparing two songs, Q and P. Moreover, these similarity results are at first just the initial values of neurons along with their randomly given weights. In the recursive process, the final output of all the values based on their weights is computed and compared with the desired output Rd. Moreover, based on the differences between the desired output and the output produced by the modules, the weights are adjusted in each iteration. Biases (B1 and B2) of the module also contain weight values, which help in making weight adjustments. We use a backpropagation algorithm to achieve the desired combinations of weights in the neural network. Backpropagation consists of applying the chain rule to all possible paths in our network. It is a dynamic programming-based algorithm that reuses intermediate results to calculate gradients. After this, it transmits the intermediate errors backward. The algorithm implements a function Xn = Fn (Wn, Xn−1), where Xn is the output vector representing the similarity between two songs. Wn represents the weights module, and Xn−1 represents the output of the previous iteration and the input vector of the current module.
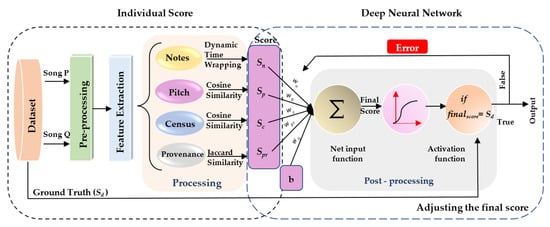
Figure 3.
Workflow of TruMuzic.
If the partial derivative of error E representing Xn is known, then with backward recurrence, we can compute the partial derivative of E in relation to Wn and Xn−1. The algorithm adjusts the weights using a stochastic gradient descent method.
In Equation (6), k represents the number of iterations and η is the learning rate, while is the average of the total error in terms of the adjusted weight.
We explain the experimental process used for the DNN-based training in the following subsections.
Dataset: A deep network has numerous parameters, and hence a significant amount of data is required to train the model adequately. We decided to use the Kernscores database with our model; this dataset was developed and is maintained by Stanford University’s researchers and musicologists. The library consists of 7,866,496 notes in 108,703 files. Additionally, the music data is classified by genre, composer, and various other pieces of data. Table 6 and Table 7 present the list of composers and music genres in the library. We downloaded the data for the 1200 pieces of music in the Kernscores database and processed them as explained in Appendix A.
Table 6.
The list of composers presented in the KernScores library.
Table 7.
List of genres in the dataset.
- We also generated similar data for an additional 650 songs; here we mixed up 234 pairs of songs where one is allegedly a copy of the other, along with 182 noncopied songs, to extend the amount of training data available to the model with the help of our experts. These data were generated according to answers given in a questionnaire, as explained in Appendix A. Although, the total of 1850 songs in our dataset, with 1200 from Kernscores and 650 categorized by experts, seems quite small from a deep learning dataset perspective, if we combine any song in the dataset with any other song, the sets of pairs produce a much bigger matrix. Including both the internal and external experiments, which are explained in detail in Section 4.1 and Section 4.2, overall, we used 3800 combinations of songs in the training process of the model. The dataset used in this paper was split up into three disjoint sets; a training set with 70% of the data, a cross-validation set with 15% of the data, and a test set with 15% of the data.
- Content preprocessing: We use humdrum data from Kernscores, and we also develop additional features with the help of experts to enhance the datasets by adding quantitative values. As explained in Section 3.3, through the questionnaire developed for this model, we were able to add features such as spirit scores and intensity scores to these songs in our database. Moreover, for the test datasets, we intentionally created similar data with the help of music experts. Apart from the classes developed by our experts, our dataset includes features such as musical notes, 12-tone pitch classes, absolute pitch, spirit score, intensity score, composer history, composing location, and provenance score of composers to help identify plagiarism. We also convert some additional musical data into the required format to review songs famously accused of plagiarism using our model for experimental purposes.
- Implementation and training of the deep network: We implement our deep network using Keras with TensorFlow as the backend. This dense implementation is based on a large unit layer followed by a final layer that computes the SoftMax probabilities. The hyperparameters of the model are given below in Table 8. The total number of params used for our DNN was 1,424,681, and all of these were trainable.
Table 8. Explaining the hyperparameters of the DNN.
Music plagiarism detection is a tricky task. For example, whether the same sequence of notes appears at the beginning of a song or in the middle of a song has a large impact on the overall likelihood of plagiarism. Although plagiarism detection is essential for the music industry, there has been very little research in this field. Moreover, the efficiency and accuracy of existing models based on plagiarism-based research are also limited. Some of the limitations are as follows. First, this previous research failed to resolve the discrepancy issue that can occur between any two musical sequences. Second, they limited comparisons to basic musical features because they were not able to find the correct combinations of features and weights in their models. Third, most of these methods focused on processing speed rather than the accuracy of the final comparison score.
In our solution, we use four types of data to achieve improved accuracy in similarity comparison tasks. Along with the musical data such as the notes, pitch, and census data contained in a song, we also considered provenance information in our similarity comparisons. The experimental results show this improves the overall accuracy of the model. We further use DTW for note comparisons, which solves the discrepancy issue between intuitions and calculates distances between songs by first recovering optimal alignment. Unlike other similarity computation methods such as Euclidean distance, where the similarity computation on two sets of variable sizes is limited, our study proposes the utilization of a deep learning network to discover the correct combination of weights for making more wide-ranging music similarity comparisons.
3.4. The Overall Functionality of TruMuzic
The overall functionality of the model is explained in Figure 3. TruMuzic can be divided into three phases: the preprocessing phase, the processing phase, and the postprocessing phase, as detailed in our previous work [16]. In the preprocessing phase, the model works on feature selection, data normalization, and developing additional quantitative features. In the processing phase, the features of the query song are compared against the features of the data song, which come from legitimate original songs stored in the database. A combination of similarity comparison algorithms is used. Additionally, the weights of the features are adjusted based on the ground truth, which was provided by experts. Moreover, as shown in Algorithm 5, after the similarity comparison, we can see that, in the deep learning-based phase of TruMuzic, the scores are adjusted based on the given weights. In the postprocessing phase, the final score Sd is presented as the model’s output. We define this solution as follows:
| Algorithm 5 Adjusting the final score |
| Input: Individual Score; from Algorithm 1 Weights from the DNN; Output: Final score Function: Steps:
|
Every song S is first represented using a set of feature vectors denoted by f(s) = {f1, f2, f3, …, fn}. Each of the individual fi here represents a class of features. For example, they could be pitch or chord features. These weights are set to zero at the beginning as the default.
Sd = W0 + (Sn × w1) + (Sp × w2) + (Sc × w3) + (Spr × w4)
The similarity scores for each respective feature in the two given songs, P and Q, are sent to the final score calculation function along with their weights, and then the final score is calculated by summing all the individual feature scores. Feature comparison algorithms for each feature type compare every particular feature of the two given songs and then generate a similarity score. The individual similarity scores are sent to the final score calculation function, where these similarity scores are adjusted based on their generated weights. The individual weights of the features are presented in the experimental results in the next section.
4. Experimental Results
In this section, we discuss the experimental results achieved by TruMuzic. Since the nature of music is subjective, it is a challenging task to evaluate music plagiarism detection models. Therefore, we established various test datasets with ground truths alongside a series of experiments to assess and compare the results produced by TruMuzic with those from other SOTA approaches. There are two primary goals used in our experimental process. The first is to evaluate the weights of the data features used in the model. The second is to assess the accuracy and efficiency of our model against other SOTA approaches. In this paper, we focus our model primarily on accuracy. However, for experimental purposes, we also evaluate its efficiency by measuring the time taken by TruMuzic to process a result compared to existing approaches. It is always up for debate which method works best for music similarity comparison because the goals of the various available models and the data features they use for their comparison are entirely different and application specific. Therefore, we developed several test datasets to evaluate the accuracy of the overall process as well as look at the individual contributions from various data features to the final result.
As mentioned in the experimental goals, we performed the experiments in two phases: (1) internal comparisons and (2) external comparisons. In the internal or distinctive comparisons, we evaluate the similarity contribution of a particular data feature or various combinations of these features and their impact on the model’s overall accuracy. In the external or comprehensive comparisons, we combine all features and evaluate the model’s overall accuracy against other SOTA methods. In this section, we will also explain our experimental setup. We describe the internal evaluation of features in Section 4.1, followed by the external evaluation against other methods in Section 4.2.
4.1. Comparison of Internal Features
Our research must examine how much a particular data feature should affect the similarity comparison results using a linear regression model, as shown in Figure 4. This should help us know the impact of each feature set on the performance of our deep learning-based model, which is used to adjust the weight of each feature category. Next, we develop a dataset with the help of music experts, where we classify songs into four categories: 1. Copied songs; 2. Influenced songs; 3. Same genre; and 4. No match. Some examples of this are shown in Table 9. Additionally, Table 10 shows TruMuzic finding the similarity between these 16 songs and presents the model’s individual and combined accuracy when considering combinations of the various features available in our data.
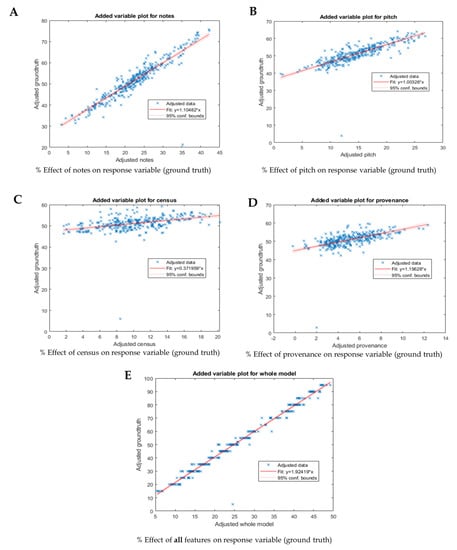
Figure 4.
Similarity features experimental results that illustrate the impact of music features on the similarity model. (A): Music notes; (B): pitch; (C): census data; (D): provenance data; (E): all features.
Table 9.
Sample set from dataset developed by experts from internal evaluation.
Table 10.
Analysis of the results from an internal comparison.
For regression-based results, the coefficient of determination (R-squared) shows that a proportionate amount of variation in the response variable can be explained by the independent variable’s variation in the linear regression model. The larger the R-squared is, the more variability is seen by the linear regression model. Generally, the higher the R-squared, the better the model fits the data. The model also displays the p-value for each coefficient. The p-values show which variables are significant for the model’s result. The p-value is lowest for the musical notes data feature; the p-value indicates if this feature is statistically significant. If the p-value was found to be p < 0.05 (5% significance level), then those variables are not considered significant and are removed from any further evaluation. Additionally, as shown in the graphs, the musical notes features have the smallest squared error (SE) and the highest t-coefficient, which further proves the significance of musical notes in our model. Overall, the regression-based results demonstrate that the inclusion of musical notes, along with pitch, census, and provenance data, enhances the predictive power of our model. These findings highlight the substantial influence of musical notes in determining the similarity between musical compositions and emphasize the importance of considering multiple data types for a comprehensive music similarity evaluation.
The dominant variable can be determined by the slope of the fitted line. As the notes feature has the highest slope, it is the most significant feature, i.e., finding the ground truth is highly dependent on the notes. This finding is further strengthened by the p-value and squared error results for the notes feature. The fitted line shows how the model, as a group of variables, can explain the response variable. The slope of the fitted line is not close to zero, and while the confidence bound does not include a horizontal line, this shows that the model fits better than a degenerate model that consists of only a constant term. The test statistic values are shown in the model display (F-statistic vs. constant model), which shows the F-test on the regression model. This proves that the model fits significantly better than a degenerate model that consists of only a constant term.
In Table 10, we compare models based on various combinations of features and provide their similarity scores. The combination of two data features, music notes and pitch data, provides the highest similarity scores; this is followed in order by the notes-provenance, notes-census, pitch-provenance, and census-provenance combinations. Furthermore, in a combination of three data features, the notes-pitch-provenance data provides the highest accuracy, followed by the notes-pitch-census data, and then the pitch-census-provenance data.
According to Table 11, musical notes are the most significant individual data feature, followed in order by the census, pitch, and provenance features. Individually, provenance data performed poorly, but in combination with musical chords and other data features, its inclusion in the model improves accuracy significantly. We can also observe the individual impacts of these features on the overall accuracy. From the internal comparison phase, we can conclude that the accuracy of TruMuzic improves with an increasing number of features in the input data.
Table 11.
Estimated coefficients by the linear regression model.
4.2. External Comparison
In the external comparison phase, we first compare only DTW with SOTA methods by developing test datasets with the help of our experts. However, since the goal is to evaluate our model’s overall accuracy against existing methods, we also use a dataset of songs that are famous for allegedly being copied, which was developed and validated by a team of music experts. Finally, in Section 4.2.3, we look at the contributions made by our work in comparison with related works.
4.2.1. Test Datasets
The test datasets were developed through a process called harmonization, where notes are modified by addition or deletion. This dataset was developed by a team of music experts for experimental purposes. We further classify test datasets into two subcategories: (a) random restoration and (b) copying-oriented restoration. For random restoration, we selected five songs from Kernscores and modified each to create five different versions of the original songs with the help of our experts. We requested that the music experts replace a certain percentage of the original notes with random notes. In this dataset, we did not intend to keep the song melodic for the listeners, so we principally followed the mathematical ratio when modifying the song. In our dataset, the song in subset 1 has all the original notes, followed by versions with 80%, 70%, 60%, and 40% of the original notes in subsets 2, 3, 4, and 5, respectively. Moreover, as stated earlier, the original notes were replaced by random notes according to that version’s subset’s mathematical ratio. For example, subsets with 80% and 60% original notes contain songs that have 20% and 40%, respectively, of their notes replaced with randomly selected notes. The ground truth is established based on the mathematical percentage of the original notes. We compared the results of each subset against the ground truth. To evaluate TruMuzic, we were only able to compare the performance of DTW on the musical notes feature since we were not able to change the rest of our data types with manually produced test datasets in the same way. As shown in Table 12, we evaluated the performance of DTW against MESMF [9], Borkar et al. [7], SiMPle [12], Silva et al. [51], and a traditional edit distance-based similarity comparison method. MESMF introduces a music plagiarism detection model called BMM-Det, which uses a graph-based approach to compare potential plagiarized and original songs, by calculating the edit distance using the BMM-Det algorithm. Borkar et al. [7] extracted musical fingerprints and compared them with the database of existing songs through segment matching. SiMPle [12] and methods proposed by Silva et al. [51], also worked on audio fingerprinting; however, they use ‘SiMPle’. They calculated music similarity based on the SiMPle (similarity matrix profile) method. The table shows that the DTW, MEMSF, Borkar et al. [7], and SiMPle models closely follow the ground truth; however, the edit-distance model and Silva et al. [51] are a little further from the ground truth, but remain somewhat close.
Table 12.
Random restoration—an external comparison of DTW against other state-of-the-art methods.
It should be noted that, in Table 12, we are only comparing the musical notes feature, and all the other features of TruMuzic are not being considered in the comparison. In this way, it was found that DTW improves the similarity measurement of temporal sequences by taking acceleration and declaration into account. However, the evaluation of this test dataset does not contribute to the goal of achieving accurate real-time plagiarism detection after the pattern of a piece of music has been copied. In general, a composer intending to copy a musical piece will make slight changes to some of the chords and tempo, but primarily, the musical structure will remain the same. Therefore, we will apply a more realistic copy-oriented approach in our next experimental setup.
4.2.2. Songs Famous for Allegedly Being Copied
In this experimental setup, we used an extended version of the dataset presented in Table 9. Our team of music experts included 100 songs in each class to help evaluate the accuracy of our model. We computed the similarities of these pairs and compared the results against the established ground truths. The evaluation here indicates whether the model in question can classify the songs correctly as copied or not. We merely show the results of our analysis and do not claim that any of the songs were indeed copied or not. As shown in Table 12, we can see that the SiMPle method, edit distance, and Silva et al. follow the ground truth somewhat closely, but Borkar’s model [7], MESMF, and TruMuzic are the models closest to the ground truth. Here, the ground truth is the correct classification of songs in the four different categories developed by our experts. As shown in Table 13, TruMuzic outperforms the existing models, since in this test we included provenance data, census data, pitch data, and time-based chord comparisons.
Table 13.
Similarity results for allegedly copied songs showing the impact of weight distribution based Trumuzic.
As we can see in Table 13, TruMuzic consistently outperforms the other SOTA methods in all classes, except classes 1 and 3, where MESMF equals the performance of TruMuzic. The accuracy of TruMuzic is lowest when differentiating between classes 1 and 2 for copied and influential songs, respectively. However, when classifying between classes 1 and 4, TruMuzic reaches 100% accuracy. In the external experiments, it is slightly improper to compare other models with TruMuzic since it uses four data features to make its decisions, while the others use only data features based on the song’s chords or its sheet music. Comparing Table 12 and Table 13, we can see that the integration of pitch, census, and provenance data when calculating the final similarity scores enhances the accuracy of TruMuzic. As far as efficiency is concerned, TruMuzic is the slowest model, followed by edit-distance and Silva et al [51]. Moreover, the SiMPle method presented by Silva et al. [12] outperforms all the other models in time-based efficiency. However, as explained earlier, we are focused on accuracy in this project. Moreover, to explain the impact of deep learning-based weight distribution, we have shown the results of TruMuzic with and without weight distribution in Table 13. The deep learning-based weight distribution improves the overall accuracy of our model by 24%.
The TruMuzic database consists of a combination of test data, random songs, allegedly copied songs, and intentionally altered versions of original songs. We used databases such as kernscores, and cmme.org, along with several music transcription tools such as music21, scorecloud, etc., to search and generate data for our database. The data features we are using are challenging to find or produce for a large number of songs, even with our team of three music experts. As such, we limited the number of songs in our testing to 3800. For experimental purposes, we also used altered versions of some famous songs, for example, covers or remixed versions. The idea behind this was to generate a dataset that would include songs that represent real-world plagiarism problems well. We provide the details of our experts in Section 7. Another important aspect of comparative work in the field of music is cover song identification [46,47]. Theoretically, these models have the same goal of identifying similar pieces of musical data; however, version identification methods often only consider content-based similarity features.
4.2.3. Comparison with Related Works
In Table 14, we compare various other models from previous studies with TruMuzic. The goal is to compare some famous and current models to understand the significance of TruMuzic in the field. We summarize the results in Table 14 by answering the following questions.
Table 14.
Comparison with other models from previous studies.
- Does the model use a dataset?
- If yes, what is the number of songs?
- What method do they use for similarity comparison?
- What is the application-oriented objective of the model?
- What aspect of achieving the result does the model focus on?
- Do they use a neural network-based weight distribution system?
- Does the method use any questionnaires?
- Does the method include a user study by domain experts?
5. Discussions, Implications, and Limitations
In this section, we establish the importance of the experimental results achieved by our model and demonstrate the correlations between the ground truth and the similarity features. We also explain the implications and limitations of our approach. To evaluate our model’s results, we used a basic statistical approach and developed hypotheses. In this way, we established five hypotheses and then evaluated whether the results proved them true or false.
- Two songs with higher note similarity scores are expected to be more similar.
- Two pieces of music with higher pitch similarity scores are expected to be more similar.
- A combination of note and provenance similarity scores leads to an accurate classification.
- A combination of pitch and census similarity scores leads to an accurate classification.
- All of the similarity scores combined led to the most accurate classification.
As shown in Table 10, hypotheses 1, 3, and 5 can be seen to be true, achieving scores of 54%, 60%, and 86% for accuracy, respectively. In contrast, hypotheses 2 and 4 achieved respective accuracy scores of 31% and 56%, and hence, we declared these statements false. Our model achieved an accuracy of 86% when all features of the data were considered while making the comparison.
To understand the possible implications of our work, we first need to understand that music plagiarism is not only about analyzing the similarity between two pieces of music. It is also important to quantify the degree of similarity between the two pieces of music in question. Moreover, stealing a musical idea or not crediting the original contributors are also acts of music plagiarism. This is where our model is different from most other previous approaches, not only did we focus on accuracy and degree of accuracy, but with our provenance-based approach, we can also figure out whether two musicians have a history of working together. For example, a score based on an artist’s history of collaborations, common artists, etc., along with the trustworthiness of the source, can help analyze plagiarism. Our research can also be applied to determine copyright violations in the audio used as a background to videos from members of the public similar to those seen on YouTube.
The identification of music plagiarism is a complex task since it depends on the model’s ability to determine hidden but significant similarities between the melodic fragments inside two songs. A major drawback linked to automatic music plagiarism detection is that different legislative structures around the globe have different standards for showing plagiarism. Clear legislation designed to establish general and accepted rules for detecting plagiarism has yet to arrive. Even though current laws do not emphasize this, often the deciding element in plagiarism cases is usually related to the melody of the song. Another commonly discussed issue is the quality and availability of data for model training and comparing large numbers of songs.
6. Conclusions
In this paper, we propose a novel method for music plagiarism detection. Our model improved the accuracy of other similarity comparison models by implementing the following techniques. First, we employed provenance-based data in our model’s feature-based similarity comparison approach. Second, we used a customized DTW algorithm to improve the accuracy of our model’s note comparisons. Third, we used a deep learning-based error function to evaluate and establish the right combinations of weights for each feature. Our experimental results showed that the model’s accuracy improved after implementing additional comparison features. Our method is slightly slower than other current SOTA methods, as our model is focused on improving the accuracy of similarity comparisons between two songs.
In future investigations, we want to pursue the following improvements to our model. 1. A deep learning-based feature selection method to advance the quality of features being compared. 2. Exploit using image-based input data for feature comparisons to improve processing speed along with accuracy. 3. The introduction of a suitable pruning technique along with algorithms to improve the overall accuracy and speed of the similarity comparison itself. 4. Examine the inclusion of established cover song identification methods in our music plagiarism detection model.
7. Music Experts
- (a)
- Dr. Seema Rastogi
- a.
- Ph.D., Musicology
- b.
- MKP Inter College, Uttarakhand, India
- (b)
- Dr. Saroja Atha
- a.
- Ph.D., Musicology
- b.
- IIT, Hyderabad, India
- (c)
- Si-Yeon Jeon
- a.
- Bachelor of Music from the Department of Music Composition and writing,
- b.
- Kangwon National University,
- c.
- Chuncheon, South Korea.
- (d)
- One-Sun Choi
- a.
- Bachelor of Music from the Department of Classical Vocal Music,
- b.
- Kangwon National University,
- c.
- Chuncheon, South Korea.
Author Contributions
Conceptualization, K.G. and Y.-S.M.; methodology, K.G., Y.-S.M. and T.A. software, K.G.; validation, K.G. and T.A.; formal analysis, K.G. and Y.-S.M.; investigation, Y.-S.M.; resources, K.G.; data curation, K.G.; writing—original draft preparation, K.G.; writing—review and editing, K.G. and T.A.; supervision, Y.-S.M. All authors have read and agreed to the published version of the manuscript.
Funding
This research was funded by the National Research Foundation of Korea (NRF) grant funded by the Korea government (MSIT) (No. 2021R1A2C1011198).
Institutional Review Board Statement
Not applicable.
Informed Consent Statement
Not applicable.
Data Availability Statement
Kernscore—a music database by Stanford University KernScores (ccarh.org accessed on 20 May 2018). Ground truth developed by experts is publicly available at: https://github.com/InfoLab-SKKU/TruMuzic (accessed on 20 May 2018).
Acknowledgments
I would like to extend my sincere thanks to the team of music experts, and a special mention to Seema Rastogi for her support in ground truth development.
Conflicts of Interest
The authors declare no conflict of interest.
Appendix A
This questionnaire was used to develop the ground truth and additional music features with the help of music experts.
- Which option is true for this pair of songs?
- (a)
- Copied (Similarity ≥ 90%)
- (b)
- Similar or Coincidental (Similarity ≥ 70%)
- (c)
- Some parts of the songs are similar but overall, not similar.
- (d)
- Completely different songs
- Would you say both the songs fall into the same music genre?
- (a)
- Yes
- (b)
- No
- (c)
- Cannot say
- What is similar in this pair of songs (you may choose multiple options)?
- (a)
- Musical notes
- (b)
- Music genre
- (c)
- Tempo
- (d)
- Pitch
- (e)
- Background music
- (f)
- Instruments played
- (g)
- None of the above
- (h)
- Any additional comments
- How would you define the intensity (loudness) of the songs?
- (a)
- Similar-Both high
- (b)
- Similar-Both low
- (c)
- Different
- Please provide an intensity score to both the songs individually from 1 to 10, where 10 is the loudest phase.
- (a)
- Song 1-
- (b)
- Song 2-
- What would you say about the spirit (mood) of both songs?
- (a)
- Similar
- (b)
- Different
- (c)
- Cannot say
- Please provide a spirit score to both the songs individually from 1 to 10, where 10 is the happiest mood of the song.
- (a)
- Song 1-
- (b)
- Song 2-
References
- Fink, C.; Maskus, K.E.; Qian, Y. The economic effects of counterfeiting and piracy: A review and implications for developing countries. World Bank Res. Obs. 2016, 31, 1–28. [Google Scholar]
- Danaher, B.; Smith, M.D.; Telang, R.; Chen, S. The effect of graduated response anti-piracy laws on music sales: Evidence from an event study in France. J. Ind. Econ. 2014, 62, 541–553. [Google Scholar] [CrossRef]
- Cameron, S. An Economic Approach to the Plagiarism of Music; Springer: Berlin/Heidelberg, Germany, 2020. [Google Scholar]
- Robine, M.; Hanna, P.; Ferraro, P.; Allali, J. Adaptation of String Matching Algorithms for Identification of Near-Duplicate Music Documents; Workshop on Plagiarism Analysis, Authorship Identification, and Near-Duplicate Detection (PAN07); HAL: Amsterdam, The Netherlands, 2007; pp. 37–43. [Google Scholar]
- Hartnett, J. Discogs. com. Charlest. Advis. 2015, 16, 26–33. [Google Scholar] [CrossRef]
- Dittmar, C.; Hildebrand, K.F.; Gärtner, D.; Winges, M.; Müller, F.; Aichroth, P. Audio forensics meets music information retrieval—A toolbox for inspection of music plagiarism. In Proceedings of the 20th European Signal Processing Conference (EUSIPCO), Bucharest, Romania, 27–31 August 2012; pp. 1249–1253. [Google Scholar]
- Borkar, N.; Patre, S.; Khalsa, R.S.; Kawale, R.; Chakurkar, P. Music Plagiarism Detection using Audio Fingerprinting and Segment Matching. In Proceedings of the 2021 Smart Technologies, Communication and Robotics (STCR), Sathyamangalam, India, 9–10 October 2021; pp. 1–4. [Google Scholar]
- Lee, J.; Park, S.; Jo, S.; Yoo, C.D. Music plagiarism detection system. In Proceedings of the 26th International Technical Conference on Circuits/Systems, Computers, and Communications, Gyeongju, Republic of Korea, 19–22 June 2011; pp. 828–830. [Google Scholar]
- He, T.; Liu, W.; Gong, C.; Yan, J.; Zhang, N. Music Plagiarism Detection via Bipartite Graph Matching. arXiv 2021, arXiv:2107.09889. [Google Scholar]
- Gurjar, K.; Moon, Y.-S. Comparative study of evaluating the trustworthiness of data based on data provenance. J. Inf. Process. Syst. 2016, 12, 234–248. [Google Scholar]
- Robine, M.; Hanna, P.; Ferraro, P. Music similarity: Improvements of edit-based algorithms by considering music theory. In Proceedings of the Int’l Workshop on Multimedia Information Retrieval, Bavaria, Germany, 28–29 September 2007; pp. 135–142. [Google Scholar]
- Silva, D.F.; Yeh, C.-C.M.; Batista, G.E.; Keogh, E.J. SiMPle: Assessing Music Similarity Using Subsequences Joins; ISMIR: New York, NY, USA, 2016; pp. 23–29. [Google Scholar]
- Lemström, K.; Tarhio, J. Searching Monophonic Patterns within Polyphonic Sources. In Proceedings of the RIAO Conference, Paris, France, 12–14 April 2000; pp. 1261–1278. [Google Scholar]
- Mongeau, M.; Sankoff, D. Comparison of musical sequences. Comput. Humanit. 1990, 24, 161–175. [Google Scholar] [CrossRef]
- De Prisco, R.; Malandrino, D.; Pirozzi, D.; Zaccagnino, G.; Zaccagnino, R. Understanding the structure of musical compositions: Is visualization an effective approach? Inf. Vis. 2017, 16, 139–152. [Google Scholar] [CrossRef]
- Gurjar, K.; Moon, Y.-S. A comparative analysis of music similarity measures in music information retrieval systems. J. Inf. Process. Syst. 2018, 14, 32–55. [Google Scholar]
- Son, H.-S.; Byun, S.W.; Lee, S.-P. Illegal Audio Copy Detection Using Fundamental Frequency Map. In Proceedings of the Proceedings of the 16th International Joint Conference on e-Business and Telecommunications (ICETE 2019), Prague, Czech Republic, 26–28 July 2009; pp. 356–361. [Google Scholar]
- Buckers, T. Dealing with Overconfidence and Bias in Low-Cost Evaluation of Audio Music Similarity. Master’s Thesis, Delft University of Technology, Delft, The Netherlands, 2021. [Google Scholar]
- Keyt, A. An improved framework for music plagiarism litigation. Calif. L. Rev. 1988, 76, 421. [Google Scholar] [CrossRef]
- van Balen, J.; Haro, M.; Serra, J. Automatic identification of samples in hip hop music. In Proceedings of the 9th International Symposium on Computer Music Modeling and Retrieval (CMMR), London, UK, 19–22 June 2012; pp. 544–551. [Google Scholar]
- Paulus, J.; Klapuri, A. Measuring the Similarity of Rhythmic Patterns; ISMIR: Paris, France; Citeseer: Paris, France, 2002. [Google Scholar]
- Foote, J.; Cooper, M.; Nam, U. Audio Retrieval by Rhythmic Similarity; ISMIR: Paris, France; Citeseer: Paris, France, 2002. [Google Scholar]
- Muller, M.; Ellis, D.P.; Klapuri, A.; Richard, G. Signal processing for music analysis. IEEE J. Sel. Top. Signal Process. 2011, 5, 1088–1110. [Google Scholar] [CrossRef]
- Holten, D.; Van Wijk, J.J. A user study on visualizing directed edges in graphs. In Proceedings of the SIGCHI Conference on Human Factors in Computing Systems, Boston, MA, USA, 4–9 April 2009; pp. 2299–2308. [Google Scholar]
- Muelder, C.; Provan, T.; Ma, K.-L. Content based graph visualization of audio data for music library navigation. In Proceedings of the 2010 IEEE International Symposium on Multimedia, Washington, DC, USA, 13–15 December 2010; pp. 129–136. [Google Scholar]
- Six, J.; Bressan, F.; Leman, M. Applications of duplicate detection in music archives: From metadata comparison to storage optimization. In Proceedings of the Italian Research Conference on Digital Libraries, Udine, Italy, 25–26 January 2018; Springer: Berlin/Heidelberg, Germany, 2018; pp. 101–113. [Google Scholar]
- López-García, A.; Martínez-Rodríguez, B.; Liern, V. A Proposal to Compare the Similarity Between Musical Products. One More Step for Automated Plagiarism Detection? In Proceedings of the International Conference on Mathematics and Computation in Music, Atlanta, GA, USA, 21–24 June 2022; Springer: Berlin/Heidelberg, Germany, 2022; pp. 192–204. [Google Scholar]
- Malandrino, D.; De Prisco, R.; Ianulardo, M.; Zaccagnino, R. An adaptive meta-heuristic for music plagiarism detection based on text similarity and clustering. Data Min. Knowl. Discov. 2022, 36, 1301–1334. [Google Scholar] [CrossRef]
- Hu, R.; Yan, Z.; Ding, W.; Yang, L.T. A survey on data provenance in IoT. World Wide Web 2020, 23, 1441–1463. [Google Scholar] [CrossRef]
- Buneman, P.; Khanna, S.; Wang-Chiew, T. Why and where: A characterization of data provenance. In Proceedings of the International Conference on Database Theory, London, UK, 4–6 January 2001; Springer: London, UK, 2001; pp. 316–330. [Google Scholar]
- Widom, J. Trio: A System for Integrated Management of Data, Accuracy, and Lineage. In Proceedings of the 2nd Biennial Conference on Innovative Data Sytems Research, Asilomar, CA, USA, 4–7 January 2005. [Google Scholar]
- Gupta, M.; Sun, Y.; Han, J. Trust analysis with clustering. In Proceedings of the 20th International Conference Companion on World Wide Web, Hyderabad, India, 28 March–1 April 2011; pp. 53–54. [Google Scholar]
- Liang, X.; Shetty, S.; Tosh, D.; Kamhoua, C.; Kwiat, K.; Njilla, L. Provchain: A blockchain-based data provenance architecture in cloud environment with enhanced privacy and availability. In Proceedings of the 17th IEEE/ACM International Symposium on Cluster, Cloud and Grid Computing (CCGRID), Madrid, Spain, 14–17 May 2017; IEEE: Madrid, Spain, 2017; pp. 468–477. [Google Scholar]
- Aichroth, P.; Cuccovillo, L.; Gerhardt, M. Audio forensics and provenance analysis: Technologies for media verification and asset management. J. Digit. Media Manag. 2021, 9, 348–366. [Google Scholar]
- McGarry, G.; Chamberlain, A.; Crabtree, A.; Greehalgh, C. The meaning in “the mix”: Using ethnography to inform the design of intelligent tools in the context of music production. In Proceedings of the 16th International Audio Mostly Conference, Trento Italy, 1–3 September 2021; pp. 40–47. [Google Scholar]
- Lee, H.; Pham, P.; Largman, Y.; Ng, A. Unsupervised feature learning for audio classification using convolutional deep belief networks. Adv. Neural Inf. Process. Syst. 2009, 22, 1096–1104. [Google Scholar]
- Briot, J.-P.; Hadjeres, G.; Pachet, F.-D. Deep Learning Techniques for Music Generation—A Survey. arXiv 2017, arXiv:1806.09905. [Google Scholar]
- Pacha, A.; Hajič, J.; Calvo-Zaragoza, J. A baseline for general music object detection with deep learning. Appl. Sci. 2018, 8, 1488. [Google Scholar] [CrossRef]
- Oramas, S.; Barbieri, F.; Nieto Caballero, O.; Serra, X. Multimodal deep learning for music genre classification. Trans. Int. Soc. Music. Inf. Retrieval. 2018, 1, 4–21. [Google Scholar] [CrossRef]
- Schedl, M. Deep learning in music recommendation systems. Front. Appl. Math. Stat. 2019, 5, 44. [Google Scholar] [CrossRef]
- Zheng, Z. The Classification of Music and Art Genres under the Visual Threshold of Deep Learning. Comput. Intell. Neurosci. 2022, 2022, 4439738. [Google Scholar] [CrossRef]
- Majidi, M.; Toroghi, R.M. A combination of multi-objective genetic algorithm and deep learning for music harmony generation. Multimed. Tools Appl. 2023, 82, 2419–2435. [Google Scholar] [CrossRef]
- Yang, G. Research on Music Content Recognition and Recommendation Technology Based on Deep Learning. Secur. Commun. Netw. 2022, 7696840. [Google Scholar] [CrossRef]
- Lee, J.; Bryan, N.J.; Salamon, J.; Jin, Z.; Nam, J. Disentangled multidimensional metric learning for music similarity. In Proceedings of the ICASSP 2020–2020 IEEE International Conference on Acoustics, Speech and Signal Processing (ICASSP), Barcelona, Spain, 4–8 May 2020; pp. 6–10. [Google Scholar]
- Elbir, A.; Aydin, N. Music genre classification and music recommendation by using deep learning. Electron. Lett. 2020, 56, 627–629. [Google Scholar] [CrossRef]
- Yesiler, F.; Serrà, J.; Gómez, E. Accurate and scalable version identification using musically-motivated embeddings. In Proceedings of the ICASSP 2020–2020 IEEE International Conference on Acoustics, Speech and Signal Processing (ICASSP), Barcelona, Spain, 4–8 May 2020; pp. 21–25. [Google Scholar]
- Du, X.; Yu, Z.; Zhu, B.; Chen, X.; Ma, Z. Bytecover: Cover song identification via multi-loss training. In Proceedings of the ICASSP 2021–2021 IEEE International Conference on Acoustics, Speech and Signal Processing (ICASSP), Toronto, ON, Canada, 6–11 June 2021; pp. 551–555. [Google Scholar]
- Thomé, C.; Piwell, S.; Utterbäck, O. Musical Audio Similarity with Self-supervised Convolutional Neural Networks. arXiv 2022, arXiv:2202.02112. [Google Scholar]
- Dhand, G.; Beri, T.; Sobti, T.; Angrish, V. Music Recommendation Using Sentiment Analysis from Facial Recognition. In Proceedings of the International Conference on Innovative Computing & Communication (ICICC), Delhi, India, February 2022. [Google Scholar]
- Konda, P.; Das, S.; Doan, A.; Ardalan, A.; Ballard, J.R.; Li, H.; Panahi, F.; Zhang, H.; Naughton, J.; Prasad, S. Magellan: Toward building entity matching management systems over data science stacks. Proc. VLDB Endow. 2016, 9, 1581–1584. [Google Scholar] [CrossRef]
- Silva, D.F.; de Souza, V.M.; Batista, G.E. Music Shapelets for Fast Cover Song Recognition. In Proceedings of the International Symposium on Music Information Retrieval, Malaga, Spain, 26–30 October 2015; pp. 441–447. [Google Scholar]
Disclaimer/Publisher’s Note: The statements, opinions and data contained in all publications are solely those of the individual author(s) and contributor(s) and not of MDPI and/or the editor(s). MDPI and/or the editor(s) disclaim responsibility for any injury to people or property resulting from any ideas, methods, instructions or products referred to in the content. |
© 2023 by the authors. Licensee MDPI, Basel, Switzerland. This article is an open access article distributed under the terms and conditions of the Creative Commons Attribution (CC BY) license (https://creativecommons.org/licenses/by/4.0/).