Abstract
Various types of heat pipes are available to purchase off the shelf, from various manufacturers, but most of them have strictly defined geometry and technical parameters. However, when there is a need to use a heat pipe (HP) with an unusual size and shape or working conditions other than the standard ones, it becomes very costly to order them from manufacturers, especially in small quantities, and only a few producers are willing to fulfill such an order. This paper presents a detailed description and step-by-step method of manufacturing and testing a low-cost HP with specific properties and geometry, cooperating with a modular heat recovery system based on the use of phase change materials (PCM) for electromobility applications. The presented heat pipes were made entirely by hand, primarily with the use of basic workshop tools, without the use of specialized and automated CNC machines. Utensils used during the process were either made by hand or using desktop FDM 3D printers. During the evaluation of heat pipes’ performance within PCM (coconut oil), simple statistical functions were used. One-dimensional and two-dimensional histograms were used to visualize data obtained during this research. The presented method allows the manufacturing of heat pipes that are, on average, able to melt about 35% more PCM than an empty copper pipe with the exact same geometry. The HPs’ performance in coconut oil was evaluated on the basis of their future applications.
1. Introduction
HPs are very effective and reliable passive two-phase heat transfer devices which allow high heat fluxes to be transferred over long distances or against high-gravity forces by evaporation and condensation of working fluid that circulates inside the pipe. Thus, in comparison to conventional thermal management systems, a HP provides many advantages. A traditional HP consists of a sealed pipe internally lined with a wick structure. The pipe is filled with a quantity of working fluid, whose selection depends, e.g., on its operating temperature range, thermophysical properties and its chemical compatibility with wick and wall material. HPs use the heat of evaporation of the working fluid circulating inside the pipe to transfer heat from the heat source to the heat sink and utilize the working fluid’s surface tension to produce capillary forces in the porous wick that are necessary to circulate the fluid. The diagram presenting traditional HP containing a wick and its operating principle is presented in Figure 1 [1,2,3,4,5].
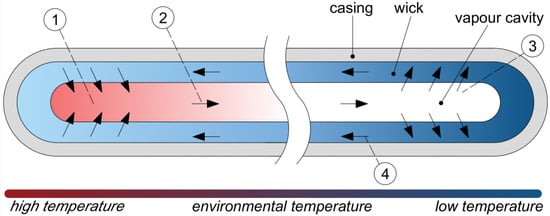
Figure 1.
Principle of operation of HP: (1) evaporation section (heat absorption); (2) saturated vapor travels towards the condenser section; (3) condenser section (heat dissipation); (4) condensate travel towards the evaporation section [2].
HPs are applicable in multiple challenging fields such as thermal energy storage systems, space and terrestrial applications, electronics cooling systems, and medical, military, and solar systems, among others [3,4,5,6,7]. An extensive review on heat pipe technology was conducted by M.J. Gibbons et al. for foldable electronic cooling applications [8].
The manufacturing of HPs involves a number of complex operations and most often requires expensive equipment. Nowadays, most of the HPs used in the above-mentioned industries are manufactured by professional specialized companies, producing large quantities of HPs every day. Therefore, HPs are available to purchase off the shelf and are offered by various vendors, and their price is affordable. These companies usually offer HPs with standard dimensions and working parameters. However, when it is necessary to purchase an HP of unusual size, shape or specifications, then it becomes problematic. Moreover, professional manufacturers usually manufacture HPs on a large scale, but when it is needed to purchase about 200–250 custom-made HPs, it becomes very expensive and only a few producers would accept such small orders. Furthermore, it is possible to manufacture a custom HP using additive manufacturing technology; however, this technology is very new and only allows an HP prototype to be manufactured and does not allow the manufacture of medium-scale quantities (200–250 pieces) [9,10].
The modern world heavily relies on energy in various forms, which is crucial for its functioning. However, the present dependence on fossil fuels for energy consumption is harmful to the environment and contributes to global warming. To address the issue of excessive heat energy consumption, researchers have turned to PCMs as a potential solution for energy storage. In recent years, PCMs have garnered increasing interest in research circles [11]. The main disadvantage of utilizing PCMs is their low thermal conductivity leading to long time of charging and discharging of latent heat thermal energy storages (LHTES). One of the most effective ways to increase heat transfer within the PCM volume is the introduction of highly conductive enhanced surfaces to allow for the increase in heat transfer area and better penetration of the storage medium [12]. What is more, the introduction of devices such as HPs inside the volume of PCM allows for quick thermal response and an even higher heat transfer ratio as compared to a simple copper tube. The combination of HP and PCM applications is mostly visible in such areas as thermal management systems [13,14,15,16], electronic cooling [17,18,19] and solar collectors [20].
While most studies focuses on the utilization of one HP [21,22,23], or a relatively small batch of HPs [24,25] purchased from a producer, this article focuses on a large batch of in-house manufactured HPs. These HPs were manufactured by the authors of this article, and their performance within coconut oil, which serves as a PCM, was evaluated. Their performance was compared using a simple copper pipe as a reference. This reference copper pipe had the same dimensions, but was devoid of a capillary insert and a working medium. This allowed for the further utilization of those HPs in a liquid-based modular electric car battery heat recovery system.
2. Materials and Methods
The aim of the research was to develop a concept for the in-house, low-cost manufacturing of 200 HPs from commercially available materials. Aluminum and copper tubes were preliminary selected as the casing materials for the heat pipes. Due to market availability, copper mesh was selected as the wick.
Various substances, such as SES36, HFE7000, and acetone, were preliminary considered as working fluids for this purpose, but during extensive studies, problems with the occurrence of such phenomena as the ‘geyser effect’ arose, which is characterized by pulsed boiling at low pressures. After evaluating the possibility of using the mentioned substances, acetone was chosen due to its stable pressure amplitude during testing. Figure 2a shows the pressure curve with a visible ‘geyser effect’ when SES36 was used as the working fluid, while Figure 2b shows the stable operation of the heat pipe in this case when the working fluid was acetone.
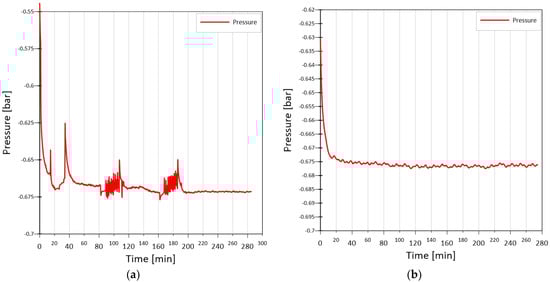
Figure 2.
Pressure curves inside heat pipe: ‘geyser effect’ (a), stable work (b).
Systematic experimental studies have shown that when acetone occupied 36.6% of the volume of the tube, the performance of the heat pipe was at its highest.
Aluminum and copper were considered as the material of heat pipe and wick. Due to the chemical reaction of acetone and aluminum, it was decided to use copper.
Thermophysical properties of acetone [26] are given in Table 1. After preliminary tests, aluminum pipes were abandoned in favor of copper ones. As noted, aluminum pipes chemically reacted with acetone; moreover, the aluminum tube caused the contamination of the copper mesh, which consequently led to the clogging of the mesh.

Table 1.
Thermophysical properties of acetone [26].
The methodology of the heat pipe manufacturing process is presented. The methodology was divided into 8 stages:
- Cutting the pipes to the desired length;
- Cutting the capillary mesh to the given dimensions;
- Inserting the capillary mesh inside the pipe;
- Soldering the pipe-butt and technological connector;
- Cleaning;
- Vacuuming and charging the heat pipes with working liquid;
- Pipe-butt soldering;
- Testing the heat pipe.
2.1. Cutting the Pipes to the Desired Length
As the pipe, a copper pipe with an outer diameter of 6 mm and an inner diameter equal to 4.4 mm was used. In order to cut the tube to the required length, a pipe from a coil was applied to a measuring utensil; the place of cutting was marked; and using a tube cutter, the pipe was cut to a desired length equal to 280 mm. This measuring utensil was fabricated using a desktop FDM 3D printer with PLA filament.
2.2. Cutting the Capillary Mesh to the Given Dimensions
The next stage was to prepare the capillary mesh. For this purpose, a copper mesh with a mesh width of 130 μm, a mesh height of 120 μm, and a wire thickness of 70 μm was used. An SEM photo of the mesh used is shown in Figure 3. The manufacturer supplies mesh in formats with dimensions of 1000 mm wide, 7000 mm high, and 0.15 μm thick.
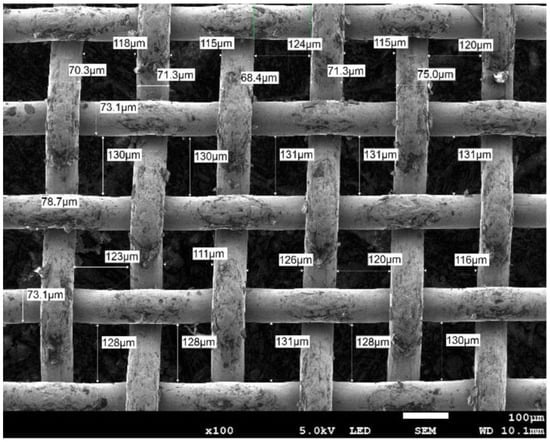
Figure 3.
SEM photo of copper mesh.
The dimensions of the mesh insert were determined according to the following consideration:
The heat pipe has the following dimensions:
Inner diameter ()—4.4 mm;
The active length of the heat pipe ()—265 mm.
The mesh insert was made of a copper mesh with a thickness of 0.15 mm, the dimensions of the mesh insert were determined from the following line of thinking:
The circumference of the inner diameter () of the pipe was determined from the following relationship:
The mesh should adhere exactly to the casing of the pipe. Therefore, the circumference of the tube is equal to the circumference of the mesh, and using the relationship (1), circumference was determined to be equal to 13.8 mm. In addition, the mesh will be bent twice so that two layers of this mesh adhere to each other, therefore the total width of the mesh, to which it must be bent is determined from the relationship:
Therefore, the total width to which the mesh should be cut is equal to 27.6 mm, while the length of the mesh is equal to 260 mm.
In order to repeatedly cut the capillary insert to a desired length and width, a utensil was made using a desktop FDM 3D printer using PLA filament. This utensil allowed for quick mesh cutting.
2.3. Inserting the Capillary Mesh Inside the Pipe
The next step in the production of a heat pipe is to place a capillary insert inside the pipe. For this purpose, it was decided to use a brass rod with a diameter equal to 3 mm and a length equal to 300 mm.
Parallel tests were carried out to select the correct brass rod diameter. A rod with a diameter of equal to 2.5 mm caused the mesh insert to not fully adhere to the pipe wall, especially in the upper section of the pipe. Reducing the diameter of the mesh insert, a rod with a diameter of equal to 4 mm caused too frequent tearing of the capillary insert when inserting it into the tube and the formation of burrs in the mesh.
Placement of the capillary insert inside the tube was carried out in several stages:
- Double winding of the mesh insert on the rod. The mesh should not adhere exactly to the rod, which, in consequence, will ensure accurate adhesion of the capillary mesh to the pipe casing;
- Spot soldering of the mesh with the rod;
- Deburring the tube on the sharp edges;
- Pulling the capillary insert through the tube so that the side soldered to the rod of the mesh insert is flush with one of the edges of the pipe;
- Desoldering the mesh insert with the rod;
- Pulling the rod out of the tube so that the mesh insert remains in the tube. A heat gun was used for this purpose;
- Pulling the rod through the pipe with the mesh insert placed inside again in order to check the permeability of the pipe.
2.4. Soldering the Pipe-Butt and Technological Connector
The next step was to prepare the plug, which is soldered into the pipe on one side. On the other side, a technological connector (Schrader valve) is soldered. This connector will be used to fill the pipe with working liquid. Figure 4 presents a pipe with a mesh insert inside, a Shrader valve on one side, and a butt-end on the other side. The pipe prepared in this way proceeds to the ultrasonic bath in the next stage.
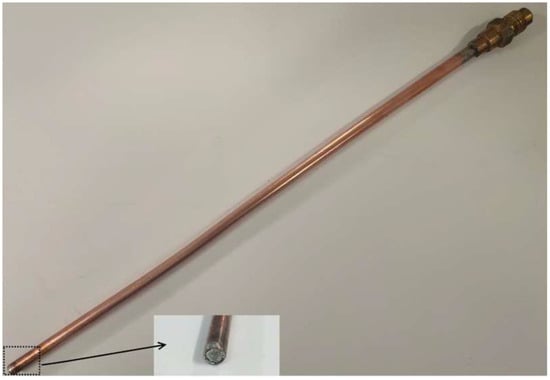
Figure 4.
Photo of a heat pipe with a mesh inserted, soldered with a Shrader valve and a plug.
2.5. Cleaning
Another important step in the manufacturing of heat pipes was cleaning them. For this purpose, an ultrasonic cleaner, made by the Intersonic company, with a frequency of 37 kHz was used. The pipes were cleaned in batches of 10. The pipes were placed in a tightly closed beaker with acetone; then, the glass vessel was placed in an ultrasonic cleaner and cleaned for 30 min. After removing the vessel from the ultrasonic cleaner, the pipes were left in the acetone bath for 15 h.
2.6. Vacuuming and Charging the Heat Pipes with Working Liquid
The amount of working fluid that had to be charged into each tube was set at 36.6% of the pipe volume. This value, as mentioned in Section 2, Materials and Methods, was chosen on the basis of extensive experimental studies on the stability of pressure during the operation of the HP. For this purpose, a copper pipe with an external diameter equal to 6 mm, internal diameter equal to 4.4 mm and an active length equal to 260 mm was used. The entire process of charging the tubes with the working liquid took place in an air-conditioned room, where the ambient temperature was = 20 °C, and the density of acetone at 20 °C is is equal to 0.792 g/cm3.
The volume of the empty pipe charged by the acetone was determined from the following relationship:
and a equal to 1.44 mL was determined.
Therefore, the mass of acetone to be charged in the pipe was determined from the following relationship:
and determined that would be equal to 1.1 g.
To charge heat pipes with the working liquid, a rig had to include:
- Two fittings equipped with a tee, pressure transducer and shut-off valve;
- Two clamps (self-made);
- A liquid nitrogen vessel made of non-thermally conductive material
- Laboratory-precision balance (model Steinberg SBS-LW);
- Two vacuum pumps.
Measuring devices and their parameters are given in Table 2.
Table 2.
Technical parameters of measuring devices used during manufacturing and validation of HPs.
Figure 5 shows the view of the fittings used to flood the heat pipes and control the negative pressure. The fittings consisted of tees, globe valves (model Danfoss BML 6) as well as pressure transducers (models TESTO 549i and TRAFAG DCS6.0AR). The TRAFAG transducer had a built-in display, while the TESTO 549i transducer was connected to the dedicated TESTO software (version 19.1.13.71843) via the Bluetooth wireless network installed on a laptop computer.

Figure 5.
View of the fittings equipped TESTO 549i pressure sensor and a Danfoss BML 6 globe valve (left) and TRAFAG DCS6.0AR pressure transducer and a Danfoss BML 6 globe valves (right).
The charging of heat pipes was carried out according to a strictly followed procedure:
- Assembling the binding on the heat pipe;
- Vacuuming the pipe for 1 min (the pressure transducer indication must show −1 bar);
- Weighing the heat pipe on a laboratory scale, saving the weight indication and removing the binding;
- Charging the heat pipe with 1.4 mL of acetone using a syringe and assembling the binding connector on the heat pipe;
- Weighing the heat pipe on a laboratory scale and saving the weight indication and connecting vacuum pump hose to the binding;
- Placing the heat pipe in a vessel containing liquid nitrogen;
- Filling the vessel with liquid nitrogen;
- Starting the vacuuming of the pipe, and when the indications of the pressure transducer show a pressure of −300 mbar, unscrewing the valve mounted in the fitting and turning on the vacuum pump;
- Vacuuming for 1 min, checking that the liquid nitrogen has not evaporated and filling if required, then closing the binding valve and turning off the vacuum pump;
- Removing the heat pipe from the vessel with liquid nitrogen;
- Heating the heat pipe to an ambient temperature using a heater/heat gun and recording the pressure transducer indication;
- Weighing the heat pipe on a laboratory scale, saving the indications of the scale and pressure transducer;
- Clamping of the heat pipe, at a height of 265 mm using a clamp;
- Unscrewing the fitting from the heat pipe;
- Soldering the heat pipe from the clamp side and removing the clamp;
In Table 3, views of the individual stages of charging the heat pipe with working liquid are shown.
Table 3.
Views of the individual stages of charging the heat pipe with acetone.
Vacuum pressures established for all heat pipes with respect to manufactured heat pipe record numbers are shown in Figure 6 and Figure 7. Figure 6 shows a 2D histogram of obtained data, also called a heatmap, while Figure 7 shows 1D histogram vacuum pressures established in heat pipes, alongside its normal distribution. As can be seen, consistence of pressure values achieved inside the HPs increased during the whole process of manufacturing.
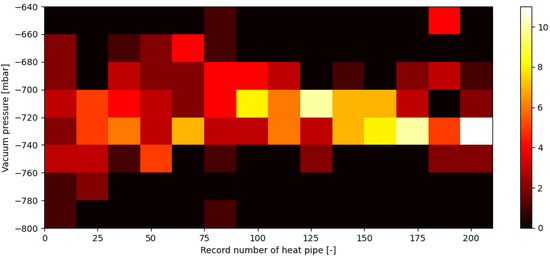
Figure 6.
Vacuum pressures established inside each heat pipe after the vacuuming process (12) with respect to heat pipes’ record numbers on a 2D histogram.
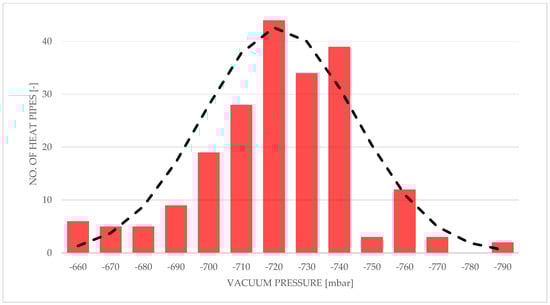
Figure 7.
Histogram of vacuum pressures established inside heat pipes with a normal distribution curve.
The average vacuum pressure established in the entire batch of heat pipes is equal to −721 mbar, with a standard deviation of 23.7.
It should be noted that the following production of heat pipes qualifies as small-scale. The heat pipes will be made primarily with the use of basic workshop tools, supported by 3D printing techniques. This type of production is burdened with a greater range of manufacturing tolerances. The heat pipes were made entirely by hand, without the use of specialized and automated CNC machines, which also affects the repeatability of production.
2.7. Testing the Heat Pipe
In order to preliminary test and verify the heat pipes, a test rig consisting of a thermostat, a heat exchanger, and thermal energy storage was made. The schematic of the test rig is shown in Figure 8.
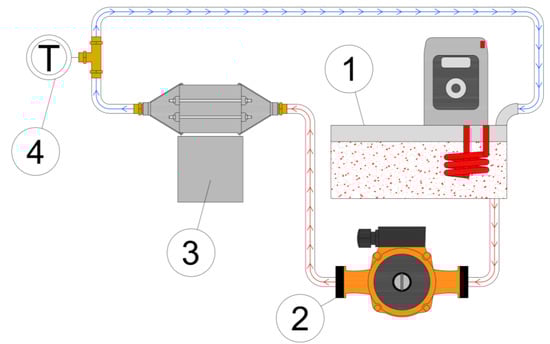
Figure 8.
Diagram of the heat pipe verification station: 1—thermostatic bath; 2—circulating pump; 3—validation module equipped with heat pipes; 4—T-type thermocouple.
The heat exchanger was printed using 3D printing technology using PLA filament. It is a 3-piece construction, glued and fully disassembled. In addition, the heat exchanger is equipped with 4 threaded rods, the purpose of which is to prevent unsealing of the structure. Part 1, the main body, is equipped with 10 threaded glands for heat pipes, while part 2 and part 3 are the inlet and outlet, respectively. Figure 9 shows a diagram of the 3D model, and Figure 10 shows the actual view of the heat exchanger.
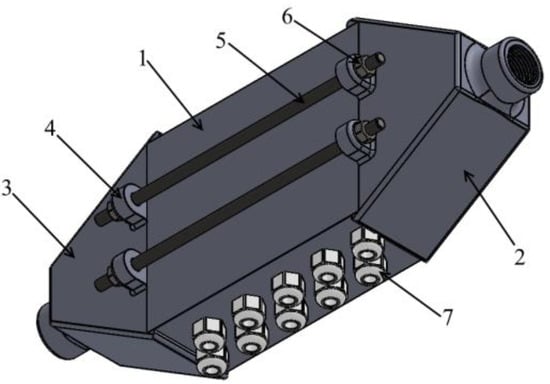
Figure 9.
Diagram of the heat exchanger design: 1—proper body; 2—inlet part; 3—outlet part; 4—fixing brackets; 5—threaded rods; 6—nut; 7—glands fixing heat pipes.
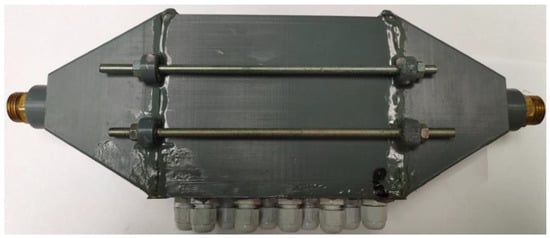
Figure 10.
View of the 3D-printed heat exchanger.
The test thermal storage was made using 3D printing technology, and PLA was used as the material. The thermal storage was equipped with 10 cells with a volume of 47 mL each, which are flooded with coconut oil during the tests. There is only 1 heat pipe in a single cell. Figure 11 shows a diagram of the test heat storage and the cell numeration.
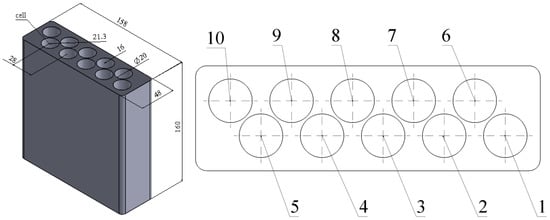
Figure 11.
Test thermal storage dimensions (left) and their cell numeration (right).
The procedure of testing the heat pipes consists of providing a constant level of temperature to the heat pipe evaporator. For this purpose, using a thermostat to heat the water to 40 °C, and then connecting the thermostat pump, water was pumped through the heat exchanger for 35 min. In order to verify the evaporator wall temperature behavior of the heat pipe, the temperature of the junction of the type “T” thermocouple next to the display was monitored on the downstream side of the heat exchanger, which indicated 40 °C ± 0.2 K. Thermal energy storage using coconut oil was used as a heat pipe condenser. At the start of the research, the coconut oil had a temperature of −17 °C and started in a solid state, with the condenser of the tube immersed in coconut oil. The room where the heat pipes were checked was maintained at 20 °C. Ten heat pipes were placed in the experimental module. The heat pipes were verified using the mass method. After observing the tests, melted coconut oil was poured from the thermal heat storage, and then the storage was placed in the refrigerator for 60 min in order to coagulate the coconut oil remaining in the storage.
In the next stage, a test rig equipped with a Steinberg SBS-L W laboratory scale and two beakers were used, as shown in Figure 12. The storage was placed on a tared scale, and each cell of the test thermal storage was flooded with cold water at a temperature of 15 °C, as shown in Figure 13, and weight indications are shown in Figure 14. Then, the weights of individual heat pipes installed in individual cells were compared with the reference heat pipe. If inequality 1 was met, the tube was accepted and ready for use.
where:
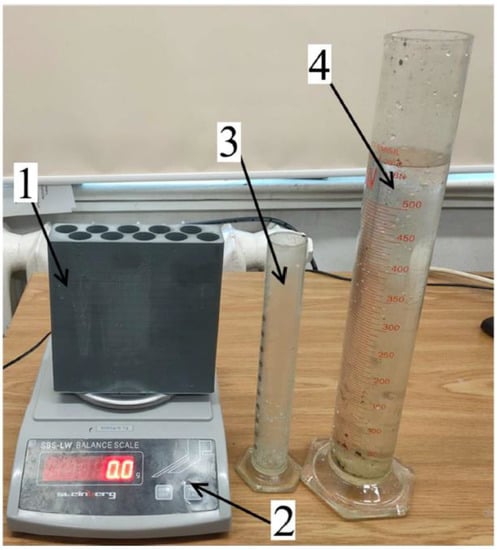
Figure 12.
View of the heat pipe verification station: 1—test thermal storage; 2—precision balance; 3—200 mL laboratory beaker; 4—500 mL beaker.
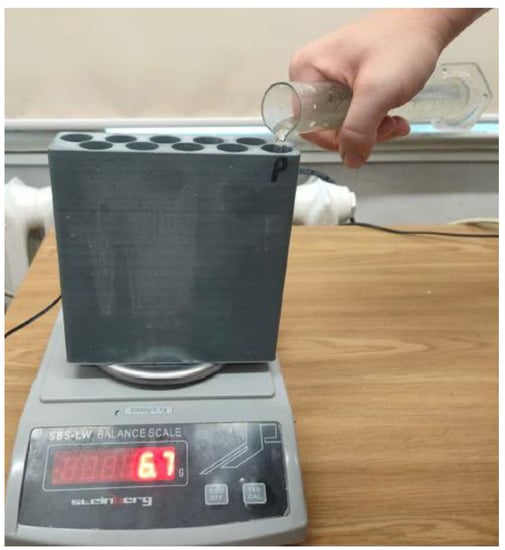
Figure 13.
Charging a cell with water 1.
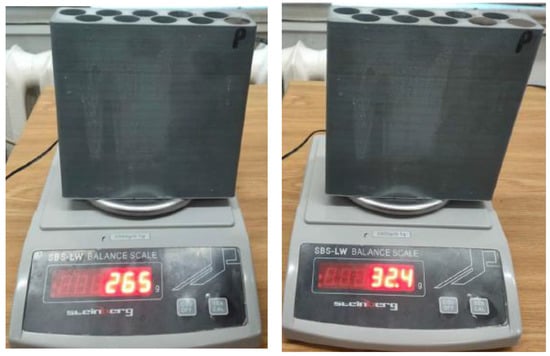
Figure 14.
Weighing water after charging: cell 1 (left) and cell 2 (right).
—mass of water left in cell “” of the heat pipe;
—mass of water left in the cell of the empty heat pipe.
In order to determine the references for each of the cells of the proposed thermal energy storage, 10 blind copper tubes were prepared, devoid of a capillary insert and a working medium. The test was performed three times, reproducing the procedure for heat pipes. Then, the results for each cell were averaged. Data from reference measurements of heat pipes are presented in Table 4.
Table 4.
List of references for individual purposes.
In order to allow for comparison between the results of the heat pipe and a reference pipe, an improvement factor has been proposed:
—mass of water after flooding the cell “” during heat pipe number “” validation [g];
—mass of water after flooding cell “” for the average reference heat pipe number “” [g];
—improvement factor [%].
The improvement factor is intended to show the percentage increase in the more efficient operation of a given heat pipe compared to an empty pipe for a specific cell.
3. Results
After the evaluation of each heat pipe in the validation module, a comparison was made between heat pipes and reference pipes using the above-mentioned improvement factor . After obtaining data for improvement factor , a simple statistical analysis was performed. The results of this analysis are shown in Figure 15 and Figure 16. Figure 15 shows a 2D histogram of the obtained data, also called a heatmap. This figure shows a history of the improvement factor value density during the process and shows an overall good consistency. Figure 16 shows a 1D histogram of heat pipes’ improvement factor , alongside its normal distribution.
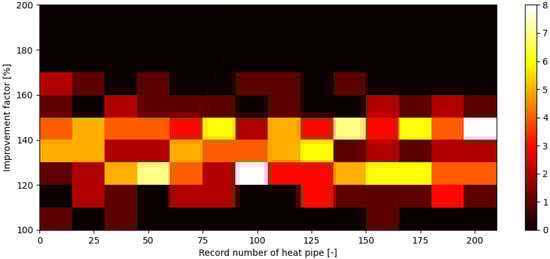
Figure 15.
Improvement factor for each heat pipe with respect to heat pipes’ record numbers on a 2D histogram.
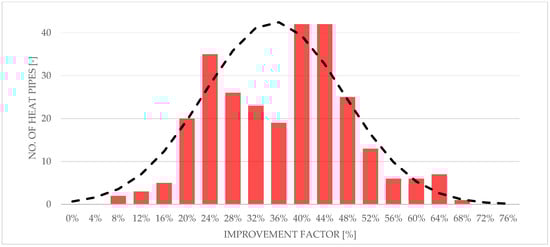
Figure 16.
Histogram of improvement factor of heat pipes with a normal distribution curve.
The total mass of the manufactured heat pipes with respect to their record number in manufacturing order is shown in Figure 17 in the form of a heatmap. It should be mentioned that all heat pipes were manufactured using the same template tube, which is a 285 mm long copper pipe with an external diameter of 6 mm and thickness of 0.8 mm, but heat pipes of numbers from #155 to #210 were manufactured using stock copper tubes provided by a different supplier. Figure 18 shows the 1D histogram of the total mass of manufactured heat pipes. This figure shows, as it were, a history of the total mass of heat pipes during the process and shows an overall good consistency.
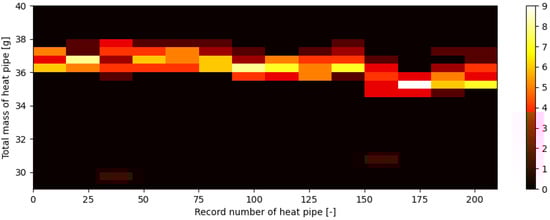
Figure 17.
Total mass of heat pipe with respect to heat pipes’ record numbers on a 2D histogram.
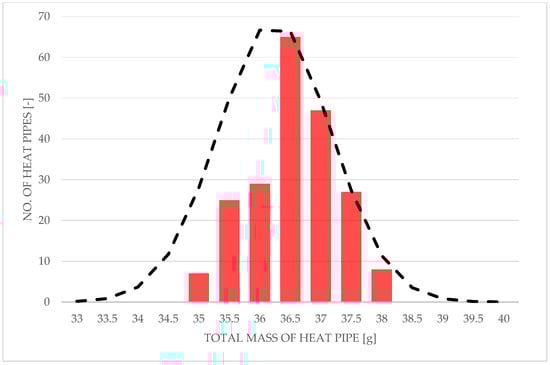
Figure 18.
Histogram of the total mass of heat pipes with a normal distribution curve.
4. Discussion
In this paper, an in-house, low-cost heat pipe manufacturing method was developed and thoroughly described. This method allowed for the piece production of 210 heat pipes. This batch is shown in Figure 19. The cost-efficiency of this method makes it perfect for cooling applications, especially in developing countries. The validation of the heat pipes showed promising results, and it is believed that utilization of more sophisticated methods and tools would even further improve their performance.
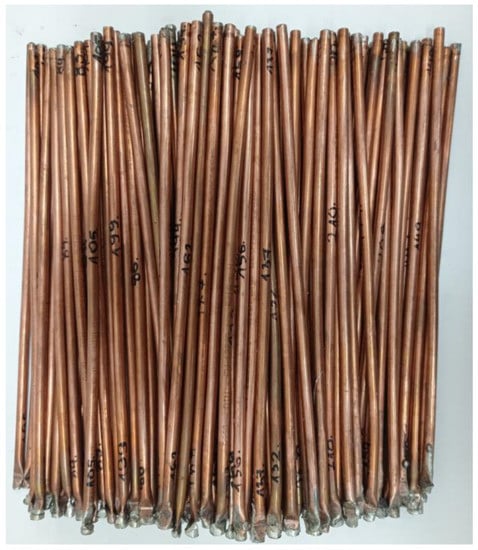
Figure 19.
View of all 210 manufactured heat pipes.
According to the analysis out of a total of 210 heat pipes, 189 heat pipes achieved an improvement factor of not less than 120%, and 20 heat pipes achieved an improvement factor of not less than 150%. The average melting enhancement coefficient for this batch was equal to 135% with a standard deviation equal to 12. Due to employing a low-thermal-conductivity material, namely PLA, as the material of the test thermal storage, no significant impact of HP location within the experimental module cells was found (see Figure 11).
Technical parameters of those heat pipes, such as their mass and vacuum pressure inside, were checked and showed good consistency (Figure 5 and Figure 16), and only minor geometrical corrections were made using a polishing machine to enable their further application. It is worth noting that the consistency of the technical parameters increased with the progress of the manufacturing process. The consistency increased due to skill improvement of the team member who manufactured the HPs over time.
The next step in this research is to evaluate the HPs’ performance under realistic working conditions, which is in heat recovery systems in electric car batteries using a modular liquid-based system. For this purpose, a prototype of a modular liquid-based heat recovery system was designed and manufactured in-house using FDM 3D printing technology. A research stand allowing for the charging and discharging of sixteen 7.2 V electric car batteries was also prepared.
Author Contributions
M.R.: Validation, investigation, data curation, visualization, writing—review and editing; M.F.: validation, investigation, data curation, visualization, methodology; P.S.: writing—original draft preparation, writing—review and editing; R.A.: conceptualization, methodology, supervision, project administration, funding acquisition, formal analysis. All authors have read and agreed to the published version of the manuscript.
Funding
This research received no external funding.
Institutional Review Board Statement
Not applicable.
Informed Consent Statement
Not applicable.
Data Availability Statement
All data presented in the paper can be available upon contact with the authors.
Conflicts of Interest
The authors declare no conflict of interest.
Nomenclature
| d | diameter [m] |
| C | circumference [m] |
| L | length [m] |
| m | mass [kg] |
| p | pressure [Pa] |
| T | temperature [°C] |
| w | width [m] |
| Abbreviations | |
| HP | Heat pipe |
| PLA | Polylactic acid |
| FDM | Fused deposition modelling |
| PCM | Phase-change material |
| SEM | Scanning Electromagnetic Microscope |
| Subscripts | |
| out | outside |
| in | Inside |
| act | active |
| v | Vacuum |
| r | rod |
| e | empty |
References
- Reay, D.; McGlen, R.; Kew, P. Heat Pipes: Theory, Design and Applications, 6th ed.; Butterworth-Heinemann: Oxford, UK, 2013; pp. 1–251. [Google Scholar]
- McDonough, J. A perspective on the current and future roles of additive manufacturing in process engineering, with an emphasis on heat transfer. Therm. Sci. Eng. Prog. 2020, 19, 100594. [Google Scholar] [CrossRef]
- Zohuri, B. Heat Pipe Design and Technology: Modern Applications for Practical Thermal Management, 2nd ed.; Springer: New York, NY, USA, 2016. [Google Scholar] [CrossRef]
- Szymanski, P.; Mikielewicz, D. Additive Manufacturing as a Solution to Challenges Associated with Heat Pipe Production. Materials 2022, 15, 1609. [Google Scholar] [CrossRef] [PubMed]
- Szymanski, P.; Mikielewicz, D.; Fooladpanjeh, S. Current Trends in Wick Structure Construction in Loop Heat Pipes Applications: A Review. Materials 2022, 15, 5765. [Google Scholar] [CrossRef] [PubMed]
- Wrobel, R.; McGlen, R.J. Opportunities and Challenges of Employing Heat-Pipes in Thermal Management of Electrical Machines. In Proceedings of the 2020 International Conference on Electrical Machines (ICEM), Gothenburg, Sweden, 23–26 August 2020. [Google Scholar] [CrossRef]
- Zhang, Y. Heat Pipes: Design, Applications and Technology; Nova Science Publishers: Hauppauge, NY, USA, 2018. [Google Scholar]
- Gibbons, M.J.; Marengo, M.; Persoons, T. A review of heat pipe technology for foldable electronic devices. Appl. Therm. Eng. 2021, 194, 117087. [Google Scholar] [CrossRef]
- Ameli, M.; Agnew, B.; Leung, P.; Ng, B.; Sutcliffe, C.; Singh, J.; McGlen, R. A novel method for manufacturing sintered aluminium heat pipes (SAHP). Appl. Therm. Eng. 2013, 52, 498–504. [Google Scholar] [CrossRef]
- Jafari, D.; Wits, W.W.; Geurts, B.J. Metal 3D-printed wick structures for heat pipe application: Capillary performance analysis. Appl. Therm. Eng. 2018, 143, 403–414. [Google Scholar] [CrossRef]
- Saqib, M.; Andrzejczyk, R. A review of phase change materials and heat enhancement methodologies. In Wiley Interdisciplinary Reviews: Energy and Environment; John Wiley and Sons Ltd.: Hoboken, NJ, USA, 2022. [Google Scholar] [CrossRef]
- Rogowski, M.; Andrzejczyk, R. Recent advances of selected passive heat transfer intensification methods for phase change material-based latent heat energy storage units: A review. Int. Commun. Heat Mass Transf. 2023, 144, 106795. [Google Scholar] [CrossRef]
- Abdelkareem, M.A.; Maghrabie, H.M.; Abo-Khalil, A.G.; Adhari, O.H.K.; Sayed, E.T.; Radwan, A.; Rezk, H.; Jouhara, H.; Olabi, A. Thermal management systems based on heat pipes for batteries in EVs/HEVs. J. Energy Storage 2022, 51, 104384. [Google Scholar] [CrossRef]
- Behi, H.; Karimi, D.; Gandoman, F.H.; Akbarzadeh, M.; Khaleghi, S.; Kalogiannis, T.; Hosen, S.; Jaguemont, J.; van Mierlo, J.; Berecibar, M. PCM assisted heat pipe cooling system for the thermal management of an LTO cell for high-current profiles. Case Stud. Therm. Eng. 2021, 25, 100920. [Google Scholar] [CrossRef]
- Peng, P.; Wang, Y.; Jiang, F. Numerical study of PCM thermal behavior of a novel PCM-heat pipe combined system for Li-ion battery thermal management. Appl. Therm. Eng. 2022, 209, 118293. [Google Scholar] [CrossRef]
- Ling, Y.Z.; She, X.H.; Zhang, X.S.; Chen, T.T.; Lin, X.R.; Feng, J.K. A PCM-based thermal management system combining three-dimensional pulsating heat pipe with forced-air cooling. Appl. Therm. Eng. 2022, 213, 889–900. [Google Scholar] [CrossRef]
- Ali, H.M. Applications of combined/hybrid use of heat pipe and phase change materials in energy storage and cooling systems: A recent review. J. Energy Storage 2019, 26, 100986. [Google Scholar] [CrossRef]
- Krishna, J.; Kishore, P.; Solomon, A.B. Heat pipe with nano enhanced-PCM for electronic cooling application. Exp. Therm. Fluid Sci. 2017, 81, 84–92. [Google Scholar] [CrossRef]
- Krishna, J.; Kishore, P.; Solomon, A.B. Heat transfer performance of a novel PCM based heat sink coupled with heat pipe: An experimental study. Appl. Therm. Eng. 2023, 229, 120552. [Google Scholar] [CrossRef]
- Pawar, V.R.; Sobhansarbandi, S. Heat transfer enhancement of a PCM-porous metal based heat pipe evacuated tube solar collector: An experimental study. Sol. Energy 2023, 251, 106–118. [Google Scholar] [CrossRef]
- Motahar, S.; Khodabandeh, R. Experimental study on the melting and solidification of a phase change material enhanced by heat pipe. Int. Commun. Heat Mass Transf. 2016, 73, 1–6. [Google Scholar] [CrossRef]
- Behi, H.; Behi, M.; Ghanbarpour, A.; Karimi, D.; Azad, A.; Ghanbarpour, M.; Behnia, M. Enhancement of the thermal energy storage using heat-pipe-assisted phase change material. Energies 2021, 14, 6176. [Google Scholar] [CrossRef]
- Behi, H.; Ghanbarpour, M.; Behi, M. Investigation of PCM-assisted heat pipe for electronic cooling. Appl. Therm. Eng. 2017, 127, 1132–1142. [Google Scholar] [CrossRef]
- Tian, S.; Yang, Q.; Hui, N.; Bai, H.; Shao, S.; Liu, S. Discharging process and performance of a portable cold thermal energy storage panel driven by embedded heat pipes. Energy 2020, 205, 117987. [Google Scholar] [CrossRef]
- Liu, Z.; Quan, Z.; Zhao, Y.; Jing, H.; Liu, X.; Wang, L. Experimental research on the performance of ice thermal energy storage device based on micro heat pipe arrays. Appl. Therm. Eng. 2021, 185, 116452. [Google Scholar] [CrossRef]
- Lemmon, E.W.; Bell, I.H.; Huber, M.L.; McLinden, M.O. NIST Standard Reference Database 23: Reference Fluid Thermodynamic and Transport Properties-REFPROP, version 10.0; National Institute of Standards and Technology: Gaithersburg, MD, USA, 2018. [Google Scholar]


Disclaimer/Publisher’s Note: The statements, opinions and data contained in all publications are solely those of the individual author(s) and contributor(s) and not of MDPI and/or the editor(s). MDPI and/or the editor(s) disclaim responsibility for any injury to people or property resulting from any ideas, methods, instructions or products referred to in the content. |
© 2023 by the authors. Licensee MDPI, Basel, Switzerland. This article is an open access article distributed under the terms and conditions of the Creative Commons Attribution (CC BY) license (https://creativecommons.org/licenses/by/4.0/).