Abstract
The cruise shipping industry has a steadfast commitment to the environmentally sustainable operation of ships through many initiatives to reduce greenhouse gas emissions. This paper presents a forecast analysis of the emission inventory of NOx, SO2, and CO2 during the sailing phase associated with cruise routes in the Western Mediterranean. Five scenarios were raised to obtain projections about future emissions considering the evolution of cruise traffic; the implementation of the Sulfur Emission Control Area (SECA) in the Mediterranean by 1 May 2025, and variations in the specific fuel consumption of the engines of the cruise ships. To this extent, a time series of cruise calls during 2019 in Mediterranean ports is used to identify the main routes and their associated emission inventory. Network analysis is applied to identify the routes associated with the cruise calls, and the emission inventory is estimated using a bottom-up approach. A total of 292 cruise routes were identified. The estimations reveal that the emissions of the cruise activities assessed are approximately equivalent to 0.58% of NOx, 0.28% of SO2, and 1% of CO2 of the entirety of the emissions associated with maritime transport at the European level in 2019. The projection of the scenario with the highest cruise activity and the SECA being enforced leads to a reduction of 77% of the emissions of SO2 considering the activity of 2019. The research conducted enables us to assess the environmental impact of the intense cruise ship activity registered in the Mediterranean and the positive footprint of the implementation of new regulations on emissions.
1. Introduction
The environmentally sustainable operation of ships is a key goal for the shipping industry. The International Maritime Organisation (IMO) is actively working towards the 2030 Agenda and is contributing to the implementation of the Sustainable Development Goals (SDGs) both through providing the legislative framework for international shipping that enables sustainable development and through specific capacity-building activities. SDG13 (climate change) is identified as one of the most impactful areas of its work [1].
Cruise lines, as part of the shipping industry, are concerned about the environmentally sustainable operation of ships and about achieving the goals of the 2030 Agenda, among which SDG13 stands out. The cruise industry has an ambitious environmental agenda seeking the long-term sustainability of the industry. Accordingly, the global cruise industry has many initiatives to reduce greenhouse gas (GHG) emissions. For instance, it has the commitment to reduce the rate of carbon emissions across the industry fleet by 40 per cent by 2030 [2]. In addition, achieving a net zero carbon cruising footprint by 2050 is among the environmental goals pursued by the industry.
The cruise industry was hard hit by the COVID-19 pandemic, with an unprecedented stoppage of cruise fleets in March 2020. The cessation of operations of the cruise fleet had many negative consequences, among which are the bankruptcy of some cruise lines, such as Pullmantur Cruises or FTI Berlin, and the early scrapping of 16 vessels by the end of 2021 (most of them very elderly). An immediate consequence of the COVID-19 outbreak was a decline in worldwide cruise passenger volume from 29.7 million in 2019 to 5.8 million and 4.8 million in 2020 and 2021, respectively [3].
The Caribbean Sea is the worldwide leader in terms of deployed capacity and maintained its leadership even during the pandemic period. In 2019, the deployed capacity in the Caribbean Sea was at 38.7%, while in 2020 and 2021, it was at 49.6% and 35.8%, respectively. The Mediterranean continued as the second-largest cruise destination also during the pandemic period. It registered a deployed capacity of 14.8% in 2019 (the pre-pandemic year). The pandemic outbreak lowered the share of the Mediterranean to 9.3% of the worldwide capacity in 2020, while in 2021, the share was at 20% [4,5]. The extremely low deployed capacity in 2020 is because the pandemic outbreak started at the gates of the peak season in the Mediterranean.
Fortunately, as a sign of the resilience of the cruise industry, its recovery is close, as cruise traffic performance indicators in 2022 showed; see Table 1 and Table 2. It is expected that by 2023, the industry will recover the volume registered in 2019. Moreover, forecasts indicated that in 2023 the cruise industry would surpass the passenger volume of 2019 [6]. In this recovery scenario, compliance with the environmental objectives set by the 2030 Agenda and the commitment made by the cruise industry in this regard cannot be forgotten.
The environmental impact of cruise ship activity is associated with multiple sources: liquid and solid waste, garbage generated by its activity, and emissions of polluting gases. The International Convention for the Prevention of Pollution from Ships (MARPOL 73/78) is the core regulation worldwide to limit the pollution from ship activities [7]. Annex VI of MARPOL 73/78 is the main international regulation for the prevention of air pollution from ships through the limitation of SOx and NOx emissions. Moreover, focusing on Europe, the Directive (EU) 2016/802 limits the sulfur content of certain liquid fuels [8]. The current limit of 0.5% of the content of sulfur for marine fuel entered into force on 1 January 2020 [9]. Regarding the Mediterranean, in December 2022, it was designated as an emission control area for sulfur oxides, which will enter into force on 1 May 2025 [10]. This means that the permissible sulfur content of the marine fuel to be used will fall from the current limit of 0.5% to 0.1%. This work focuses on the emissions of polluting gases from cruise ships in the Western Mediterranean, specifically through an estimation of the emission inventory of NOx, SO2, and CO2 during navigation.

Table 1.
Cruise passenger movements (in millions) per Mediterranean region from 2015 to 2022.
Table 1.
Cruise passenger movements (in millions) per Mediterranean region from 2015 to 2022.
| Year | ||||||||
|---|---|---|---|---|---|---|---|---|
| Region | 2015 | 2016 | 2017 | 2018 | 2019 | 2020 | 2021 | 2022 |
| Western Mediterranean | 17.37 | 17.89 | 17.49 | 19.07 | 20.83 | 1.28 | 3.69 | 15.44 |
| Adriatic Sea | 4.49 | 4.70 | 4.45 | 4.89 | 5.43 | 0.03 | 0.84 | 3.02 |
| Eastern Mediterranean | 3.03 | 2.22 | 1.75 | 1.64 | 2.36 | 0.08 | 0.58 | 2.24 |
| Total | 24.89 | 24.81 | 23.69 | 25.60 | 28.62 | 1.39 | 5.11 | 20.70 |
Source: Authors’ elaboration based on [5,11].
Table 2.
Cruise ship calls per Mediterranean region from 2015 to 2022.
Table 2.
Cruise ship calls per Mediterranean region from 2015 to 2022.
| Year | ||||||||
|---|---|---|---|---|---|---|---|---|
| Region | 2015 | 2016 | 2017 | 2018 | 2019 | 2020 | 2021 | 2022 |
| Western Mediterranean | 6919 | 7251 | 6968 | 7394 | 7495 | 613 | 2512 | 7501 |
| Adriatic Sea | 2544 | 2919 | 2596 | 2683 | 3019 | 148 | 878 | 2553 |
| Eastern Mediterranean | 2197 | 1522 | 1148 | 1057 | 1550 | 129 | 779 | 2292 |
| Total | 11,660 | 11,692 | 10,712 | 11,134 | 12,064 | 890 | 4169 | 12,346 |
Source: Authors’ elaboration based on [5,11].
The Mediterranean Sea is almost totally enclosed by three continents and hosts intense cruise activity, as its performance indicators reflect; see Table 1 and Table 2. The Western part stands out as it accounts for more than 70% of the cruise activity of the whole Mediterranean. The features of the cruise traffic in the Mediterranean as the second-largest cruise destination region worldwide, the high cruise activity registered in the Western Mediterranean, and the designation of its waters as an Emission Control Area in 2025 motivate research on the forecast of emissions from cruise ships during sailing on Western Mediterranean itineraries.
This article aims to provide a gas emission inventory of cruise traffic in the Western Mediterranean as a basis for future policies and measures to be implemented on the horizon of the future enforcement of the SECA (Sulphur Emission Control Area) in the Mediterranean in 2025. To meet this goal, first, the cruise shipping network in the Western Mediterranean is analysed to identify the main routes, and next, through a bottom-up approach, the cruise activity of the main cruise routes is quantified as the basis to provide the estimation of the emission inventory. In addition, projections of the gas emissions from cruise activity in the Western Mediterranean are proposed for the time frame of 2023–2025 based on five scenarios that consider the evolution of the cruise traffic, the implementation of the SECA in the Mediterranean, and variations in the specific fuel consumption of cruise ships. Detailed inventories of cruise ship exhaust gas emissions can provide a scientific basis for making regulations to limit ship emissions, assess the current regulations, and/or take corrective action.
The remainder of this article is organised as follows. The second section provides a literature review of analyses of shipping networks and methods to estimate shipping emission inventory. Section 3 explains the methodology applied in this research. Section 4 reports on the results of gas emission inventories associated with cruise routes in the Western Mediterranean and forecasts of emissions for the period of 2023–2025. Section 5 deals with the implications of the results and future research directions. Finally, Section 6 includes concluding remarks.
2. Literature Review
The key element of cruise shipping is the cruise itinerary system. A cruise itinerary is composed of the sum of the ports of call plus one or two homeports, depending on whether the itinerary is closed or open type, respectively. Once the cruise vessel is deployed in a given destination region, it will sail in regular itineraries for the duration of the season. From the network analysis point of view, a cruise itinerary is composed of nodes (ports) and edges or links (shipping routes) between pairs of nodes due to the activity of ships.
There are several techniques to exhibit network connectivity in maritime transport. The use of SNA (Social Network Analysis) and centrality measures to analyse shipping networks have been applied by several authors. A wide range of works has applied centrality measures as tools to analyse shipping networks [12,13,14]. Cruise shipping networks have also been analysed through centrality measures; for instance, Jeon et al. [15] developed a numerical analysis of hub ports in cruise shipping to explain the regional dynamics of the regional cruise industry; Kanrak and Nguyen [16] used network measures and random network models to analyse the structure, characteristics, and connectivity of the Asian–Australasian cruise shipping network; Ito et al. [17] investigated structural changes in the cruise network by ship size in Northeast Asia by combining network science methods and data on cruise ship movement; and, Lopez Rodriguez et al. [18] conducted research into cruise port interconnections and their influence on the operation of the entire Caribbean port network.
The gas emissions of cruise ships can be associated with three different operation phases: navigation, manoeuvring, and mooring. The navigation phase evaluates the gas emissions derived from ships’ activities at sea. The manoeuvring phase corresponds to the gas emissions during the approach to and departure from the cruise terminal. The mooring phase includes the gas emissions of hoteling and embarking/disembarking of passengers. In each phase, the energy requested by the main engine/s and auxiliary engine/s is different; therefore, the emissions have large variations. The impact of ship emissions is on a global, regional, and local scale, respectively. The first and second scales mainly concern emissions during the navigation phase, and the third concerns the manoeuvring and mooring phases. This research focuses on the navigation phase, considering the regional impact of emissions associated with the main cruise routes in the Western Mediterranean.
Following Miola and Ciuffo [19], two parameters must be considered when evaluating air emissions due to maritime transport, namely, the amount of gas emissions and where they are produced. Generally, there are two different approaches to estimating emission inventories: top-down (fuel-based) and bottom-up (activity-based). The fuel-based approach is one of the top-down approaches for creating ship exhaust gas emission inventories, in which the amounts of ship gas emissions are calculated based on the total fuel consumption and fuel emission factors. In a top-down approach, total emissions are calculated without considering the vessels’ characteristics. The accuracy of fuel-based approach total emissions is limited by uncertainty in global estimates, and representative bias of spatial proxies limits the accuracy of emission assignment [20]. The bottom-up approach uses technical information about ships and ships’ activities to estimate ship gas emissions. This approach is much more accurate, but significant efforts need to be made for data collection and analysis [21].
The ship activity-based approach has been applied in a wide range of works to assess the emission inventory at different phases of ship operation [22,23,24,25]. In the specialised literature, one can find research works focusing on the emission inventory of ships during the manoeuvring and mooring phases, such as the works of Castells Sanabra et al. [26], Chang et al. [27], Deniz et al. [28], and Song [29]. Specifically, Tichavska and Tovar [30], Dragović et al. [22], and Papaefthimiou et al. [31] conducted investigations devoted to the emission inventory of cruise ships in port. However, research works focusing on the emission inventory of cruise ships at sea are not numerous; some examples are as follows: Howitt et al. [32] researched international cruise ship journeys to and from New Zealand; Simonsen et al. [33] proposed a model for calculating fuel consumption associated with cruise ships that sail to Norwegian waters, which can be used to estimate greenhouse gas emissions; and Iannaccone et al. [25] assessed the sustainability of cruise ship fuel systems.
3. Materials and Methods
The research conducted can be divided into four steps. First, identification of cruise routes in the Western Mediterranean using network analysis techniques. Second, technical characterisation of the vessels deployed on each identified route. Third, estimation of the gas emission inventory through a ship activity-based approach. Finally, forecasts of emissions were carried out considering five scenarios for the evolution of cruise traffic in the Western Mediterranean. A schematic representation of the process addressed during the research carried out is shown in Figure 1.
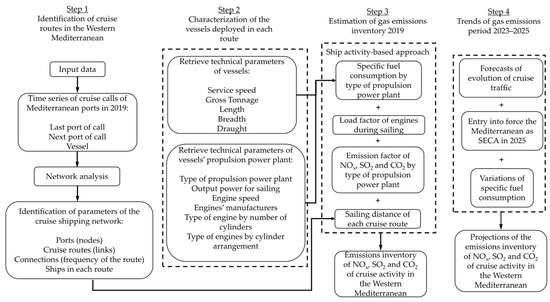
Figure 1.
Schematic representation of the research carried out.
The input data to perform the research were the time series of cruise ship calls in 2019 of 10 Mediterranean ports. The year 2019 was selected as a reference year to conduct the research because it is the last available with high-performance indicators for cruise activity. The aim of the research is to provide an estimation of gas emission inventory not affected by the restrictions imposed by the pandemic during the period of 2020–2022. Specifically, the database is composed of the cruise ship calls registered in the ports of Barcelona, Gibraltar, Ibiza, Katakolo, Livorno, Mahón, Málaga, Palma de Mallorca, Santorini, and Valencia. The data were retrieved from the Port Authorities’ websites [34,35,36,37,38,39,40]. For each call registered, the database is composed of the vessel name and the last and next port of call. The data were unified to create a common database with all the calls.
In the first step, cruise routes in the Western Mediterranean were identified through the application of network analysis. The investigation of network connectivity addresses the association between nodes (cruise ports) in a network that are connected by links between them (cruise routes). The last and next ports of call are the data necessary to obtain the nodes and links between them of the cruise shipping network.
Octave software (www.octave.org, accessed on 12 January 2023) was used to calculate network parameters, and Ucinet 6.0 [41] was also used to both calculate network parameters and graphically represent the main cruise routes.
Once the main routes were identified, the second step was to characterise, from a technical point of view, the cruise fleet deployed on the routes. For each vessel, the following technical parameters were retrieved: length (L), breadth (B), draught (T), gross tonnage (GT), service speed (S), type of propulsion machinery, and total output power for sailing (P). For this purpose, each vessel was characterised by searching in specialised databases, such as Significant Ships [42] or Vessel Finder [43]. A total of 158 different vessels sailed on the routes analysed. Six types of propulsion power plants were identified: low-speed diesel engine, medium-speed diesel engine, high-speed diesel engine, gas turbine, combined diesel engine and gas turbine (CODAG), and combined diesel engine and sails. Figure 2 shows the distribution of type of propulsion power plant among the fleet analysed. A total of 83.5% of the fleet had medium-speed diesel engines installed. In the case of the two vessels equipped with the CODAG system, the power of each engine was retrieved with the aim of estimating the emissions associated with each of them. Specifically, for both vessels, the CODAG system is equipped with medium-speed engines. For the seven vessels equipped with diesel engines and sails, the most unfavourable condition from the environmental point of view was considered; that is, sailing with the diesel engine, as the seven vessels had high-speed engines.
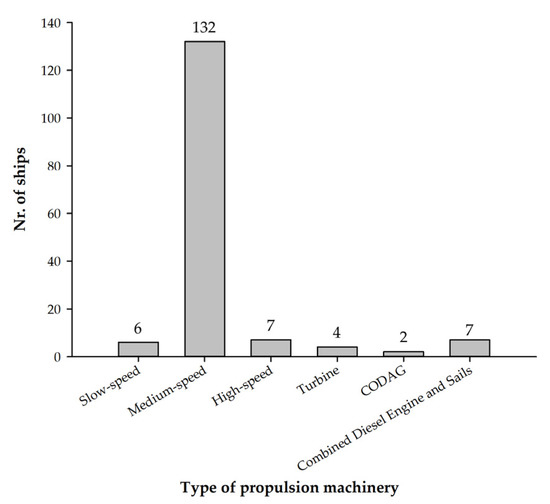
Figure 2.
Distribution of type of propulsion machinery among the cruise fleet analysed.
Figure 3 summarises the range of output power of the propulsion machinery of the fleet analysed. A total of 77.2% of the fleet is in the range between 10,001 and 70,000 kW.
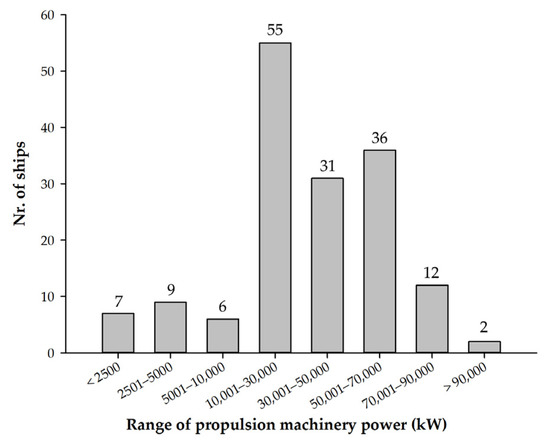
Figure 3.
Distribution of propulsion machinery power among the cruise fleet analysed.
Almost all the ships analysed feature a diesel–electric propulsion form. Specifically, the propulsion power plant is equipped with several engines. The most common configuration of power plants is composed of four engines; see Table 3. Additionally, part of the fleet analysed has up to six engines for propulsion purposes. Moreover, generally, all the engines of the propulsion power plant are of the same manufacturer. In this regard, Wärtsilä stands out among the manufacturers of marine engines installed in the sample of cruise vessels analysed; see Table 4. Few propulsion power plant configurations were identified with a combination of two different marine engine manufacturers, such as the combination of Caterpillar and MaK or Wärtsilä and Caterpillar engines.
Table 3.
Distribution of the cruise fleet analysed by number of engines installed for propulsion.
Table 4.
Distribution of the cruise fleet analysed by engine manufacturer.
Furthermore, a variety of configurations regarding the number of cylinders and their arrangement in the engines installed on cruise ships can be found. Four types of configurations were identified: all the engines of the propulsion power plant have the same number of cylinders, and all of them have a V-type (V) cylinder arrangement; all the engines of the propulsion power plant have the same number of cylinders, and all of them have an in-line type (L) cylinder arrangement; all the engines of the propulsion power plant have a V-type cylinder arrangement, combining engines of different numbers of cylinders; and the propulsion power plant is composed of both engines of V-type and in-line type cylinder arrangement. The V12 engine is the most common engine installed on the cruise fleet analysed, followed by the V16 and L8 engines; see Table 5. In the case of propulsion power plants with the V-type and in-line type cylinder arrangements, the most common scheme is the V12 and L8 arrangements, with 15 ships having this configuration.
Table 5.
Distribution of the cruise fleet analysed by number and arrangement of the cylinders of the engines installed.
Once the type of propulsion machinery and output power for navigation of the fleet was available, the third step was to estimate the gas emission inventory. The inventory was performed for sailing at the service speed corresponding to 85% of the maximum continuous rating (MCR) of the engine.
The activity of the cruise ships is modelled through Equation (1) to estimate the emission quantity of SO2, NOx, and CO2. Equation (1) is applied to each vessel on each route, also considering the number of connections. Similar approaches can be found in the works of Simonsen et al. [33] and El-Taybany et al. [44].
where Ei is the propulsion machinery emission during sailing (kg), P is the propulsion machinery output power (kW), Lf is the load factor for main engines (in this case 0.85), Ta is the activity duration (h), Ef (i) is the emission factor (kg/kgfuel) of pollutant i, which are SO2, NOx, and CO2, respectively, and SFC is the specific fuel consumption (kg/kW·h).
Ei = P · Lf · Ta · Ef (i) · SFC,
Following the research of Endresen et al. [45], the emission factor and specific fuel consumption factor by propulsion machinery type are summarised in Table 6. They are used in the estimation of the gas emission inventory.
Table 6.
Emission factor and specific fuel consumption factor by propulsion machinery type.
4. Results
4.1. Cruise Routes in the Western Mediterranean
The sample of ports analysed led to 4081 connections. Moreover, the cruise port network analysed is composed of 292 cruise routes (links) connecting 98 ports (nodes) associated with 47 cruise lines and 158 vessels. The routes registered in the Western Mediterranean during 2019 follow the Pareto 80/20 rule; namely, a small number of routes contain most of the connections. Specifically, 28.8% (84 routes) of all the routes registered a number of connections equal to or greater than 10, and cumulatively, they represented 85.7% (3497 connections) of all connections. Next, the emission inventory is estimated by considering all the routes identified to achieve the most accurate results.
Figure 4 shows the graphical results of routes (links) by pair of ports (nodes) with equal or higher than 10 connections of the cruise shipping network of the Western Mediterranean, which are obtained through network analysis. In addition, the ports (nodes) of the routes with less than 10 connections are represented.
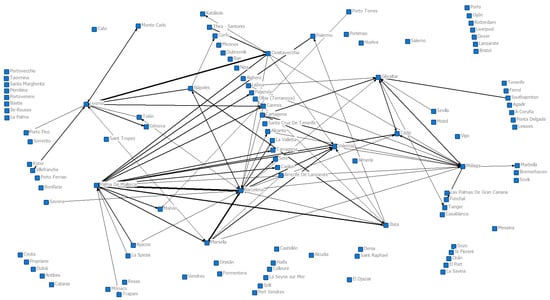
Figure 4.
Cruise routes with 10 or more connections during 2019 in the cruise port network of the Western Mediterranean. Note: The thickness of the lines indicates the traffic intensity (no. of connections) in each route. Source: Authors’ elaboration.
4.2. Estimation of the Gas Emission Inventory
The vessel(s) that sailed on each route is (are) identified. Then, the number of connections that each route has and the sailing distance are calculated. The distance of each cruise route was determined using website tools, such as https://sea-distances.org/ (accessed on 24 May 2023) or http://www.searates.com/reference/portdistance/ (accessed on 29 May 2023). To avoid an overestimation of the sailed distance by the ship on each route, the distance was calculated following the shortest sailing sea path between the pair of ports.
Next, the estimation of the gas emission inventory is obtained through the combination of the three databases generated: namely, the technical characteristics of the vessels, the cruise routes, and the sailing distance.
The cruise activity of the 292 cruise routes analysed emitted 26,026 t of NOx, 4504 t of SO2, and 1.47 Mt of CO2 during 2019. Table 7 summarises the results obtained for the 15 routes with the highest number of connections, and the results of the remaining routes are grouped by range of number of connections.
Table 7.
Distance, number of connections, and emissions associated with the cruise routes analysed.
The 15 routes with the highest number of connections are associated with 27.3% of total emissions. Among them, the route Palma de Mallorca–Barcelona stands out, with 350 connections and the highest CO2 emissions at 72,035 t; see Table 7. For this set of routes, the number of connections rises as the main factor that motivates the level of emissions.
Moreover, two different types of routes can be identified. Those where the two ports of the route are in the Western Mediterranean can be called “regular routes”, and those where one of the ports of the route is situated outside the Western Mediterranean can be referred to as a “repositioning route”, characterised by high sailing distance with a low number of connections. The latter type of route has a decisive influence on the amount of emissions of the group with 30–39 connections, as they represented 7.5% out of 15.1% of the emissions of the group. Table 8 shows the details of the repositioning routes with the highest activity identified.
Table 8.
Distance, number of connections, and emissions associated with the repositioning routes identified.
For instance, the route Gibraltar–Southampton, with only 37 connections, has similar emissions of NOx, SO2, and CO2 as the route Palma de Mallorca–Barcelona, which has the highest number of connections. However, the sailing distance of the former is nine times higher.
4.3. Forecast Analysis of Gas Emissions
From the results obtained in Section 4.2, it would be interesting to analyse the evolution of gas emissions over time, considering factors of the evolution of cruise traffic and the implementation of new regulations about gas emissions. Therefore, several projections were made to forecast the gas emissions in the Western Mediterranean for the period of 2023–2025, taking as a reference the estimated emissions for the year 2019.
Five scenarios were assessed. The first scenario (named optimistic scenario) considers growth for the entire period equaling the average growth in terms of connections before the COVID pandemic (period of 2017–2019), up to 5.3%, until the implementation of the SECA. The second scenario (named realistic scenario) considers growth equal to 5.3% for the first year and 2.5% for the rest of the period until the implementation of the SECA. The third scenario (named stagnation scenario 1) considers a growth equal to 5.3% for the first year and no growth for the remaining years until the implementation of the SECA. The fourth scenario (named stagnation scenario 2) considers a growth equal to 2.5% for the first year and no growth for the remaining years until the implementation of the SECA. The fifth scenario (named pessimistic scenario) does not consider growth for the first year and assumes a decrease of 2.5% for the rest of the period until the implementation of the SECA.
The connection growth for each route is determined based on the total number of connections for the reference year; that is,
NCRi = NCRi − 1 + CR·NCG,
NCR is the number of connections per route in the year i, CR is the connection rate determined as NCR/TNC, where TNC is the total number of connections in the year i, and NCG is the total number of connections grown in the year i.
Emissions are calculated as TE/nautical mile, where TE is tons emitted, which is determined as TNE/TNC·D, where TNE is the total number of emissions for the year 2019, and D is the sailing distance of the route. The forecasted gas emissions per year and per route are as follows:
where i is the year under study and j is the route considered.
Figure 5 shows the results of the projections for the five aforementioned scenarios for pollutant gas emissions. The emissions associated with 2022 are the baseline for projections, which corresponds to the emissions for 2019, applying a cruise ship activity-based approach. In the case of the projections for SO2, two approaches were applied, one without the implementation of the SECA and another with the implementation of the SECA. The projection of the optimistic scenario leads to an increase of 16.1% of NOx in 2025 with respect to 2019 emissions, whereas for SO2, the emissions will be reduced up to 76.8% with the SECA implemented, and CO2 emissions will increase by up to 16.0%. On the contrary, the pessimistic scenario in terms of the evolution of the cruise traffic in the Western Mediterranean for 2025 would decrease NOx emissions by up to 5.0%, SO2 emissions would decrease by up to 81.0% if the SECA is implemented, and CO2 would decrease by up to 5.0%. Moreover, the emissions for the optimistic scenario in the 2025 year would be 18% higher than the emissions for the same year considering the pessimistic scenario. Focusing on the effects of the enforcement of the SECA in the Mediterranean, the emissions of SO2 will drop up to 80%, from 5225 t to 1045 t, in the optimistic scenario; see Figure 5b.
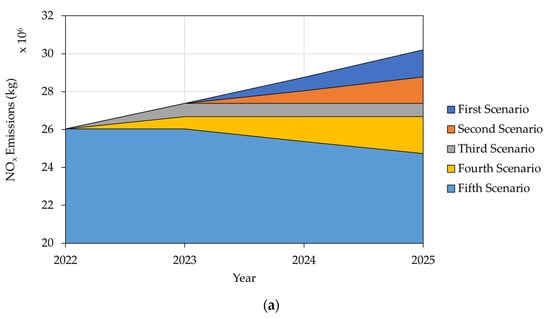
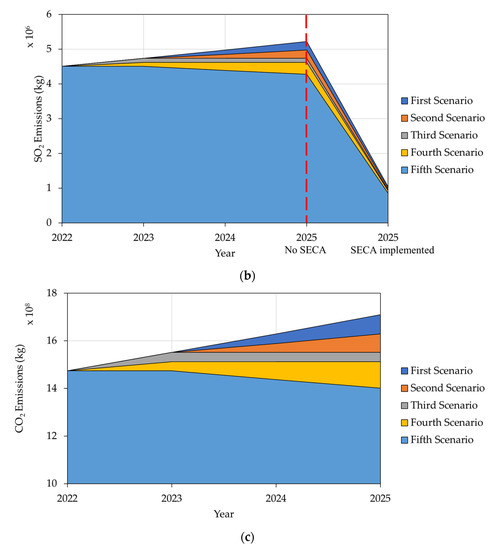
Figure 5.
Results of the projections of pollutant gas emissions considering five scenarios of evolution of cruise traffic: (a) NOx; (b) SO2; and (c) CO2. Note: the red dashed line on the projection of SO2 emissions indicates the difference between the results for 2025 without the enforcement of the SECA and with the enforcement of the SECA, respectively.
Furthermore, different SFCs are considered to explore how different SFC ratios can affect overall gas pollutant emissions. We considered an SFC ranging from ±10% of the reference SFC given by engine manufacturers. Figure 6 shows the results for NOx gas emissions. The maximum reduction in emissions with −10% of reference SFC would be 84.2% for the fifth scenario, as in Figure 6b, and 78.6% for +10% of reference SFC for the fifth scenario, as in Figure 6a, if variation in the SFC is considered.
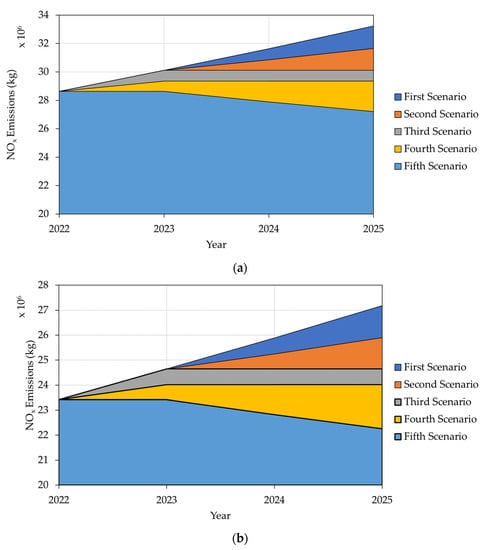
Figure 6.
NOx gas emissions for the five scenarios of evolution of cruise traffic considering an SFC ±10% with respect to the reference SFC: (a) SFC 10% higher than the reference SFC and (b) SFC 10% less than the reference SFC.
Figure 7 shows the results for SO2 gas emissions considering ±10% of the SFC with respect to the reference SFC and with two approaches for the year 2025, with (and without) the implementation of the SECA in the Mediterranean taking effect. In the optimistic scenario with the SECA implemented and an SFC 10% lower than the reference SFC, SO2 emissions could be 26% lower than the emissions associated with the same scenario and an SFC 10% higher than the reference SFC. The implementation of the SECA in the Mediterranean will have a positive footprint in improving the sustainability of cruise activities.
Figure 7.
SO2 gas emissions for the five scenarios of evolution of cruise traffic considering an SFC ±10% with respect to the reference SFC: (a) SFC 10% higher than the reference SFC and (b) SFC 10% less than the reference SFC. Note: the red dashed line on the projections indicates the difference between the results for 2025 without the enforcement of the SECA and with the enforcement of the SECA, respectively.
Figure 8 corresponds to the results obtained for CO2 gas emissions considering ±10% of the SFC with respect to the reference SFC. Differences in the optimistic scenario for higher and lower SFCs for 2025 would reach up to 18.2% of emissions. In the same way, differences between the optimistic and pessimistic scenarios for 2025 would reach 18.1%.
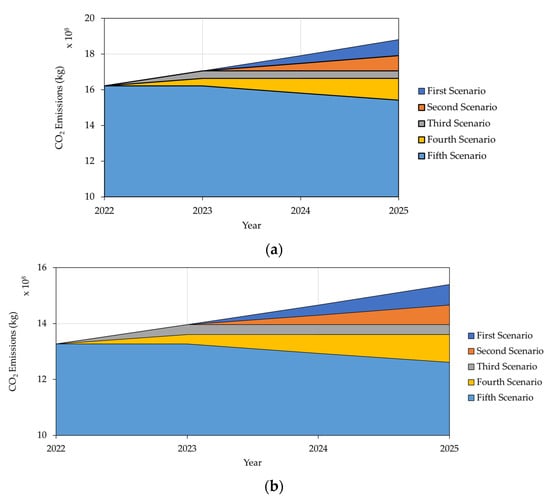
Figure 8.
CO2 gas emissions for the five scenarios of evolution of cruise traffic considering an SFC ±10% with respect to the reference SFC: (a) SFC 10% higher than the reference SFC and (b) SFC 10% less than the reference SFC.
5. Discussion
Some discussions are derived from the results shown above. First, most cruise ships have Wärtsilä engines installed, which represents a dominant position in the shipbuilding industry of cruise ships. This dominant position could reduce competition between engine manufacturers in terms of SFC efficiency, which can affect overall gas emissions. New participants could promote new innovations that can push the efficiency of main engines in terms of their SFC.
Second, data reveal that more than 25% of routes concentrated more than 80% of connections. This indicates that there are dominant ports and routes in the Western Mediterranean. An example of these could be the ports of Barcelona, Palma de Mallorca, Valencia, and Marseille due to their high hub index, as Esteve-Pérez and del Río-González pointed out [46]. Additionally, considering the research carried out in Esteve-Pérez and García-Sánchez [47], the port of Barcelona has a cooperative relationship with the ports of Civitavecchia, Palma de Mallorca, Marseille, Savona, and Genoa, all of which are major cruise ports in the Western Mediterranean with homeport operations. Furthermore, Lorenčič et al. [48] highlighted the importance of cruise activity in the ports of Barcelona, Civitavecchia, and Palma de Mallorca, as they registered positive passenger shifts every year for the period of 2011–2017. Considering the European Maritime Transport Environmental Report 2021 [49], cruise activity contributed to 1.1% of NOx emissions and 0.6% of SO2 emissions of the total emissions from ships in 2019 in the Mediterranean. Furthermore, regarding the entirety of the emissions associated with maritime transport at the European level in 2019 [49,50], the estimations reveal that the emissions of the cruise activity assessed represented approximately 0.58% of NOx, 0.28% of SO2, and 1% of CO2.
Third, the sailing distance of the routes and the number of connections are key factors in the overall quantity of gas emissions from the navigation of cruise ships in the Western Mediterranean. For instance, a high number of connections with low sailing distances (i.e., Barcelona–Marseille) produce higher gas emissions, and longer routes (i.e., Málaga–Funchal) with a low number of connections produce higher gas emissions.
Fourth, the methodology proposed for this research could be a valuable tool for assessing the outcome of operational changes or projecting the impact of policy measures in terms of polluting gas emissions. This leads to accurate results of the overall gas emissions considering most of the key factors involved: type of installed machinery, sailing distance, engine regime, type of fuel consumed, or number of connections per route.
The forecast analysis of the best scenario shows that there will be an increase in pollutant gas emissions up to 16.1% for NOx and CO2 in 2025. The implementation of the SECA will reduce the overall SO2 emissions by up to 76.8%. The five scenarios considered show that CO2 and NOX emissions range between −5.0% and +16.1% if they are compared with the 2019 reference year. Variations in SFC were also considered. They showed that CO2 emissions can vary by up to 18.1%, for instance.
As a key performance indicator, the cruise activity of regular routes of the Western Mediterranean in the reference year had an emission gas factor of 22.0 kg/nm of NOx, 3.8 kg/nm of SO2, and 1248.2 kg/nm of CO2. Regarding the repositioning routes, the results exhibit higher emission gas indicators, achieving 25.8 kg/nm of NOx, 4.5 kg/nm of SO2, and 1443.2 kg/nm of CO2. Considering the best scenario for 2025, for regular routes, the gas emission indicator will reach 25.7 kg/nm of NOx and 1457.4 kg/nm of CO2, whereas the SO2 emissions will decline to 3.6 kg/nm after the SECA enters into force.
This research is subject to some limitations. First, the most conservative scenario in terms of NOx emissions was applied due to the lack of data to apply the corresponding Tier (I, II or III) to each vessel analysed. Second, cruise traffic figures of some key cruise ports of the Western Mediterranean were not able to be retrieved. Third, projections of the implementation of the SECA were made considering the consumption of liquid fuel of 0.1% sulfur content for the entire analysed fleet. Additionally, the present research focuses on one of the three phases of cruise ship operations with gas emissions. Future research should address these limitations. First, if the missing data to apply the proper Tier to each vessel may be retrieved, future stages of the research could update the NOx emissions by applying the Tier correction factor proposed by European Commission [51] and the equations included in the amendments to MARPOL Annex VI regarding Tier I–III NOx emission limits [7]. Second, it would be interesting to tackle new scenarios of emission inventory, taking into account that part of the fleet could be equipped with engines burning LNG, biofuel, or methanol. Third, other aspects of cruise navigation can be tackled, such as manoeuvring and mooring operations, together with associated activities to set the overall emissions of the cruise fleet. Fourth, it would also be of interest to calculate new scenarios considering how different percentages of the cruise fleet have Selective Catalytic Reduction (SCR) technology implemented to reduce NOx emissions. Fifth, new scenarios should consider the effects of the inclusion of the maritime shipping sector in the EU’s Emissions Trading System (ETS), as the European Parliament (EP), the Council of the European Union, and the European Commission have reached an agreement on including shipping in the EU’s Emission Trading System (EU ETS) from 2024 [52]. The proposal is to extend the scope of the EU’s Emissions Trading System to cover CO2 emissions from large ships (above 5000 gross tonnage), regardless of the flag they fly. The extension will include all emissions from ships calling at an EU port for voyages within the EU (intra-EU), as well as 50% of the emissions from voyages starting or ending outside of the EU (extra-EU voyages) and all emissions that occur when ships are at berth in EU ports [53]. Finally, forecasting analysis could consider variations in engine regime due to environmental conditions by introducing stochastic functions during the fuel consumption and gas emissions estimation.
6. Conclusions
Environmental awareness is pushing countries to enforce new regulations affecting all sectors. The shipping industry is not oblivious to this trend. The adoption of the SECA for the Mediterranean Sea is one of these examples. The new regulation forces the fleet to change fuel consumption and adopt new technologies to adapt themselves. From the performed analysis, the following ideas can be concluded:
- Sailing distance and number of connections are revealed as a key factor in gas pollutant emission;
- Engine manufacturers have a key role in helping the fleet adapt to future challenges in environmental regulations. Retrofitting of existing engines to dual-fuel engines, development of engines that run on alternative fuels, and catalyst systems are among the technologies that accomplish the green shipping goal;
- SECA regulations will be an effective measure of reducing SO2 polluting emissions;
- Projections point to an average increase of 16.0% in emissions of NOx and CO2 by 2025;
- Repositioning routes exhibit higher gas emission indicators than regular routes.
Author Contributions
Conceptualisation. J.E.-P.; methodology. J.E.-P. and J.E.G.-R.; validation. J.E.-P., M.d.R.-G. and J.E.G.-R.; formal analysis. J.E.-P., M.d.R.-G. and J.E.G.-R.; investigation. J.E.-P.; resources. J.E.-P.; data curation. J.E.-P. and M.d.R.-G.; writing—original draft preparation. J.E.-P. and J.E.G.-R.; writing—review and editing. J.E.-P. and J.E.G.-R.; supervision. J.E.-P.; funding acquisition. J.E.G.-R. All authors have read and agreed to the published version of the manuscript.
Funding
The APC was funded by the research project “Mathematical Optimization For a More Efficient, Safer and Decarbonized Maritime Transport—Ayudas Fundación BBVA a Proyectos de Investigación Científica 2021”.
Institutional Review Board Statement
Not applicable.
Informed Consent Statement
Not applicable.
Data Availability Statement
Data sharing is not applicable.
Conflicts of Interest
The authors declare no conflict of interest.
References
- United Nations. International Maritime Organisation. Available online: https://sdgs.un.org/un-system-sdg-implementation/international-maritime-organization-imo-34611 (accessed on 17 March 2023).
- Cruise Lines International Association (CLIA). Cruise Industry Commits to Reduce the Rate of Carbon Emissions Globally by 40 Percent by 2030. Available online: https://cruising.org/en-gb/news-and-research/press-room/2018/december/clia-emissions-commitment-release (accessed on 10 March 2023).
- Cruise Lines International Association (CLIA). 2021 Global Market Report. Available online: https://cruising.org/-/media/clia-media/research/2022/2021-1r-clia-001-overview-global.ashx (accessed on 10 March 2023).
- MedCruise. Cruise Activities in MedCruise Ports: Statistics Report 2021; MedCruise: Santa Cruz de Tenerife, Spain, 2022. [Google Scholar]
- MedCruise. Cruise Activities in MedCruise Ports Statistics Report 2019; MedCruise: Santa Cruz de Tenerife, Spain, 2020. [Google Scholar]
- Cruise Lines International Association (CLIA). 2022 State of the Cruise Industry Outlook. Available online: https://cruising.org/en-gb/news-and-research/research/2022/january/state-of-the-cruise-industry-outlook-2022 (accessed on 10 March 2023).
- International Maritime Organisation (IMO). International Convention for the Prevention of Pollution from Ships (MARPOL). Available online: https://www.imo.org/en/About/Conventions/Pages/International-Convention-for-the-Prevention-of-Pollution-from-Ships-(MARPOL).aspx (accessed on 12 March 2023).
- European Parliament; Council of the European Union. Directive (EU) 2016/802 of the European Parliament and of the Council of 11 May 2016 Relating to a Reduction in the Sulphur Content of Certain Liquid Fuels; Publications Office of the European Union: Luxembourg, 2016. [Google Scholar]
- Lloyd Register. International Convention for the Prevention of Pollution from Ships. Recent and Upcoming New Requirements. Available online: https://www.lr.org/en/marpol-international-convention-for-the-prevention-of-pollution/ (accessed on 16 March 2023).
- European Commission. New Shipping Fuel Standards to Reduce Sulphur Air Pollutants in the Mediterranean by 80%. Available online: https://environment.ec.europa.eu/news/new-shipping-fuel-standards-reduce-sulphur-air-pollutants-mediterranean-80-2022-12-16_en (accessed on 16 March 2023).
- MedCruise. Cruise Activities in MedCruise Ports: Statistics Report 2022; MedCruise: Santa Cruz de Tenerife, Spain, 2023. [Google Scholar]
- Ducruet, C.; Notteboom, T.; de Langen, P.W. Revisiting inter-port relationships under the New Economic Geography research framework. Ecol. Model. 2009, 220, 3271–3279. [Google Scholar]
- Cheung, K.F.; Bell, M.G.H.; Pan, J.J.; Perera, S. An eigenvector centrality analysis of world container shipping network connectivity. Transp. Res. Part E 2020, 140, 101991. [Google Scholar] [CrossRef]
- Wang, L.; Lau, Y.; Su, H.; Zhu, Y.; Kanrak, M. Dynamics of the Asian shipping network in adjacent ports: Comparative case studies of Shanghai-Ningbo and Hong Kong-Shenzhen. Ocean Coast. Manag. 2022, 221, 106127. [Google Scholar] [CrossRef]
- Jeon, J.-W.; Duru, O.; Yeo, G.-T. Cruise port centrality and spatial patterns of cruise shipping in the Asian market. Marit. Policy Manag. 2019, 46, 257–276. [Google Scholar] [CrossRef]
- Kanrak, M.; Nguyen, H.-O. Structure. characteristics and connectivity analysis of the Asian-Australasian cruise shipping network. Marit. Policy Manag. 2022, 49, 882–896. [Google Scholar] [CrossRef]
- Ito, H.; Hanaoka, S.; Sugishita, K. Structural changes in the cruise network by ship size in Northeast Asia. Asian J. Shipp. Logist. 2022, 38, 207–221. [Google Scholar] [CrossRef]
- Rodriguez, U.A.L.; Park, S.-H.; Kim, D.-M.; Yeo, G.-T. A social network analysis of interconnections among cruise ports. Asian J. Shipp. Logist. 2021, 37, 174–183. [Google Scholar] [CrossRef]
- Miola, A.; Ciuffo, B. Estimating air emissions from ships: Meta-analysis of modelling approaches and available data sources. Atmos. Environ. 2011, 45, 2242–2251. [Google Scholar] [CrossRef]
- Wang, C.; Corbett, J.J.; Firestone, J. Modeling Energy Use and Emissions from North American Shipping: Application of the Ship Traffic, Energy, and Environment Model. Environ. Sci. Technol. 2007, 41, 3226–3232. [Google Scholar] [CrossRef]
- Murena, F.; Mocerino, L.; Quaranta, F.; Toscano, D. Impact on air quality of cruise ship emissions in Naples, Italy. Atmos. Environ. 2018, 187, 70–83. [Google Scholar] [CrossRef]
- Dragović, B.; Tzannatos, E.; Tselentis, V.; Meštrović, R.; Škurić, M. Ship emissions and their externalities in cruise ports. Transp. Res. Part D Transp. Environ. 2015, 61, 289–300. [Google Scholar] [CrossRef]
- Peng, X.; Wen, Y.; Wu, L.; Xiao, C.; Zhou, C.; Han, D. A sampling method for calculating regional ship emission inventories. Transp. Res. Part D Transp. Environ. 2020, 89, 102617. [Google Scholar] [CrossRef]
- Li, G.; Li, W.; Dou, Y.; Wei, Y. Antarctic Shipborne Tourism: Carbon Emission and Mitigation Path. Energies 2022, 15, 7837. [Google Scholar] [CrossRef]
- Iannaccone, T.; Landucci, G.; Tugnoli, A.; Salzano, E.; Cozzani, V. Sustainability of cruise ship fuel systems: Comparison among LNG and diesel technologies. J. Clean. Prod. 2020, 260, 121069. [Google Scholar] [CrossRef]
- Sanabra, M.C.; Santamaría, J.J.U.; De Osés, F.X.M. Maneuvering and hoteling external costs: Enough for alternative energy sources? Marit. Policy Manag. 2014, 41, 42–60. [Google Scholar] [CrossRef]
- Chang, Y.-T.; Song, Y.; Roh, Y. Assessing greenhouse gas emissions from port vessel operations at the Port of Incheon. Transp. Res. Part D Transp. Environ. 2013, 25, 1–4. [Google Scholar] [CrossRef]
- Deniz, C.; Kilic, A.; Civkaroglu, G. Estimation of shipping emissions in Candarli Gulf. Turkey. Environ. Monit. Assess. 2010, 171, 219–228. [Google Scholar] [CrossRef]
- Song, S. Ship emissions inventory, social cost and eco-efficiency in Shanghai Yangshan port. Atmos. Environ. 2014, 82, 288–297. [Google Scholar] [CrossRef]
- Tichavska, M.; Tovar, M. Port-city exhaust emission model: An application to cruise and ferry operations in Las Palmas Port. Transp. Res. Part A 2015, 78, 347–360. [Google Scholar] [CrossRef]
- Papaefthimiou, S.; Maragkogianni, A.; Andriosopoulos, K. Evaluation of cruise ships emissions in the Mediterranean basin: The case of Greek ports. Int. J. Sustain. Transp. 2016, 10, 985–994. [Google Scholar] [CrossRef]
- Howitt, O.J.A.; Revol, V.G.; Smith, I.J.; Rodger, C.J. Carbon emissions from international cruise ship passengers’ travel to and from New Zealand. Energy Policy 2010, 38, 2552–2560. [Google Scholar] [CrossRef]
- Simonsen, M.; Walnum, H.J.; Gössling, S. Model for estimation of fuel consumption of cruise ships. Energies 2018, 11, 1059. [Google Scholar] [CrossRef]
- Barcelona Port Authority. Cruise Ship Statistics. 2020. Available online: http://www.portdebarcelona.cat/es/web/port-dels-negocis/cruceros1 (accessed on 5 April 2020).
- Port of Gibraltar. Cruise Calendar. 2020. Available online: https://www.gibraltarport.com/schedules (accessed on 29 April 2020).
- Balearic Islands Port Authority. Cruise Ship Statistics. 2020. Available online: http://www.portsdebalears.com/es/buques-en-puerto (accessed on 10 April 2020).
- Greek Cruise Ports Cluster. Cruise Ship Statistics. 2020. Available online: http://www.greekcruise.gr (accessed on 10 April 2020).
- Livorno Port Authority. Cruise Ship Statistics. 2020. Available online: http://www.portolivorno2000.it/en (accessed on 26 April 2020).
- Malaga Port Authority. Cruise Ship Statistics. 2020. Available online: https://www.puertomalaga.com/es/prevision-cruceros/ (accessed on 25 March 2020).
- Valencia Port Authority. Cruise Ship Statistics. 2020. Available online: https://www.valenciaportpcs.net/portcalls/search/historic (accessed on 22 March 2020).
- Borgatti, S.P.; Everett, M.G.; Freeman, L.C. Ucinet for Windows: Software for Social Network Analysis; Analytic Technologies: Harvard, MA, USA, 2002. [Google Scholar]
- Royal Institution of Naval Architects (RINA). Significant Ships; RINA: London, UK, 2023. [Google Scholar]
- Vessel Finder. Vessels Database. Available online: https://www.vesselfinder.com/vessels (accessed on 6 November 2022).
- El-Taybany, A.; Moustafa, M.M.; Mansour, M.; Tawfik, A.A. Quantification of the exhaust emissions from seagoing ships in Suez Canal waterway. Alex. Eng. J. 2019, 58, 19–25. [Google Scholar] [CrossRef]
- Endresen, Ø.; Sørgard, E.; Sundet, J.K.; Dalsøren, S.B.; Isaksen, I.S.A.; Berglen, T.F.; Gravir, G. Emission from international sea transportation and environmental impact. J. Geophys. Res. 2003, 108, 4560. [Google Scholar] [CrossRef]
- Esteve-Pérez, J.; del Río-González, M. Assessment of the Centrality of the Cruise Ship Navigation Networks in Southern Europe through the Application of Social Network Analysis. J. Mar. Sci. Eng. 2022, 10, 1072. [Google Scholar] [CrossRef]
- Esteve-Perez, J.; Garcia-Sanchez, A. Dynamism patterns of Western Mediterranean cruise ports and the coopetition relationships between major cruise ports. Pol. Marit. Res. 2018, 25, 51–60. [Google Scholar] [CrossRef]
- Lorenčič, V.; Twrdy, E.; Batista, M. Development of Competitive–Cooperative Relationships among Mediterranean Cruise Ports since 2000. J. Mar. Sci. Eng. 2020, 8, 374. [Google Scholar] [CrossRef]
- European Maritime Safety Agency (EMSA); European Environmental Agency (EEA). European Maritime Transport Environmental Report 2021; Publications Office of the European Union: Luxembourg, 2021; ISBN 978-92-9480-371-9. [Google Scholar] [CrossRef]
- European Commission. 2020 Annual Report on CO2 Emissions from Maritime Transport; European Commission: Brussels, Belgium, 2021. [Google Scholar]
- European Commission. The Scipper Project, Derivable D.4.1—New Set of Emission Factors and Activity Information; European Commission: Brussels, Belgium, 2021. [Google Scholar]
- Det Nostke Veritas (DNV). EU ETS: Preliminary Agreement to Include Shipping in the EU’s Emission Trading System from 2024. Available online: https://www.dnv.com/news/eu-ets-preliminary-agreement-to-include-shipping-in-the-eu-s-emission-trading-system-from-2024-238068 (accessed on 16 June 2023).
- European Commission. Reducing Emissions from the Shipping Sector. Inclusion of Maritime Emissions in EU Emissions Trading System (ETS). Available online: https://climate.ec.europa.eu/eu-action/transport-emissions/reducing-emissions-shipping-sector_en (accessed on 16 June 2023).


Disclaimer/Publisher’s Note: The statements, opinions and data contained in all publications are solely those of the individual author(s) and contributor(s) and not of MDPI and/or the editor(s). MDPI and/or the editor(s) disclaim responsibility for any injury to people or property resulting from any ideas, methods, instructions or products referred to in the content. |
© 2023 by the authors. Licensee MDPI, Basel, Switzerland. This article is an open access article distributed under the terms and conditions of the Creative Commons Attribution (CC BY) license (https://creativecommons.org/licenses/by/4.0/).