Abstract
The global express market has expanded significantly in recent years. High-speed rail express freight transportation has been implemented between multiple cities in China, significantly improving transportation efficiency and effectively meeting demand. In this paper, an optimization model for HSR (high-speed railway) express transport plan is constructed using a space-time-state network, and an improved adaptive genetic algorithm is designed to solve the model. Reasonable transport schemes could be arranged for each cargo flow with the objective of maximizing operational revenue. The numerical experiment based on the Harbin–Dalian high-speed railway in China verifies the effectiveness and applicability of the proposed model. The results show that for HSR operators, appropriate transport strategies can be planned in terms of delivery priorities and transportation mode selection to make full use of the remaining capacity of HSR trains and increase operational revenue.
1. Introduction
The global express market has expanded significantly in recent years, with express business volume and revenue continuing to rise. Take China as an example: China’s express business volume has increased nearly 40 times in ten years, with China’s express business volume reaching 108.30 billion pieces in 2021 and a total annual express business revenue of RMB 1033.23 billion, representing significant gains. As the economy and technology drive the development of high-precision industries, the demand for high-value-added goods such as precision instruments, pharmaceuticals, and high-time efficiency goods such as fresh and cold chain products has increased, reflecting the demand for high quality in terms of transport efficiency and service quality. In 2012, China’s Guangzhou Railway Group made its first attempt to launch a pilot high-speed rail freight service from Guangzhou to Changsha in conjunction with courier companies. In 2014, the China Railway Express launched four kinds of high-speed railway express products, including “same-day delivery”, “next-morning delivery”, “next-day delivery”, etc. In 2017, the China Railway Express jointly launched the “Double 11” Beijing–Shanghai express service with the Shunfeng Express Company. In December 2020, the world’s first freight trainset product with a speed of over 350 km per hour was released. The expansion of the scale of operation, the gradual standardization of operation, and the technical attack are all important thrusts in the development of high-speed rail express transport. However, the current high-speed rail express is basically based on direct transport, failing to reasonably allocate capacity, and the transport scheme is not flexible enough. In the face of huge transport demands and development prospects, it is necessary to carry out research on the theoretical system of high-speed rail express scheduling, to reasonably allocate transport resources, to improve the adaptability of product supply structure to changes in transport demand and freight structure, and to promote green and low-carbon development of logistics.
Piggyback is a freight transportation organization mode in which small and high-value-added commodities are placed in the luggage storage area or the last row of seats on passenger trains. This mode does not need to modify the interior of the train car and set up a division of express loading and unloading operation areas in the station and platform, which indicates that the loading and unloading operation is very flexible. The high-speed confirmation train mode is namely to transport express products by a high-speed confirmation train, which runs before the official daily passenger loading to test the normal operation of railroad equipment and facilities and ensure the safety of train operation. This mode has no crossover with passenger transport, while passenger transport has no impact on cargo loading and unloading. This mode can use more space in the train.
In this paper, the method of compiling the high-speed railway express train operation scheme is designed with comprehensive consideration of the time requirements of high-speed railway express freight. Based on the alternative set of HSR operating schemes, an optimization model for HSR express transport schemes in the cargo transportation process is constructed. We offer the following contributions to the research on high-speed rail express transportation plan optimization:
- (1)
- We consider both piggyback transport mode and high-speed railway confirmation train mode in the research so that the optimization results have more practical significance.
- (2)
- We propose a transportation plan optimization model based on the space-time-state network for high-speed railway express (Section 3) to consider the time requirements of high-speed railway express products.
- (3)
- We illustrate the use of the optimization model and the improved adaptive genetic algorithm (Section 4) to solve the problem of a real high-speed railway system.
The remainder of this paper is organized as follows. A brief review of the relevant literature is presented in Section 2. The problem description and mathematical model are given in Section 3. We give a detailed description of the improved adaptive genetic algorithm in Section 4. In Section 5, numerical experiments with a real high-speed railway line are provided to demonstrate the effectiveness of the proposed model and algorithm. Section 6 provides conclusions and recommendations for future studies.
2. Literature Review
There are many types of railway express services, including conventional luggage transportation using luggage carriages, container express, freight express trains, high-speed railway express, etc. Scholars have conducted research on different types of railway express transport scheme optimization problems, which provides a sufficient theoretical basis for the model construction of high-speed railway express in this paper. The railway express freight transportation scheme optimization model mainly adopts two kinds of methods: direct modeling [1,2] and constructing network flow models based on space-time networks [3,4,5,6].
In terms of modelling the high-speed rail express transport plan, Yang Zihan [7] constructed a two-stage cargo flow allocation model based on alternative paths in the context of the global COVID-19 epidemic. Chaohui Jiang [8] et al. designed the transportation organization scheme based on the predicted express freight volume of each category of high-speed railway and used the Beijing–Shanghai high-speed railway to perform the case study. Yao Yuying [9] considered passenger train piggybacking to complete “same-day” product delivery carried out transport scheme design optimization with the goal of high-speed rail express timelines and revenue, and analyzed the case along the route from Lanzhou West to Xi’an North. Gao Ruhu [10] constructed a model for optimizing the timetable and transport scheme of freight trains with the objective of minimizing the cargo arrival time and verified that the integrated optimization model was better than the two-stage model. Wang Yaning [11] constructed a two-stage model of “initial planning + dynamic adjustment” to optimize the transport scheme of piggyback mode high-speed rail express with the objective of minimizing transport costs. Li Shiyuan [12] considered the piggyback mode with the objectives of maximizing enterprise revenue and minimizing customer cost and constructed a model for optimizing the high-speed rail express transportation scheme by considering the dynamic load limit that changes with the occupancy rate. Yang Jiayi [13] considered the maximization of profit of high-speed rail express under the passenger-cargo common transport mode as the objective and constructed an optimization model by considering different product time limits and loading capacities.
In the research on the algorithm of the railway express product transportation scheme, according to the existing research results, in order to reduce the scale of operation and improve the efficiency of the solution, some scholars chose to adopt a two-stage algorithm to build the model through the alternative set method. The “alternative set” refers to all possible alternatives and feasible paths, and when optimizing the transport solution, a subset of transport solutions should be selected from the alternative set for combination to form the final solution. In 2009, Fu Huiling [14] introduced the concept of alternative sets to the preparation of railway transport solutions. He Shiwei [15] proposed an alternative set of nodal transport modes with the objective of minimizing total transport costs and time costs and constructed a model to optimize the design of multimodal transport routes and distribution flows. Based on the A* algorithm, Wang Pengxiang [16] searched for the set of travelable paths for all ODs by combining the characteristics of the packet transport organization and constructed a capacity allocation model for transport scheme optimization based on the set of travelable paths for the packet with the objective of maximizing total revenue and considering capacity constraints.
In the two-stage solution process, the first stage of feasible path alternative set solving, its main algorithms include the A* algorithm, the double-sweep algorithm, and the Yen algorithm [17]. The second stage is the allocation of cargo flows and is the essence of the transport solution. The current algorithms for solving the model related to flow allocation are mainly divided into intelligent optimization algorithms, column generation algorithms, relaxation, or decomposition algorithms, etc. Intelligent algorithms are commonly used for this problem, including simulated annealing algorithms, forbidden search algorithms, genetic algorithms, and so on, to solve it faster, but the accuracy of the solution cannot be guaranteed. Column generation algorithms have a long history of application and a wide range of applications and are involved in solving traffic distribution problems related to railways, roads, airlines, and other modes of transport. When the model is difficult to solve directly, it needs to be processed first, divided into relaxation and decomposition. The relaxation algorithm includes linear relaxation and Lagrangian relaxation, and the decomposition algorithm is the Benders decomposition method.
Existing research on high-speed rail express transport is more concentrated, mainly for freight train organization optimization, but at present, freight electric multiple units (EMU) are not widely applied in the world, one reason for which is that such transportation modes will occupy much of the line capacity and thus affect the passenger transportation service. Considering the above situation, some scholars have shifted their research to the piggyback transport mode, but there are fewer related studies [7], and the existing research is mainly limited to single transport organization mode [18]. In this paper, the piggyback transport mode and the high-speed railway confirmation train mode are included in the scope of research so that the optimization results have some practical significance. We refer to the research on piggyback and road transport and design the model solution based on the alternative set so that the calculation scale is reduced and the calculation time is shortened. In terms of optimization algorithms, the mainstream of existing research is the intelligent optimization algorithm, which is faster to calculate. In this paper, an improved adaptive genetic algorithm is applied to solve the model, which improves the speed and accuracy of the solution.
3. Mathematical Model
Based on the alternative set of HSR operating schemes, an optimization model for HSR express transport schemes based on the space-time-state network in the cargo transportation process is constructed, and reasonable transport schemes are arranged for each cargo flow with the objective of maximizing operational revenue. Considering the actual transport capacity constraints of express loading capacity and station loading and unloading capacity on different arc segments, the arc segments on different alternative paths are not independent of each other, and this part needs to further analyze the flow of arc segments on each path.
3.1. Problem Description and Assumption
The time nodes and space nodes of the space-time-state network correspond to the space-time network; the difference is that the space-time network is mainly used to describe the operation process of the train and thus used to generate the alternative set of express transportation solutions, as shown in Figure 1; the space-time-state network mainly portrays the cargo in the station, inter-station state, and the corresponding temporal and spatial nodes.
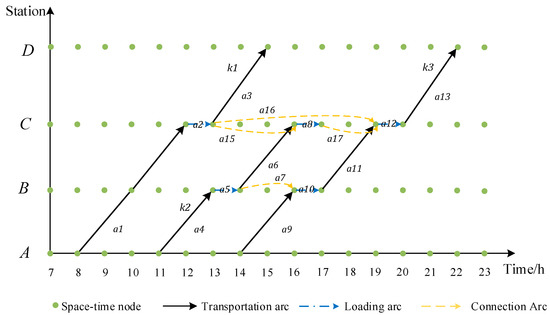
Figure 1.
Space-time network diagram representing the alternative set of express transportation solutions.
In Figure 1, we use a small example to show the space-time network where the time range is 5–24 h, the space range is station A–D, and there are five alternative paths included. Note that Figure 1 is in fact the visualization result of Table 1.

Table 1.
Alternative paths within the A–D section.
The process of high-speed rail express in the whole shipping process includes the following cases: (1) goods are stored at the station; (2) goods are loaded at the station; (3) goods are unloaded at the station; (4) goods are transported between stations; and (5) goods follow the train to stop at the station. Therefore, it is necessary to generate cargo service arcs for the above-mentioned cases in the space-time-state network.
The following is the schematic diagram of the space-time-state network designed in this paper for describing the whole shipping process of the cargo. The cargo state layer is added to the two-dimensional space-time network to form a three-dimensional space-time-state network, where the time range is 5–24 h, the space range is station A–D, and the cargo state includes the departure layer, the storage layer, and the arrival layer. Figure 2 and Figure 3 correspond to the two scenarios of the no transit storage process and the transit storage process, respectively.
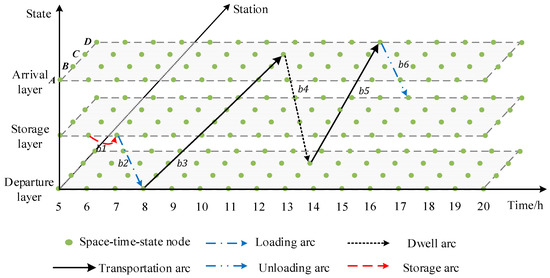
Figure 2.
Space-time-state network diagram of goods based on alternative paths between sections A–D (no transit).
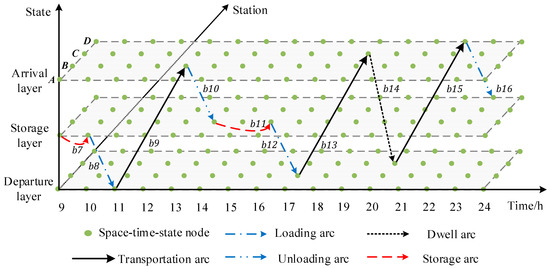
Figure 3.
Time-space-state network diagram of goods under the A–D interval alternative path (with transit).
Among them, the logical relationship between the state layer and the cargo service arc is the following: (1) If the arc segment stays at the storage layer, it is a storage arc; (2) if the arc segment migrates from the storage layer to the departure layer, it is a loading arc; (3) if the arc segment migrates from the departure layer to the arrival layer, it is a transportation arc; (4) if the arc segment migrates from the arrival layer to the storage layer, it is an unloading arc; and (5) if the arc segment migrates from the arrival layer to the departure layer, it is a stopping arc.
As shown in Figure 2, {b1, b2, b3, b4, b5, b6} is a transit-free path in the space-time-state network, which corresponds to path one of the alternative transportation schemes, as shown in Table 1, indicating that the cargo chooses this alternative for transportation. In Figure 2, b1 represents the station storage process corresponding to the cargo from the consignment time to the start loading time, b2 represents the loading process corresponding to the cargo from the start loading time to the departure time, b3 represents the inter-station transportation process of the cargo following the train k1 from A to C, b4 represents the dwell process of the cargo following the train at C, and b5 represents the inter-station transportation process of the cargo following train k1 from C to D. b6 represents the unloading process after cargo arrives at the final arrival station D. The en route transportation time is 7 h, and the total time is 10 h.
As shown in Figure 3, {b7, b8, b9, b11, b12, b13, b14, b15, b16} is a transit path in the space-time-state network, which corresponds to path four of the alternative transportation scheme in Table 1, indicating that the cargo chooses this alternative for transportation.
As shown in Figure 3, path 4, compared with path 1, has more transit processes in B. b9 represents goods following train k2 after arriving at B. b10 is in the storage layer after the unloading process of b10 at B. In addition, b11 represents goods stored at station B, and b12 represents goods loaded at B to train k3, followed by train k3 transportation. The transit time en route is 11 h, and the total time is 14 h.
The following model assumptions are made in this paper:
- In this paper, we only consider the transportation process between different cities on the high-speed rail line and do not consider the short-distance intra-city transportation process, including express collection and delivery between the two ends of the OD from where the freight demand occurs to the high-speed rail station and between the high-speed rail station and the freight destination.
- Before making transportation plan decisions, the express cargo flow of different OD zones, different product categories, and different shipping periods can be projected in advance.
- The physical network and train schedules of HSR do not change and can be known in advance during the decision-time cycle.
- The existence of a large high-speed rail station in each target city for express freight operations, with the operational facilities and conditions required in both high-speed rail confirmation and piggyback transport modes.
- Each express cargo flow can find the corresponding cargo service arc segment (including the virtual arc segment) to complete the network flow allocation, and the same cargo service arc can serve different cargo flows.
- Assume that the operational process and efficiency in the process of loading and unloading, transit connection, etc., are relatively stable without considering the relevant perturbations of external conditions on the transportation organization.
3.2. Parameters, Decision Variables, and Notations
The sets, input parameters, and variables for the optimization model are listed in Table 2.
Table 2.
Sets, parameters, decision variables, and notations.
3.3. Mathematical Model
This model is a 0–1 mixed integer programming (MIP) model based on a space-time network of cargo states to describe the problem, which allows the problem to be transformed into a networked multi-commodity flow problem with transport capacity constraints and practical transport organisation and operational constraints. As HSR express cargo has attributes such as dispatch time, class level, and arrival time, these attributes need to be added to the constraints of the model in the modelling of the problem so that the decision variables meet the relevant constraints. The model is set up as follows:
3.3.1. Objective Functions
For the objective function, this model takes into account the revenue as well as the operating costs of high-speed rail express business, including five aspects: freight revenue, transportation cost, loading and unloading cost, transit cost, and delay penalty.
① Freight revenue
The revenue source of the high-speed rail express business for railway operators is mainly the freight revenue from conducting express business.
② Transportation cost
③ Loading and unloading cost
The loading and unloading of express cargo takes place at the stations at both ends of the OD and at the stations where transit connections are made.
④ Transit costs
The transit cost incurred by transit of express cargo in the transportation process, including the storage and handling costs incurred by transit. Where the total number of transits on the path is less than or equal to the transit limit .
⑤ Delay penalty
High-speed rail courier products are often expected to arrive early and timely. The shipping price and the time requirement of different categories are different, so the penalty cost of delay should be different. At the same time, considering the effect of different delay lengths, a stage function is set to express the different degrees of delay penalties, as shown in Equation (6).
Therefore, the final objective function is shown in Equation (7). The objective is to maximize the operating revenue,
3.3.2. Constraints
Equation (8) is the train loading capacity constraint. As there are different modes of high-speed rail express transportation studied in this paper, the upper limit of the loading capacity of transportation arcs varies for different modes. In addition, the same cargo transportation arc can serve different cargo flows, so it is necessary to sum up all cargo flows carried by the same arc segment. Equation (9) is the station loading and unloading capacity constraint. The express transport capacity of high-speed trains also depends on the impact of the amount of cargo that the train can load and unload at the station. In particular, the stopping time of trains in piggyback mode is generally short, so the cargo flow needs to meet the constraints of loading and unloading operation capacity at the starting station, transit station en route, and final destination station. Among them, is the average loading and unloading operation efficiency at the high-speed rail station. Equation (10) is set to ensure that the express product cargo flow between OD pair whose shipping time is , can only choose the only path from the set of alternative space-time paths and virtual paths. Equation (11) is the transportation mode constraint. The high-speed railway confirmation train could not carry same-day delivery products due to its early departure time. Equation (12) is used to indicate the time period when the same-day delivery products cannot be handled. Equation (13) is constructed to distribute different cargo flows over the arc segments, considering that the arc segments on different alternative paths are not independent of each other. Equations (14) and (15) are logical constraints on the decision variables.
4. Solution Algorithm
For the problem described in this paper, assuming that the number of OD pairs is , the product category type is , the shipping time is , each OD point pair has actual alternative paths, and each alternative path has cargo service arcs, and the size of the decision variables in the model is . Therefore, the problem will be solved on an exponentially larger scale as the size of the network and the type of cargo flow increase. According to the characteristics of the proposed model, an improved adaptive genetic algorithm framework-based algorithm is designed for solving the optimization model of the express transport scheme of the high-speed railway. The basic flow of the algorithm is shown in Figure 4.
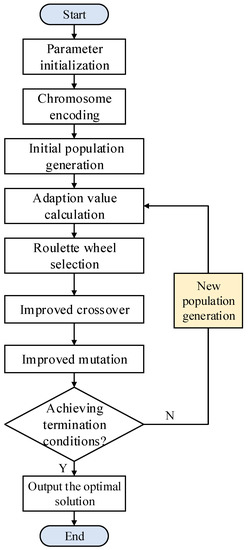
Figure 4.
Basic flow of the improved adaptive genetic algorithm.
Step 1: Parameter initialization. Input the required parameters, as shown in Table 2.
Step 2: Chromosome encoding. A binary encoding form is used with chromosomes encoded as gene fragments , where each gene fragment includes gene loci on each gene fragment, representing the choice of alternative paths for the cargo stream represented by that gene fragment , with a separate artificial virtual path that is used for the loading of infeasible flow.
Step 3: Initial population generation. The initial population generation rules are set: (i) mixed sorting by cargo class level and transport demand size; (ii) mixed sorting by cargo class level and transport distance size; (iii) random sorting by cargo class level; and (iv) random sorting by transport distance size.
When generating the initial population of individuals, the above initial population rules are chosen randomly so that the quality of the solution is preserved while meeting the requirements of diversity. After determining the priority of each branch cargo flow, it is also necessary to assign paths to cargo flows so that they satisfy the relevant constraints of the model, thus ensuring the feasibility of the network. So simply ensuring that the paths depart later than the dispatch time so that the cargo flows make random choices of paths may not satisfy the model constraints. Therefore, alternative transport options can be traversed in chronological order. In the same way, crossover and mutation of the parents may also result in the requirements for the feasibility of the space-time state network not being satisfied, and again, the paths need to be adjusted so that a feasible solution can be derived.
Step 4: Fitness value calculation. Choose the objective function as the fitness function, that is, the fitness value is the maximal operation revenue.
Step 5: Roulette wheel selection. Use roulette wheel selection to select the better population.
Step 6: Improved crossover. The crossover probability is adjusted between the average and maximum fitness of the population based on the fitness of the individuals to improve the quality of the child solutions and the speed of convergence of the genetic algorithm, and the crossover operator is designed as shown in Equation (16).
is the crossover probability, and are crossover probability parameters, is the maximum adaptation of the population, is the average adaptation of the population, and is the larger adaptation value of the two individuals participating in the crossover.
Step 7: Improved mutation. The mutation probability is likewise adjusted between the average and maximum fitness of the population based on the fitness of the individuals. The mutation operator is designed as shown in Equation (17).
is the mutation probability, and are mutation probability parameters, is the maximum adaptation of the population, is the average adaptation of the population, and is the adaptation value of the mutated individual.
Step 8: Achieving termination conditions? In this paper, we set the maximum number of iterations to make the algorithm terminate. When the algorithm terminates, if the fitness function curve also tends to be stable, it means that the algorithm has converged and the currently obtained model solution is close to the optimal solution, which can be used as an approximate optimal solution.
5. Numerical Experiment
5.1. Scenario Setting
The Harbin–Dalian high-speed railway connects Harbin City and Dalian City in China, passing through Songyuan City, Changchun City, and Siping City in Jilin Province, as well as Tieling, Liaoyang, Anshan, and Yingkou cities in Liaoning Province, as shown in Figure 5. It passes through three provincial capitals and six prefecture-level cities and is an important transportation artery in the northeast region of China. The Harbin–Dalian high-speed railway is 921 km long with a total of 22 stations. Designed for a speed of 350 km per hour, it is the first high-speed railway that runs through the three provinces of Northeast China. The six cities along the Harbin–Dalian high-speed railway with the highest GDP ranking are Dalian City, Yingkou City, Shenyang City, Harbin City, Anshan City, and Changchun City. The economic situation of cities generally has a positive impact on express delivery demand, and high-speed express delivery stations cannot be arranged for all prefecture-level cities during the planning phase. Therefore, this paper selects Dalian City, Yingkou City, Shenyang City, Harbin City, Anshan City, and Changchun City as the case study objects.
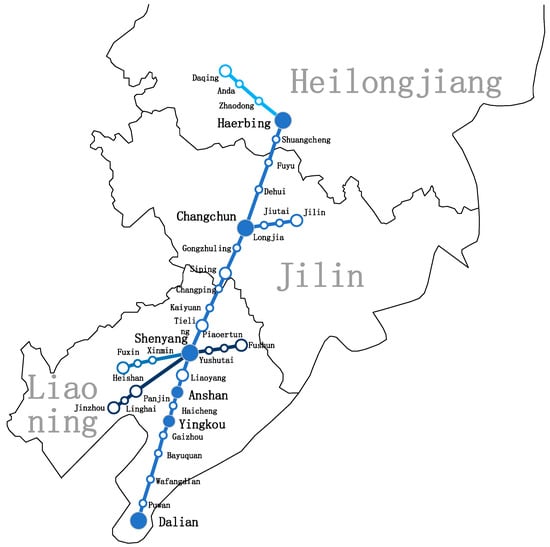
Figure 5.
Schematic diagram of Harbin–Dalian high-speed railway.
The relative distance between some cities along the Harbin–Dalian high-speed railway is shown in Table 3. Three categories of freight flow are analysed: “same-day delivery”, “next-morning delivery” and “next-day delivery”, which indicate that the product will be transported to the destination within the day, next morning, and the day after tomorrow, respectively. Freight demand by product category for different ODs in different time periods is shown in Table 4. In Table 4, the freight demand for different OD (Origin–Destination) pairs, dispatch time periods, and product types has been subdivided. The time limit requirements for high-speed express delivery services for different product types during different time periods are generally high. In particular, the “same-day delivery” product has a short delivery time limit, which imposes certain constraints on the dispatch time domain.
Table 3.
The relative distance between some cities along the Harbin–Dalian high-speed railway (km).
Table 4.
Freight demand by product category for different ODs in different time periods (kg).
As an example, for the downstream direction, the candidate transportation plans for 15 OD pairs among the six cities along the Harbin–Dalian high-speed railway are given. The candidate transportation plan for the Anshan–Harbin is shown in Table 5, and the visualization result is shown in Figure 6. It can be seen that due to the actual number of high-speed trains operating in this section, some feasible paths that meet the relevant constraints contain transfer connections, which increase the capacity of the candidate set and the carrying capacity of high-speed express delivery. For some OD pairs (such as Dalian–Harbin), due to the relatively small number of actual high-speed rail trains and the even distribution of train operating times, feasible alternative transportation path solutions without any transfer are found, as shown in Figure 7.
Table 5.
Anshan–Harbin alternative transport plan.
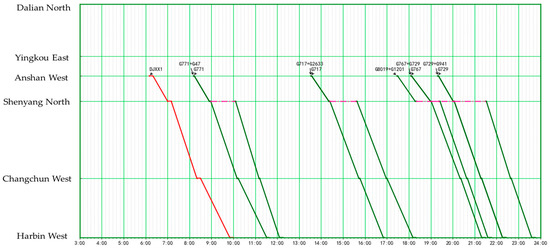
Figure 6.
Alternative set of high-speed rail express transport plans from Anshan to Harbin.
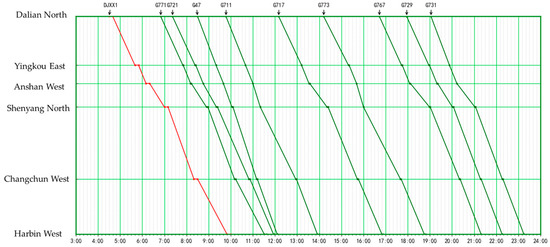
Figure 7.
Alternative set of high-speed rail express transport plans from Dalian to Harbin.
Some basic parameters for the model are set and shown in Table 6.
Table 6.
Model parameter values.
5.2. Parameter Tune and Performance Analysis of the Algorithm
The population size determines the size of the search space of the algorithm to a certain extent, while the crossover probability and variance probability determine the size of the global search and local search abilities of the algorithm. As there are many parameters to be tuned, in order to reduce the workload of tuning and not affect the results of the algorithm, both the population size and the variance probability are tuned, and the crossover probability is adjusted separately on this basis. The range of adjustment for population size and mutation probability is shown in Table 7, and the results are shown in Table 8, Table 9 and Table 10.
Table 7.
Tuning range of population size and mutation probability.
Table 8.
Result of tuning population size and mutation probability-I.
Table 9.
Result of tuning population size and mutation probability-II.
Table 10.
Result of tuning population size and mutation probability-III.
The objective function is 42,948 when the population size is 100, 44,172 when the population size is 130, and 44,326 when the population size is 160. The best choice in terms of objective function merit was 160. However, the most suitable population size is 100. When the number of iterations is 100, the crossover probability is (1,1) and the mutation probability is (0.2,0.2).
The same analysis method is used to analyze the data in Table 7, which show that the most suitable population size is 100 when the number of iterations is 100, the crossover probability is (1,1) and the mutation probability is (0.3,0.3), and that the most suitable population size is 100 when the number of iterations is 100, the crossover probability is (1,1), and the mutation probability is (0.5,0.5).
From the perspective of the objective function, the population size of 100 is the largest objective function value; from the perspective of the running time of the program, the running time of Experiment 1 is between that of Experiment 2 and Experiment 3, so a population size of 100 and a variance probability of (0.2,0.2) is the best combination of parameters for the current experimental environment.
The cross-sectional probabilities are adjusted in two stages: fixing k1 and adjusting k3; and adjusting k1 on the basis of k3. The crossover probability parameter k3 is adjusted in the range [0.5,1] in steps of 0.05. The experimental results are shown in Table 11.
Table 11.
Tuning result of k3.
In general, either k3 = 0.5 or k3 = 0.75 is desirable, but considering that k3 is the crossover probability, which determines the global search ability of the algorithm, and 0.5 is weaker than 0.75, k3 = 0.75 is finally chosen.
The crossover probability k1 is then adjusted to [0.5, 1] in steps of 0.1, and the results are shown in Table 12.
Table 12.
Tuning result of k1.
From the data in Table 12, the best optimization results and the smallest program running time are obtained when the crossover probability = 0.7. Therefore, = 0.7 is taken.
The parameters of the adaptive genetic algorithm are determined as follows: population size N = 100, number of iterations 100, crossover probability (0.7,0.75), and mutation probability (0.2,0.2).
We also solve the problem using the commercial solver GAMS, classical GA (genetic algorithm) and improved adaptive GA under the same maximum number of iterations of 100. For other parameters in classical GA, the crossover probability is set to 0.75 and the mutation probability is set to 0.2. All numerical experiments were completed on a Windows 10 personal computer with Intel(R) Core (TM) i7-6700 CPU 3.40 and 16.0 GB of RAM. The comparison results are shown in Table 13.
Table 13.
Comparison results of GAMS, classical GA, and improved adaptive GA.
As can be seen from the data in Table 13, the adaptive genetic algorithm outperforms the GAMS software (https://www.gams.com/, accessed on 18 April 2023) in terms of solution time but is slightly inferior to the GAMS solution in terms of the quality of the objective function. When compared to the classical genetic algorithm, it outperforms the classical genetic algorithm in terms of solution time and quality.
5.3. Results, Discussion, and Analysis
Based on the actual train timetable information of the Harbin–Dalian high-speed railway, the algorithm is developed in python language for model solving so as to co-ordinate and plan the transport scheme of 180 freight flows in 15 OD pairs in the downstream direction and analyse the scheme. The results of the freight flow transport scheme under different OD pairs and its analysis are shown as follows.
There are 180 freight flows in this case, and the transport scheme and freight flow of different freight flows are obtained, in which some sections of Dalian–Harbin, Anshan–Harbin, and Anshan–Shenyang are summarised in the transport scheme of each freight flow as shown in Table 14. The delay penalty accumulated for the different goods is 4271.
Table 14.
High-speed rail express transport plan of partial OD pairs.
The idea behind the design of the model is to allocate the express cargo flow according to the different freight demand differences. The analysis of the results of the different sectoral freight flow transport schemes reveals that the solution results are basically in line with the expectations of the model in the following aspects:
- Delivery priorities
- ①
- For different categories of express shipments, delivery is generally prioritized for the higher-category shipments with a higher time requirement because of the model’s goal of maximizing revenue. In the 8:00–10:00 shipping time period of the Dalian–Harbin section. For example, the time priority for delivery of same-day products (type a) is higher than that of the other two categories.
- ②
- When the cargo flow is small and the train transport capacity and station loading and unloading capacity meet the requirements, different cargo flows under the same OD pair will appear to be merged onto the same train. For example, train DJXX1 of the Dalian–Harbin section can be found to be in line with the above analysis.
- ③
- For express cargoes with different ODs, generally, the greater the length of the section, the higher the transportation benefits will be and the more fully occupied the loading capacity of the train in the whole section will be. For example, in this case study, the distance between Anshan–Shenyang is smaller, and the distribution priority is correspondingly lower.
- Transportation mode selection
The confirmation train is usually the first train of the day. Considering the early departure time of the confirmation train, constraints are set in the model to restrict the train from carrying same-day delivery products in this mode, and the results of this paper satisfy this requirement.
In summary, for HSR operators, appropriate transport strategies for each batch of cargo flows can be planned in terms of delivery priorities and transportation mode selection, thus making full use of the remaining capacity of HSR trains and increasing operational revenue.
6. Conclusions and Further Research
The global express market has undergone significant expansion in recent years. To meet this growing demand, high-speed rail express freight transportation has been implemented between multiple cities in China, resulting in significant improvements in transportation efficiency and increased supply. In this study, we propose an optimization model for the high-speed railway express transport plan using a space-time-state network. Additionally, we designed an improved adaptive genetic algorithm to solve the model. This optimization model aims to arrange reasonable transport schemes for each cargo flow with the objective of maximizing operational revenue. We conducted numerical experiments based on the Harbin–Dalian high-speed railway in China to verify the effectiveness and applicability of the proposed model. The results indicate that HSR operators can plan appropriate transport strategies by considering delivery priorities and transportation mode selection to make full use of the remaining capacity of HSR trains and increase operational revenue.
Overall, our study provides valuable insights for HSR express freight transportation optimization and contributes to the further development of the global express market. However, there are still some more to be studied in the future. In this paper, we study the process of express rail shipments from the time of dispatch to the arrival at the target station. In future research, the “station to door” component can be incorporated into the model of the problem, and joint transport solutions between the express rail and other modes of transport can be considered, thus describing the express “door to door” process in a larger time dimension.
The constraints of train loading capacity and train station handling capacity are considered from the perspective of actual transport organisation requirements. It is necessary to ensure the loading capacity of express trains and the efficiency of station loading and unloading operations. Therefore, further research is needed on how to plan the construction of supporting technical equipment for high-speed rail express services and coordinate passenger and freight operations.
Author Contributions
Conceptualization, T.L., J.C. and C.Z.; methodology, T.L.; software, T.L.; validation, T.L. and C.Z.; resources, J.C.; writing, T.L. and C.Z.; writing-review and editing, J.C. and X.X.; visualization, T.L.; supervision, J.C. and X.X.; funding acquisition, J.C. All authors have read and agreed to the published version of the manuscript.
Funding
This research was funded by China State Railway Group Co., Ltd., grant numbers N2022X030 and K2022X014.
Institutional Review Board Statement
Not applicable.
Informed Consent Statement
Not applicable.
Data Availability Statement
Not applicable.
Conflicts of Interest
The authors declare no conflict of interest.
References
- Yang, J.; Liu, L.; Li, X.; Ba, C. Optimization study on the fast transportation of scattered cargo by railway luggage car. J. Railw. Sci. Eng. 2016, 13, 7. [Google Scholar]
- Lan, Z.; He, S.; Xu, Y. Dynamic service network design of China-Europe block train considering wagon bottom and container turnover. J. China Railw. Soc. 2021, 43, 25–32. [Google Scholar]
- Crainic, T.G. Service network design in freight transportation. Eur. J. Oper. Res. 2000, 122, 272–288. [Google Scholar] [CrossRef]
- Dall’Orto, L.C.; Crainic, T.G.; Leal, J.E.; Powell, W.B. The single-node dynamic service scheduling and dispatching problem. Eur. J. Oper. Res. 2006, 170, 1–23. [Google Scholar] [CrossRef]
- Jeong, S.J.; Lee, C.G.; Bookbinder, J.H. The European freight railway system as a hub-and-spoke network. Transp. Res. Part A Policy Pract. 2007, 41, 523–536. [Google Scholar] [CrossRef]
- Zhu, E. Scheduled Service Network Design for Integrated Planning of Rail Freight Transportation. Ph.D. Thesis, Universite de Montreal, Montreal, Canada, 2011. [Google Scholar]
- Yang, Z.; Song, R. Transport Scheme Design for Emergency Supplies Carried by High-speed Passenger Trains. In Proceedings of the 2020 IEEE 5th International Conference on Intelligent Transportation Engineering (ICITE), Beijing, China, 11–13 September 2020. [Google Scholar]
- Jiang, C.; Sun, W.; Jiang, X. Research on the organization scheme of express transportation on Beijing-Shanghai high-speed railway. Logist. Technol. 2018, 37, 4. [Google Scholar]
- Yao, Y.; Zhang, Y. Research on high-speed railway fast freight transport scheme under passenger train carrying mode. J. Railw. Sci. Eng. 2020, 17, 31–38. [Google Scholar]
- Gao, R.; Niu, H.; Yang, X. Comprehensive optimization of timetable and loading plan for high-speed railway express train with time-varying demand. Transp. Inf. Saf. 2020, 38, 10. [Google Scholar]
- Wang, Y.; Ma, X. Two-stage logistics shipping plan for high-speed rail considering carrying capacity change. J. Transp. Eng. Inf. 2022, 20, 136–144. [Google Scholar]
- Li, S. Research on High-Speed Rail Express Delivery Scheme; Beijing Jiaotong University: Beijing, China, 2020. [Google Scholar]
- Yang, J. Research on High-Speed Rail Express Transportation Scheme of Passenger and Freight Combined Transportation Mode; Beijing Jiaotong University: Beijing, China, 2019. [Google Scholar]
- Fu, H.; Nie, L.; Yang, H.; Tong, L. Analysis of operation planning process of high-speed railway trains. Railw. Transp. Econ. 2009, 31, 4. [Google Scholar]
- Liu, J.; He, S.; Song, R.; Li, H. Research on dynamic path optimization of multimodal transportation based on transportation mode alternatives. J. China Railw. Soc. 2011, 33, 1–6. [Google Scholar]
- Wang, P. Research on the Method of Railway Luggage Transportation Scheme; Beijing Jiaotong University: Beijing, China, 2018. [Google Scholar]
- Tang, L. Research on Customer Value-Driven Railway Logistics Package Service Plan Design Method; China Academy of Railway Sciences: Beijing, China, 2019. [Google Scholar]
- Yu, X.; Zhou, L.; Huo, M.; Yu, X. Research on high-speed railway freight train organization method considering different transportation product demands. Math. Probl. Eng. 2021, 2021, 5520867. [Google Scholar] [CrossRef]
Disclaimer/Publisher’s Note: The statements, opinions and data contained in all publications are solely those of the individual author(s) and contributor(s) and not of MDPI and/or the editor(s). MDPI and/or the editor(s) disclaim responsibility for any injury to people or property resulting from any ideas, methods, instructions or products referred to in the content. |
© 2023 by the authors. Licensee MDPI, Basel, Switzerland. This article is an open access article distributed under the terms and conditions of the Creative Commons Attribution (CC BY) license (https://creativecommons.org/licenses/by/4.0/).