Abstract
Methane is the main cause of sewer explosion accidents, and the available monitoring methods mainly use portable gas sensors for on-site detection. However, these methods cannot grasp the dynamic changes in methane in a sewer in real time or make good predictions of methane explosion accidents. Here, we present a low-power online monitoring system for sewer methane in order to ensure the safety of urban sewers. A low-power ultrasonic gas sensor was used to monitor the methane content in biogas. Due to the impacts of changes in CO2, temperature, and humidity in the sewer on the ultrasonic methane measurement results, a corresponding compensation method was proposed. The effectiveness of the compensation method was verified through experiments, which measured the methane concentration under different influences, and the methane values measured before and after compensation were compared. The power consumption was only 1.28 mW when the system worked in intermittent operation mode, and it could operate for about 1.5 years using a lithium battery with a capacity of 5 Ah. The experimental results showed that gas detection accuracy could meet commercial requirements and compensated for the impacts of carbon dioxide, temperature, and humidity.
1. Introduction
Methane is one of the main components of biogas in sewers, and is quite explosive when its concentration exceeds the lower explosive limit (about 5% by volume) [1]. Due to rapid development of the economy, urban populations continue to grow, and garbage and sewage are increasing by large quantities; this has led to an increase in the concentration of biogas in urban sewers, and sewer explosion accidents are commonly seen.
In recent years, few gas explosions in sewers and septic tanks have been reported in developed countries, such as those in Europe and the United States [2]. Since the population densities of these countries are quite low and the urban facilities are complete, they produce less biogas and the operating pressure of the sewers is low. Therefore, portable gas sensors are commonly used for on-site sewer gas detection [3]. However, in China, as the urbanization process continues to accelerate and urban population density is increasing year by year, there is tremendous pressure on urban facilities. From 2004 to 2009, there were at least 26 sewage biogas explosions in the main area of the city of Chongqing, China [4]. If an on-site detection method were used to monitor the content of biogas, it would incur high costs in human and material resources; in addition, the content of sewage gas continuously changes over time, and such a method would not be able grasp the changes in the content of sewage biogas in real time. Once the concentration of hazardous gas (methane) reaches the lower explosive limit (LEL), it is not possible to take emergency measures to reduce the gas concentration to avoid accidents. Thus, developing a real-time sewer gas monitoring system is necessary for countries such as China.
For sewer gas monitoring systems, manual sampling is usually followed by laboratory gas chromatography (GC) measurements. However, this method cannot capture the concentration of methane in the sewer in real time and requires a lot of manpower and resources. In response to this issue, Markus Fluggen proposed a device to monitor the dissolved methane concentration at the end of a rising main sewer network by pumping out sewage samples [5]; this device was able to capture dynamic changes in methane concentration in real time. Since the long-term monitoring of sewer gases requires a gas detection device with low power consumption and long-term stability, this system is not suitable for the networked monitoring of urban sewer gases. Jung Soo Lim proposed the SewerSnort monitoring device, which used a float sensor to collect gas measurement values and the location information of sampling points [6]; gas measurement results could be obtained from the float sensor after its stroke was completed. The innovation of this technology lies in the use of SewerSnort for fully automated sewer gas monitoring, which is more efficient and cost-effective than previous methods. However, it is necessary to regularly allocate float sensors for sampling to understand how the level of gas in the sewer varies over time.
To achieve low power consumption and high reliability in sewer gas monitoring, it is necessary to select suitable gas sensors. Commonly used methane sensors include catalytic sensors, semiconductor sensors, and photoacoustic sensors [7,8,9,10]. Catalytic sensors are generally high in power, and their electrodes are affected by the toxic effects of hydrogen sulfide, so they are not suitable for sewer gas detection [11]. Semiconductor sensors use metal oxide semiconductor materials to cause changes in resistance or conductance after contact with the gas to be measured [12]. Since there may be other kinds of gases in a sewer that can be oxidized, such gases will react with the sensor, which will cause a large error in the measurement results. Photoacoustic sensors are usually expensive and are suitable only for experimental projects [13]. The application of ultrasonic sensors in gas detection is relatively rare, but they offer the advantages of low power consumption and high safety, and can be used for methane gas detection [14,15,16]. Their detection principle is derived from a physical theory based on the gas sound velocity measurement method [17,18]; thus, such sensors have long-term stability. However, ultrasonic sensors do not have gas selectivity and are commonly used for the binary detection of mixed gases. Moreover, the speed of sound is greatly affected by temperature and humidity [19,20], and constant changes in sewer temperature over time will affect the measurement results of such sensors.
In this study, we proposed a sewer gas monitoring system for detecting the methane concentration in a sewer environment with multiple mixed gases by using ultrasonic sensors. By using ultrasonic gas detection, the power consumption of the sewer gas monitoring system was further reduced. We also proposed a method of compensating for the effects of the sewer environment (i.e., temperature and humidity). The power of the sewer gas monitoring system was evaluated, and the detection accuracy was tested. We also designed a compensation experiment to test the system’s performance in compensating for the sewer environment’s impact. This will provide a scientific basis for the achievement of low-power-consumption sewer gas monitoring.
2. Methodology
The principle of ultrasonic gas detection is based on sound velocity measurements. Sound velocity measurement methods can be divided into threshold detection (TH) methods and phase difference (PD) methods [21]. The difference between the two types of methods is that TH methods send an ultrasonic pulse group, while PD methods send a continuous ultrasonic wave, and the gas concentration is indicated by measuring the signal delay between the transmitter and the receiver. In terms of detection accuracy and resolution, PD methods are better than TH methods. Furthermore, threshold detection methods require a high-frequency ultrasonic probe, which has a high cost. Therefore, a PD method was chosen for this study.
2.1. Principle of an Ultrasonic Methane Sensor
The sound velocity analysis of different gas mixtures is based on the general equation of sound velocity:
where is the specific heat ratio of the gas (where and are the specific heat capacities at a constant pressure and volume, respectively), R is the ideal gas constant, T is the temperature of the gas in Kelvin, and M is the molar mass of the gas. The speed of sound is influenced by the molar mass of the transmission medium; if the content of methane in a methane–air mixture changes, the speed of sound changes accordingly.
For a methane–air mixture, if the volume fraction of methane is x, the sound velocity of the mixed gas can be expressed by the general equation of sound velocity as follows:
where MCH4 and Mair are the molar masses of methane and air, respectively. The sound velocity of the gas can be obtained by measuring the time of flight (TOF) between the transmitter and receiver.
2.2. Ultrasonic Methane Detection Principle in a Sewer Environment
Sewage mainly contains methane, carbon monoxide, hydrogen sulfide, ammonia, and carbon dioxide [22]. Most sewer explosions are methane explosions. Carbon monoxide and hydrogen sulfide are toxic gases and occur in concentrations far lower than those of methane and carbon dioxide. Meanwhile, ammonia is extremely soluble in water, and has a concentration of approximately zero. Therefore, the effects of carbon monoxide, hydrogen sulfide, and ammonia can be ignored. However, the content of carbon dioxide in mixed gases is relatively high, and the sound velocity c will decrease by 0.89 m/s for each 1% increase in its concentration. Therefore, the impact of carbon dioxide cannot be ignored. In addition, if the concentration of carbon dioxide is at a high level, it can lead to suffocation and death, so the real-time detection of carbon dioxide is necessary.
Humidity varies over time due to the influence of weather, and the content of water vapor directly affects the molar mass of a mixed gas, which, in turn, affects the speed of sound. Thus, the influence of humidity should be considered, and water vapor should be treated as a part of the mixed gas. In this study, we used a humidity sensor to monitor the environmental humidity of a sewer in real time, and we converted the humidity into the proportion of water vapor in the mixed gas.
According to the above analysis, a sewer can be simplified as a mixture of methane, carbon dioxide, and water vapor, with air as the background gas. According to the general equation of sound velocity, the relationship among sound velocity , the concentration of methane x, the concentration of carbon dioxide y, and the concentration of water vapor z can be expressed as
2.3. Structure and Working Principle of the Ultrasonic Methane Sensor
The traditional PD measurement structure directly measures the phase difference in an ultrasonic signal at a transmitter and receiver using only one acoustic tube. However, this structure cannot effectively compensate for the impact of temperature. In this study, a dual-channel acoustic tube measurement structure was adopted, and a reference acoustic tube was added to the single acoustic tube (measurement acoustic tube). The two acoustic tubes were completely identical in structure and length, but the reference acoustic tube is sealed with pure air inside. When the external temperature changed, the sound velocity of the acoustic tubes changed accordingly, and the dual-channel acoustic tube structure played the role of temperature compensation to a certain extent. Figure 1 shows the structure of the dual-channel acoustic tube measurement unit.
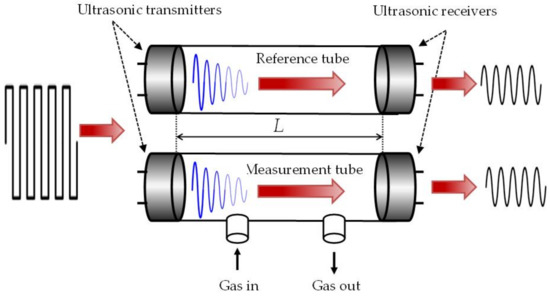
Figure 1.
Structure of the dual-channel acoustic tube measurement unit.
The ultrasonic transmitter was set to a continuous-wave working mode, and an ultrasonic receiver was placed at the other end of the acoustic tube to detect the transmitted ultrasonic signal. Due to the attenuation of acoustic energy during transmission, the amplitude of the received ultrasonic signal was relatively low after passing through the acoustic tube. Thus, the received signal was sent to a signal amplification circuit for amplitude amplification. Since the phase detector we use is designed using a D trigger, the input signal must be a square wave signal. Therefore, the amplified signal was then sent to the shaping circuit to convert the sine wave signal into a square wave signal. The phase difference between the signals of the dual-channel acoustic tubes was then obtained through a phase detector. The circuit composition of the ultrasonic sensor module is shown in Figure 2.
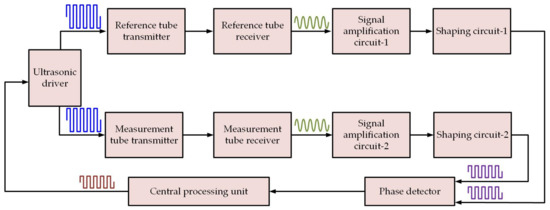
Figure 2.
Circuit composition of the ultrasonic sensor module.
3. Composition of the Sewer Monitoring System
The sewer gas monitoring system consisted of sensor detection nodes, gateways, and monitoring centers. We placed sensor detection nodes in the manhole covers of densely populated areas of cities (that is, areas prone to biogas explosion accidents) and set up gateways in these areas. The detection information would be transmitted through the gateways to a monitoring center. A block diagram of the composition of the monitoring system is shown in Figure 3.
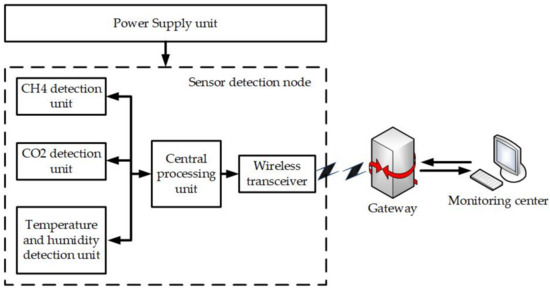
Figure 3.
Block diagram of the composition of the sewer monitoring system.
The sensor detection node was the core part of the monitoring system, as it was responsible for monitoring the methane concentration in the sewer and sending detection information to the gateway. The detection node consisted of a methane detection unit, a carbon dioxide detection unit, a temperature and humidity detection unit, a central processing unit, and a wireless communication module.
The methane detection unit was designed using the aforementioned dual-channel ultrasonic PD method. One reason for adopting this method was that other methane sensors generally have high power consumption, which cannot meet the needs of long-term use in a sewer. The ultrasonic measurement method has low power consumption, so it can ensure that the system can work continuously for several months.
For the carbon dioxide detection unit, an infrared-absorption carbon dioxide sensor was selected for the system. There were two reasons for using this type of carbon dioxide sensor: one was that carbon dioxide has a high impact on the ultrasonic measurement of methane concentration, which needs to be measured and corrected, and the other is that a high carbon dioxide concentration can cause on-site workers to suffocate.
Changes in temperature and humidity have certain impacts on the measurement results of ultrasonic methane sensors. In order to minimize these impacts, measuring the ambient temperature and humidity is necessary, and numerical corrections must then be made based on a theoretical analysis. The temperature and humidity detection unit used a single-bus integrated temperature and humidity sensor, which had the characteristics of low power consumption, ease of use, and good stability.
The central processing unit of the detection node was responsible for collecting the detection data from the methane detection unit, carbon dioxide detection unit, and temperature and humidity detection unit, performing data processing on these data, and then determining whether the gas concentration was within a safe limit. The detection information was packaged and transmitted to the wireless communication module at given time intervals. The packaged information included the wellhead number, methane gas concentration value, carbon dioxide gas concentration value, safety status, etc.
A Zigbee module with a low power consumption was used as a wireless data communication module. A communication network constructed with Zigbee modules meets the requirements of low-cost and low-power sensor networks, thus helping to extend battery life and improve the reliability of monitoring systems.
Since the specific gravity of methane gas is relatively low, the methane concentration in the upper layer of a sewer is the highest. The sensor detection node was placed 0.5 m from the ground in the sewer. Each wellhead was numbered, reflecting location information for the corresponding sewer. The sensor detection node collected gas concentration information in real time and sequentially transmitted the wellhead number and concentration information to the nearby gateway via a wireless network. The gateway then transmitted the detection information to the monitoring center via serial communication. The monitoring center calculated and processed the collected data according to the communication protocol and displayed the gas concentration information for each wellhead.
The gateway was responsible for collecting the information transmitted by the sensor detection node in the area and forwarding it to the monitoring center. It consisted of a Zigbee communication module and an alarm device. Typically, sewer monitoring devices are installed in densely populated areas, dividing them into several small areas; each small area contains a gateway, which is installed in the center of the small area. The division of these small areas must guarantee that each sensor detection node within the area can communicate with the gateway. The gateway communicates wirelessly with the sensor detection node through the Zigbee network and communicates with the host computer of the monitoring center through a serial port with an RS-485 interface. If the concentration of methane in a sewer in an area exceeds the safety limit, the alarm device of the gateway emits an audible and visual alarm.
The working software of the monitoring center was designed using Labview 2013, which can dynamically display the concentration of methane in the sewer of the monitored area. When the methane concentration in the sewer exceeds the alarm’s threshold, an alarm prompt is issued. The location of the sewer can be determined based on the wellhead number, and the staff can be informed to adopt appropriate steps to prevent an accident from happening.
4. System Power Consumption Analysis
The selection of most of the components of the sensor detection nodes was based on the requirement for low power consumption. Details on the selection and power consumption of the main components involved in the sensor detection nodes are shown in Table 1.

Table 1.
Selection and power consumption of the main components of the sensor detection nodes.
The monitoring system was divided into an intermittent operation mode and a continuous operation mode to reduce power consumption. The system was set to the intermittent operation mode when the methane concentration in the sewer gas environment did not exceed the alarm limit. The intermittent mode of operation was a low-power mode of operation intended to reduce the system’s power consumption by reducing the active-state working time and increasing the sleep time. If the methane concentration in the sewer gas environment exceeded the alarm limit, the system was set to the continuous operation mode until the alarm state was eliminated, and was then switched to the intermittent operation mode. The intermittent mode was divided into four working states, as shown in Table 2.
Table 2.
Four working states of the intermittent operation mode.
The components marked with √ in Table 2 are in the active state; S1 indicates the sleep state, S2 indicates the working state of the ultrasonic sensor module, S3 indicates the joint working state of the methane sensor, carbon dioxide sensor, and temperature and humidity sensor, and S4 indicates the data communication state. The time duration is the continuous working time of an active component in a state, and the cycle time is the length of time that elapses until this state is restarted. Considering that the temperature and humidity of a sewer vary slowly, it is not necessary to measure the temperature and humidity frequently. Since the carbon dioxide sensor consumed a large amount of power, the cycle time for S3 was set to be relatively long. We set the S3 state to be executed after every four repetitions of S1 and S2; thus, it could both compensate for temperature and humidity and reduce the system’s power consumption. The relationship between time and power consumption in S3 is shown in Figure 4. Since the power consumption of the Zigbee module was high, the cycle time of S4 was set to 6 h (i.e., sending monitoring data every 6 h) if the sewer gas concentration was normal, and the Zigbee module was in the sleep state for the rest of the time. Table 3 shows the power consumption analysis of these four operating states.
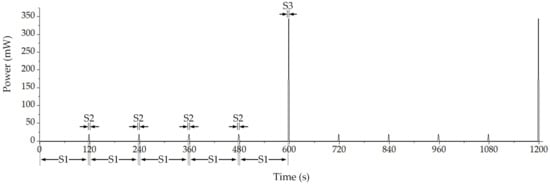
Figure 4.
Relationship between time and power consumption in the S1, S2, and S3 states.
Table 3.
Power consumption of the four working states.
In Table 3, the total power of each state is the sum of the power consumption of the working components. The average power consumption is the sum of the average power consumption in each state, which was obtained by multiplying the total power consumption in each state by the time weight, where the time weight = time duration/cycle time. In Table 3, it can be seen that the average power consumption of the sensor detection node was 1.284 mW in the intermittent operation mode, the internal working voltage of the sensor node was 3.3 V, and the weighted-average working current was 0.389 mA, which would allow the sensor detection unit to operate continuously for about 1.5 years using a lithium battery with a nominal voltage of 3.7 V and a battery capacity of 5 Ah.
If the concentration of methane in a sewer exceeds the safety limit (usually, the methane concentration is set to 1%, which is 20% of the lower explosive limit), the system will enter the continuous operation mode. In this mode, the system continuously monitors the gas concentration. The sensor detection node monitors the condition of the sewer every second, and the Zigbee communication unit uploads data every minute. During this period, the system will issue a message prompting staff to take measures to reduce the concentration of hazardous gases. If the concentration of methane continues to increase to 2.5%, which is 50% of the lower explosive limit, the sensor node will send out a warning signal and the gateway alarm device in the area in which the sewer is located will send out an audible and visual alarm. If the concentration of methane is reduced to below the safety limit, the alarm is cleared and the system reverts to the intermittent operation mode.
5. Experiments and Discussion
5.1. Experimental Condition
Since it is difficult to enter an actual sewer for experimental verification, the gas environment used in this experiment was constructed in a laboratory. The test gas was composed of pure methane and air according to a volume ratio, with a gas distribution accuracy of 2%. Since the length of the dual-channel acoustic tubes could not be completely consistent, the time of flight (TOF) of the ultrasonic signal in the dual-channel acoustic tubes was not equal if there was no gas to be measured (i.e., the reference acoustic tube and measurement acoustic tube were filled with air). An average length deviation of 1 mm would result in a 2% methane concentration detection error. In view of this, zero calibration was necessary. We put the sensor detection node into a sealed container that was filled with pure air at room temperature and let it stand for 1 min. Then, we measured the dual-channel phase difference, and the central processing unit recorded the current phase difference and used this value as a zero point. The experiments were all conducted under testing conditions with an ambient temperature of 20 °C and a relative humidity of 75%, except for the temperature and humidity compensation experiments. The laboratory test device is shown in Figure 5.
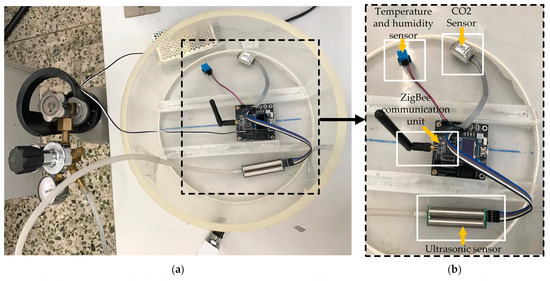
Figure 5.
Laboratory test device: (a) experimental architecture; (b) sensor detection node components.
5.2. Methane and Carbon Dioxide Detection Accuracy Test
Methane–air mixtures with concentrations of 1%, 2%, and 4% were selected for testing. The test results are shown in Table 4, where the absolute error is the difference between the measured value and the actual methane concentration. From the test results, it can be seen that the relative error of detection was less than 3%, and the measurement accuracy met the commercial requirements.
Table 4.
Test results of methane–air mixtures with concentrations of 1%, 2%, and 4%.
Since the detection of carbon dioxide was used to correct the measured value of methane, the measurement results directly affected the measurement accuracy for the methane concentration, and the detection accuracy for carbon dioxide needed to be tested. Table 5 shows the test results for the carbon dioxide concentration when using air as the background gas with concentrations of 0.2%, 0.5%, and 1%. As can be seen in Table 5, the relative error for carbon dioxide did not exceed 3%, and the measurement results met the requirements for high-precision gas concentration detection.
Table 5.
Test results for CO2–air mixtures with concentrations of 0.2%, 0.5%, and 1%.
5.3. Effect of the Correction for the Impact of Carbon Dioxide
Due to the significant impact of carbon dioxide on ultrasonic methane detection, it was necessary to correct the impact of carbon dioxide on the measurement results. In order to verify the corrective effect of the system with respect to carbon dioxide, three concentrations (i.e., 0.5%, 1%, and 1.5%) of CO2–air mixtures were prepared as background gases, and gas mixtures composed of CH4, CO2, and air with CH4 concentrations of 0%, 2%, and 4% were prepared according to a volume ratio.
We first tested the measured values before correction for each methane concentration using a mixture of carbon dioxide and air as the background gas; we then tested the corrected measured values at each methane concentration and compared the measured values before and after carbon dioxide correction. Figure 6 shows the results of the methane concentration measurements before and after carbon dioxide correction.
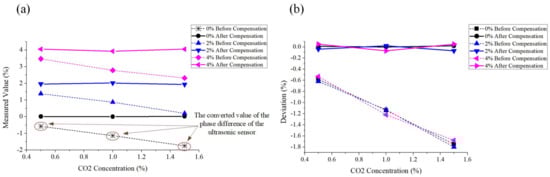
Figure 6.
Results of methane concentration measurements before and after carbon dioxide correction: (a) comparison of methane concentration measurements before and after correction; (b) comparison of methane concentration measurement deviations before and after correction.
Figure 6a shows the actual measured values of methane concentrations with different carbon dioxide concentrations, and the deviations shown in Figure 6b are the difference between the measured value and the actual value. The dotted line represents the measured value before correction and the solid line represents the measured value after correction. A measurement result is marked with * if the measured dual-channel phase difference was converted into a negative value. In the measurement results, there was a large deviation before carbon dioxide correction, and the measured values decreased as the concentration of carbon dioxide increased. As shown in Figure 6a, if the methane concentration was zero, the measured values were all negative. This was because the sound velocity of carbon dioxide is lower than that of air, and the phase of the measuring acoustic tube signal lags behind the phase of the reference acoustic tube signal. When there was only carbon dioxide in the gas mixture with no methane present, or the concentration of methane was quite low, the measured value obtained after the calculation was a negative value. It can be seen that the system exhibited good correction with different carbon dioxide concentrations and that the measurement results were more accurate after carbon dioxide correction, thus achieving the requirements for methane gas concentration detection at higher carbon dioxide concentrations.
5.4. Temperature and Humidity Compensation Tests
For the temperature compensation test, we selected the temperatures of 0 °C, 10 °C, 20 °C, and 30 °C to test the system’s methane measurement accuracy at a relative humidity of 75%. Figure 7 shows the measurement results before and after temperature compensation. The dotted line represents the measured value before temperature compensation, and the solid line represents the measured value after temperature compensation. The deviation of the measured value before compensation was relatively large compared to the deviation of the measured value after compensation. The measured value before compensation increased as the temperature increased, and the deviation was minimal when the temperature approached 20 °C. This was because the zero-point calibration of the sensor before testing was at a temperature of 20 °C. The compensated deviation was less affected by the temperature. It could be seen that temperature compensation could further reduce the impacts of temperature changes and improve sensor accuracy. Furthermore, even though the measured values’ deviation before the compensation was large, the accuracy was still high; the dual-channel acoustic tube structure was able to achieve good temperature compensation.
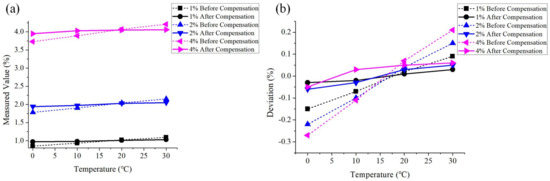
Figure 7.
Results of methane concentration measurements before and after temperature compensation: (a) comparison of methane concentration measurements before and after compensation; (b) comparison of methane concentration measurement deviations before and after compensation.
At an ambient temperature of 20 °C, three saturated salt solutions were selected to attain relative humidity of 59% (sodium bromide), 75% (sodium chloride), and 85% (potassium chloride) in order to verify the humidity compensation performance. The measurement results before and after humidity compensation are shown in Figure 8. Since the zero calibration was performed in an environment with a relative humidity of 75%, measurement deviations before and after compensation were not significantly different at 75% relative humidity. When relative humidity was 59% or 85%, the deviation before compensation was quite large, and the value of the deviation increased as the humidity increased. After humidity compensation, the impact of humidity on the measurement results was significantly reduced.
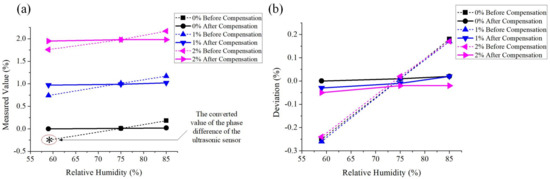
Figure 8.
Results of methane concentration measurements before and after humidity compensation: (a) comparison of methane concentration measurements before and after compensation; (b) comparison of methane concentration measurement deviations before and after compensation.
6. Conclusions
Herein, we proposed a low-power sewer methane monitoring system. The system can monitor the methane concentration in a sewer in real time, judge whether the concentration exceeds a limit, and give appropriate warnings to avoid explosion accidents caused by excessive methane concentrations. The system uses ultrasonic technology to detect the concentration of methane in a sewer, which has the advantage of improving the safety and service life of the monitoring system as well as reducing the system’s power consumption. The power consumption of the wireless monitoring system was analyzed. Furthermore, the impacts on the measurement results of other gases in the sewer and multiple factors, such as the environment of a sewer, were considered, and the interference of other gases was eliminated. Compensation for the environment (i.e., temperature and humidity) was used, further improving the accuracy of the system. The experimental results showed that the methane detection accuracy of the monitoring system could not only meet commercial requirements, but could also reduce the impacts of carbon dioxide, temperature, and humidity on the measurement results. Expanding monitored areas by adding sensor nodes and gateways will better prevent sewer explosions and provide useful information for sewer security management.
Author Contributions
Conceptualization, X.D. (Xin Ding) and Y.S.; methodology, X.D. (Xin Ding); software, H.S.; validation, Y.S. and X.D. (Xibo Ding); data curation, X.D. (Xibo Ding); writing—original draft preparation, X.D. (Xin Ding); writing—review and editing, Y.S. and X.D. (Xibo Ding); visualization, X.D. (Xibo Ding); supervision, H.S.; project administration, Y.S. and X.D. (Xibo Ding); funding acquisition, Y.S. All authors have read and agreed to the published version of the manuscript.
Funding
This research was funded by the National Natural Science Foundation of China. Project Name: Collaborative Strategy for Enzyme Catalyzed Microbial Metabolism Gas Sensor and Efficient and Rapid Detection, grant number 62271176.
Institutional Review Board Statement
Not applicable.
Informed Consent Statement
Not applicable.
Data Availability Statement
Not applicable.
Conflicts of Interest
The authors declare no conflict of interest.
References
- Liu, Y.; Sharma, K.R.; Murthy, S.; Johnson, I.; Evans, Y.; Yuan, Z. On-line monitoring of methane in sewer air. Sci. Rep. 2014, 4, 6637. [Google Scholar] [PubMed]
- Romano, P.; Lorenzo, E. Control of industrial discharges into the sewerage system. Water Supply 2000, 18, 685–689. [Google Scholar]
- Kumar, V.D.A.; Elangovan, D.; Gokul, G.; Praveen Samuel, J.; Ashok Kumar, V.D. Wireless sensing system for the welfare of sewer labourers. Healthc. Technol. Lett. 2018, 5, 107–112. [Google Scholar] [CrossRef] [PubMed]
- Bai, J.; Xiong, Y. Discussion on the Cancellation of the Septic Tank in Chongqing. Chongqing Archit. 2006, 8, 30–31. [Google Scholar]
- Liu, Y.; Sharma, K.R.; Fluggen, M.; O’Halloran, K.; Murthy, S.; Yuan, Z. Online dissolved methane and total dissolved sulfide measurement in sewers. Water Res. A J. Int. Water Assoc. 2015, 68, 109–118. [Google Scholar] [CrossRef]
- Lim, J.S.; Kim, J.; Friedman, J.; Lee, U.; Vieira, L.; Rosso, D.; Gerla, M.; Srivastava, M.B. SewerSnort: A drifting sensor for in situ Wastewater Collection System gas monitoring. Ad Hoc Netw. 2013, 11, 1456–1471. [Google Scholar] [CrossRef]
- Su, J.C.; Cao, L.H.; Li, L.; Wei, J.; Li, G.N.; Yuan, Y.Y. Highly sensitive methane catalytic combustion micro-sensor based on mesoporous structure and nanocatalyst. Nanoscale 2013, 5, 9720–9725. [Google Scholar] [CrossRef]
- Chen, L.; Yu, Q.W.; Pan, C.Y.; Song, Y.H.; Dong, H.; Xie, X.Y.; Li, Y.; Liu, J.; Wang, D.; Chen, X. Chemiresistive gas sensors based on electrospun semiconductor metal oxides: A review. Talanta 2022, 246, 123527. [Google Scholar]
- Sampaolo, A.; Patimisco, P.; Giglio, M.; Zifarelli, A.; Wu, H.P.; Dong, L.; Spagnolo, V. Quartz-enhanced photoacoustic spectroscopy for multi-gas detection: A review. Anal. Chim. Acta 2021, 1202, 338894. [Google Scholar] [CrossRef]
- Boulart, C.; Connelly, D.P.; Mowlem, M.C. Sensors and technologies for in situ dissolved methane measurements and their evaluation using Technology Readiness Levels. TrAC Trends Anal. Chem. 2010, 29, 186–195. [Google Scholar] [CrossRef]
- Lu, N.; Fan, S.; Zhao, Y.; Yang, B.; Hua, Z.; Wu, Y. A selective methane gas sensor with printed catalytic films as active filters. Sens. Actuators B Chem. 2021, 347, 130603. [Google Scholar] [CrossRef]
- Liu, H.; Zhang, X.; Zhao, B.; Wu, B.; Zhang, H.; Tang, S. Simultaneous Measurements of Refractive Index and Methane Concentration through Electromagnetic Fano Resonance Coupling in All-Dielectric Metasurface. Sensors 2021, 21, 3612. [Google Scholar] [CrossRef] [PubMed]
- Mordmueller, M.; Edelmann, S.; Knestel, M.; Schade, W.; Willer, U. Phase Optimized Photoacoustic Sensing of Gas Mixtures. Appl. Sci. 2020, 10, 438. [Google Scholar] [CrossRef]
- Sheen, S.H.; Chien, H.T.; Raptis, A.C. Ultrasonic technique for detecting helium leaks. Sens. Actuators B 2000, 71, 197–202. [Google Scholar] [CrossRef]
- Tan, X.; Li, M.; Arsad, N. An effective temperature compensation approach for ultrasonic hydrogen sensors. Rev. Sci. Instrum. 2018, 89, 035005. [Google Scholar] [CrossRef]
- Taskin, M.; Kato, Y. Instant Gas Concentration Measurement Using Ultrasound from Exterior of a Pipe. IEEE Sens. J. 2019, 19, 4017–4024. [Google Scholar] [CrossRef]
- Wong, G.S.K. Speed of sound in standard air. J. Acoust. Soc. Am. 1986, 79, 1359–1366. [Google Scholar] [CrossRef]
- Bates, R.; Battistin, M.; Berry, S.; Bitadze, A.; Bonneau, P.; Bousson, N.; Boyd, G.; Bozza, G.; Crespo-Lopez, O.; Da Riva, E. Implementation of ultrasonic sensing for high resolution measurement of binary gas mixture fractions. Sensors 2014, 14, 11260–11276. [Google Scholar] [CrossRef]
- Sutton, G.; Edwards, G.; Veltcheva, R.; de Podesta, M. Twin-tube practical acoustic thermometry: Theory and measurements up to 1000 °C. Meas. Sci. Technol. 2015, 26, 085901. [Google Scholar] [CrossRef]
- Huang, C.F.; Huang, K.N.; Li, Y.C.; Young, M.S. Two-frequency continuous wave ultrasonic system for temperature measurement in an infant incubator. Biomed. Eng. Appl. Basis Commun. 2001, 13, 296–303. [Google Scholar] [CrossRef]
- Costa, M.M.; Freire, R.C.S.; Villanueva, J.M.M. Concentration H2 measurement and uncertainty analysis using ultrasonic transducer. In Proceedings of the 2012 IEEE International Instrumentation and Measurement Technology Conference, Graz, Austria, 13–16 May 2012; pp. 763–767. [Google Scholar]
- Ojha, V.K.; Dutta, P.; Chaudhuri, A. Identifying hazardousness of sewer pipeline gas mixture using classification methods: A comparative study. Neural Comput. Appl. 2016, 28, 1343–1354. [Google Scholar] [CrossRef]
Disclaimer/Publisher’s Note: The statements, opinions and data contained in all publications are solely those of the individual author(s) and contributor(s) and not of MDPI and/or the editor(s). MDPI and/or the editor(s) disclaim responsibility for any injury to people or property resulting from any ideas, methods, instructions or products referred to in the content. |
© 2023 by the authors. Licensee MDPI, Basel, Switzerland. This article is an open access article distributed under the terms and conditions of the Creative Commons Attribution (CC BY) license (https://creativecommons.org/licenses/by/4.0/).