
An Information-Theoretic Approach for Detecting Community Structure Based on Network Representation


Abstract
:1. Introduction
- An average mutual-information-based community evaluation index is proposed, which is applicable to top-down community evolution processes and bottom-up community evolution processes. By calculating the average mutual information and information entropy of adjacent states, the AMI-based community evaluation index can measure the stability of each state of a community evolution process.
- An information-theoretic approach based on network representation named AMI-NRL is proposed. This approach combines network representation and the AMI-based community evaluation index to achieve stable and accurate community detection.
- Experiments were conducted to verify the accuracy and stability of the approach, in comparison with typical community detection algorithms on real-world and synthetic datasets.
2. Related Work
3. The Approach
3.1. Community Evaluation Index Based on Average Mutual Information
- 1.
- , which denotes that in partitions and , the member nodes of communities and are totally the same. and are actually the same community, which remain unchanged in two states.
- 2.
- , which denotes that community in partition comes from a splitting community in partition .
- 3.
- , which denotes that in partitions and , the member nodes of and are totally different; in other words, the two communities have no relations on the timeline.
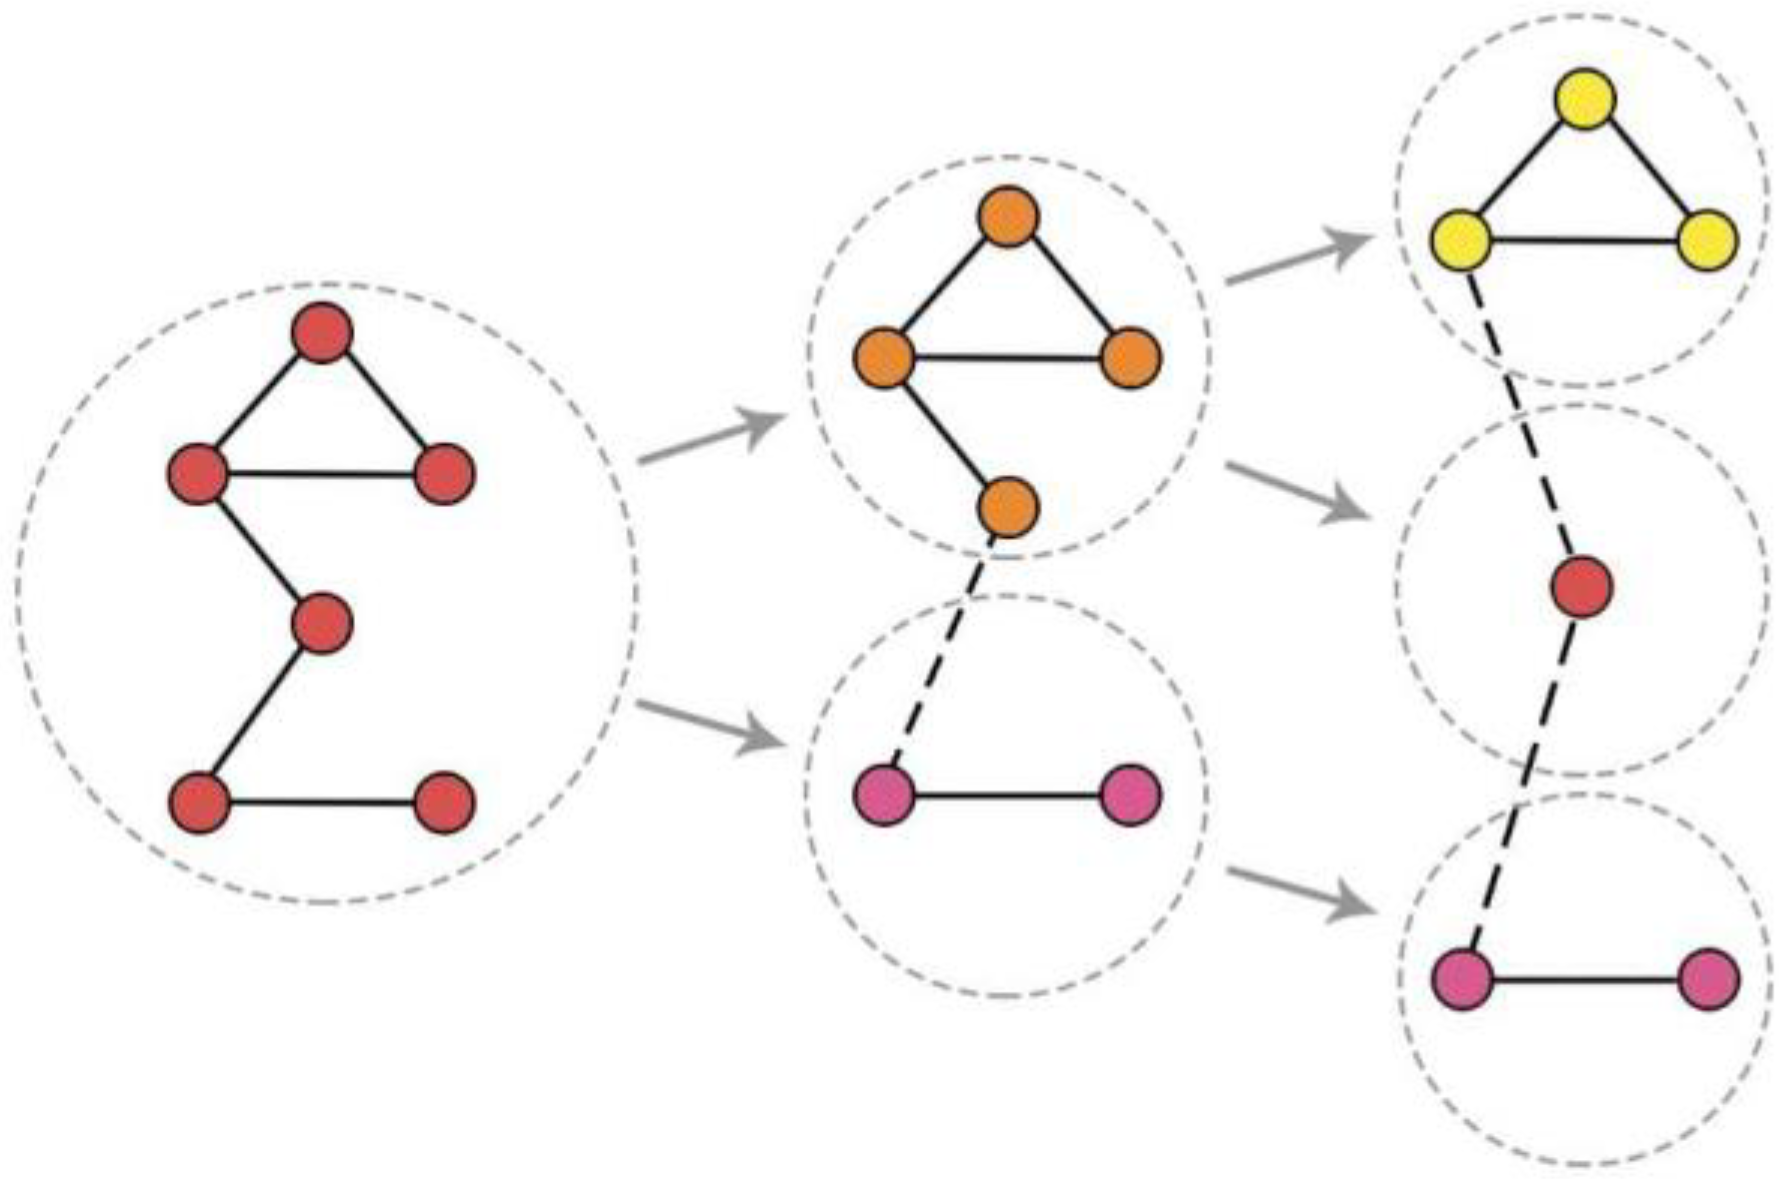
3.2. Basic Process of the Approach
- Random walks through out the network, recording the passing nodes to obtain the node sequences.
- Obtaining the vectorial representation of each node by inputting these sequences into the Word2vec model.
- Cluster these vectors with aggregation hierarchical clustering, regarding the clusters as communities, in order to form a bottom-up cohesion community evolution process
- Calculating the AMI value of each two adjacent partitions, as well as the entropy of each partition.
- Calculating the value of each partition and selecting the partition with largest to output as the result partition.
| Algorithm 1 AMI-NRL | |
| Input: The original network ; | |
| Output: The optimal partition of network ; | |
| 1: | for to do |
| 2: | for to do |
| 3: | Perform a random walk of length started with node ; |
| 4: | Save random walk sequence into list_seq; |
| 5: | end for |
| 6: | end for |
| 7: | model Word2Vec(list_seq, size=neurons_size, window=window_size); |
| 8: | embeddings model.get_embeddings(); |
| 9: | Perform an aggregation hierarchical clustering with embeddings; |
| 10: | Save each state of the aggregation hierarchical clustering into list_partition; |
| 11: | for to do |
| 12: | list_AMI[] average mutual information of list_partition[], list_partition [+1]; |
| 13: | end for |
| 14: | for to do |
| 15: | entropy_i entropy of list_partition[]; |
| 16: | Calculate community evaluation index using max(list_AMI[-1], list_AMI[]) and entropy_i; |
| 17: | if max_Q then |
| 18: | max_Q ; |
| 19: | opt_i ; |
| 20: | end if |
| 21: | end for |
| 22: | return list_partition[opt_i] |
4. Experiments
4.1. Datasets and Experimental Parameters
4.2. Benchmarks
4.3. Results
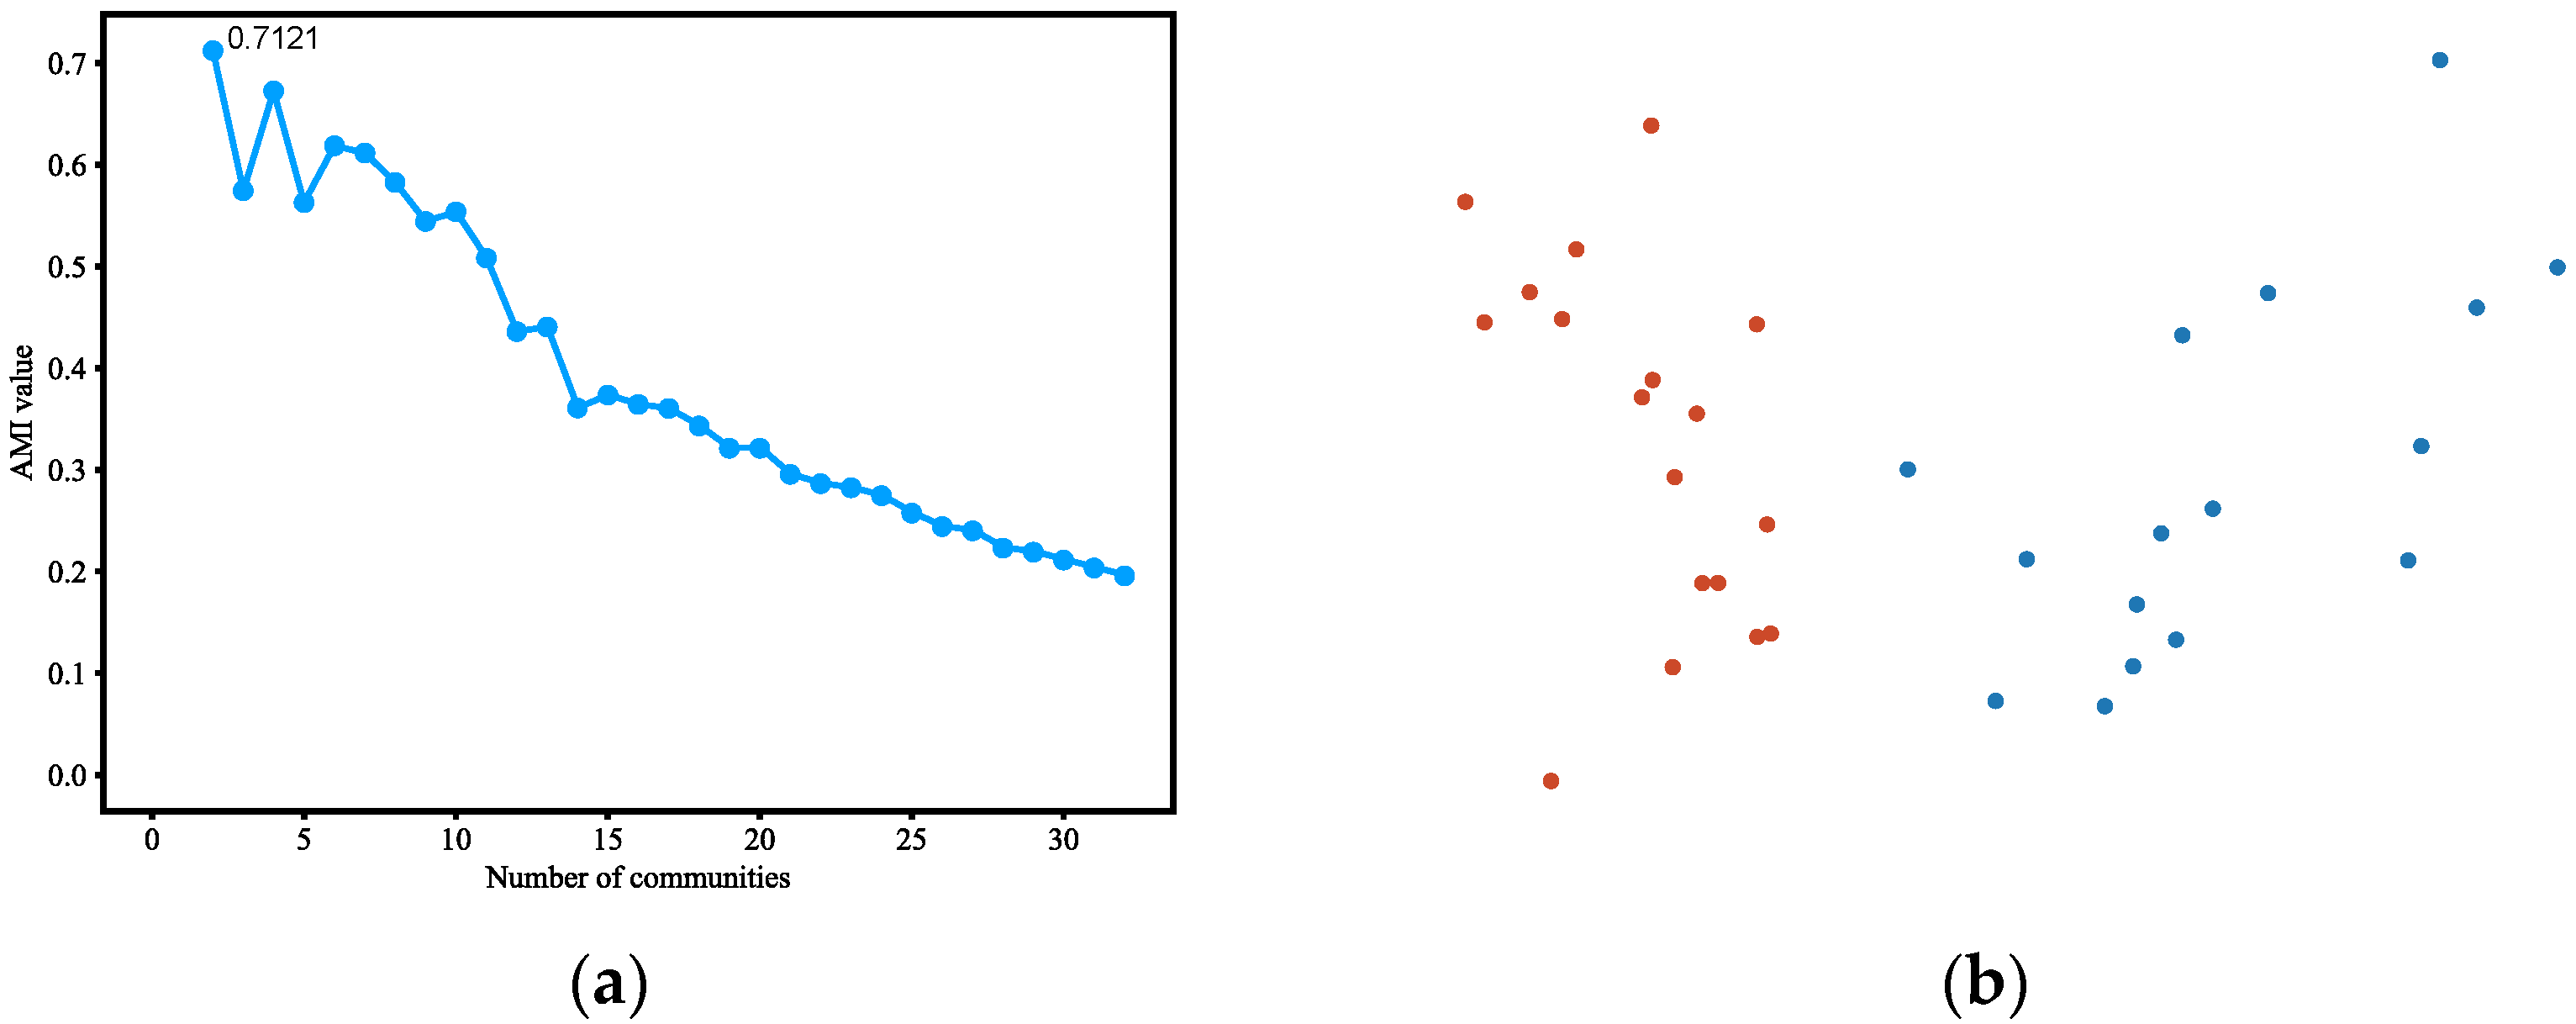
4.3.1. Karate Club
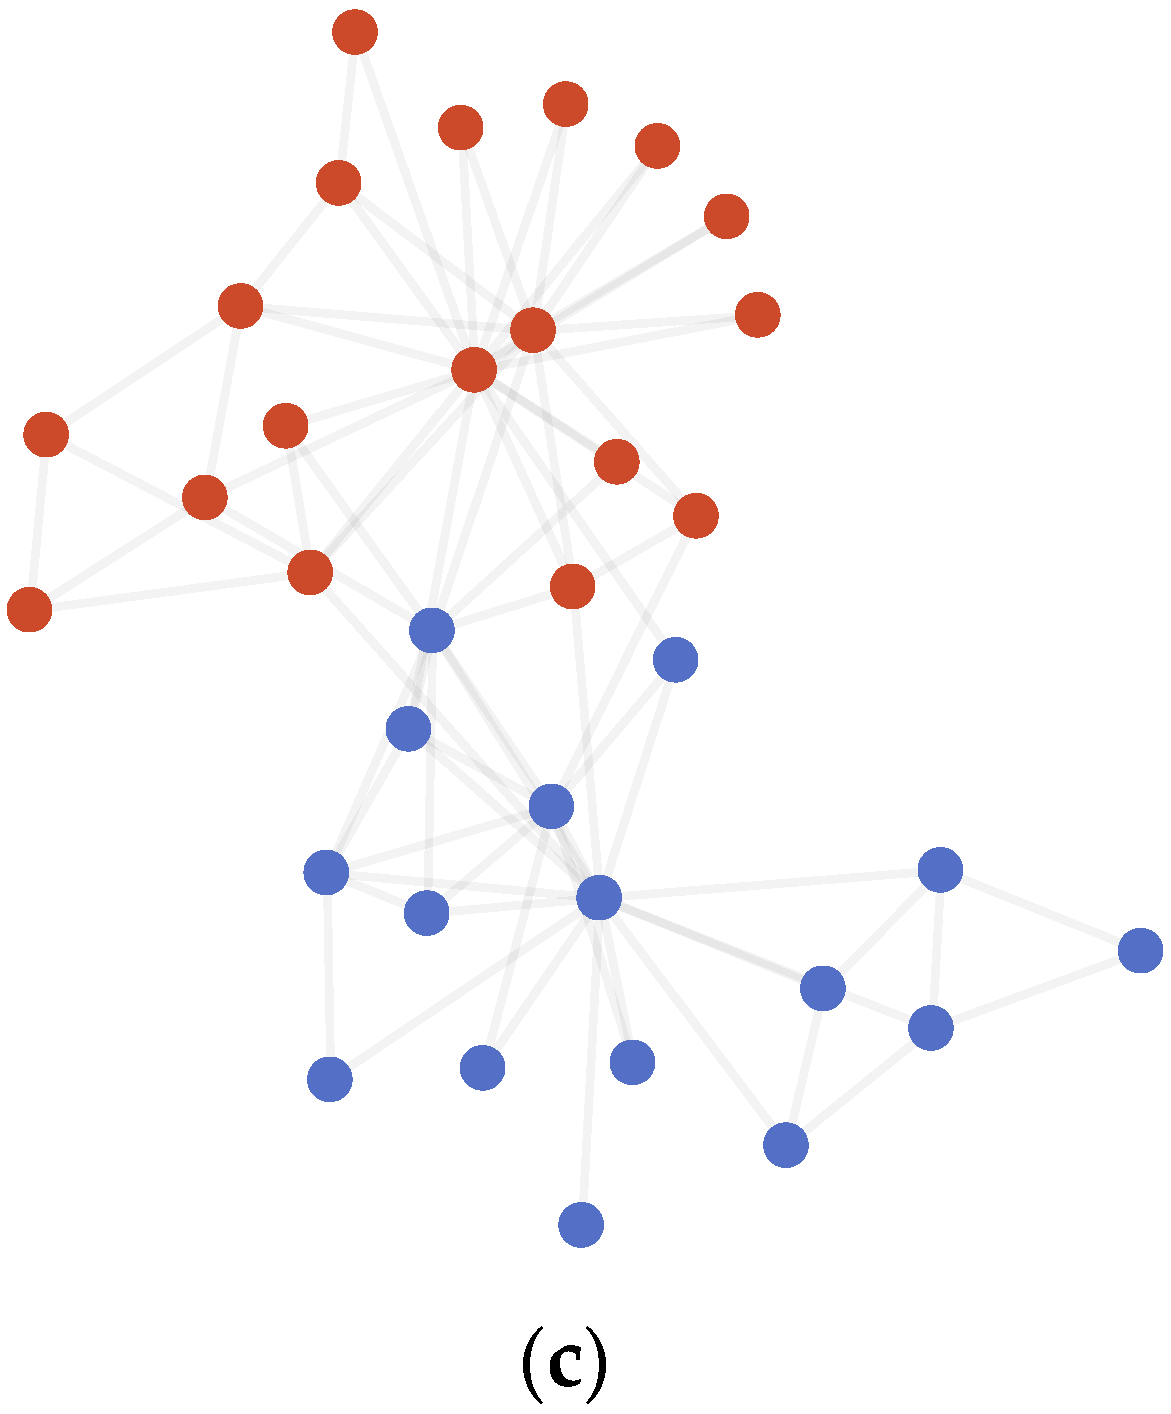
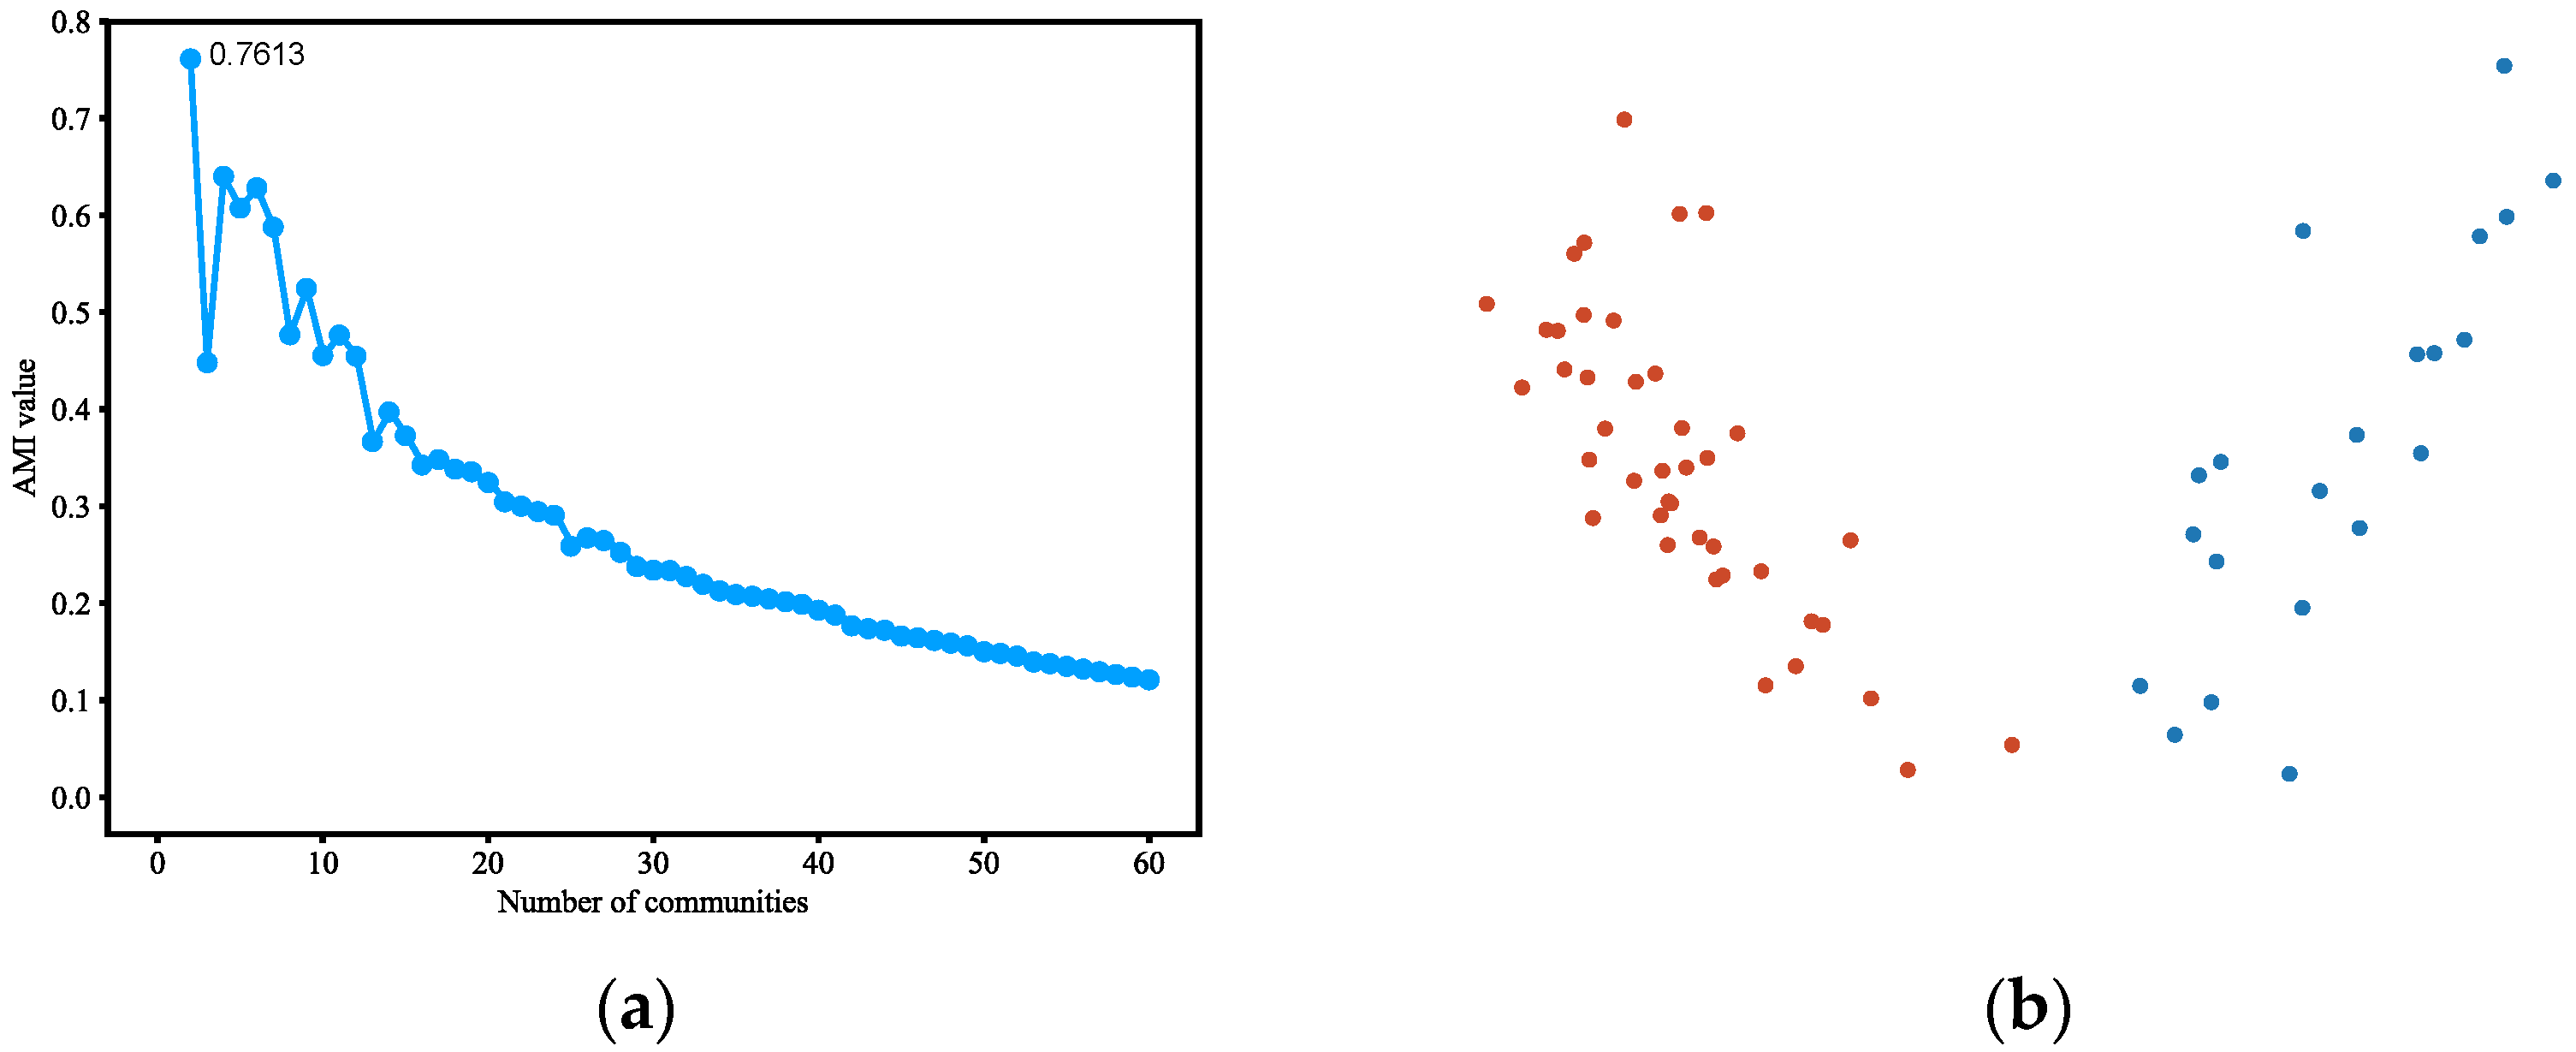
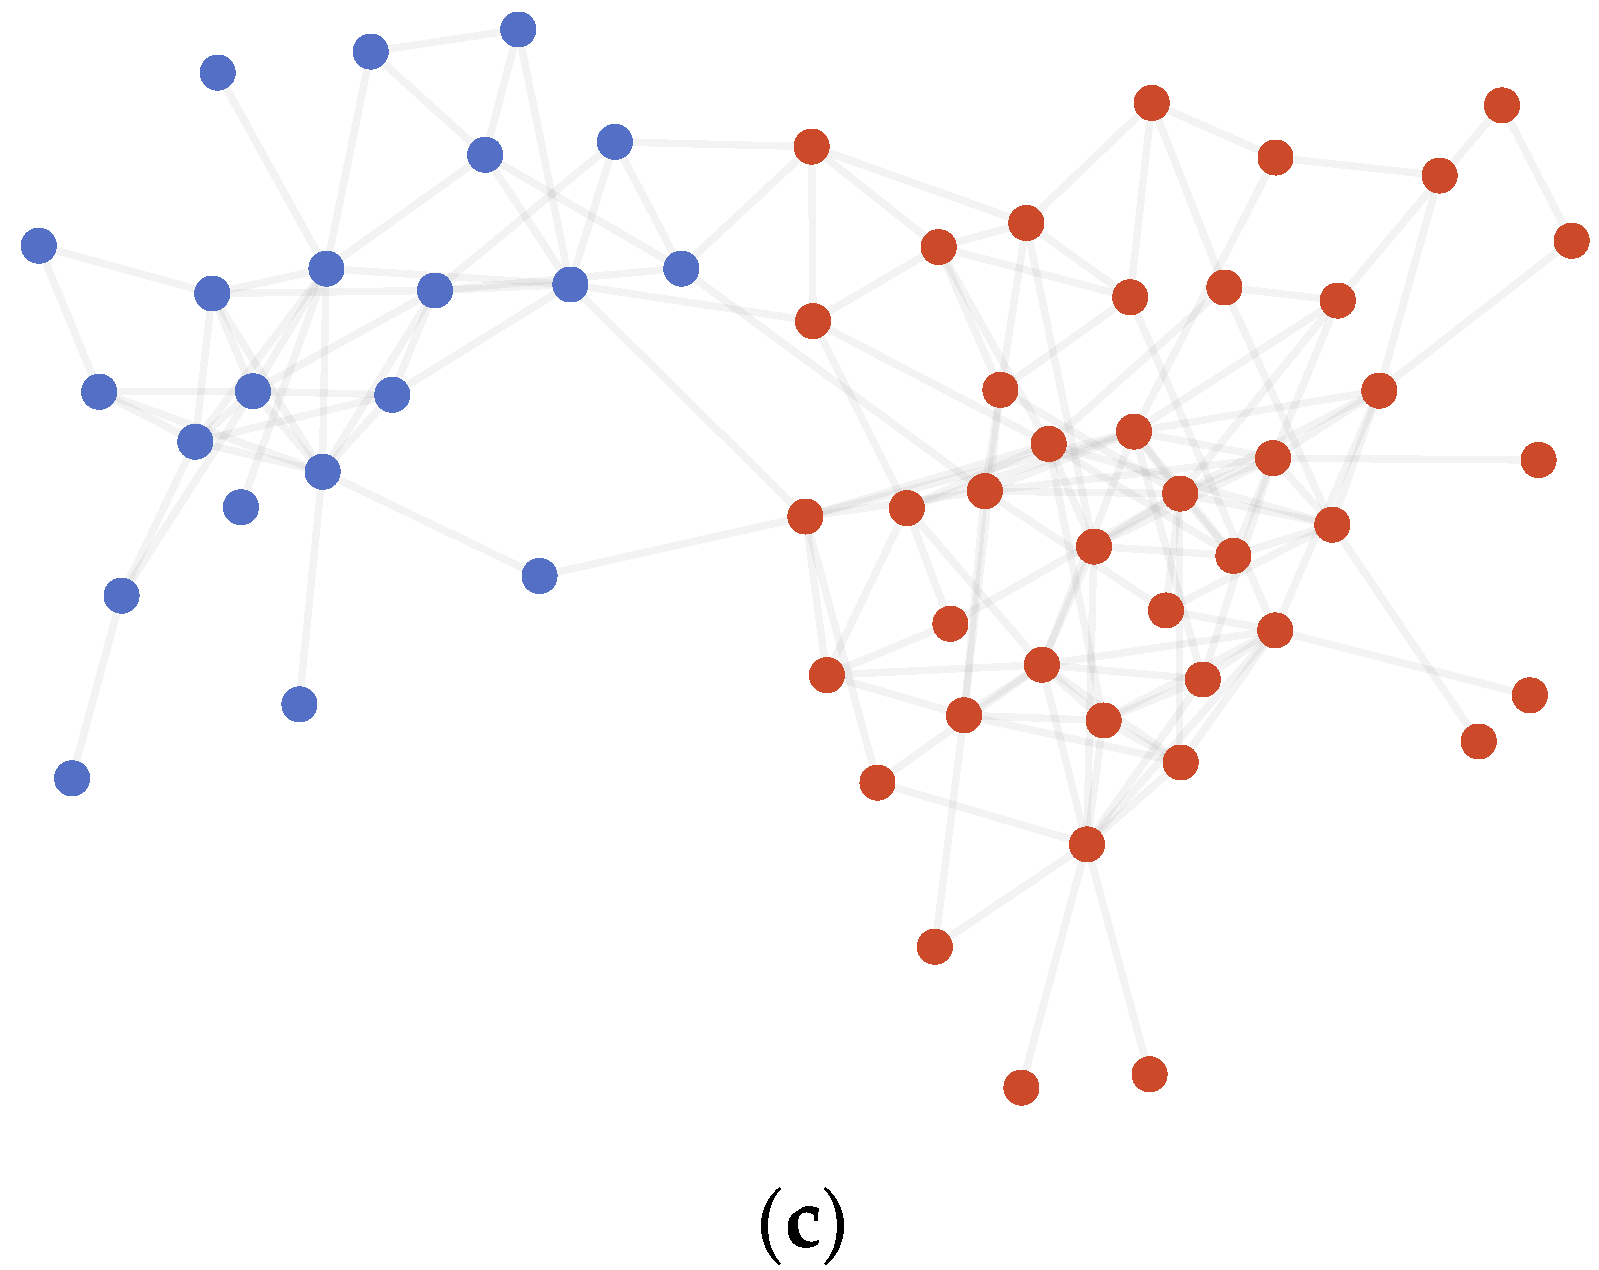
4.3.2. Dolphins
4.3.3. Polbooks
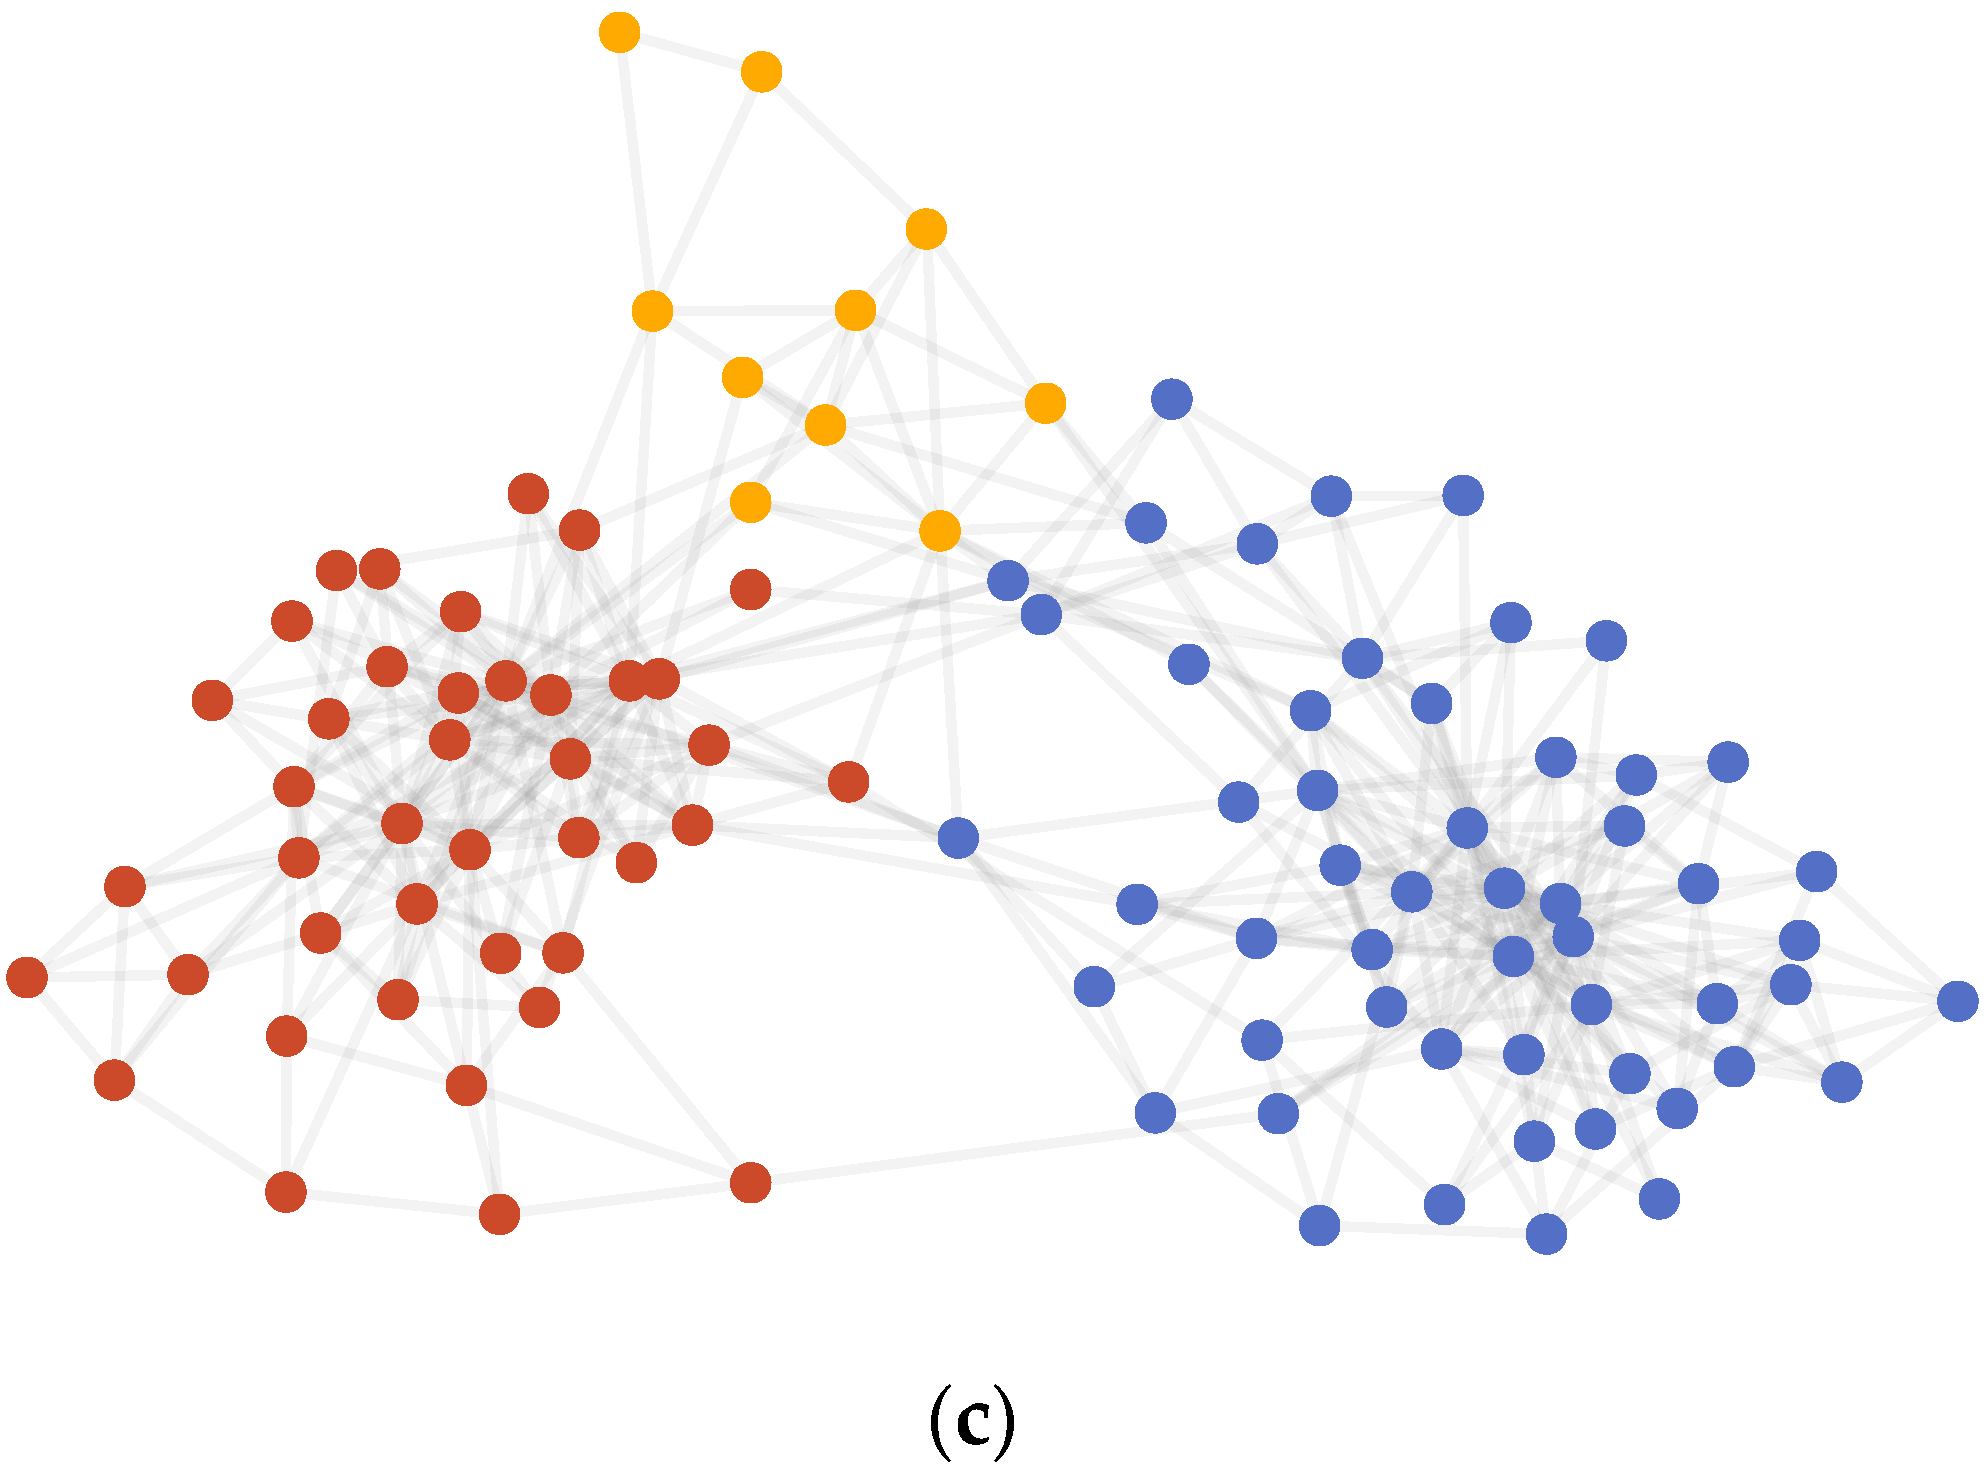
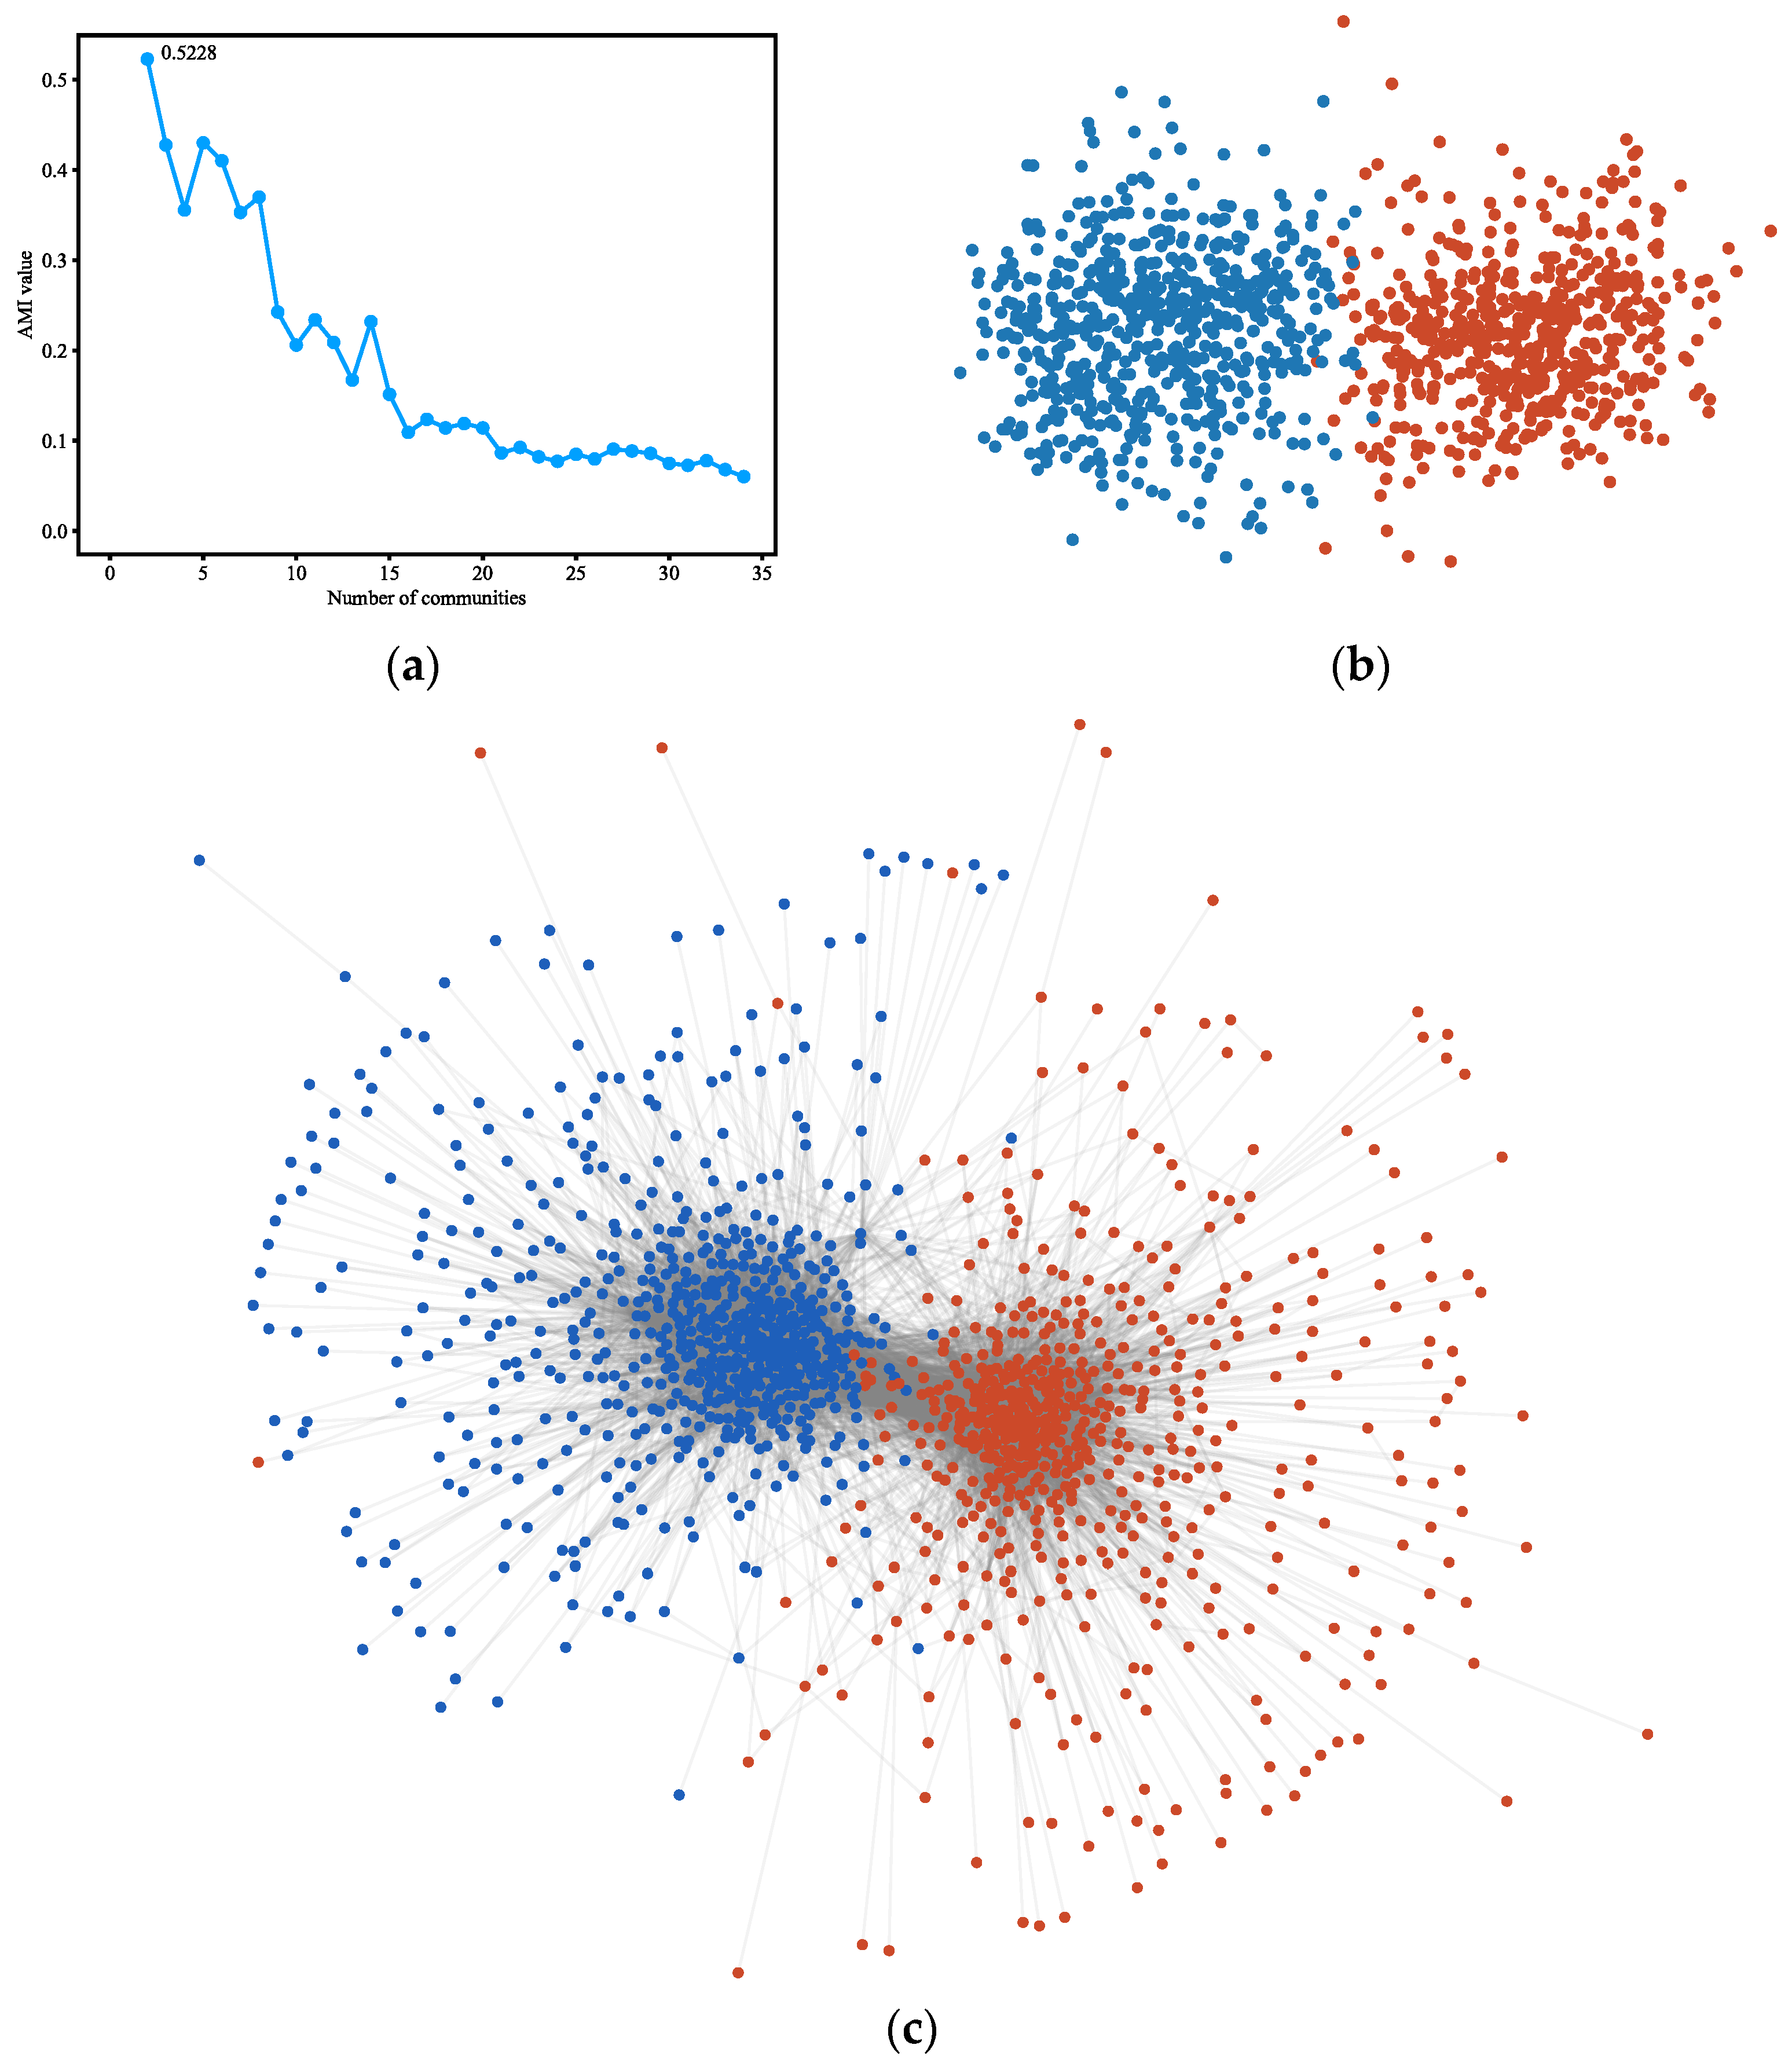
4.3.4. Polblogs
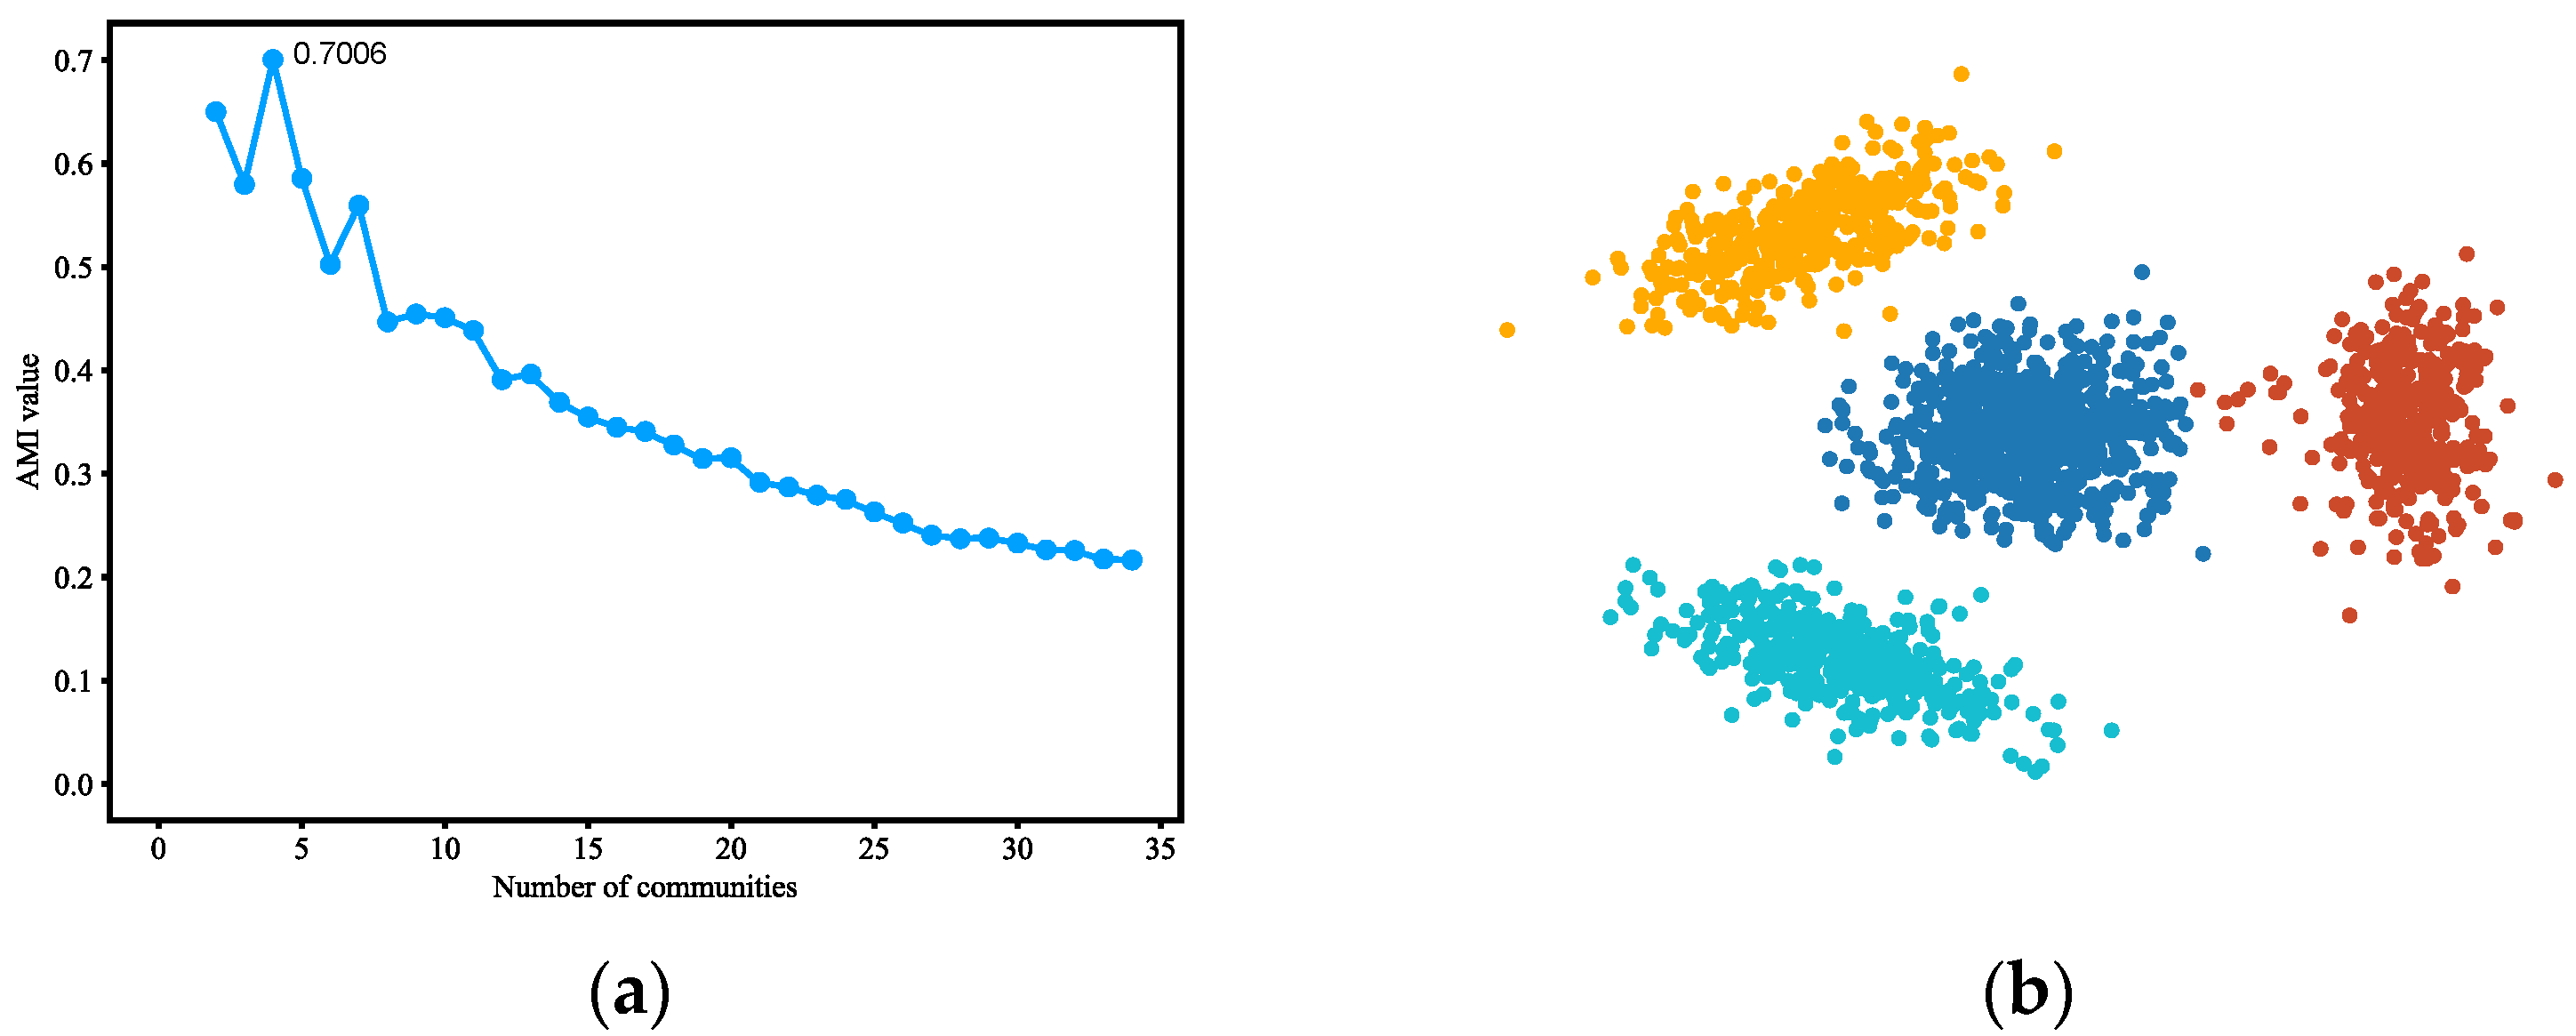
4.3.5. LFR Benchmark
5. Conclusions
Author Contributions
Funding
Institutional Review Board Statement
Informed Consent Statement
Data Availability Statement
Conflicts of Interest
References
- Fortunato, S.; Castellano, C. Community structure in graphs. arXiv 2007, arXiv:0712.2716. [Google Scholar]
- Karataş, A.; Şahin, S. Application areas of community detection: A review. In Proceedings of the 2018 International Congress on Big Data, Deep Learning and Fighting Cyber Terrorism (IBIGDELFT), Ankara, Turkey, 3–4 December 2018; Volume 2018, pp. 65–70. [Google Scholar]
- Newman, M.E.J. Modularity and community structure in networks. Proc. Natl. Acad. Sci. USA 2006, 103, 8577–8582. [Google Scholar] [CrossRef] [PubMed] [Green Version]
- Lancichinetti, A.; Fortunato, S.; Kertész, J. Detecting the Overlapping and Hierarchical Community Structure in Complex Networks. New J. Phys. 2009, 11, 033015. [Google Scholar] [CrossRef]
- Tu, C.; Zeng, X.; Wang, H.; Zhang, Z.; Liu, Z.; Sun, M.; Zhang, B.; Lin, L. A unified framework for community detection and network representation learning. IEEE Trans. Knowl. Data Eng. 2018, 31, 1051–1065. [Google Scholar] [CrossRef] [Green Version]
- Cavallari, S.; Zheng, V.W.; Cai, H.; Chang, K.C.; Cambria, E. Learning community embedding with community detection and node embedding on graphs. In Proceedings of the 2017 ACM on Conference on Information and Knowledge Management, Singapore, 6–10 November 2017; pp. 377–386. [Google Scholar]
- Chen, M.; Nguyen, T.; Szymanski, B.K. A New Metric for Quality of Network Community Structure. Comput. Sci. 2013, 2, 22–29. [Google Scholar]
- Martin, R.; Bergstrom, C.T. Maps of Random Walks on Complex Networks Reveal Community Structure. Proc. Natl. Acad. Sci. USA 2008, 105, 1118–1123. [Google Scholar]
- Lambiotte, R.; Delvenne, J.C.; Barahona, M. Laplacian dynamics and multiscale modular structure in networks. arXiv 2008, arXiv:0812.1770. [Google Scholar]
- Newman, M.E.J. Fast Algorithm for Detecting Community Structure in Networks. Phys. Rev. E 2004, 69, 066133. [Google Scholar] [CrossRef] [Green Version]
- Clauset, A.; Newman, M.E.J.; Moore, C. Finding community structure in very large networks. Phys. Rev. E 2004, 70, 066111. [Google Scholar] [CrossRef] [Green Version]
- Blondel, V.D.; Guillaume, J.L.; Lambiotte, R.; Lefebvre, E. Fast unfolding of communities in large networks. J. Stat. Mech. Theory Exp. 2008, 2008, P10008. [Google Scholar] [CrossRef] [Green Version]
- Gregory, S. Finding Overlapping Communities in Networks by Label Propagation. New J. Phys. 2010, 12, 103018. [Google Scholar] [CrossRef]
- Hou Chin, J.; Ratnavelu, K. A Semi-Synchronous Label Propagation Algorithm with Constraints for Community Detection in Complex Networks. Sci. Rep. 2017, 7, 45836. [Google Scholar] [CrossRef] [PubMed] [Green Version]
- Lee, C.; Reid, F.; McDaid, A.; Hurley, N. Detecting highly overlapping community structure by greedy clique expansion. In Proceedings of the 2010, 16th ACM SIGKDD International Conference on Knowledge Discovery and Data Mining (KDD 2010), Anchorage, AK, USA, 4–8 August 2010. [Google Scholar]
- Rosvall, M.; Bergstrom, C.T. An Information-theoretic Framework for Resolving Community Structure in Complex Networks. Proc. Natl. Acad. Sci. USA 2007, 104, 7327–7331. [Google Scholar] [CrossRef] [PubMed] [Green Version]
- Cai, Q.; Gong, M.; Ma, L.; Jiao, L. A novel clonal selection algorithm for community detection in complex networks. Comput. Intell. 2015, 31, 442–464. [Google Scholar] [CrossRef]
- Su, Y.; Wang, B.; Cheng, F.; Zhang, L.; Zhang, X.; Pan, L. An Algorithm Based on Positive and Negative Links for Community Detection in Signed Networks. Sci. Rep. 2017, 7, 10874. [Google Scholar] [CrossRef] [Green Version]
- Li, P.Z.; Huang, L.; Wang, C.D.; Zhang, L.; Zhang, X.; Pan, L. EdMot: An edge enhancement approach for motif-aware community detection. In Proceedings of the 2019, 25th ACM SIGKDD International Conference on Knowledge Discovery & Data Mining, Anchorage, AK, USA, 4–8 August 2019; pp. 479–487. [Google Scholar]
- Maoguo, G.; Cheng, C.; Yu, X.; Wang, S. Community Preserving Network Embedding Based on Memetic Algorithm. IEEE Trans. Emerg. Top. Comput. Intell. 2018, 2018, 1–11. [Google Scholar]
- Perozzi, B.; Al-Rfou, R.; Skiena, S. Deepwalk: Online learning of social representations. In Proceedings of the 2014, 20th ACM SIGKDD International Conference on Knowledge Discovery and Data Mining, New York, NY, USA, 24–27 August 2014; pp. 701–710. [Google Scholar]
- Grover, A.; Leskovec, J. Node2vec: Scalable feature learning for networks. In Proceedings of the 2016, 22nd ACM SIGKDD international conference on Knowledge discovery and data mining, San Francisco, CA, USA, 13–17 August 2016; pp. 855–864. [Google Scholar]
- Perozzi, B.; Kulkarni, V.; Chen, H.; Skiena, S. Don’t Walk, Skip! Online learning of multi-scale network embeddings. In Proceedings of the 2017, 2017 IEEE/ACM International Conference on Advances in Social Networks Analysis and Mining, Sydney, Australia, 31 July–3 August 2017; pp. 258–265. [Google Scholar]
- Sun, D.L.; Fevotte, C. Alternating direction method of multipliers for non-negative matrix factorization with the beta-divergence. In Proceedings of the 2014 IEEE International Conference on Acoustics, Speech and Signal Processing (ICASSP), Florence, Italy, 4–9 May 2014; pp. 6201–6205. [Google Scholar]
- Qiu, J.; Dong, Y.; Ma, H.; Li, J.; Wang, K.; Tang, J. Network embedding as matrix factorization: Unifying deepwalk, line, pte, and node2vec. In Proceedings of the Eleventh ACM International Conference on Web Searchand Data Mining, Los Angeles, CA, USA, 5–9 February 2018; pp. 459–467. [Google Scholar]
- Torres, L.; Chan, K.S.; Eliassi-Rad, T. GLEE: Geometric Laplacian eigenmap embedding. J. Complex Netw. 2020, 8, cnaa007. [Google Scholar] [CrossRef] [Green Version]
- Zhang, Z.; Cui, P.; Li, H.; Wang, X.; Zhu, W. Billion-scale network embedding with iterative random projection. In Proceedings of the 2018 IEEE International Conference on Data Mining (ICDM), Singapore, 17–20 November 2018; pp. 787–796. [Google Scholar]
- Li, J.; Wu, L.; Guo, R.; Liu, C.; Liu, H. Multi-level network embedding with boosted low-rank matrix approximation. In Proceedings of the 2019 IEEE/ACM International Conference on Advances in Social Networks Analysis and Mining, Vancouver, BC, Canada, 27–30 August 2019; pp. 49–56. [Google Scholar]
- Donnat, C.; Zitnik, M.; Hallac, D.; Leskovec, J. Learning structural node embeddings via diffusion wavelets. In Proceedings of the 2018, 24th ACM SIGKDD International Conference on Knowledge Discovery & Data Mining, London, UK, 19–23 August 2018; pp. 1320–1329. [Google Scholar]
- Ward, J.H., Jr. Hierarchical grouping to optimize an objective function. J. Am. Stat. Assoc. 1963, 58, 236–244. [Google Scholar] [CrossRef]
- Zachary, W.W. An Information Flow Model for Conflict and Fission in Small Groups. J. Anthropol. Res. 1977, 33, 452–473. [Google Scholar] [CrossRef] [Green Version]
- Lusseau, D.; Schneider, K.; Boisseau, O.J.; Haase, P.; Slooten, E.; Dawson, S.M. The bottlenose dolphin community of Doubtful Sound features a large proportion of long-lasting associations. Behav. Ecol. Sociobiol. 2003, 54, 396–405. [Google Scholar] [CrossRef]
- Adamic, L.A.; Glance, N. The political blogosphere and the 2004 US Election. In Proceedings of the 3rd international workshop on Link discovery, Chicago, IL, USA, 21–25 August 2005; pp. 36–43. [Google Scholar]
- Lancichinetti, A.; Fortunato, S.; Radicchi, F. Benchmark Graphs for Testing Community Detection Algorithms. Phys. Rev. E Stat. Nonlinear Soft Matter Phys. 2008, 78, 046110. [Google Scholar] [CrossRef] [PubMed] [Green Version]
- Danon, L.; Díazguilera, A.; Duch, J.; Arenas, A. Comparing Community Structure Identification. J. Stat. Mech. 2005, 2005, 09008. [Google Scholar] [CrossRef]
- Deng, X.; Wang, B.; Wu, B.; Yang, S. Research and evaluation on modularity modeling in community detecting of complex network based on information entropy. In Proceedings of the Third IEEE International Conference on Secure Software Integration and Reliability Improvement, Shanghai, China, 8–10 July 2009; pp. 297–302. [Google Scholar]


| Dataset | Node# | Edge# | CN | Length | Iterations | Dimensions |
|---|---|---|---|---|---|---|
| Karate Club | 34 | 78 | 2 | 50 | 10 | 10 |
| Dolphins | 62 | 159 | 2 | 50 | 10 | 10 |
| Polbooks | 105 | 441 | 3 | 50 | 10 | 10 |
| Polblogs | 1490 | 19,090 | 2 | 100 | 10 | 10 |
| LFR Benchmark | 2000 | Variable * | 4 | 100 | 10 | 10 |
| CN | NMI | |
|---|---|---|
| Labeled partition | 2 | / |
| AMI-NRL | 2 | 1.00 |
| GN | 5 | 0.58 |
| FN | 2 | 0.84 |
| Louvain | 2 | 0.84 |
| IE | 2 | 0.84 |
| EdMot | 2 | 0.59 |
| CN | NMI | |
|---|---|---|
| Labeled partition | 2 | / |
| AMI-NRL | 2 | 0.96 |
| GN | 5 | 0.55 |
| FN | 3 | 0.65 |
| Louvain | 2 | 0.65 |
| IE | 2 | 0.89 |
| EdMot | 5 | 0.51 |
| CN | NMI | |
|---|---|---|
| Labeled partition | 3 | / |
| AMI-NRL | 3 | 0.58 |
| GN | 5 | 0.56 |
| FN | 3 | 0.57 |
| Louvain | 3 | 0.55 |
| IE | 2 | 0.55 |
| EdMot | 5 | 0.5 |
| Labeled Partition | AMI-NRL | |||
|---|---|---|---|---|
| Node | Internal Links | External Links | Internal Links | External Links |
| 0 | 2 | 4 | 6 | 0 |
| 4 | 3 | 5 | 5 | 3 |
| 6 | 4 | 7 | 11 | 0 |
| 18 | 1 | 2 | 3 | 0 |
| 28 | 1 | 2 | 2 | 1 |
| 46 | 0 | 4 | 1 | 3 |
| 48 | 0 | 4 | 4 | 0 |
| 52 | 3 | 2 | 3 | 2 |
| 58 | 5 | 8 | 7 | 6 |
| 64 | 5 | 4 | 7 | 2 |
| 65 | 4 | 3 | 7 | 0 |
| 67 | 4 | 2 | 4 | 2 |
| 68 | 3 | 1 | 3 | 1 |
| 76 | 0 | 13 | 11 | 2 |
| 77 | 2 | 5 | 5 | 2 |
| 85 | 3 | 2 | 2 | 3 |
| CN | NMI | |
|---|---|---|
| Labeled partition | 2 | / |
| AMI-NRL | 2 | 0.72 |
| FN | 11 | 0.52 |
| Louvain | 4 | 0.63 |
| EdMot | 6 | 0.58 |
| Node# (n) | Average Degree (k) | Max Degree (maxk) | Mixing Parameter (mu) | Community Scale (minc, maxc) | CN | |
|---|---|---|---|---|---|---|
| 1 | 2000 | 15 | 50 | 0.1 | 200∼1000 | 4 |
| 2 | 2000 | 15 | 50 | 0.2 | 200∼1000 | 4 |
| 3 | 2000 | 15 | 50 | 0.3 | 200∼1000 | 4 |
| Mixing Parameter (mu) | CN Labeled | CN Result | NMI | |
|---|---|---|---|---|
| 1 | 0.1 | 4 | 4 | 1 |
| 2 | 0.2 | 4 | 4 | 1 |
| 3 | 0.3 | 4 | 4 | 0.99 |
| CN | NMI | |
|---|---|---|
| Labeled partition | 4 | / |
| AMI-NRL | 4 | 0.99 |
| FN | 8 | 0.63 |
| Louvain | 5 | 0.76 |
| EdMot | 5 | 0.82 |
Publisher’s Note: MDPI stays neutral with regard to jurisdictional claims in published maps and institutional affiliations. |
© 2022 by the authors. Licensee MDPI, Basel, Switzerland. This article is an open access article distributed under the terms and conditions of the Creative Commons Attribution (CC BY) license (https://creativecommons.org/licenses/by/4.0/).
Share and Cite
Chen, Y.; Wang, C.; Li, D. An Information-Theoretic Approach for Detecting Community Structure Based on Network Representation. Appl. Sci. 2022, 12, 4203. https://doi.org/10.3390/app12094203
Chen Y, Wang C, Li D. An Information-Theoretic Approach for Detecting Community Structure Based on Network Representation. Applied Sciences. 2022; 12(9):4203. https://doi.org/10.3390/app12094203
Chicago/Turabian StyleChen, Yinan, Chuanpeng Wang, and Dong Li. 2022. "An Information-Theoretic Approach for Detecting Community Structure Based on Network Representation" Applied Sciences 12, no. 9: 4203. https://doi.org/10.3390/app12094203
APA StyleChen, Y., Wang, C., & Li, D. (2022). An Information-Theoretic Approach for Detecting Community Structure Based on Network Representation. Applied Sciences, 12(9), 4203. https://doi.org/10.3390/app12094203