
Evaluation of Neuromuscular Fatigue According to Injury History in a Repeat Sprint Ability Test, Countermovement Jump, and Hamstring Test in Elite Female Soccer Players

 ,
,  ,
,  and
and 
Abstract
:1. Introduction
2. Materials and Methods
2.1. Participants
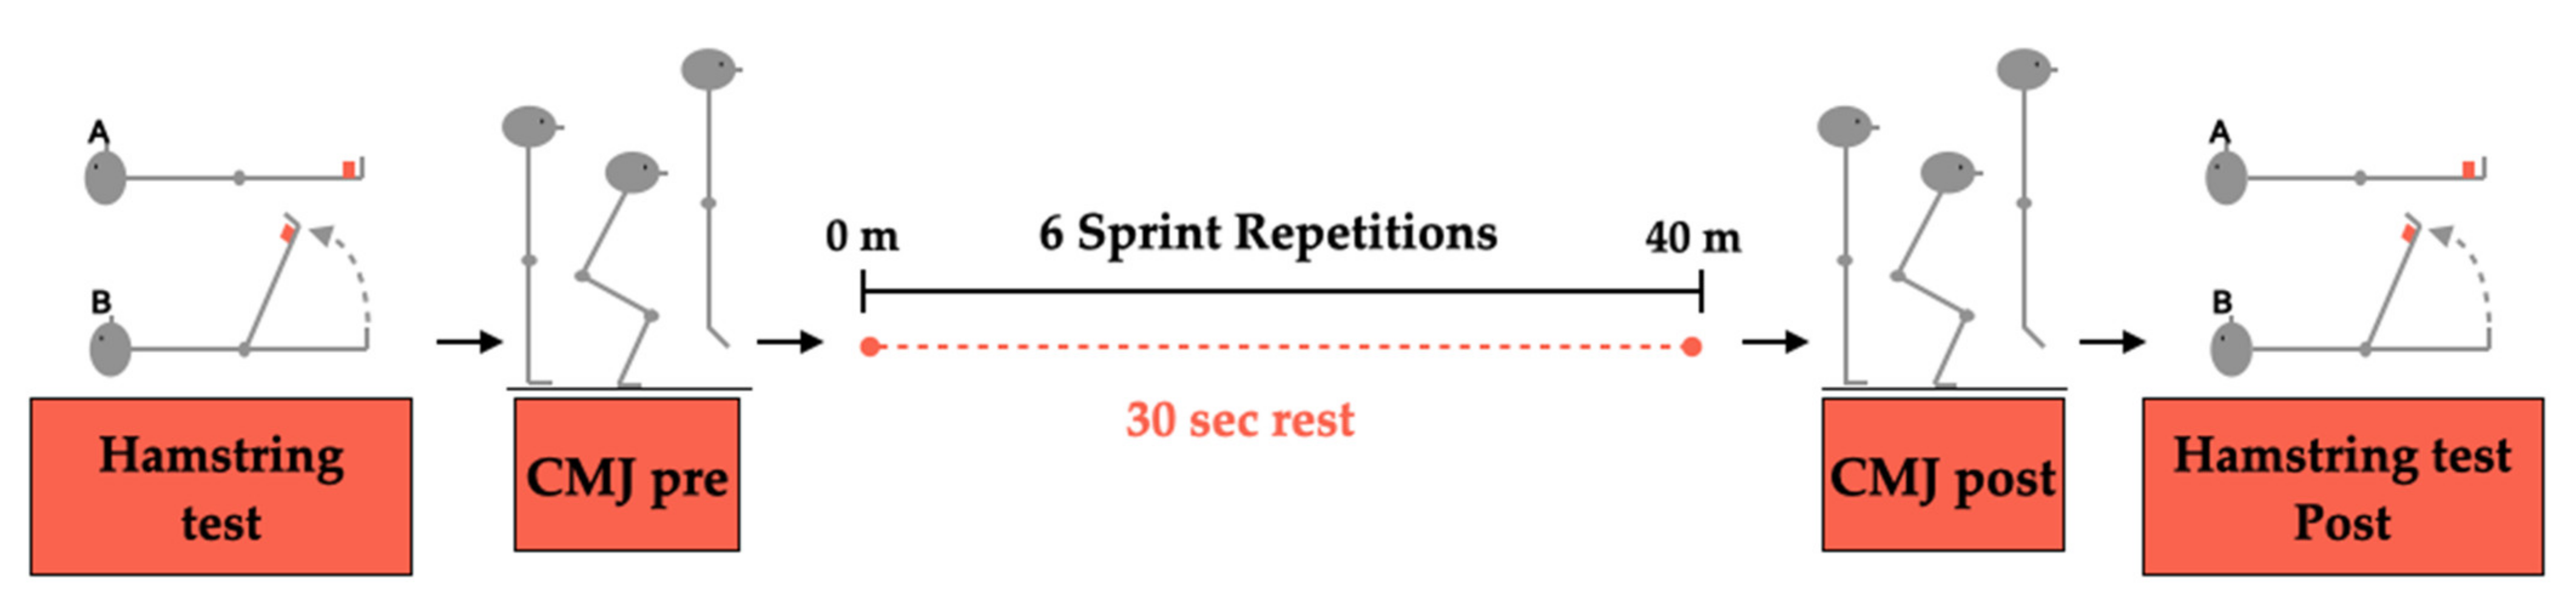
2.2. Study Design
2.2.1. Hamstring Test
2.2.2. CMJ Test
2.2.3. RSA Test
2.3. Statistical Analysis
3. Results
3.1. CMJ Test
3.2. Hamstring Test
3.3. RSA Test
4. Discussion
Limitations
5. Conclusions
Author Contributions
Funding
Institutional Review Board Statement
Informed Consent Statement
Conflicts of Interest
References
- Ingebrigtsen, J.; Dalen, T.; Hjelde, G.H.; Drust, B.; Wisløff, U. Acceleration and Sprint Profiles of a Professional Elite Football Team in Match Play. Eur. J. Sport Sci. 2015, 15, 101–110. [Google Scholar] [CrossRef] [PubMed]
- Haugen, T.A.; Breitschädel, F.; Seiler, S. Sprint Mechanical Properties in Soccer Players According to Playing Standard, Position, Age and Sex. J. Sports Sci. 2020, 38, 1070–1076. [Google Scholar] [CrossRef] [PubMed]
- Spencer, M.; Lawrence, S.; Rechichi, C.; Bishop, D.; Dawson, B.; Goodman, C. Time-Motion Analysis of Elite Field Hockey, with Special Reference to Repeated-Sprint Activity. J. Sports Sci. 2004, 22, 843–850. [Google Scholar] [CrossRef] [PubMed]
- Spencer, M.; Rechichi, C.; Lawrence, S.; Dawson, B.; Bishop, D.; Goodman, C. Time-Motion Analysis of Elite Field Hockey during Several Games in Succession: A Tournament Scenario. J. Sci. Med. Sport 2005, 8, 382–391. [Google Scholar] [CrossRef]
- Stølen, T.; Chamari, K.; Castagna, C.; Wisløff, U. Physiology of Soccer: An Update. Sports Med. 2005, 35, 501–536. [Google Scholar] [CrossRef]
- Buchheit, M.; Mendez-Villanueva, A.; Simpson, B.M.; Bourdon, P.C. Repeated-Sprint Sequences during Youth Soccer Matches. Int. J. Sports Med. 2010, 31, 709–716. [Google Scholar] [CrossRef] [PubMed]
- Faude, O.; Koch, T.; Meyer, T. Straight Sprinting Is the Most Frequent Action in Goal Situations in Professional Football. J. Sports Sci. 2012, 30, 625–663. [Google Scholar]
- Sedano, S.; Vaeyens, R.; Philippataerts, R.M.; Redondo, J.C.; Cuadrado, G. The Anthropometric and Anaerobic Fitness Profile of Elite and Non-Elite Female Soccer Players. J. Sports Med. Phys. Fitness 2009, 49, 387–394. [Google Scholar]
- Haugen, T.A.; Tønnessen, E.; Seiler, S. Speed and Countermovement-Jump Characteristics of Elite Female Soccer Players, 1995–2010. Int. J. Sports Physiol. Perform. 2012, 7, 340–349. [Google Scholar] [CrossRef]
- Milanović, Z.; Sporiš, G.; James, N.; Trajković, N.; Ignjatović, A.; Sarmento, H.; Trecroci, A.; Mendes, B.M.B. Physiological Demands, Morphological Characteristics, Physical Abilities and Injuries of Female Soccer Players. J. Hum. Kinet. 2017, 60, 77–83. [Google Scholar] [CrossRef] [Green Version]
- Manson, S.A.; Brughelli, M.; Harris, N.K. Physiological Characteristics of International Female Soccer Players. J. Strength Cond. Res. 2014, 28, 308–318. [Google Scholar] [CrossRef]
- BollarS, P.; van Crombrugge, K.; Corten, K.; BelleManS, J. Injuries in Male versus Female Soccer Players: Epidemiology of a Nationwide Study. Acta Orthop. Belg. 2015, 81, 289–295. [Google Scholar]
- Reilly, T. Energetics of High-Intensity Exercise (Soccer) with Particular Reference to Fatigue. J. Sports Sci. 1997, 15, 257–263. [Google Scholar] [CrossRef] [PubMed]
- Billaut, F.; Smith, K. Sex Alters Impact of Repeated Bouts of Sprint Exercise on Neuromuscular Activity in Trained Athletes. Appl. Physiol. Nutr. Metab. 2009, 34, 689–699. [Google Scholar] [CrossRef]
- Billaut, F.; Bishop, D. Muscle Fatigue in Males and Females during Multiple-Sprint Exercise. Sports Med. 2009, 39, 257–278. [Google Scholar] [CrossRef] [PubMed]
- Ratel, S.; Williams, C.A.; Oliver, J.; Armstrong, N. Effects of Age and Recovery Duration on Performance during Multiple Treadmill Sprints. Int. J. Sports Med. 2006, 27, 984–992. [Google Scholar] [CrossRef] [PubMed]
- Mujika, I.; Spencer, M.; Santisteban, J.; Goiriena, J.J.; Bishop, D. Age-Related Differences in Repeated-Sprint Ability in Highly Trained Youth Football Players. J. Sports Sci. 2009, 27, 1581–1590. [Google Scholar] [CrossRef]
- Girard, O.; Mendez-Villanueva, A.; Bishop, D. Repeated-Sprint Ability Part I: Factors Contributing to Fatigue. Sports Med. 2011, 41, 673–694. [Google Scholar] [CrossRef]
- Morin, J.B.; Gimenez, P.; Edouard, P.; Arnal, P.; Jiménez-Reyes, P.; Samozino, P.; Brughelli, M.; Mendiguchia, J. Sprint Acceleration Mechanics: The Major Role of Hamstrings in Horizontal Force Production. Front. Physiol. 2015, 6, 404. [Google Scholar] [CrossRef]
- Arnason, A.; Sigurdsson, S.B.; Gudmundsson, A.; Holme, I.; Engebretsen, L.; Bahr, R. Risk Factors for Injuries in Football. Am. J. Sports Med. 2004, 32, 5–16. [Google Scholar] [CrossRef]
- Ekstrand, J.; Hägglund, M.; Waldén, M. Injury Incidence and Injury Patterns in Professional Football: The UEFA Injury Study. Br. J. Sports Med. 2011, 45, 553–558. [Google Scholar] [CrossRef] [Green Version]
- Ekstrand, J.; Hägglund, M.; Waldén, M. Epidemiology of Muscle Injuries in Professional Football (Soccer). Am. J. Sports Med. 2011, 39, 1226–1232. [Google Scholar] [CrossRef] [PubMed] [Green Version]
- Hägglund, M.; Waldén, M.; Ekstrand, J. Previous Injury as a Risk Factor for Injury in Elite Football: A Prospective Study over Two Consecutive Seasons. Br. J. Sports Med. 2006, 40, 767–772. [Google Scholar] [CrossRef] [PubMed] [Green Version]
- Maniar, N.; Shield, A.J.; Williams, M.D.; Timmins, R.G.; Opar, D.A. Hamstring Strength and Flexibility after Hamstring Strain Injury: A Systematic Review and Meta-Analysis. Br. J. Sports Med. 2016, 50, 909–920. [Google Scholar] [CrossRef] [PubMed]
- Van der Horst, N.; van de Hoef, S.; Reurink, G.; Huisstede, B.; Backx, F. Return to Play After Hamstring Injuries: A Qualitative Systematic Review of Definitions and Criteria. Sports Med. 2016, 46, 899–912. [Google Scholar] [CrossRef] [PubMed] [Green Version]
- Buchheit, M.; Mendez-Villanueva, A.; Delhomel, G.; Brughelli, M.; Ahmaidi, S. Improving Repeated Sprint Ability in Young Elite Soccer Players: Repeated Shuttle Sprints vs. Explosive Strength Training. J. Strength Cond. Res. 2010, 24, 2715–2722. [Google Scholar] [CrossRef] [PubMed]
- Bogdanis, G.C.; Nevill, M.E.; Boobis, L.H.; Lakomy, H.K.A. Contribution of Phosphocreatine and Aerobic Metabolism to Energy Supply during Repeated Sprint Exercise. J. Appl. Physiol. 1996, 80, 876–884. [Google Scholar] [CrossRef]
- Bishop, D.; Edge, J. Determinants of Repeated-Sprint Ability in Females Matched for Single-Sprint Performance. Eur. J. Appl. Physiol. 2006, 97, 373–379. [Google Scholar] [CrossRef]
- Rampinini, E.; Coutts, A.J.; Castagna, C.; Sassi, R.; Impellizzeri, F.M. Variation in Top Level Soccer Match Performance. Int. J. Sports Med. 2007, 28, 1018–1024. [Google Scholar] [CrossRef] [Green Version]
- Archiza, B.; Andaku, D.K.; Beltrame, T.; Libardi, C.A.; Borghi-Silva, A. The Relationship between Repeated-Sprint Ability, Aerobic Capacity, and Oxygen Uptake Recovery Kinetics in Female Soccer Athletes. J. Hum. Kinet. 2020, 75, 115–126. [Google Scholar] [CrossRef]
- Bishop, D.; Lawrence, S.; Spencer, M. Predictors of Repeated-Sprint Ability in Elite Female Hockey Players. J. Sci. Med. Sport 2003, 6, 199–209. [Google Scholar] [CrossRef]
- Bishop, D.; Edge, J.; Goodman, C. Muscle Buffer Capacity and Aerobic Fitness Are Associated with Repeated-Sprint Ability in Women. Eur. J. Appl. Physiol. 2004, 92, 540–547. [Google Scholar] [CrossRef] [PubMed]
- Small, K.; McNaughton, L.R.; Greig, M.; Lohkamp, M.; Lovell, R. Soccer Fatigue, Sprinting and Hamstring Injury Risk. Int. J. Sports Med. 2009, 30, 573–578. [Google Scholar] [CrossRef] [PubMed]
- Russell, M.; Sparkes, W.; Northeast, J.; Cook, C.J.; Love, T.D.; Bracken, R.M.; Kilduff, L.P. Changes in Acceleration and Deceleration Capacity throughout Professional Soccer Match-Play. J. Strength Cond. Res. 2016, 30, 2839–2844. [Google Scholar] [CrossRef] [PubMed] [Green Version]
- Mendez-Villanueva, A.; Hamer, P.; Bishop, D. Fatigue Responses during Repeated Sprints Matched for Initial Mechanical Output. Med. Sci. Sports Exerc. 2007, 39, 2219–2225. [Google Scholar] [CrossRef] [PubMed]
- Racinais, S.; Bishop, D.; Denis, R.; Lattier, G.; Mendez-Villaneuva, A.; Perrey, S. Muscle Deoxygenation and Neural Drive to the Muscle during Repeated Sprint Cycling. Med. Sci. Sports Exerc. 2007, 39, 268–274. [Google Scholar] [CrossRef]
- Missenard, O.; Mottet, D.; Perrey, S. Factors Responsible for Force Steadiness Impairment with Fatigue. Muscle Nerve 2009, 40, 1019–1032. [Google Scholar] [CrossRef]
- Kibler, W.B.; Safran, M.R. Musculoskeletal Injuries in the Young Tennis Player. Pediatr. Adolesc. Sports Inj. 2000, 19, 781–792. [Google Scholar] [CrossRef]
- Gonçalves, L.; Clemente, F.M.; Barrera, J.I.; Sarmento, H.; González-Fernández, F.T.; Rico-González, M.; Carral, J.M.C. Exploring the Determinants of Repeated-Sprint Ability in Adult Women Soccer Players. Int. J. Environ. Res. Public Health 2021, 18, 4595. [Google Scholar] [CrossRef]
- Muyor, J.M.; López-Miñarro, P.A.; Alacid, F. The Relationship between Hamstring Muscle Extensibility and Spinal Postures Varies with the Degree of Knee Extension. J. Appl. Biomech. 2013, 29, 678–686. [Google Scholar] [CrossRef]
- Imray, C.; Wright, A.; Subudhi, A.; Roach, R. Acute Mountain Sickness: Pathophysiology, Prevention, and Treatment. Prog. Cardiovasc. Dis. 2010, 52, 467–484. [Google Scholar] [CrossRef] [PubMed]
- Radwan, A.; Bigney, K.A.; Buonomo, H.N.; Jarmak, M.W.; Moats, S.M.; Ross, J.K.; Tatarevic, E.; Tomko, M.A. Evaluation of Intra-Subject Difference in Hamstring Flexibility in Patients with Low Back Pain: An Exploratory Study. J. Back Musculoskelet. Rehabil. 2015, 28, 61–66. [Google Scholar] [CrossRef]
- Esola, M.; McClure, P.W.; Fitzgerald, G.K.; Siegler, S. Analysis of Lumbar Spine and Hip Motion During Forward Bending in Subjects with and Without a History of Low Back Pain. Spine 1996, 21, 71–78. [Google Scholar] [CrossRef]
- Scattone Silva, R.; Nakagawa, T.H.; Ferreira, A.L.G.; Garcia, L.C.; Santos, J.E.M.; Serrão, F.V. Lower Limb Strength and Flexibility in Athletes with and without Patellar Tendinopathy. Phys. Ther. Sport 2016, 20, 19–25. [Google Scholar] [CrossRef] [PubMed]
- Goodnite, E.A. Strength Around the Hip and Flexibility of Soft Tissues in Individuals with and Without Patellofemoral Pain Syndrome. J. Orthop. Sports Phys. Ther. 2005, 35, 793–801. [Google Scholar] [CrossRef]
- Witvrouw, E.; Danneels, L.; Asselman, P.; D’Have, T.; Cambier, D. Muscle Flexibility as a Risk Factor for Developing Muscle Injuries in Male Professional Soccer Players: A Prospective Study. Am. J. Sports Med. 2003, 31, 41–46. [Google Scholar] [CrossRef]
- Henderson, G.; Barnes, C.A.; Portas, M.D. Factors Associated with Increased Propensity for Hamstring Injury in English Premier League Soccer Players. J. Sci. Med. Sport 2010, 13, 397–402. [Google Scholar] [CrossRef] [PubMed] [Green Version]
- Bradley, P.S.; Portas, M.D. The Relationship between Pre-Season Range of Motion and Muscle Strain Injury in Elite Soccer Players. J. Strength Cond. Res. 2007, 21, 1155–1159. [Google Scholar] [PubMed] [Green Version]
- Askling, C.M.; Nilsson, J.; Thorstensson, A. A New Hamstring Test to Complement the Common Clinical Examination before Return to Sport after Injury. Knee Surg. Sports Traumatol. Arthrosc. 2010, 18, 1798–1803. [Google Scholar] [CrossRef] [PubMed]
- Claudino, J.G.; Cronin, J.; Mezêncio, B.; McMaster, D.T.; McGuigan, M.; Tricoli, V.; Amadio, A.C.; Serrão, J.C. The Countermovement Jump to Monitor Neuromuscular Status: A Meta-Analysis. J. Sci. Med. Sport 2017, 20, 397–402. [Google Scholar] [CrossRef]
- Greig, M.; Siegler, J.C. Soccer-Specific Fatigue and Eccentric Hamstrings Muscle Strength. J. Athl. Train. 2009, 44, 180–184. [Google Scholar] [CrossRef] [Green Version]
- Small, K.; McNaughton, L.; Greig, M.; Lovell, R. Effect of Timing of Eccentric Hamstring Strengthening Exercises During Soccer Training: Implications for Muscle Fatigability. J. Strength Cond. Res. 2009, 23, 1077–1083. [Google Scholar] [CrossRef] [PubMed]
- Jiménez-Reyes, P.; Pareja-Blanco, F.; Cuadrado-Peñafiel, V.; Ortega-Becerra, M.; Párraga, J.; González-Badillo, J.J. Jump Height Loss as an Indicator of Fatigue during Sprint Training. J. Sports Sci. 2019, 19, 1029–1037. [Google Scholar] [CrossRef]
- Padulo, J.; Attene, G.; Ardigò, L.P.; Bragazzi, N.L.; Maffulli, N.; Zagatto, A.M.; dello Iacono, A. Can a Repeated Sprint Ability Test Help Clear a Previously Injured Soccer Player for Fully Functional Return to Activity? A Pilot Study. Clin. J. Sport Med. 2017, 27, 361–368. [Google Scholar] [CrossRef]
- Muyor, J.M. Validity and Reliability of a New Device (WIMU®) for Measuring Hamstring Muscle Extensibility. Int. J. Sports Med. 2017, 38, 691–695. [Google Scholar] [CrossRef] [PubMed]
- Bosco, C. La Fuerza Muscular: Aspectos Metodológicos, 1st ed.; INDE, Ed.; INO Reproducciones, S.A.: Barcelona, Spain, 2000. [Google Scholar]
- Jiménez-Reyes, P.; Cuadrado-Peñafiel, V.; González-Badillo, J. Analysis of Variables Measured in Vertical Jump Related to Athletic Performance and Its Application to Training. Cult. Cienc. Deporte 2011, 6, 113–119. [Google Scholar] [CrossRef]
- Glatthorn, J.F.; Gouge, S.; Nussbaumer, S.; Stauffacher, S.; Impellizzeri, F.M.; Maffiuletti, N.A. Validity and Reliability of Optojump Photoelectric Cells for Estimating Vertical Jump Height. J. Strength Cond. Res. 2011, 25, 556–560. [Google Scholar] [CrossRef] [PubMed]
- Di Cagno, A.; Baldari, C.; Battaglia, C.; Monteiro, M.D.; Pappalardo, A.; Piazza, M.; Guidetti, L. Factors Influencing Performance of Competitive and Amateur Rhythmic Gymnastics-Gender Differences. J. Sci. Med. Sport 2009, 12, 411–416. [Google Scholar] [CrossRef] [PubMed]
- Maciejczyk, M.; Błyszczuk, R.; Drwal, A.; Nowak, B.; Strzała, M. Effects of Short-Term Plyometric Training on Agility, Jump and Repeated Sprint Performance in Female Soccer Players. Int. J. Environ. Res. Public Health 2021, 18, 2274. [Google Scholar] [CrossRef]
- Maffiuletti, N.A.; Dugnani, S.; Folz, M.; Pierno, D.I.; Mauro, F. Effect of Combined Electrostimulation and Plyometric Training on Vertical Jump Height. Med. Sci. Sports Exerc. 2002, 34, 1638–1644. [Google Scholar] [CrossRef] [PubMed]
- Chaouachi, A.; Manzi, V.; Wong, D.P.; Chaalali, A.; Laurencelle, L.; Chamari, K.; Castagna, C. Intermitent Endurance and Repeated Sprint Ability in Soccer Players. J. Strength Cond. Res. 2010, 24, 2663–2669. [Google Scholar] [CrossRef]
- Bishop, D.; Girard, O.; Mendez-Villanueva, A. Repeated-Sprint Ability Part II: Recommendations for Training. Sports Med. 2011, 41, 741–756. [Google Scholar] [CrossRef] [PubMed]
- Cohen, J. Statistical Power Analysis for the Behavioral Sciences, 2nd ed.; Lawrence Erlbaum Associates: Hillsdale, NJ, USA, 1988. [Google Scholar]
- Hojat, M.; Xu, G. A Visitor’s Guide to Effect Sizes—Read Already. Adv. Health Sci. Educ. 2004, 9, 241–249. [Google Scholar] [CrossRef] [PubMed]
- Samozino, P.; Rabita, G.; Dorel, S.; Slawinski, J.; Peyrot, N.; Saez de Villarreal, E.; Morin, J.B. A Simple Method for Measuring Power, Force, Velocity Properties, and Mechanical Effectiveness in Sprint Running. Scand. J. Med. Sci. Sports 2016, 26, 648–658. [Google Scholar] [CrossRef] [PubMed]
- Røksund, O.D.; Kristoffersen, M.; Bogen, B.E.; Wisnes, A.; Engeseth, M.S.; Nilsen, A.K.; Iversen, V.V.; Mæland, S.; Gundersen, H. Higher Drop in Speed during a Repeated Sprint Test in Soccer Players Reporting Former Hamstring Strain Injury. Front. Physiol. 2017, 8, 25. [Google Scholar] [CrossRef] [PubMed] [Green Version]
- Higashihara, A.; Ono, T.; Tokutake, G.; Kuramochi, R.; Kunita, Y.; Nagano, Y.; Hirose, N. Hamstring Muscles’ Function Deficit during Overground Sprinting in Track and Field Athletes with a History of Strain Injury. J. Sports Sci. 2019, 37, 2744–2750. [Google Scholar] [CrossRef]
- Armada-Cortés, E.; Barrajón, J.P.; Benítez-Muñoz, J.A.; Navarro, E.; Juan, A.F.S. Can We Rely on Flight Time to Measure Jumping Performance or Neuromuscular Fatigue-Overload in Professional Female Soccer Players? Appl. Sci. 2020, 10, 4424. [Google Scholar] [CrossRef]


| Sprint Total Time (SprintTT) | Defined as the Time to Run a Specific Distance of the Sprint | |
|---|---|---|
| Ideal Sprint [54] | Defined as the SprintTT if all the sprints were run as the best of them. | Where X is the number of a specific sprint |
| Split Total Time (SplitTT) [54] | Defined as the time spent to complete a specific distance during the six sprints. | Where X is the distance of a specific split |
| Ideal Split [54] | Defined as the SplitTT if all the splits were run as the best of them. | Where X is the distance of a specific split |
| Percentage difference 1vsX (%Dif1vsX). | Defined as percentage difference between the first sprint and a specific sprint. | Where X is the number of a specific sprint |
| Percentage difference between SprintTT 0–40 m and ideal Sprint [18]. | Defined as percentage difference between the time to run a specific number of sprints and the time if these sprints were run as the best of them. | Where X is the number of a specific sprint |
| Percentage difference between the best time VS worst time of a split (%DifBvsW) [18]. | Percentage difference between the best time compared to the worst time to run a split. | Where X is the distance of a specific split |
| Percentage difference between SplitTT and ideal Split (modified from [18]). | Percentage difference between the time to run a specific number of splits and the time if these splits were run as the best of them. | Where X is the distance of a specific split |
| CMJ | PRE | POST | |||||
| Height (cm) | Control | 26.24 ± 4.06 | 24.53 ± 4.42 * | ||||
| Hamstring | 28.04 ± 5.4 | 26.96 ± 4.92 * | |||||
| Hamstring test | Right leg | Left leg | Average | Right leg | Left leg | Average | |
| Max angulation (deg) | Control | 88.74 ± 11.75 | 88.49 ± 16.98 | 88.62 ± 14.09 | 84.32 ± 13.33 | 88.04 ± 19.07 | 86.18 ± 16.02 |
| Hamstring | 86.04 ± 11.35 | 84.28 ± 12.41 | 85.16 ± 10.39 | 85.55 ± 12.45 | 89.86 ± 11.58 | 87.71 ± 11.93 | |
| Max velocity (deg/s) | Control | 419.23 ± 94.35 | 367.31 ± 51.43 | 393.18 ± 63.39 | 410.15 ± 66.70 | 373.73 ± 60.6 | 391.94 ± 56.94 |
| Hamstring | 417.34 ± 118.02 | 356.01 ± 50.02 | 386.68 ± 81.51 | 402.04 ± 87.83 | 395.16 ± 62.42 # | 415.92 ± 95 | |
| Avg velocity (deg/s) | Control | 258.23 ± 52.78 | 231.68 ± 42.83 | 244.95 ± 45.12 | 263.22 ± 43.27 | 229.12 ± 54.31 | 246.17 ± 36.09 |
| Hamstring | 255.78 ± 61.05 | 235.67 ± 43.58 | 245.72 ± 49.75 | 257.24 ± 52.44 | 267.81 ± 56.1 | 262.52 ± 53.47 | |
| Time to max velocity (ms) | Control | 111.18 ± 52.44 | 121.93 ± 62.38 | 114.41 ± 50.22 | 87.64 ± 50.61 | 106.51 ± 33.13 | 110.73 ± 69.8 |
| Hamstring | 82.75 ± 67.21 | 106.5 ± 58.85 | 94.63 ± 60.64 | 95.09 ± 56.31 | 81.95 ± 55.62 | 88.52 ± 50.88 | |
| Angle at max velocity (deg) | Control | 43.54 ± 12 | 42.19 ± 15.57 | 42.86 ± 12.58 | 36.5 ± 14.96 | 41.34 ± 10.24 | 38.92 ± 11.57 |
| Hamstring | 31.02 ± 13.72 | 34.97 ± 12.67 | 32.99 ± 12.82 | 35.7 ± 14.12 | 32.92 ± 13.46 | 34.31 ± 11.57 |
| Sprint 1 | Sprint 2 | Sprint 3 | Sprint 4 | Sprint 5 | Sprint 6 | ||
| SprintTT 0–10 m (s) | Control | 2.01 ± 0.14 | 2.04 ± 0.16 | 2.01 ± 0.16 | 2.08 ± 0.15 | 2.07 ± 0.15 | 2.08 ± 0.16 |
| Hamstring | 2 ± 0.13 | 2.07 ± 0.15 | 2.04 ± 0.15 | 2.11 ± 0.14 | 2.07 ± 0.16 | 2.05 ± 0.11 | |
| SprintTT 0–20 m (s) | Control | 3.04 ± 0.19 | 3.48 ± 0.2 | 3.45 ± 0.24 | 3.54 ± 0.23 | 3.54 ± 0.22 | 3.58 ± 0.23 |
| Hamstring | 3.4 ± 0.17 | 3.51 ± 0.2 | 3.47 ± 0.21 | 3.58 ± 0.19 | 3.52 ± 0.2 | 3.45 ± 0.27 | |
| SprintTT 0–30 m (s) | Control | 4.75 ± 0.25 | 4.85 ± 0.27 | 4.83 ± 0.332 | 4.97 ± 0.32 | 4.97 ± 0.33 | 5.04 ± 0.31 |
| Hamstring | 4.73 ± 0.24 | 4.85 ± 0.26 | 4.85 ± 0.29 | 4.97 ± 0.32 | 4.91 ± 0.26 | 4.88 ± 0.3 | |
| SprintTT 0–40 m (s) | Control | 6.12 ± 0.35 | 6.25 ± 0.36 | 6.27 ± 0.46 | 6.41 ± 0.43 | 6.46 ± 0.46 | 6.56 ± 0.43 |
| Hamstring | 5.96 ± 0.38 | 6.27 ± 0.36 | 6.27 ± 0.42 | 6.44 ± 0.36 | 6.39 ± 0.34 | 6.4 ± 0.35 | |
| Sprint 1 vs. 2 | Sprint 1 vs. 3 | Sprint 1 vs. 4 | Sprint 1 vs. 5 | Sprint 1 vs. 6 | |||
| %Dif | Control | 2.51 ± 1.75 | 3.07 ± 2.91 | 5.81 ± 2.88 | 5.61 ± 3.84 | 6.25 ± 5.07 | |
| Hamstring | 2.58 ± 1.31 | 2.33 ± 2.24 | 4.55 ± 2.43 | 4.73 ± 2.18 | 7.71 ± 3.02 * | ||
| Sprint 1–2 | Sprint 1–3 | Sprint 1–4 | Sprint 1–5 | Sprint 1–6 | |||
| %Dif between SprintTT and ideal Sprint | Control | 1.26 ± 0.88 | 1.99 ± 1.06 | 2.98 ± 1.41 | 3.53 ± 1.8 | 4.07 ± 2.17 | |
| Hamstring | 1.29 ± 0.66 | 1.87 ± 0.69 | 2.6 ± 1 | 3.07 ± 0.99 | 3.89 ± 1.51 |
| Split 0–10 m | Split 0–20 m | Split 0–30 m | Split 0–40 m | ||
|---|---|---|---|---|---|
| SplitTT (s) | Control | 12.37 ± 0.76 | 21.14 ± 1.13 | 29.61 ± 1.72 | 38.34 ± 2.36 |
| Hamstring | 12.16 ± 0.83 | 20.7 ± 1.12 | 28.9 ± 1.45 | 36.6 ± 2.86 | |
| Ideal Split (s) | Control | 11.82 ± 0.61 | 20.36 ± 0.83 | 28.55 ± 1.27 | 36.82 ± 1.88 |
| Hamstring | 11.29 ± 1.33 | 19.65 ± 1.47 | 27.72 ± 1.56 | 35.39 ± 2.27 |
Publisher’s Note: MDPI stays neutral with regard to jurisdictional claims in published maps and institutional affiliations. |
© 2022 by the authors. Licensee MDPI, Basel, Switzerland. This article is an open access article distributed under the terms and conditions of the Creative Commons Attribution (CC BY) license (https://creativecommons.org/licenses/by/4.0/).
Share and Cite
Armada-Cortés, E.; Benítez-Muñoz, J.A.; Sánchez-Sánchez, J.; San Juan, A.F. Evaluation of Neuromuscular Fatigue According to Injury History in a Repeat Sprint Ability Test, Countermovement Jump, and Hamstring Test in Elite Female Soccer Players. Appl. Sci. 2022, 12, 2970. https://doi.org/10.3390/app12062970
Armada-Cortés E, Benítez-Muñoz JA, Sánchez-Sánchez J, San Juan AF. Evaluation of Neuromuscular Fatigue According to Injury History in a Repeat Sprint Ability Test, Countermovement Jump, and Hamstring Test in Elite Female Soccer Players. Applied Sciences. 2022; 12(6):2970. https://doi.org/10.3390/app12062970
Chicago/Turabian StyleArmada-Cortés, Estrella, José Antonio Benítez-Muñoz, Javier Sánchez-Sánchez, and Alejandro F. San Juan. 2022. "Evaluation of Neuromuscular Fatigue According to Injury History in a Repeat Sprint Ability Test, Countermovement Jump, and Hamstring Test in Elite Female Soccer Players" Applied Sciences 12, no. 6: 2970. https://doi.org/10.3390/app12062970
APA StyleArmada-Cortés, E., Benítez-Muñoz, J. A., Sánchez-Sánchez, J., & San Juan, A. F. (2022). Evaluation of Neuromuscular Fatigue According to Injury History in a Repeat Sprint Ability Test, Countermovement Jump, and Hamstring Test in Elite Female Soccer Players. Applied Sciences, 12(6), 2970. https://doi.org/10.3390/app12062970