Abstract
The shear walls are essential seismic elements to increase buildings bearing capacity against earthquakes. In mid- and high-rise buildings, shear walls are subjected to predominant bending deformation under earthquakes, and the responses in upper floors increase. In order to utilize the shear walls appropriately, previous studies proposed to install shear walls until a certain building level, referred to as the curtailed wall. However, the upper frame structure without shear walls suffered significant deformation during earthquakes compared to the lower stories. Therefore, the objective of this study is to present structural configuration for buildings with curtailed shear walls by installing buckling-restrained braces (BRBs) in the upper frame to reduce its deformation under earthquakes. Firstly, the analysis accuracy was verified by simulating the experimental results of four sets of scaled frames with curtailed walls tested on a shaking table. Then, ten- and twenty-story plane frames with the different heights of curtailed walls were created, and their nonlinear responses to earthquake ground motions were evaluated. The genetic algorithm was applied to establish the optimum BRB locations to satisfy the design criteria. It was proved that using BRBs at specific locations in upper frames can significantly improve the seismic response of buildings with curtailed walls.
1. Introduction
1.1. RC Frame with Curtailed Wall
In the earthquake-prone area, the reinforced concrete (RC) shear wall is used together with the RC frame to increase the bearing capacity and rigidity against earthquakes. For low-rise to mid-rise buildings, it is appropriate to install the RC shear walls up to the top floor. Studies by Estekanchi et al. [1], Xia et al. [2], Bhatta et al. [3], and Bhat et al. [4] suggested that installing RC shear walls with the full height of the high-rise building is not effective. The reason is that the multi-story shear walls in a high-rise building are subjected to predominant bending deformation under earthquakes, and the inter-story deformation of the building increases in the upper floors.
On the other hand, in order to utilize the shear walls, a design method was proposed using shear walls until a certain level of the building. This shear wall is generally called the curtailed wall. Studies by Rathi et al. [5], Nollet et al. [6,7], and Atik et al. [8,9] suggested that the optimum height of the curtailed shear walls adopted for RC frames depends on several parameters such as the ratio of wall flexural rigidity to frame shear rigidity, axial stiffness coefficient, and the top deflection of the building. However, these studies [5,6,7,8,9] use only a linear approach without considering the nonlinear dynamic behavior of the building. Based on the results of nonlinear dynamic analysis of RC frames with curtailed shear walls, Costa et al. [10] and Paulay and Priestley [11] pointed out that the structure above the curtailed shear wall has a significant inter-story drift. It is a challenge to reduce this notable large inter-story drift.
Therefore, the objective of this study is to propose a new structural system for the buildings with curtailed shear walls by installing buckling-restrained braces (BRBs) in the upper frame to reduce its deformation under earthquakes.
1.2. Implementation of BRBs
Adding BRBs to RC frames was proven to be effective in improving the seismic response of buildings, especially in reducing inter-story drift. There were many previous studies regarding the optimum usage and location of BRBs. One approach to optimizing BRB usage in frame structures is by using a Genetic Algorithm (GA). The study by Farhat et al. [12] used the total weight, volume, or cost produced after adding BRB as the fitness function of GA. Oxborrow and Richards [13] and Oxborrow [14] utilized the parameters of building responses such as the building displacement, inter-story drift, and ductility response against earthquake ground motions for the fitness function. Park et al. [15] adopted the damage cost expected during the structure’s life cycle for the parameter. Similar studies were performed by Mohammadi et al. [16], Tu et al. [17], Fujishita et al. [18], and Terazawa and Takeuchi [19,20].
In this study, the optimum location of BRBs is discussed based on the fitness function considering the damage index of structural members defined by the Park–Ang [21,22].
1.3. Numerical Analysis to Model Seismic Behavior of RC Structures
In order to conduct the study, a numerical approach is required to model the seismic behavior of reinforced concrete structures appropriately. Several studies were performed by previous researchers using several types of numerical techniques, such as Finite Element Method (FEM) and Applied Element Method (AEM). The FEM subdivides a large system into smaller and simpler parts, assembles the parts into the global system, and solves the problem by minimizing an associated error function. The AEM takes a different approach by simulating the structure by virtually dividing it into discrete elements linked by normal and shear springs at precise contact locations on the elements’ surfaces [23]. AEM application examples in nonlinear dynamic analyses are available, such as the study of seismic rehabilitation of masonry buildings using FRP by Fathalla and Salem [24] and the study of seismic debris field for collapsed RC frame buildings by Sediek et al. [25].
In this study, nonlinear structural seismic response analyses are employed using STERA_3D, a software developed by the co-author [26]. In the previous study by Maulana et al. [27], STERA_3D was used to conduct seismic response analyses for RC setback buildings, and the results were considerably matched with experimental shaking table tests.
1.4. Objective of This Study
This study is conducted according to the following procedures:
- In order to verify the accuracy of the nonlinear analysis using the STERA_3D (Structural Earthquake Response Analysis 3D) [26] software, four sets of RC frame–wall specimens tested by a shaking table [28] were analyzed, and the nonlinear responses were compared with the test results.
- Two 5-bays two dimensional (2D) RC frames with 10 stories and 20 stories using three different coverage percentages of RC shear walls were analyzed to examine the damage concentration at the upper part of the structure without walls.
- A new structural system for RC frames with curtailed walls by installing BRBs in the upper stories was proposed, and the optimum location of BRBs was obtained by employing the Genetic Algorithm. Three parameters were adopted to assess the genetic algorithm’s fitness function, namely the number of BRBs, the inter-story drift response, and the damage indices of beam elements.
2. Simulation of RC Frames with Curtailed Walls Tested by Shaking Table
The accuracy of the software STERA_3D was examined by analyzing four frame specimens with curtailed walls of different heights tested on a shaking table by Moehle and Sozen [28]. The experiment was reported in 1980. It was stated that the overall test structure configuration was determined by the equipment limitations at that time. The structural elements were chosen so that the wall height effect on the seismic response of multi-story RC wall–frame structures could be inspected.
2.1. Simulation Method of RC Frame Analysis
The experiment was conducted to investigate the response of RC frames with different wall heights against strong earthquakes. Figure 1, Figure 2 and Figure 3 present the structural element sections, the elevation view, and the plan view with connection details of the specimen. The specimen has nine stories and three bays with curtailed walls in the center. Shaking table experiments were conducted in the x-direction for three specimens with different heights of the curtailed walls. Names of the specimens were FNW, FSW, FHW, and FFW, where FNW is the frame with no wall, FSW is the frame with a one-story wall, FHW is the frame with a half wall (four-story wall), and FFW is the frame with a full-height wall.
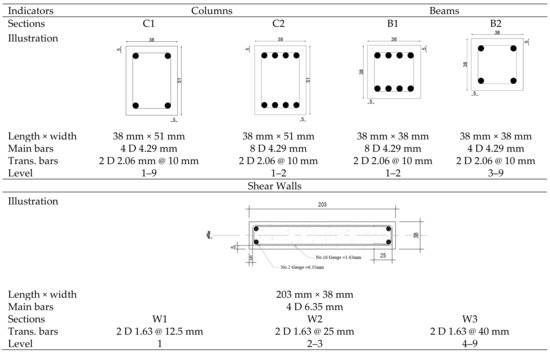
Figure 1.
Beam, column, and wall element sections used in experimental tests by Moehle and Sozen (dimension in mm).
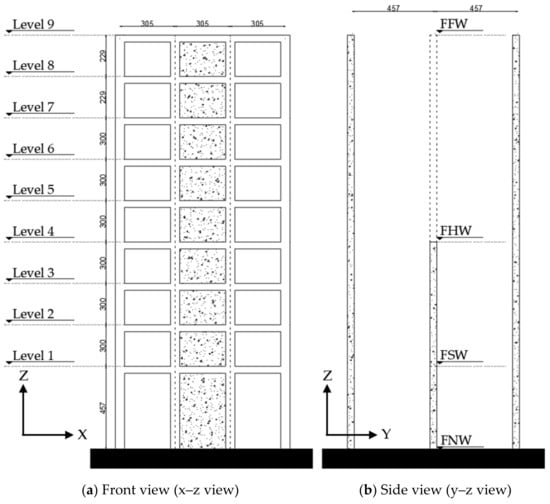
Figure 2.
Elevation view of the test specimen by Moehle and Sozen (dimension in mm).
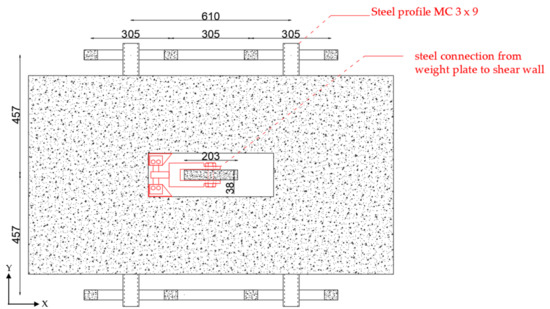
Figure 3.
Plan view of the test specimen by Moehle and Sozen; showing connection between RC frames, weighting plates, and RC shear walls (dimension in mm).
The design concrete compressive strength was 38 MPa, and the tensile strength of the steel rebar was 399 MPa. The total weight of the specimens was 40.87 kN, and each story weight is about 4.55 kN. The experimental raw data, which consists of the specimens’ dimensions, strengths, input seismic motions, displacement responses, and acceleration responses, were obtained from Datacenterhub [29].
2.2. Input Ground Motion
The specimens were tested on the shaking table subjected to the El Centro 1940 Imperial Valley earthquake, and the original time interval was divided by 2.5, considering the scale factor of the specimen. In order to attain a required amount of inelastic response, the peak acceleration was amplified to roughly 0.4 g. The recorded ground motion accelerations at the shaking table are shown in Figure 4 for each specimen.
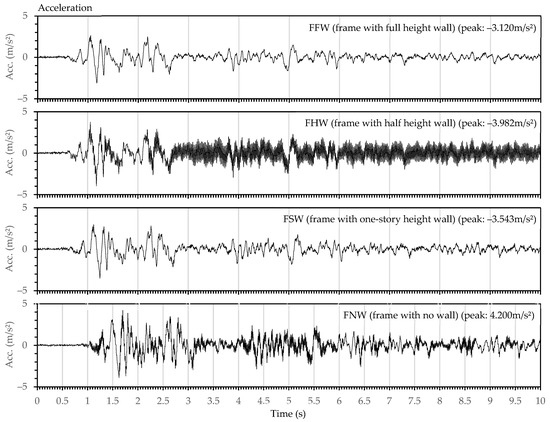
Figure 4.
Four accelerations recorded at the shaking table test during experiments.
2.3. Simulation Method of RC Frame-Wall Analysis
Nonlinear dynamic analyses of the specimens were performed using the STERA_3D version 10.8, a program developed by one of the co-authors [26]. STERA_3D is a three-dimensional software for seismic analysis of buildings with a variety of structures developed for educational and research purposes. STERA_3D features a graphical interface for quickly and easily creating building models and visualizing the results. The beam and column elements are modeled as line elements with two nonlinear bending springs at both ends and one nonlinear shear spring at the middle, as shown in Figure 5. The end displacement vector was obtained from Equation (1) as the sum of the displacement vector of each component. The RC column section was modeled by using the multi springs model, originally proposed by Lai, Will, and Otani in 1984 [30], as shown in Figure 6. The wall was modeled as a line element with a nonlinear shear spring and a nonlinear bending spring in the middle. The nonlinearity in the model is considered in both flexural spring and shear spring, as illustrated in Figure 7 and Figure 8. Figure 9 shows the model for the RC wall element, where ks is the stiffness of the nonlinear shear spring, kb is the stiffness of the nonlinear bending spring, and kn is the stiffness of the axial spring. The floor is assumed to be rigid for in-plane deformation; therefore, the two RC frames and RC wall are deforming conjunctively. The viscous damping was modeled as the proportional damping using the spontaneous stiffness matrix with a 1% damping factor. All the details of implemented modeling technique are available in STERA_3D Technical Manual [26]. The analytical models of the specimens in the STERA_3D are illustrated in Figure 10a–d.
where:
- θ: is the total rotation at the element joint;
- : is the element deformation at direction x;
- : is the elastic element rotation;
- : is the nonlinear element rotation due to bending;
- : is the nonlinear element rotation due to shear.
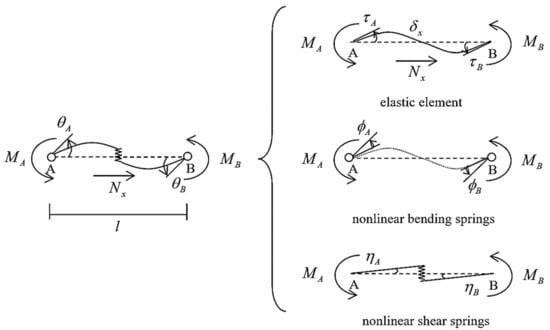
Figure 5.
Elastic, nonlinear bending, and nonlinear shear springs for elements modeled by STERA_3D [26].
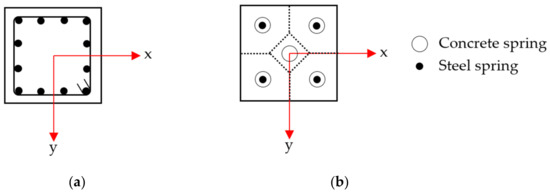
Figure 6.
RC Column section modelling using multi-spring models: (a) original column section, and (b) multi-spring model idealization [26].
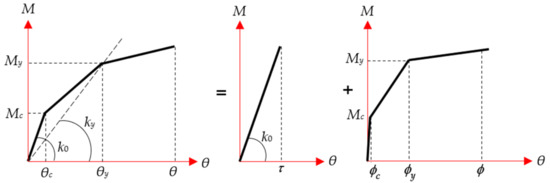
Figure 7.
Moment-rotation relationship at bending spring for nonlinearity consideration in structural elements [26].
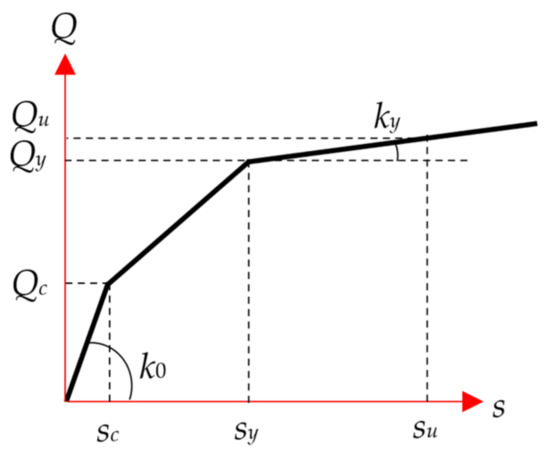
Figure 8.
Force-deformation relationship at shear spring for nonlinearity consideration in structural elements [26].
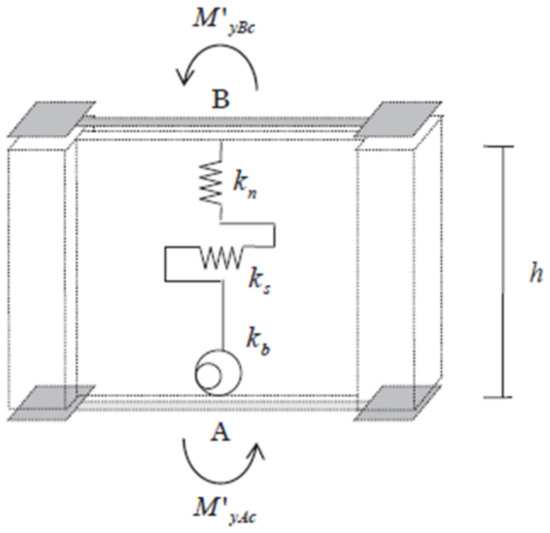
Figure 9.
Wall element idealization in STERA_3D [26].
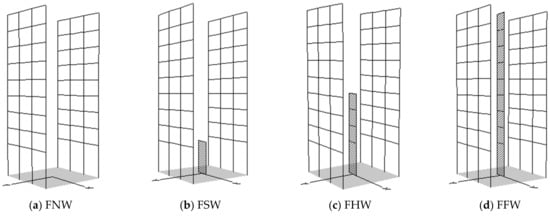
Figure 10.
STERA_3D models of test specimens.
2.4. Results of Comparison
The responses of acceleration and displacement at the top floor were calculated and compared with the experimental data, as shown in Figure 11 and Figure 12. Since the experimental and numerical results only had a slight difference, it is considered adequate to use the STERA_3D for further nonlinear response analyses of buildings with curtailed walls.
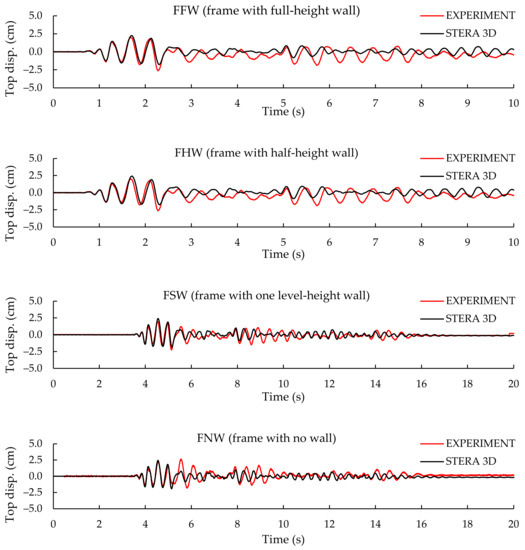
Figure 11.
Comparison of displacement response between Experiment and STERA_3D analysis.
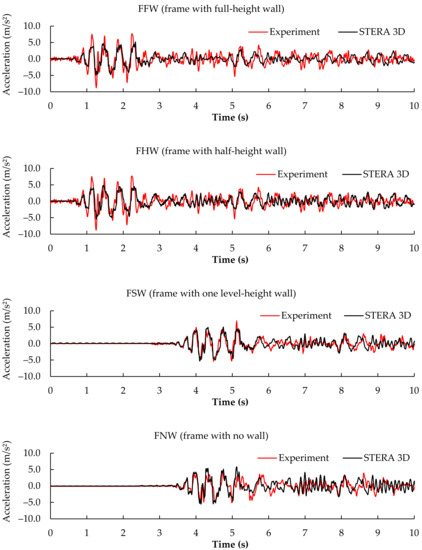
Figure 12.
Comparison of acceleration response between Experiment and STERA_3D analysis.
3. Response Characteristic of Frame Buildings with Curtailed Walls
3.1. Models of Frames with Curtailed Shear Walls
An analytical study was conducted for the reinforced concrete frames of ten and twenty-story with curtailed shear walls. Three different ratios of the curtailed wall heights were selected as 30%, 50%, and 70% of the total height of the structures. Each structure had five bays, and the span length was 6400 mm. The story height was 3000 mm, and the story weight was 3000 kN. In total, there are six types of building models. Each model was then named with the unique code based on its total height and wall percentage coverage: 1030, 1050, 1070, 2030, 2050, and 2070. Figure 13 shows the illustration of the models. Table 1, Table 2 and Table 3 show the detail of building dimensions and the concrete strengths. The tensile strength of main and shear reinforcement rebars for all members are 490 MPa and 295 MPa, respectively. The model was designed to satisfy the criteria of Japanese design standards.
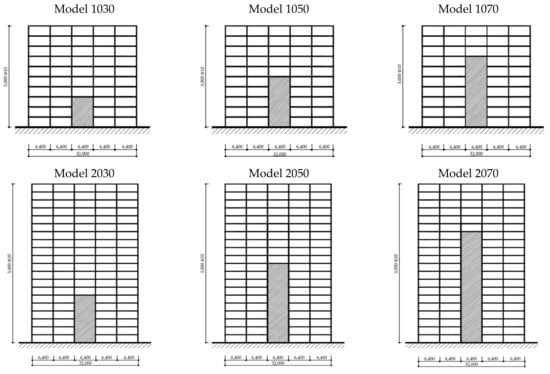
Figure 13.
Ten-story (top) and twenty-story (bottom); 30%, 50%, and 70 % of curtailed shear wall (in mm).

Table 1.
Structural parameters of RC columns.
Table 2.
Structural parameters of RC beams.
Table 3.
Structural parameters of RC walls.
3.2. Input Earthquake Ground Motions
Ten input motions were selected and scaled so that the maximum inter-story drift response is equal to 1/75 of the inter-story height. Table 4 is the list of earthquake ground motions, and Figure 14 and Figure 15 show their acceleration response spectra and the wave forms before scaling. Table 5 shows the scale factors to obtain the same maximum inter-story drift ratio of 1/75.
Table 4.
List of earthquake ground motions.
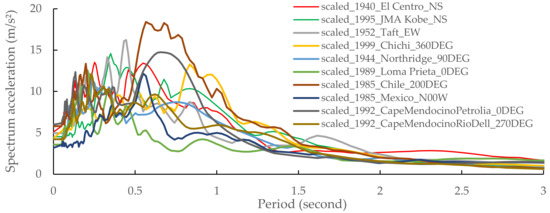
Figure 14.
Acceleration response spectrum of original earthquake ground motions.
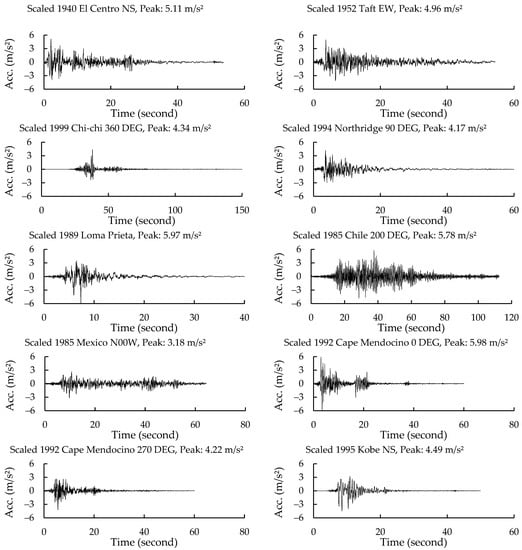
Figure 15.
Original ten time history acceleration waves of earthquake motions.
Table 5.
Amplification scale of input motions to produce maximum inter-story drift of 1/75 building inter-story height.
3.3. The Response of RC Frame-Curtailed Walls
The inter-story drift responses of RC frame-curtailed walls under ten earthquake input motions are depicted in Figure 16. From all nonlinear analyses, it is observed that after the wall coverage is stopped, the drift is then significantly increasing, and it makes a big difference in story drift between the upper part frame without walls and the lower part frame with walls. It is necessary to make all specimens have the same state of inter-story drift before the optimization is performed. Although the location of the peak inter-story drift is different for each earthquake, the scale for input motions in Table 5 is successfully implemented to produce the same maximum inter-story drift of 4 cm, which corresponds to the story drift ratio of 1/75.
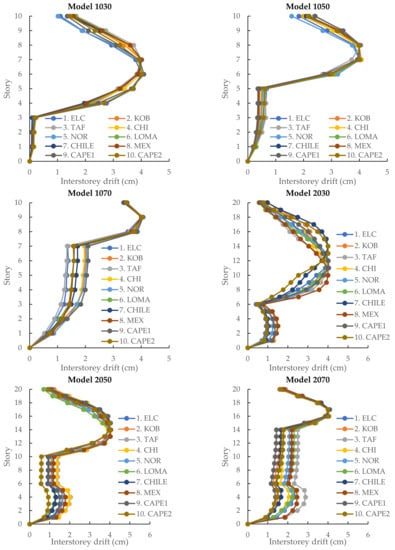
Figure 16.
Inter-story drift of six specimens under ten selected input motions.
4. Optimum Arrangement of BRBs for RC Frames with Curtailed Walls
4.1. Implementation of Genetic Algorithm
The Genetic Algorithm (GA) is a form of optimization algorithm inspired by natural selection. It is a population-based search algorithm that makes use of the survival of the fittest concept [31]. In this algorithm, the population is subjected to a series of transformation processes, including mutation and crossover. Individuals in a population compete for survival by following a predetermined selection process to become the next generation. After a few generations, the best individual will represent the ideal solution.
The objective of this section is to decide the optimum locations of buckling-restrained braces (BRBs) to reduce the story drift in the upper part of the frames with curtailed walls. In order to optimize the best location of BRBs, the genetic algorithm (GA) is adopted in this study. In the GA, the strings represented by binary numbers are candidate solutions to the problem. These solutions are referred to as chromosomes, and the binaries are referred to as genes. A fitness function, formed as a formula to achieve, is predetermined to select a candidate solution’s relative fitness, which the GA subsequently uses to guide the evolution of reasonable solutions.
In order to apply the GA in this study, the availability of BRB in the 2D frame structures is indicated using binary, which means the value will be zero if there is no BRB and one if there is a BRB. A set of binary numbers indicate the whole availability of BRB and their locations. These sets are associated with three main parameters to calculate the objective function. Then, six sets are initially generated randomly, and these sets are gathered to be an initial population during the GA process. The process is illustrated in Figure 17.
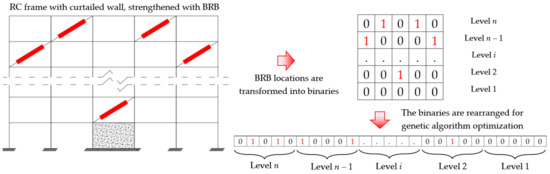
Figure 17.
The diagram of BRBs location to binaries for Genetic Algorithm optimization process.
4.2. Procedures
The genetic algorithm consists of the following processes. The general process is shown in Figure 18.
- Initialization: The initial population of candidate solutions is generated randomly across the search space. Each generation contains six solutions per population;
- Evaluation: After the population is initialized, the fitness values of the candidate solutions are evaluated using the determined fitness function;
- Selection: Selection is performed by ranking the solution based on the fitness function, and it imposes the survival-of-the-fittest mechanism on the candidate solutions;
- Crossover: In this step, the first half of the first solution is combined with the last half of the second solution to produce a new population for the next generation;
- Mutation: The modification is made by randomly changing one digit of the binaries;
- Replacement: In this step, the new population in the newest generation will replace the other population if the fitness function value is closer to the determined target;
- The steps b to f are repeated until one or more stopping criteria are met.
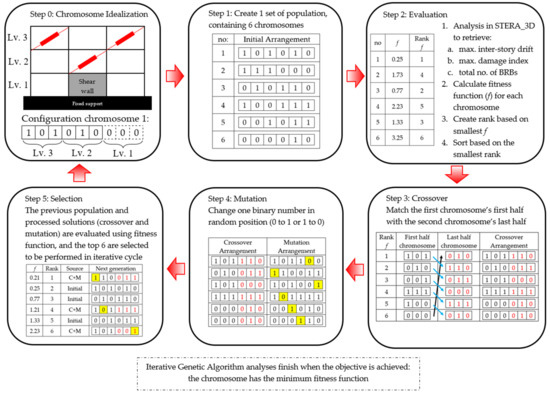
Figure 18.
The general process of Genetic Algorithm sample.
4.3. Initial Population
A set of the initial population was created using the parameters such as number of spans (nbays), number of stories (nstory), and number of shear wall story coverage (nwall), with the number of solutions for each population (spp) is defined as the following Equation (2).
4.4. Determination of Objective and Fitness Function
The binaries number produced in step one is then transferred to the STERA_3D to recreate the frame with BRBs. The nonlinear dynamic response is then performed with ten ground motions to obtain the inter-story drift and the damage index of beams. These parameters were used to calculate the objective function, together with the total number of BRBs. The fitness function is defined as the sum of three conditions: the total number of BRBs, inter-story drift, and the damage index of the RC members, as shown in Equation (3).
where:
- : Weighting factors, with = 0.3, = 2, and = 0.2 (based on the trial);
- : Condition for total number of BRBs;
- : Condition for story drift;
- : Condition for damage index of RC members.
The parameter is the contribution effect of the number of BRBs. The is calculated using Equation (4).
where:
- : Number of BRBs in i-th story;
- N: Total number of stories;
- k: Top story number of the curtailed wall.
The parameter is the effect of the maximum inter-story drift. The is defined by Equations (5) and (6), where it is zero if the maximum inter-story drift is less than the allowable drift , which equals 1/100 of the inter-story height.
where:
- : The maximum story drift in i-th story;
- : Allowable story drift.
The parameter is the effect of the damage index of the RC members. The is defined by Equation (7). In this equation, the average damage index between the left side and the right side of the beam element is adopted.
where:
- j: The inspected bays number;
- : Damage index of beam on the left joint;
- : Damage index of beam on the right joint.
The damage index (DI) is expressed by Equation (8) based on the structural deformation and the hysteretic energy response due to seismic excitations.
where:
- um: Maximum displacement response of structure element due to earthquake;
- uu: Ultimate displacement capacity under monotonic loading;
- Eh: Hysteretic energy dissipated by the structural element;
- Fy: Yield force;
- β: Non-negative parameter based on repeated loading effect.
4.5. BRBs Strengths
The BRB applied for the RC frame structure with the curtailed wall is chosen based on the study performed by Naqi and Saito [32]. This adoption consideration is taken on account of the similarity in the building’s type, height, and dimensions. The applied BRB strength detail for this study are elaborated in Table 6 and Figure 19.
Table 6.
Strength of BRB adopted in study 1.
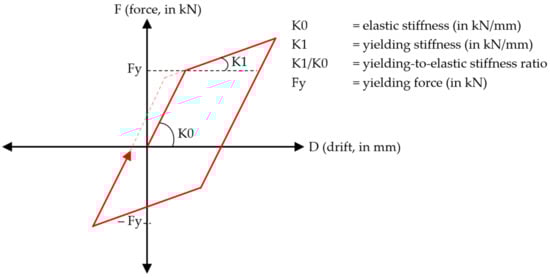
Figure 19.
The adopted BRB’s bilinear hysteresis.
4.6. Simple Probabilistic Method to Determine the Final BRB Arrangement
The optimum positions of BRBs under selected ten earthquake ground motions are different for each ground motion. Figure 20 and Figure 21 show the distribution of BRBs location, added with the color, which indicates the probability of occurrence of BRBs location, based on the optimization from 10 different ground motions. The value in the panel is between 0 and 1, where 0 means there are no BRB and 1 means all 10 input motions determine that there is BRB in that panel. The final BRBs locations are then selected ascendingly based on the higher value of possibility.
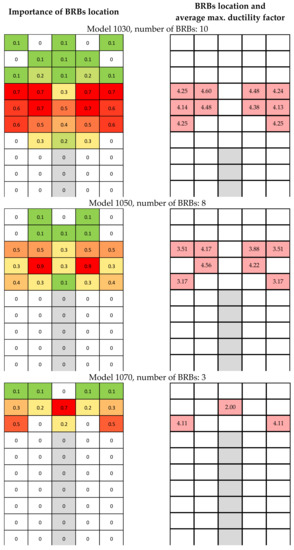
Figure 20.
Implementation of BRBs placement for 10 stories based on optimization under 10 input motions.
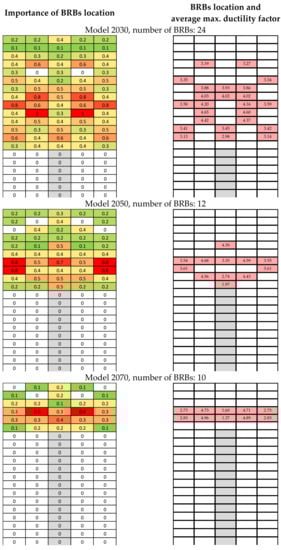
Figure 21.
Implementation of BRBs placement for 20 stories based on optimization under 10 input motions.
4.7. Response of RC Frame-Wall with Final BRB Arrangement under the Scaled Motions
The optimized locations of BRBs for six RC frame structures with curtailed walls were selected based on the GA and the simple probabilistic method. The seismic performance improvement after the BRBs placement is presented in Figure 22 for models with 10 stories and Figure 23 for models with 20 stories. The red straight lines indicate the average inter-story drift of RC frame with different wall heights before adding the BRB, while the black straight lines are after placing BRBs. Especially at the upper region of walls, the inter-story drift is improved from 1/75 of inter-story height to 1/100.
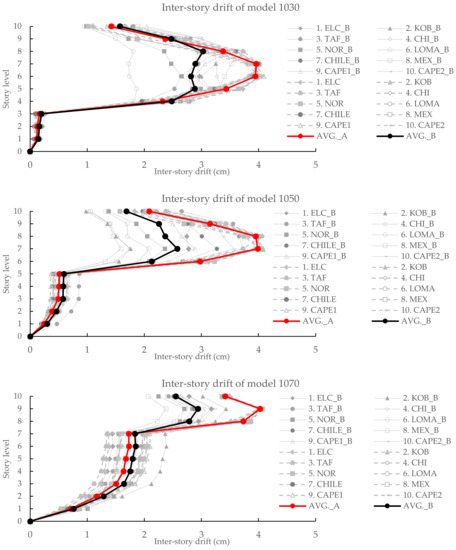
Figure 22.
Comparison of inter-story drift distribution of frame-curtailed wall structure without BRBs and with BRBs for 10 stories.
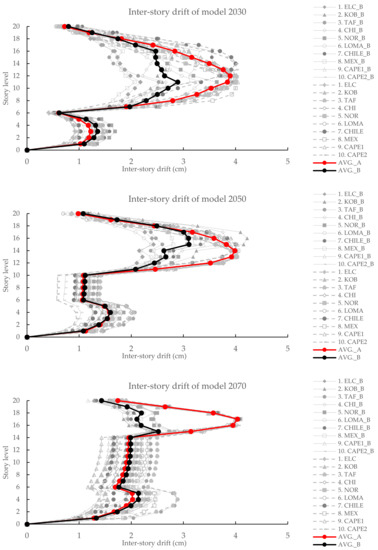
Figure 23.
Comparison of inter-story drift distribution of frame-curtailed wall structure without BRBs and with BRBs for 20 stories.
5. Conclusions
The seismic performance of RC frame structures with different heights of shear walls was studied numerically under the nonlinear dynamic analysis.
First, four sets of previous experimental one-directional test models by Moehle and Sozen [28] comprising RC frames with different wall height coverages were modeled and analyzed by the STERA_3D. The simulation results matched well with the test results.
Then, 10-story and 20-story RC frames with 30%, 50%, and 70% wall coverages were generated and analyzed using the STERA_3D. The results show that the upper region where the wall coverage stops has a significant response of inter-story drift. In order to decrease the seismic response at the upper region of the frame without wall coverage, the installation of BRBs was proposed.
The genetic algorithm is applied to determine the optimum locations of BRBs by considering three main parameters in the fitness function: the inter-story drifts, the damage index of the beams, and the total number of BRBs. Under ten selected earthquake motions, the optimum locations of BRBs were found to be different for each motion. Thus, a simple probabilistic method is employed to select the final locations of BRBs. The method successfully reduced the average inter-story drifts from 1/75 to 1/100 and gave a better seismic response at the upper region.
Author Contributions
Conceptualization, T.S., P.A.d.F.F. and T.I.M.; methodology, P.A.d.F.F. and T.I.M.; software, T.S.; writing—original draft preparation, P.A.d.F.F. and T.I.M.; writing—review and editing, T.S.; supervision, T.S. All authors have read and agreed to the published version of the manuscript.
Funding
This research received no external funding.
Institutional Review Board Statement
Not applicable.
Informed Consent Statement
Not applicable.
Data Availability Statement
The data presented in this study are available on request from the corresponding author.
Conflicts of Interest
The authors declare no conflict of interest.
References
- Estekanchi, H.E.; Harati, M.; Mashayekhi, M.R. An investigation on the interaction of moment-resisting frames and shear walls in RC dual systems using endurance time method. Struct. Des. Tall. Spec. Build. 2018, 27, e1489. [Google Scholar] [CrossRef]
- Xia, G.; Shu, W.; Stanciulescu, I. Efficient analysis of shear wall-frame structural systems. Eng. Comp. 2019, 36, 2084–2110. [Google Scholar] [CrossRef]
- Bhatta, B.D.; Vimalanandan, G.; Senthilselvan, S. Analytical study on effect of curtailed shear wall on seismic performance of high-rise building. Int. J. Civ. Eng. Tech. 2017, 8, 511–519. [Google Scholar]
- Bhatt, G.; Titiksh, A.; Rajepandhare, P. Effect of Curtailment of Shear Walls for Medium Rise Structures. In Proceedings of the 2nd International Conference on Sustainable Computing Techniques in Engineering, Science and Management (SCESM-2017), Belagavi, India, 27–28 January 2017; pp. 501–507. [Google Scholar]
- Rathi, N.; Muthukumar, G.; Kumar, M. Influence of Shear Core Curtailment on the Structural Response of Core-Wall Structures. In Lecture Notes in Civil Engineering: Recent Advances in Structural Engineering; Springer: Singapore, 2019; Volume 1, pp. 207–215. [Google Scholar]
- Nollet, M.J.; Stafford Smith, B. Behavior of curtailed wall-frame structures. J. Struct. Eng. 1993, 119, 2835–2854. [Google Scholar] [CrossRef]
- Nollet, M.J. Behaviour of Wall-Frame Structures: A Study of the Interactive Behaviour of Continuous and Discontinuous Wall-Frame Structures. Ph.D. Thesis, McGill University, Montréal, QC, Canada, 1991. [Google Scholar]
- Atik, M.; Badawi, M.M.; Shahrour, I.; Sadek, M. Optimum level of shear wall curtailment in wall-frame buildings: The continuum model revisited. J. Struct. Eng. 2019, 140, 06013005. [Google Scholar] [CrossRef]
- Atik, M. The Effect of Curtailed Walls in Wall-Frame Structures to Resist Lateral Loads. Master’s Thesis, University of Aleppo, Aleppo, Syria, 2010. [Google Scholar]
- Costa, A.G.; Oliveira, C.S.; Duarte, R.T. Influence of vertical irregularities on seismic response of buildings. In Proceedings of the 9th World Conference on Earthquake Engineering (9th WCEE), Tokyo, Japan, 2–9 August 1988; pp. 491–496. [Google Scholar]
- Paulay, T.; Priestley, M.J.N. Seismic Design of Reinforced Concrete and Masonry Buildings, 1st ed.; Wiley-Interscience: New York, NY, USA, 1992; pp. 500–531. [Google Scholar]
- Farhat, F.; Nakamura, S.; Takahashi, K. Application of genetic algorithm to optimization of buckling restrained braces for seismic upgrading of existing structures. Comput. Struct. 2009, 87, 110–119. [Google Scholar] [CrossRef]
- Oxborrow, G.T.; Richards, P. Optimized distribution of strength in tall buckling-restrained brace frames. In Behaviour of Steel Structures in Seismic Areas; CRC Press: London, UK, 2009; Volume 1, pp. 819–824. [Google Scholar]
- Oxborrow, G.T. Optimized Distribution of Strength in Buckling-Restrained Brace Frames in Tall Buildings. Master’s Thesis, Brigham Young University, Provo, UT, USA, 2009. [Google Scholar]
- Park, K.; Oh, B.K.; Park, H.S.; Choi, S.W. GA-based multi-objective optimization for retrofit design on a multi-core PC cluster. Comput.-Aided Civ. Infrastruct Eng. 2015, 30, 965–980. [Google Scholar] [CrossRef]
- Mohammadi, R.K.; Garoosi, M.R.; Hajirasouliha, I. Practical method for optimal rehabilitation of steel frame buildings using buckling restrained brace dampers. Soil Dyn. Earthq. Eng. 2019, 123, 242–251. [Google Scholar] [CrossRef]
- Tu, X.; He, Z.; Huang, G. Performance-based multi-objective collaborative optimization of steel frames with fuse-oriented buckling-restrained braces. Struct. Multidiscipl. Optim. 2020, 61, 365–379. [Google Scholar] [CrossRef]
- Fujishita, K.; Sutcu, F.; Matsui, R.; Takeuchi, T. Optimization of Damper Arrangement with Hybrid GA using Elasto-plastic Response Analysis on Seismic Response Control Retrofit. J. Struct. Constr. Eng. 2016, 81, 537–546. [Google Scholar] [CrossRef] [Green Version]
- Terazawa, Y.; Takeuchi, T. Generalized response spectrum analysis for structures with dampers. Earthq. Spectra 2018, 34, 1459–1479. [Google Scholar] [CrossRef]
- Terazawa, Y.; Takeuchi, T. Optimal damper design strategy for braced structures based on generalized response spectrum analysis. Japan Archit. Rev. 2018, 2, 477–493. [Google Scholar] [CrossRef] [Green Version]
- Park, Y.-J.; Ang, A.H.-S. Mechanistic seismic damage model for reinforced concrete. J. Struct. Eng. 1985, 111, 722–739. [Google Scholar] [CrossRef]
- Park, Y.-J.; Ang, A.H.-S.; Wen, Y.K. Seismic damage analysis of reinforced concrete buildings. J. Struct. Eng. 1985, 111, 740–757. [Google Scholar] [CrossRef]
- Tagel-Din, H.; Meguro, K. Applied Element Method for Dynamic Large Deformation Analysis of Structures. Int. J. Jpn. Soc. Civ. Eng. 2010, 17, 215s–224s. [Google Scholar] [CrossRef] [Green Version]
- Fathalla, E.; Salem, H. Parametric Study on Seismic Rehabilitation of Masonry Buildings Using FRP Based upon 3D Non-Linear Dynamic Analysis. Buildings 2018, 8, 124. [Google Scholar] [CrossRef] [Green Version]
- Sediek, O.A.; El-Tawil, S.; McCormick, J. Seismic Debris Field for Collapsed RC Moment Resisting Frame Buildings. J. Struct. Eng. 2021, 147, 04021045. [Google Scholar] [CrossRef]
- Saito, T. Structural Earthquake Response Analysis, STERA_3D Version 10.8. Available online: http://www.rc.ace.tut.ac.jp/saito/software-e.html (accessed on 1 October 2020).
- Maulana, T.I.; Enkhtengis, B.; Saito, T. Proposal of Damage Index Ratio for Low- to Mid-Rise Reinforced Concrete Moment-Resisting Frame with Setback Subjected to Uniaxial Seismic Loading. Appl. Sci. 2021, 11, 6754. [Google Scholar] [CrossRef]
- Moehle, J.P.; Sozen, M. Experiment to Study Earthquake Response of R/C Structures with Stiffness Interruptions; National Science Foundation Report; University of Illinois at Urbana-Champaign: Champaign, IL, USA, 1980. [Google Scholar]
- Moehle, J.; Sozen, M. Experiments to Study Earthquake Response of R/C Structures with Stiffness Interruptions (NEES-2011-1058). Available online: https://datacenterhub.org/deedsdv/publications/view/298 (accessed on 1 October 2020).
- Lai, S.-S.; Will, G.T.; Otani, S. Model for Inelastic Biaxial Bending of Concrete Members. J. Struct. Eng. 1984, 110, 2563–2584. [Google Scholar] [CrossRef]
- Michalewicz, Z. Genetic Algorithms + Data Structures = Evolution Programs; Springer: New York, NY, USA, 1992. [Google Scholar]
- Naqi, A.; Saito, T. Performance of a BRB RC High-rise Buildings Under Successive Application of Wind-Earthquake Scenarios. In Proceedings of the 1st Croatian Conference on Earthquake Engineering (1st CroCEE), Zagreb, Croatia, 22–24 March 2021; pp. 909–919. [Google Scholar]
Publisher’s Note: MDPI stays neutral with regard to jurisdictional claims in published maps and institutional affiliations. |
© 2022 by the authors. Licensee MDPI, Basel, Switzerland. This article is an open access article distributed under the terms and conditions of the Creative Commons Attribution (CC BY) license (https://creativecommons.org/licenses/by/4.0/).