
Preliminary Application of the Algorithm Highlighting Petroglyph Patterns


Abstract
:1. Introduction
2. Related Works
3. Petroglyphs in Hodjikent, Uzbekistan
4. Materials and Methods
- Registration—Fine registration.
- Edition of scans—Removed artefacts; (selection tools were used, such as: Lasso selection, Cutoff-plane selection and 3D selection).
- Alignment of scans—scans were matched by specifying 3–4 pairs of characteristic points on the scans.
- Registration—Global registration.
- Fusion—Outlier removal.
- Fusion—Smooth fusion.
- Postprocessing—if there were holes, they were repaired using the Hole filling or Fix holes tools.
- Postprocessing—Mesh simplification.
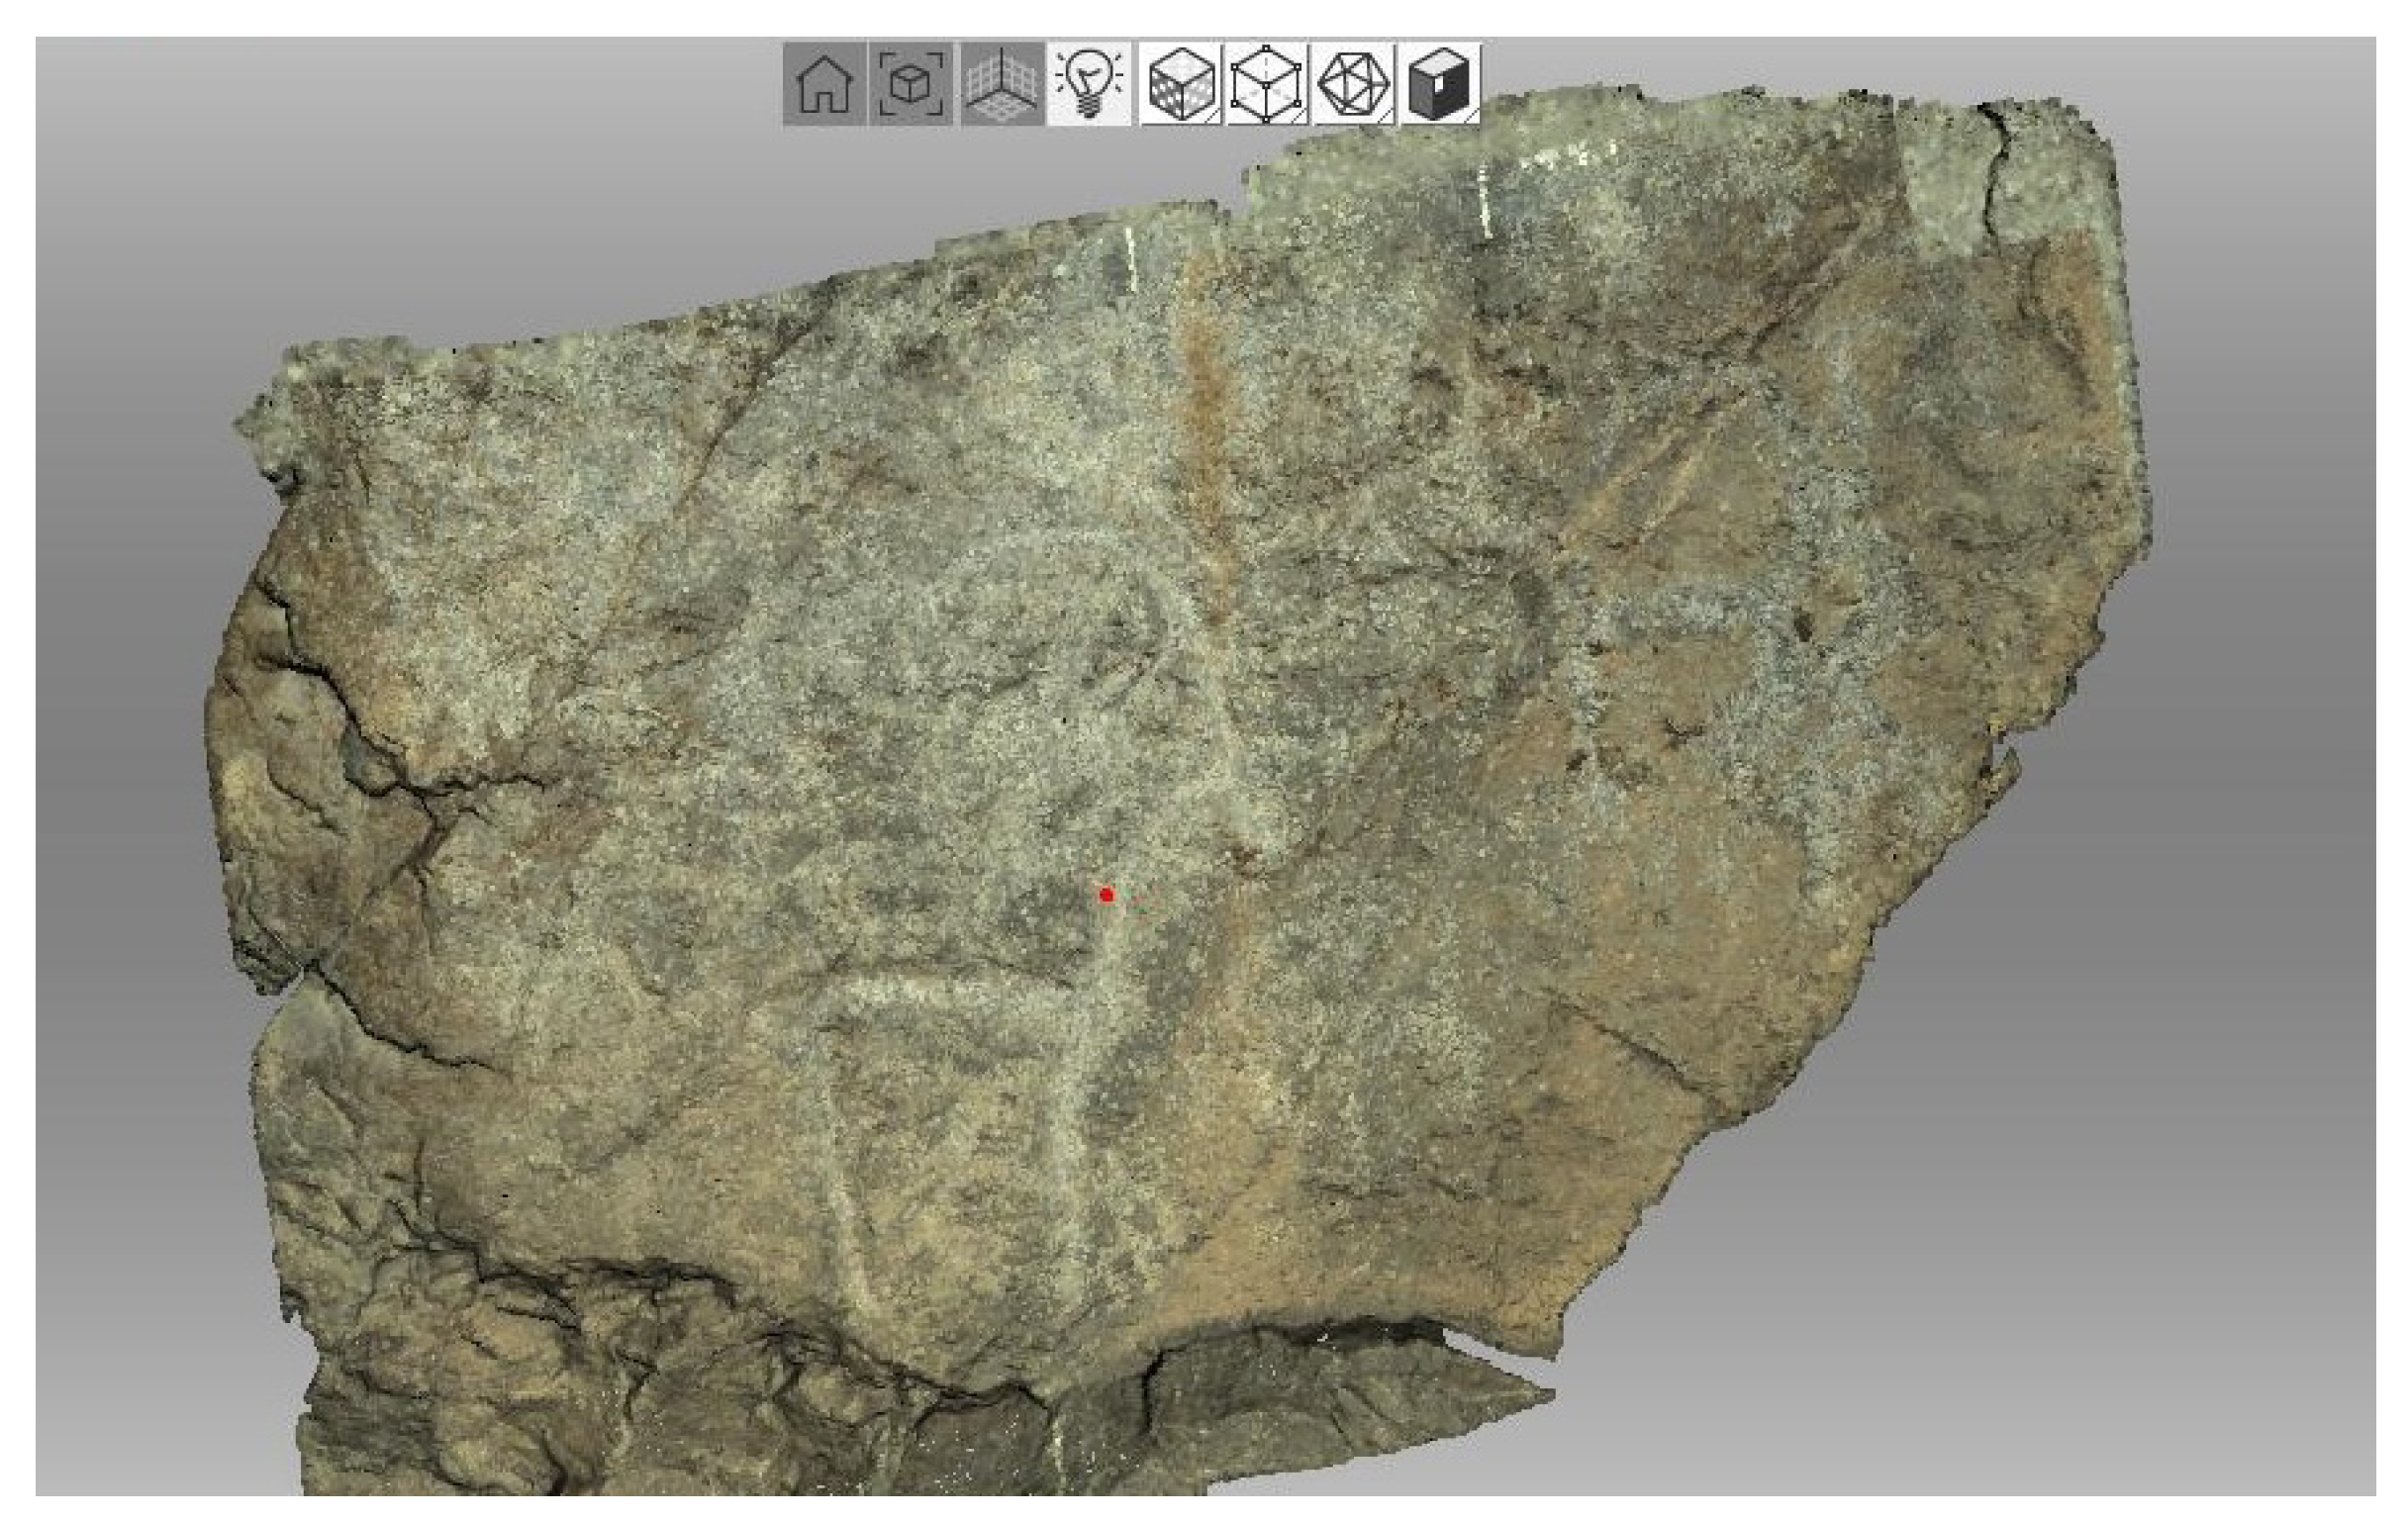
- Applying texture.
- 1.
- Reading of the mesh model.
- 2.
- Assessment of the location of the pattern in relation to the floor plane (XY).
- 3.
- 3D transforms of point clouds (rotations around the axis X, Y, Z).
- 4.
- Removing unnecessary fragments of the model.
- 5.
- Sorting points on the y coordinate.
- 6.
- Creating a section for a given interval m < y < n.
- 7.
- Representation of the cross-section in the diagram.
- 8.
- Searching for local minima with specific properties for each cross-section (width and depth of the ‘well’).
- 9.
- Joining sections—the vicinity of the points found must be within the range (elimination of local grooves).
| Algorithm 1: Cloud data pre-processing and cross-section creation |
| Input: Coordinate file . Parameters: Parameters defining the cross-section creation step, window parameters. Output: Coordinate file .
|
5. Results
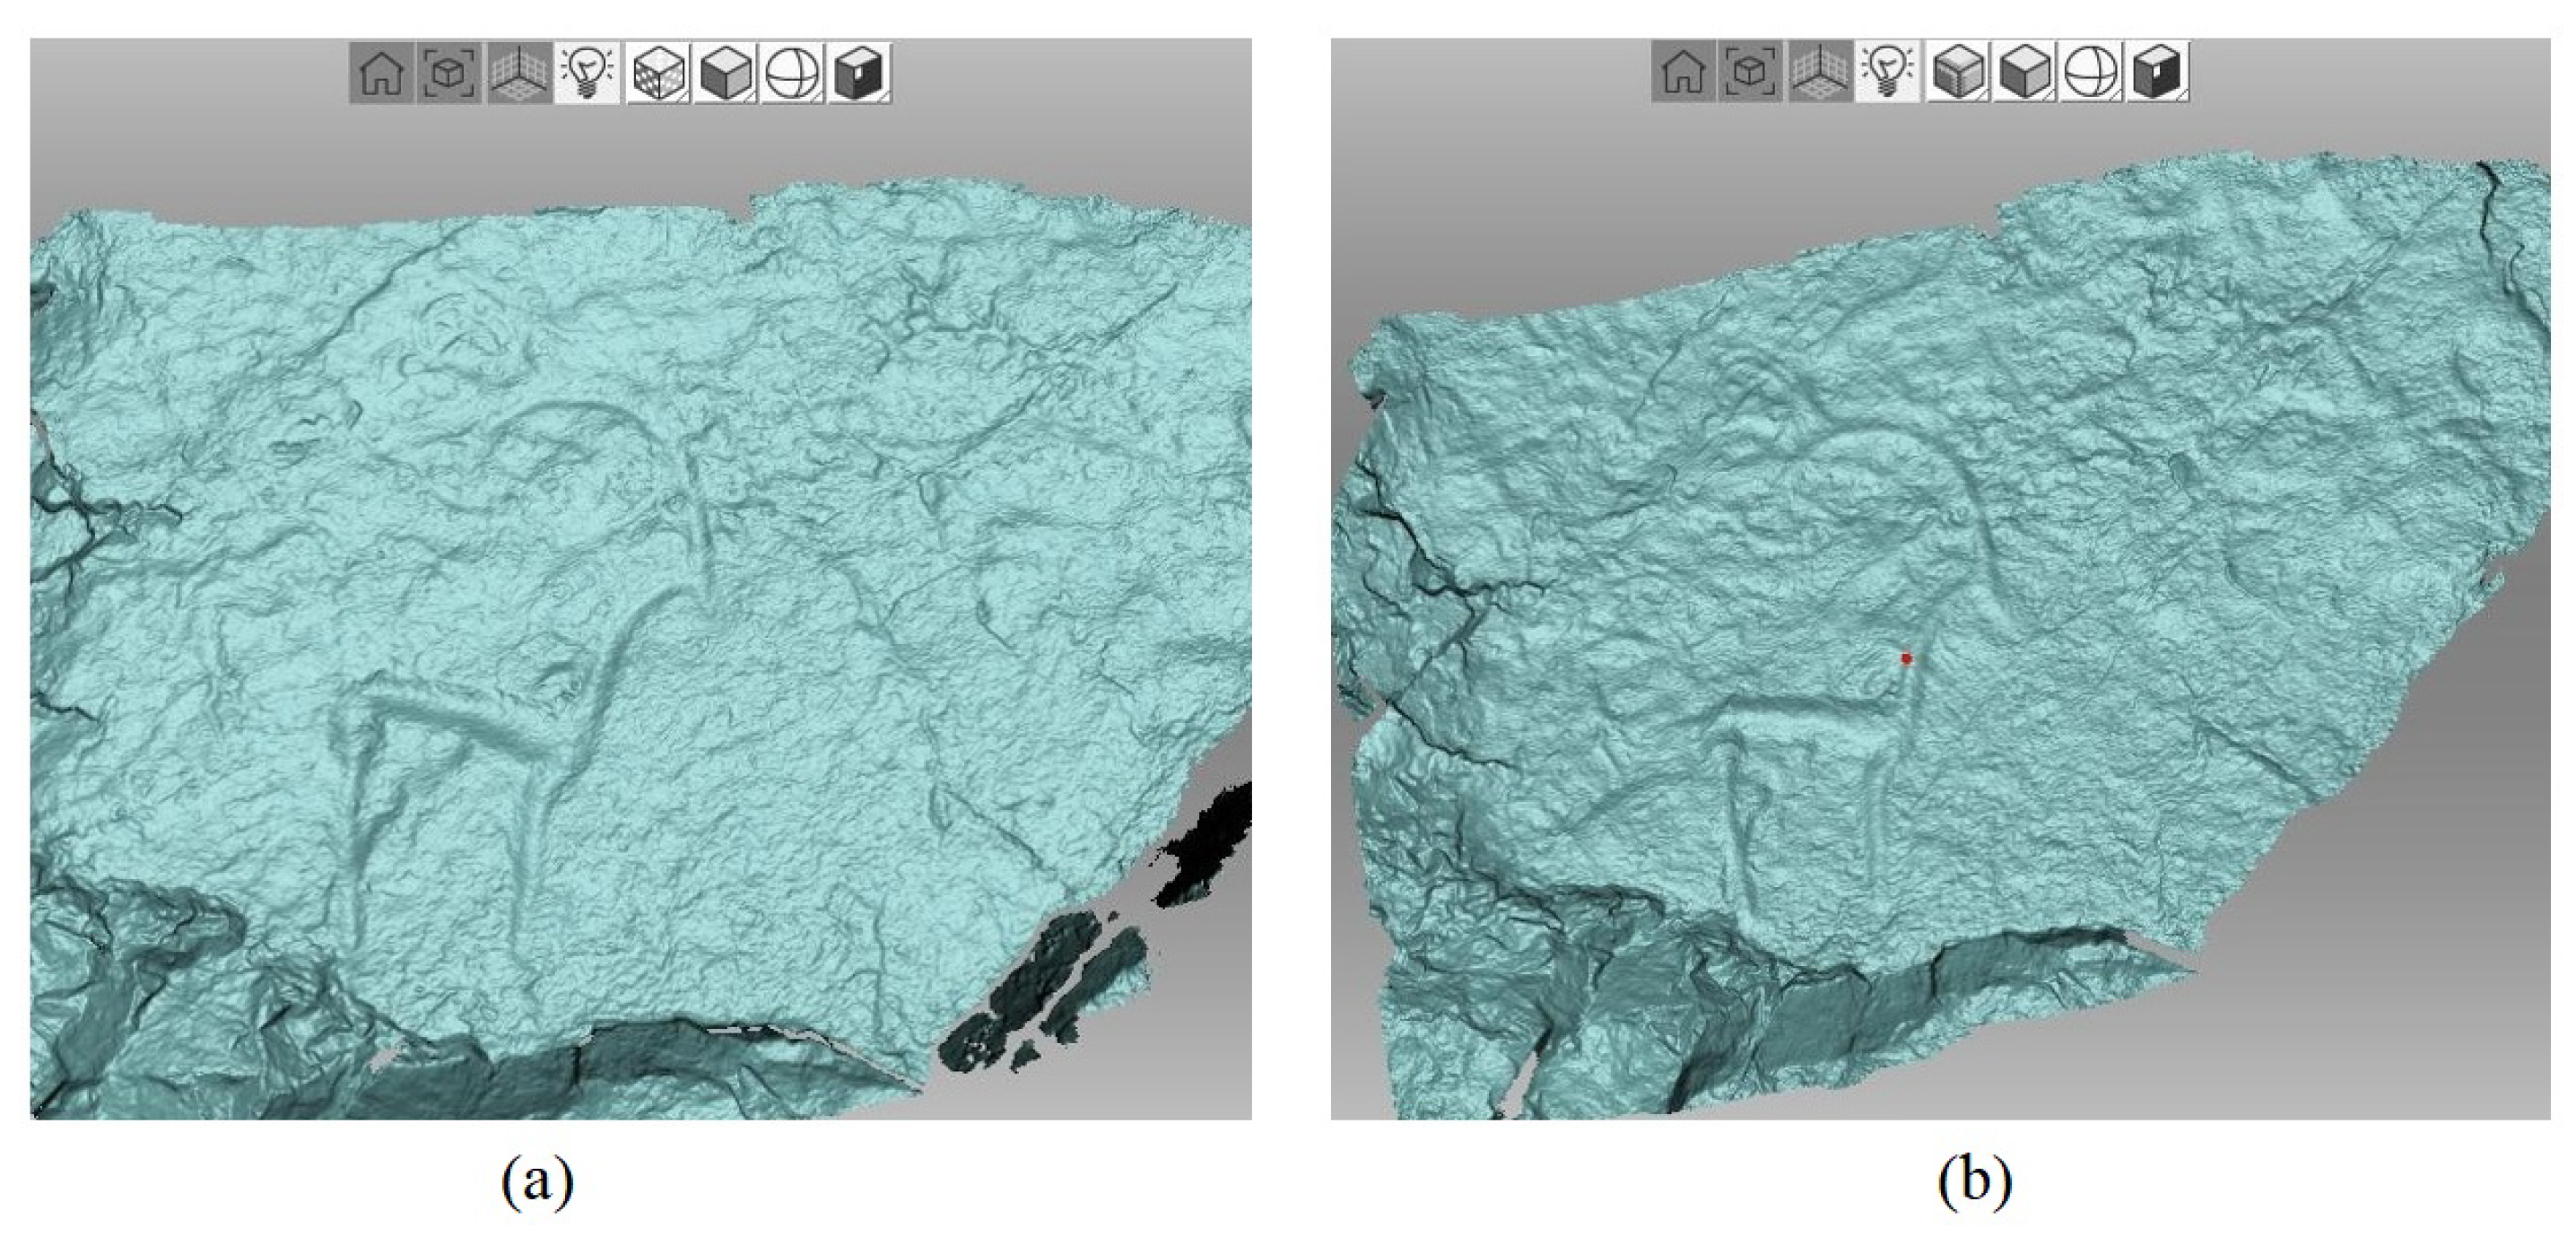
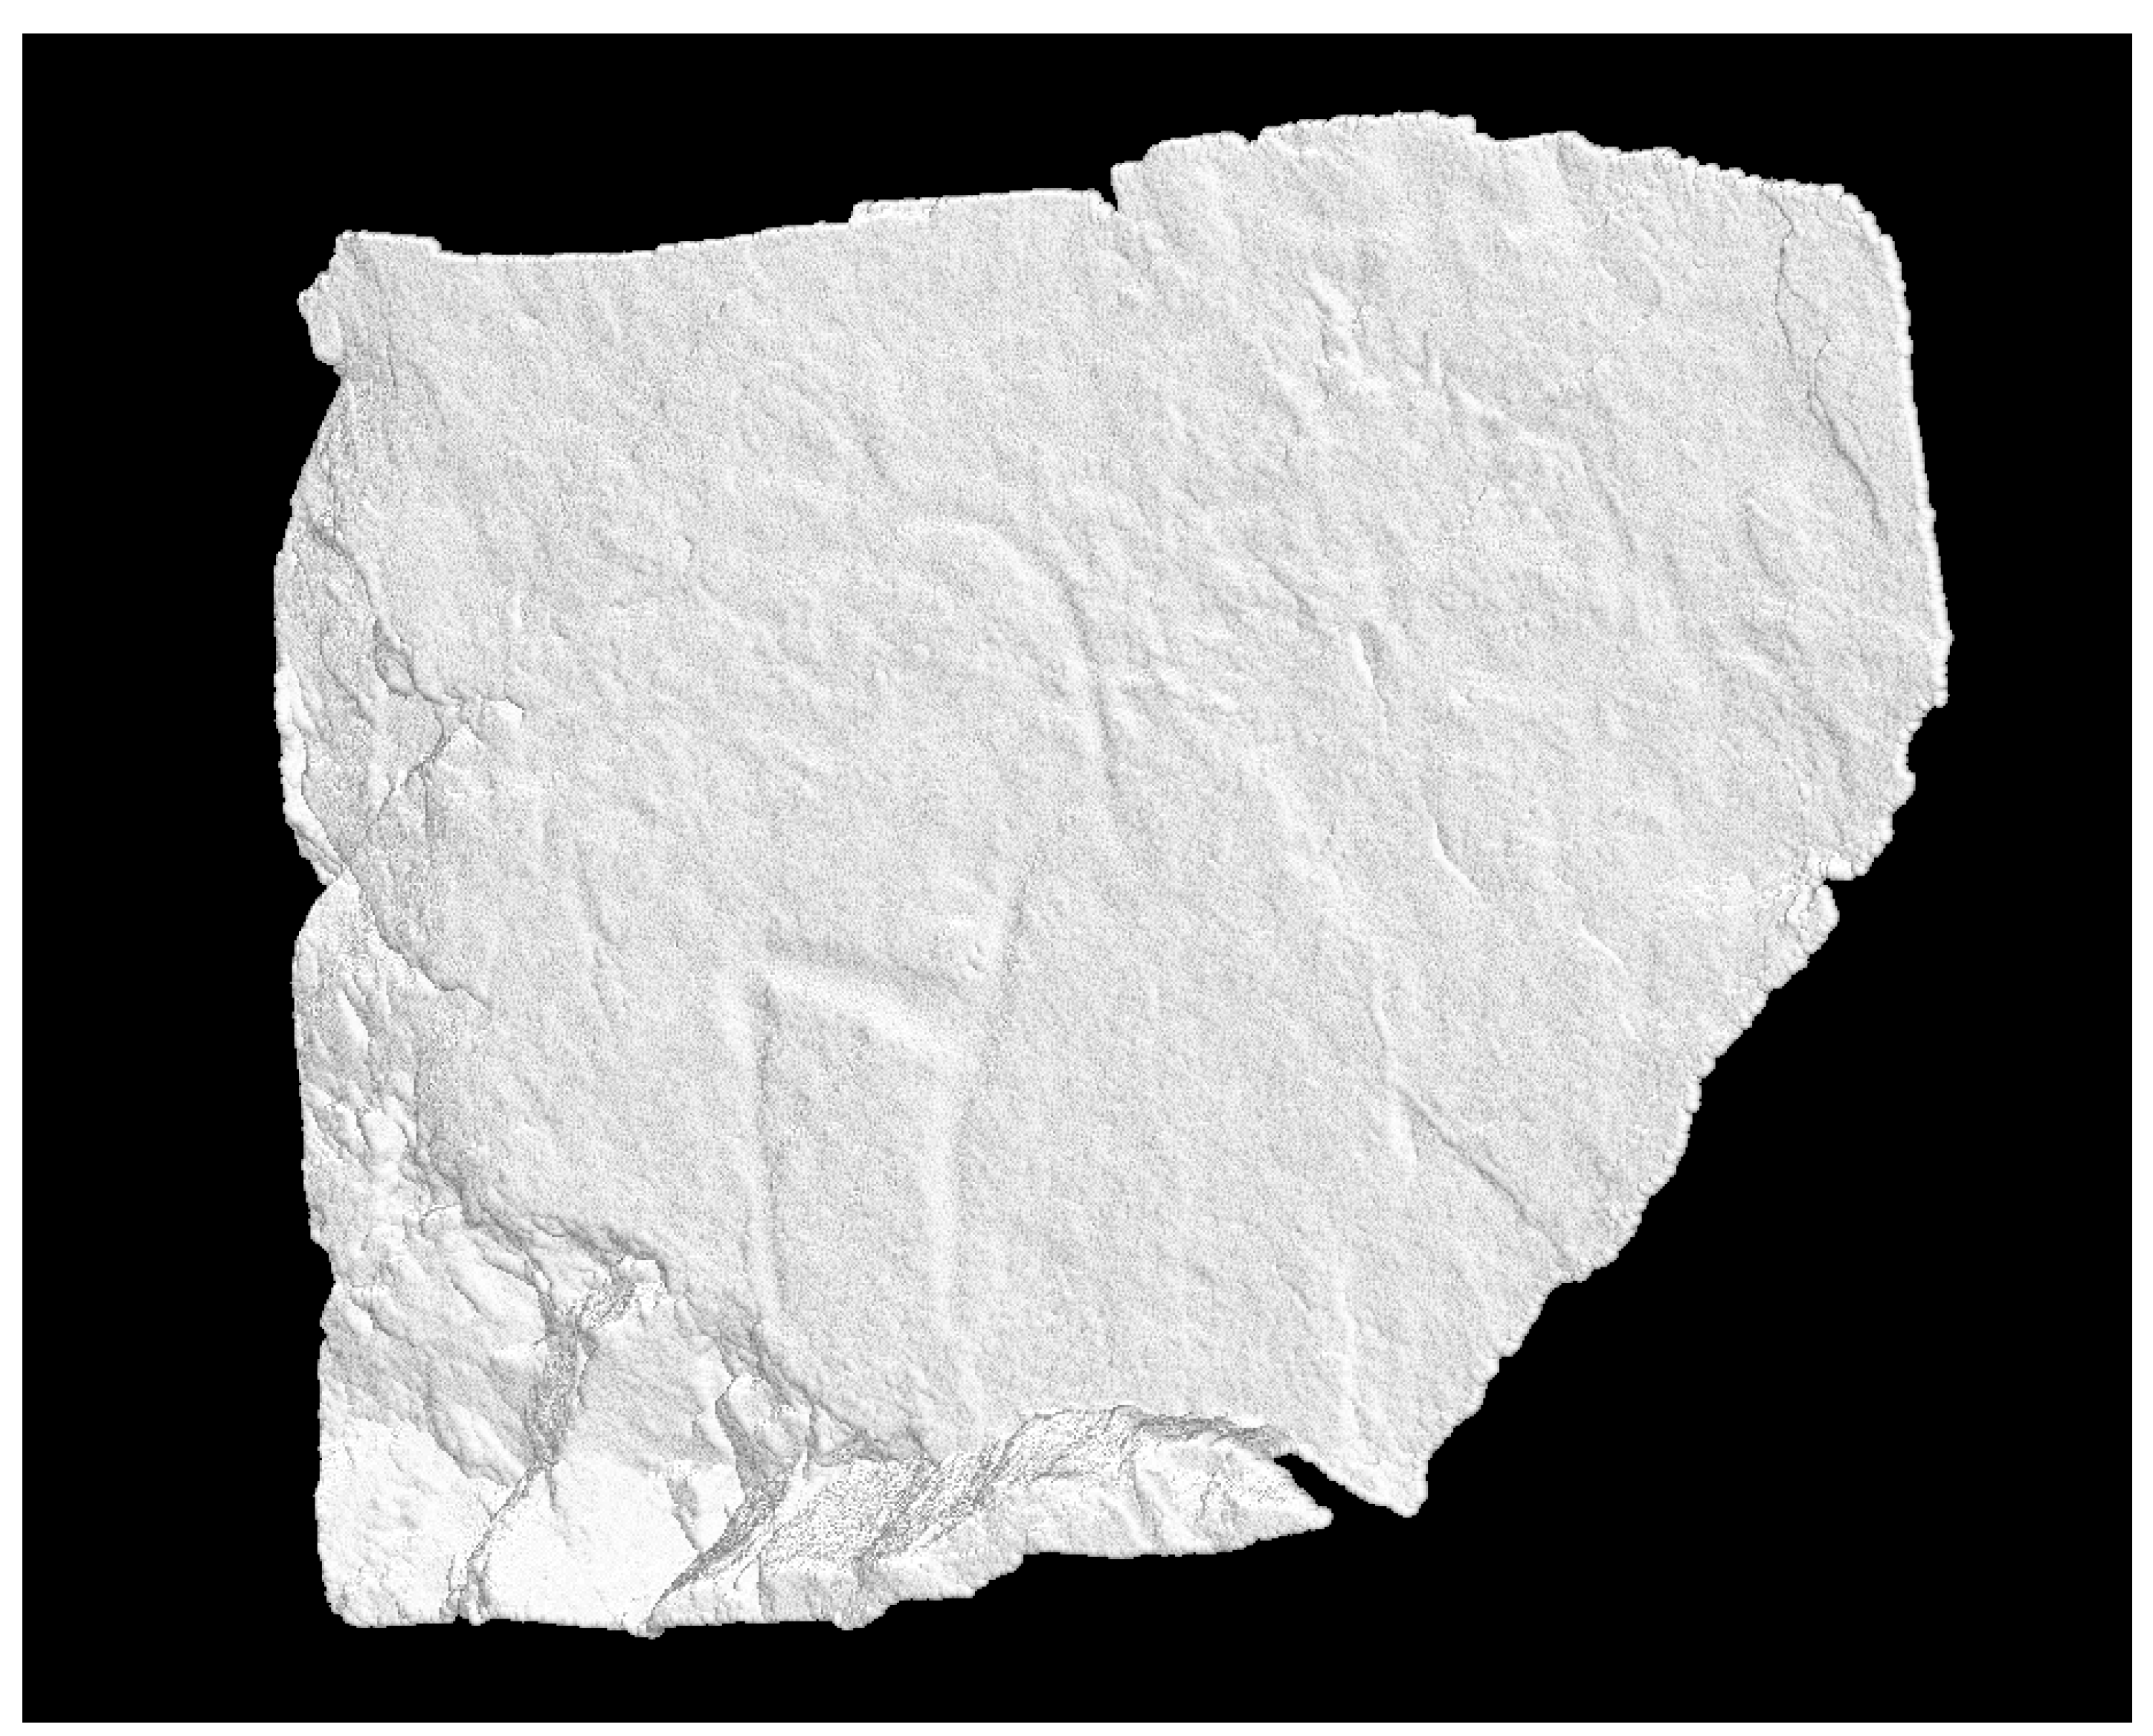
5.1. Visualisation
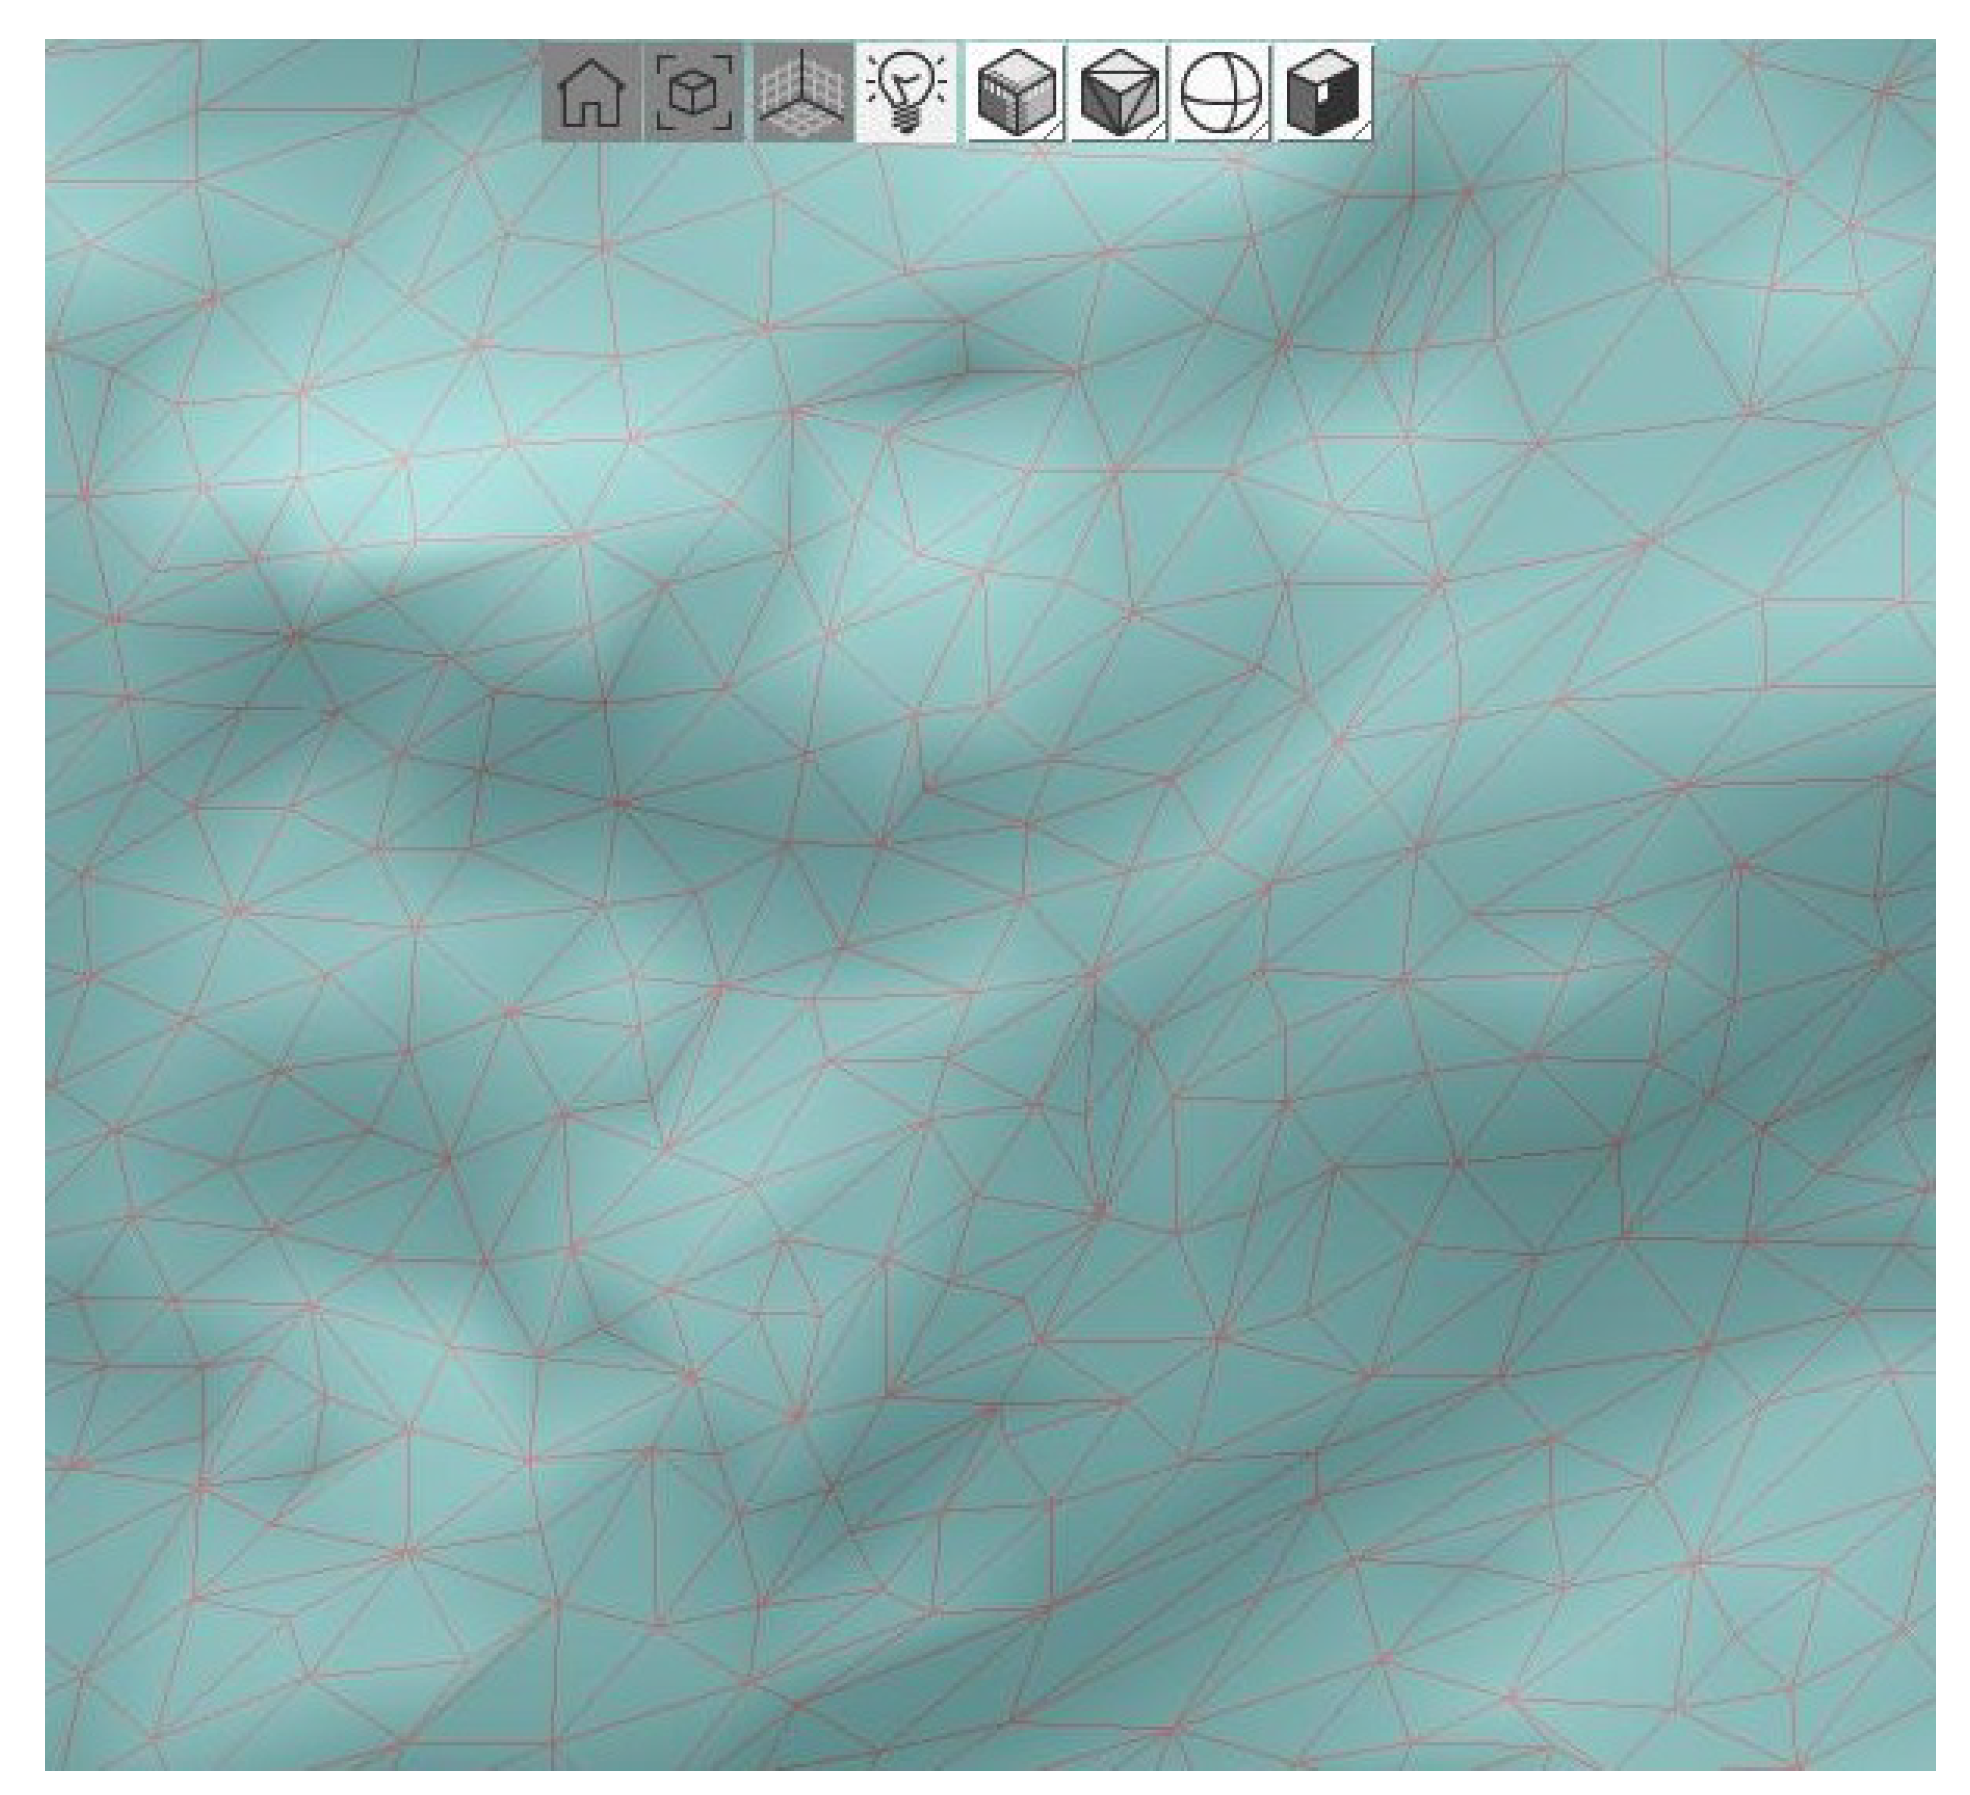
5.2. Model Reduction
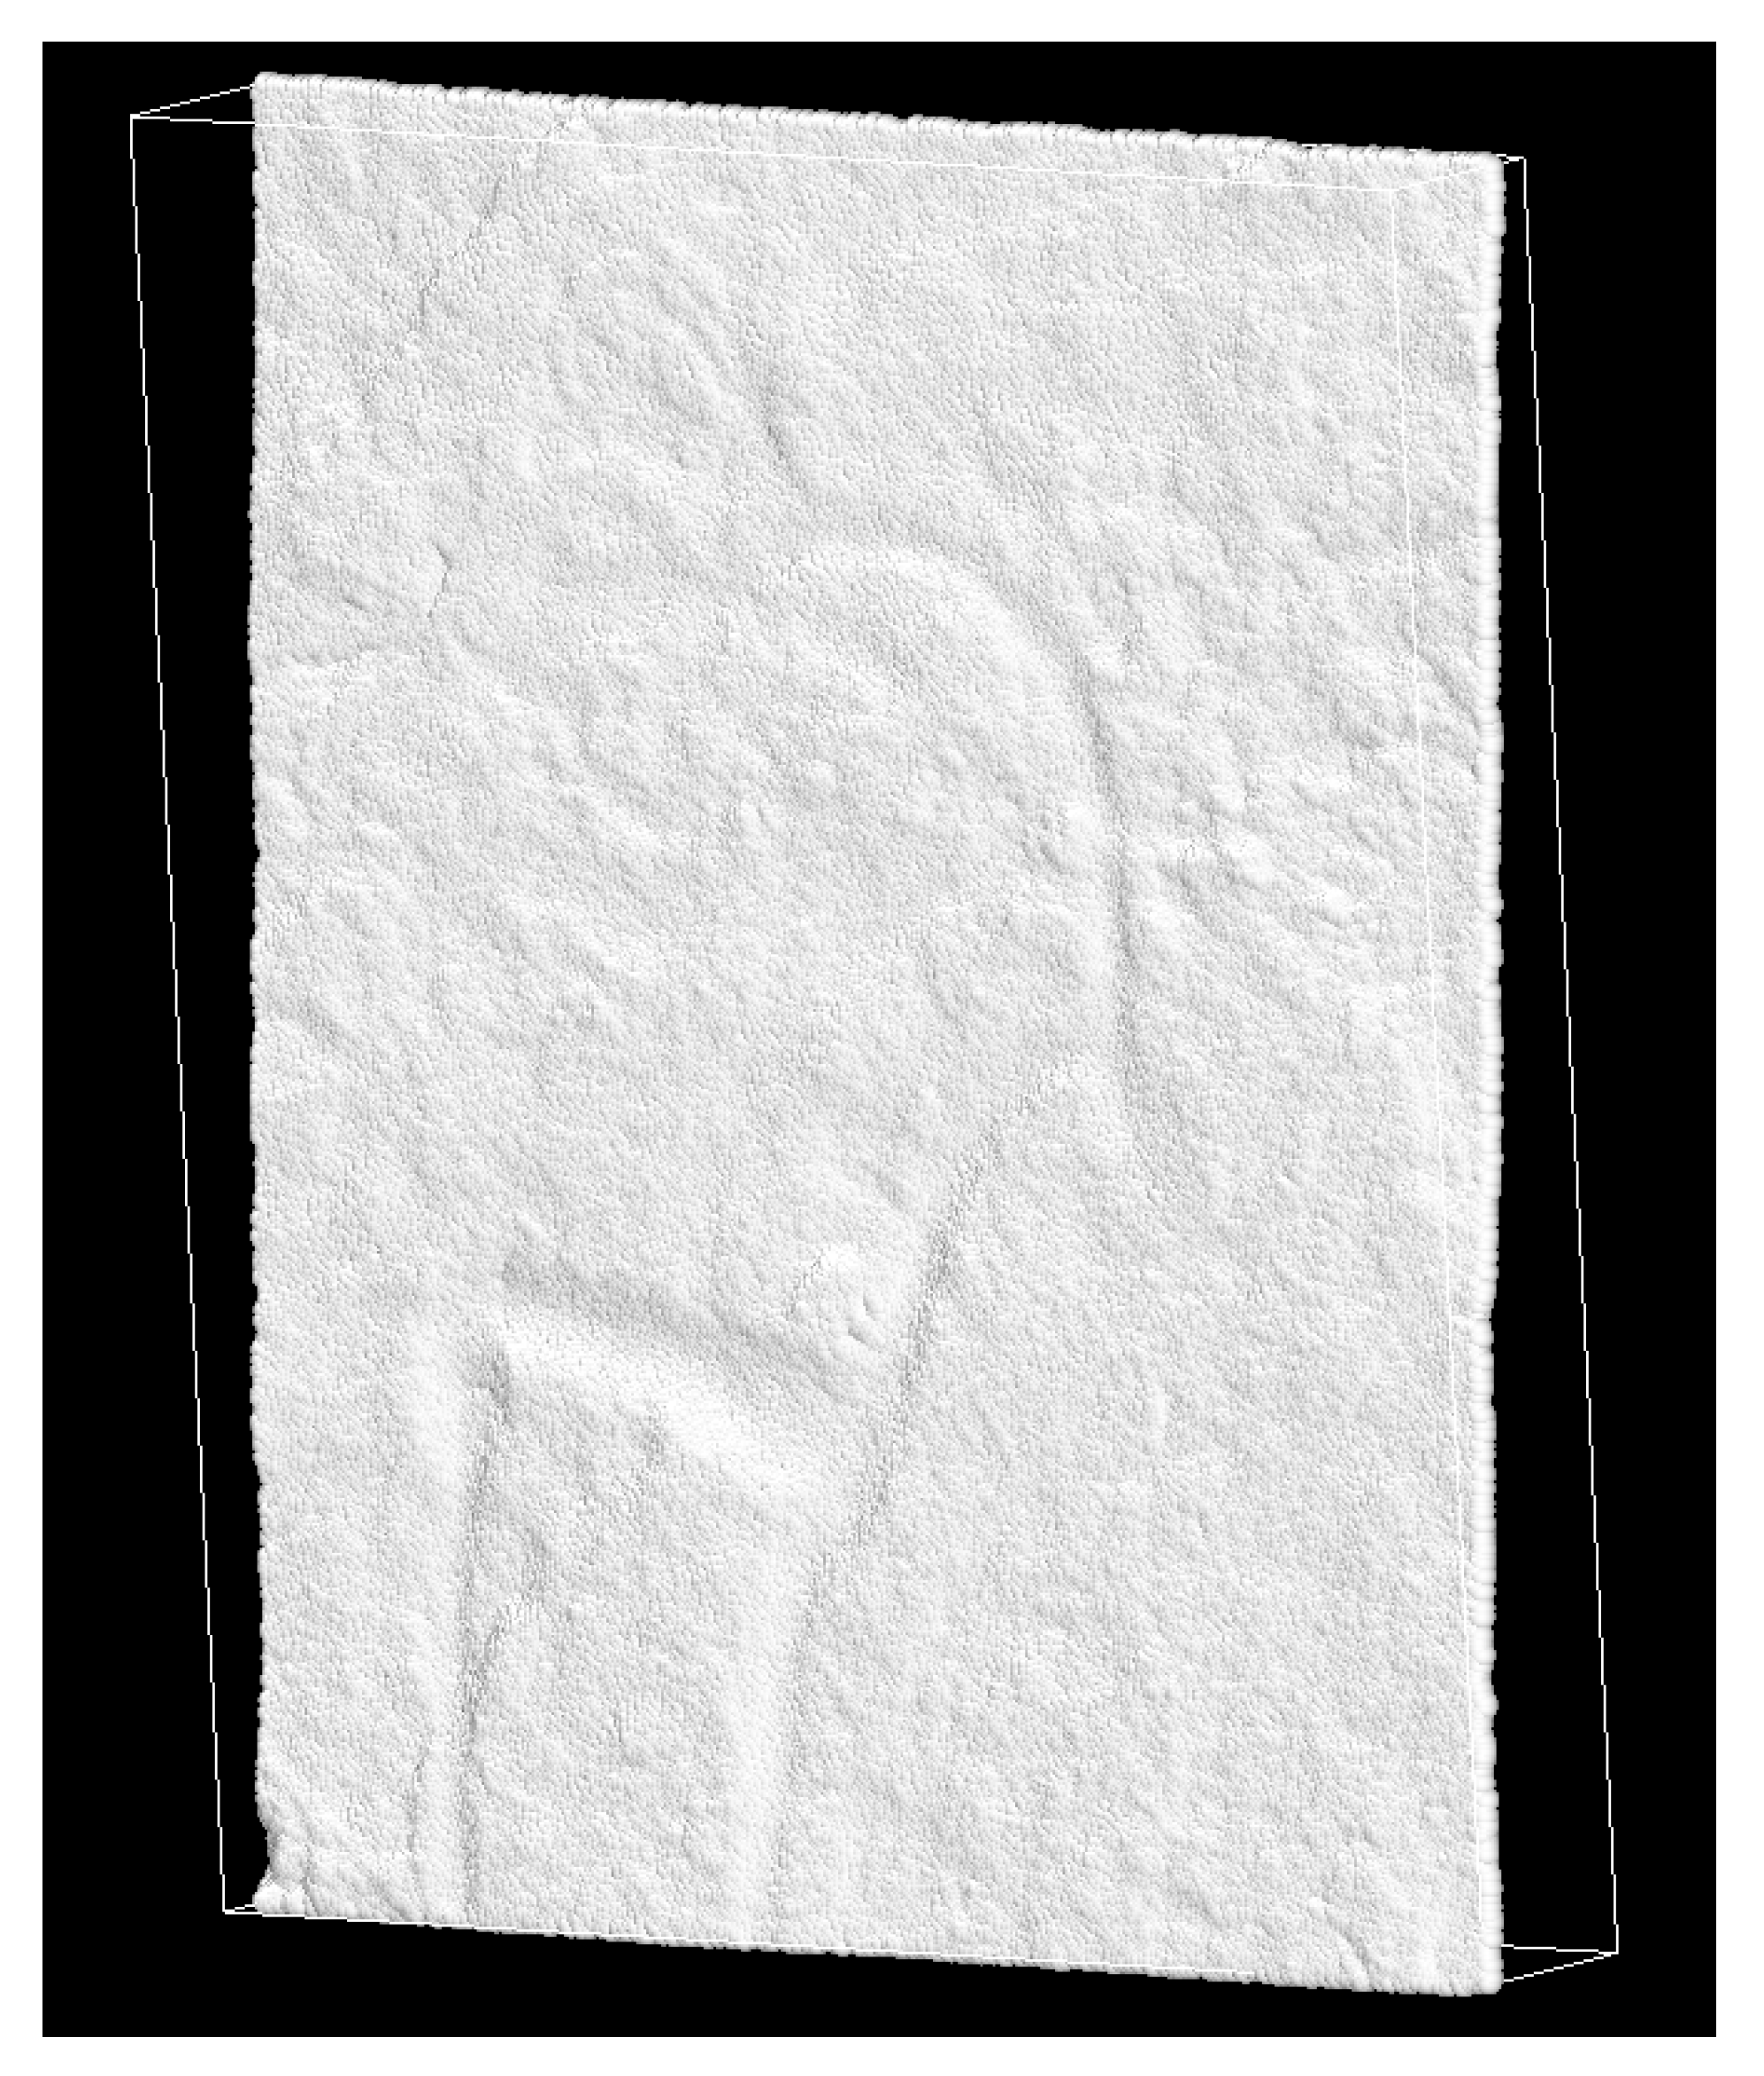
5.3. Matrix Transformations
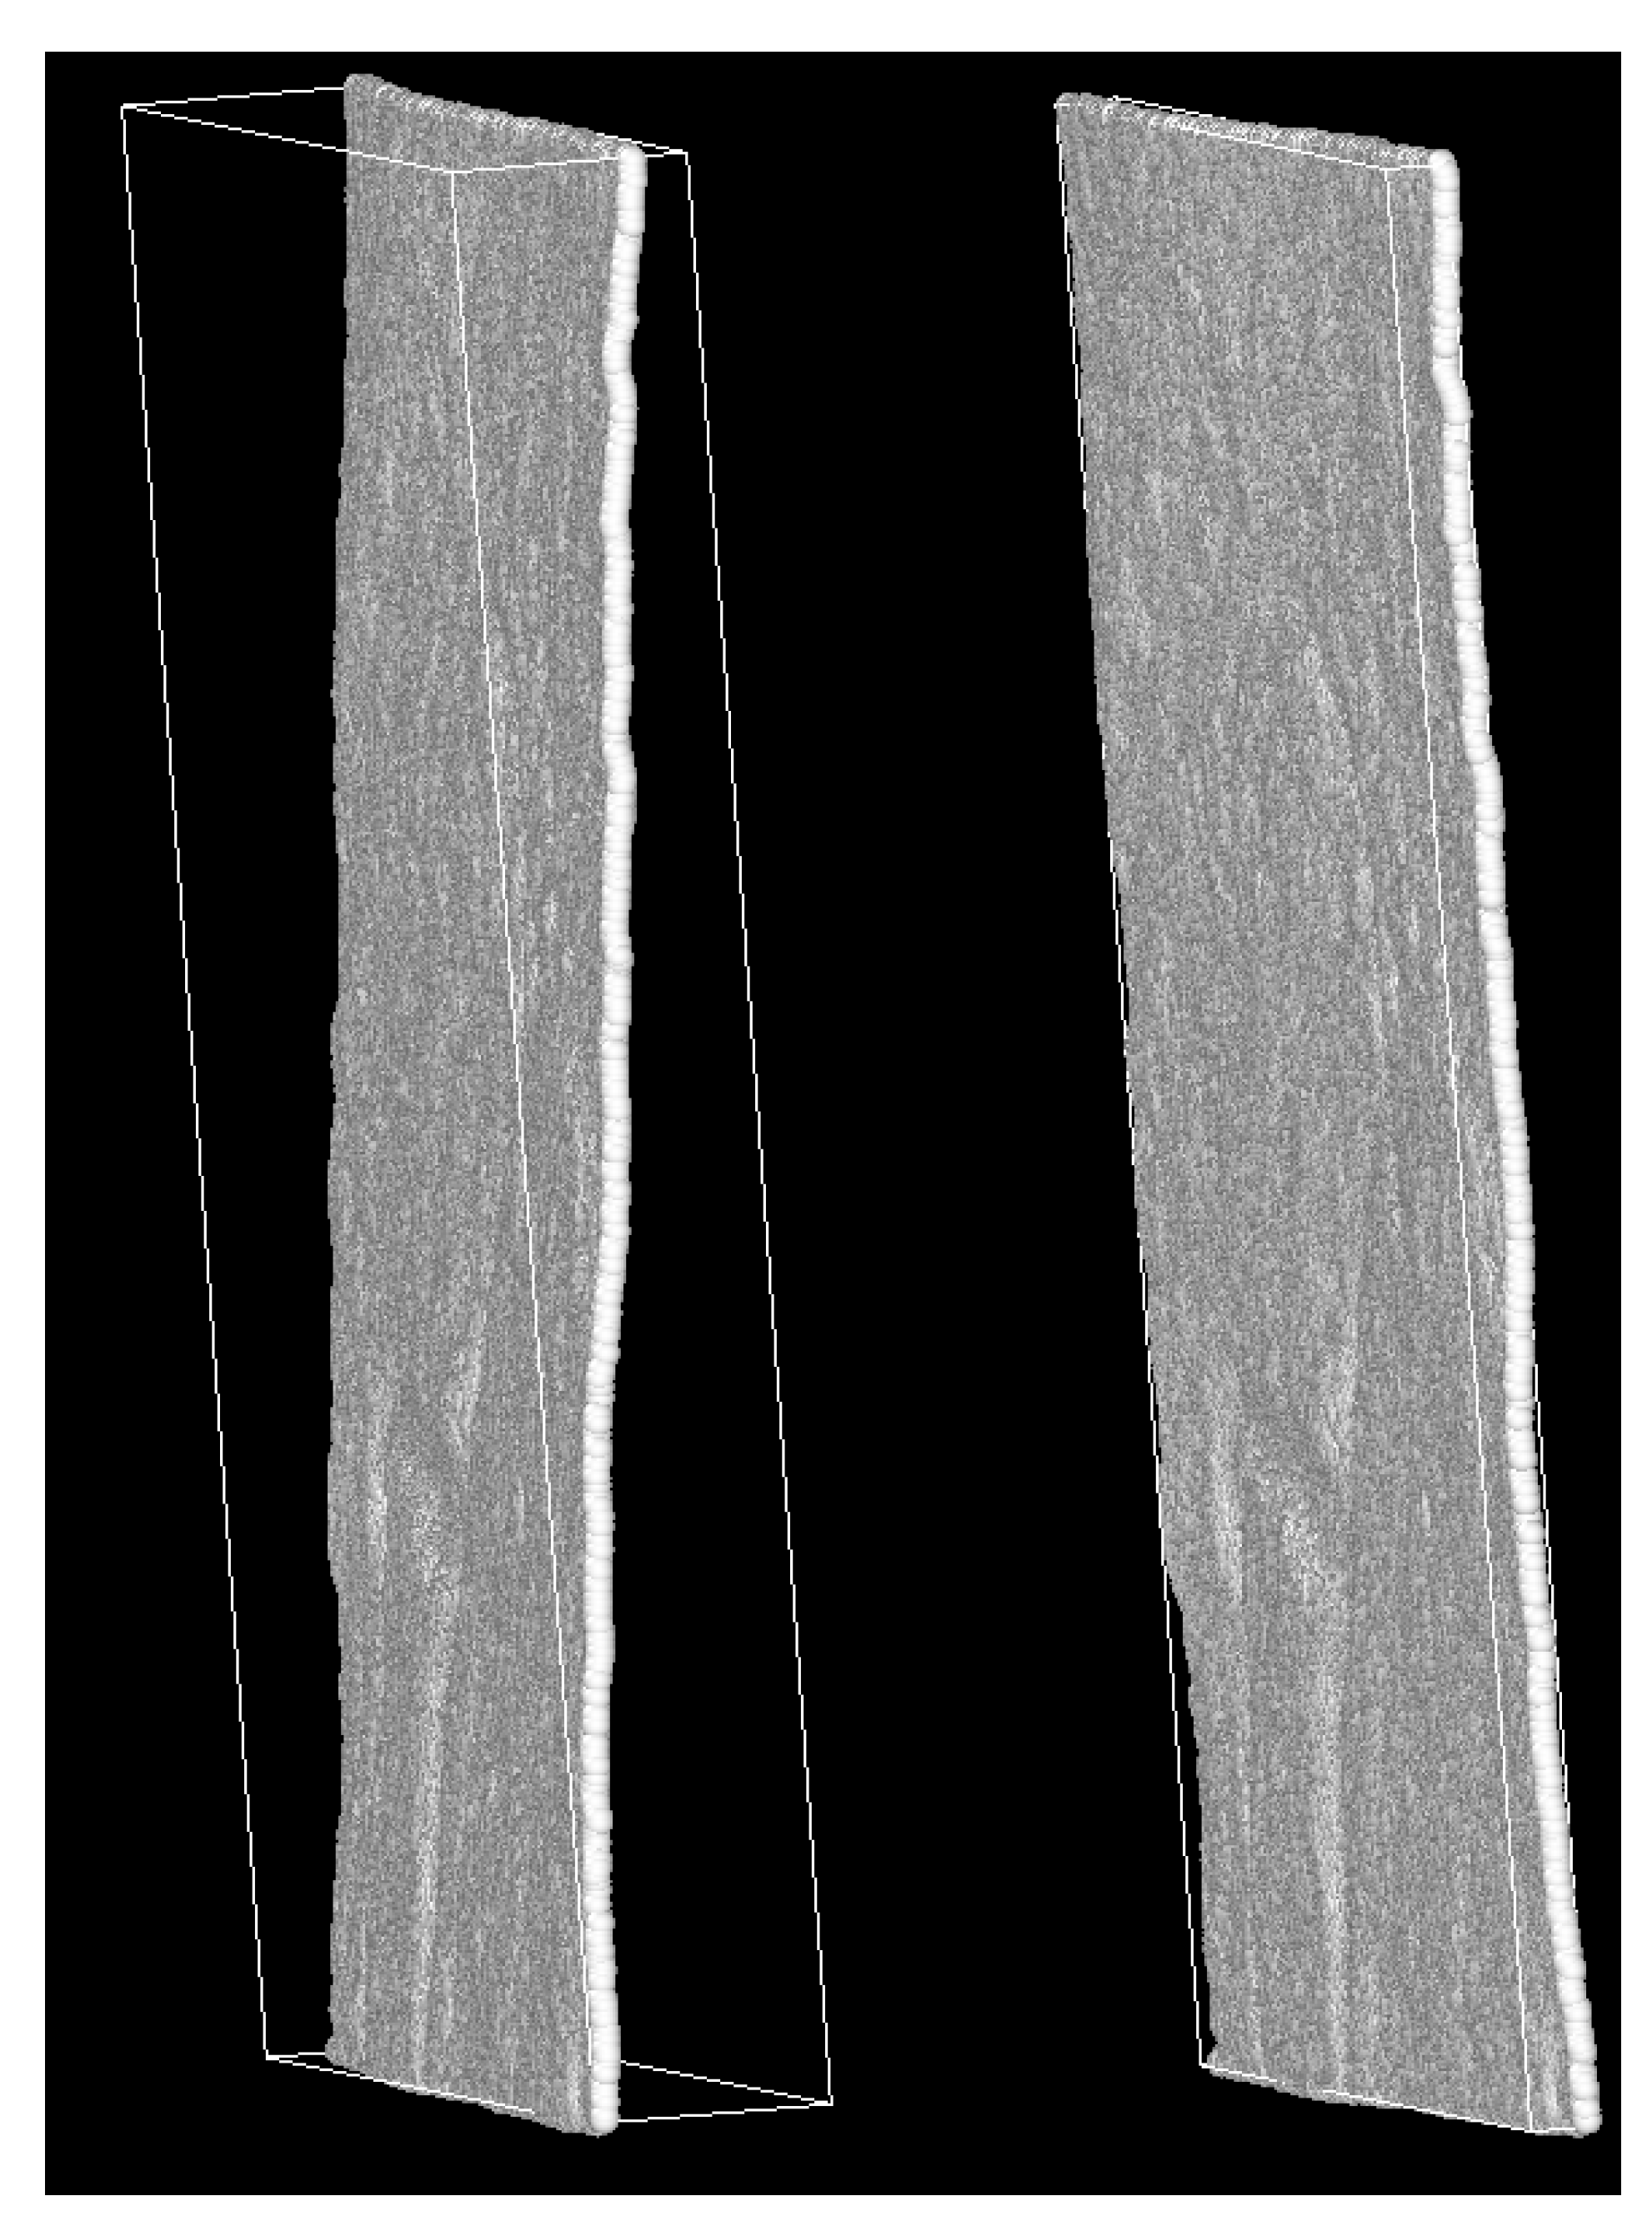
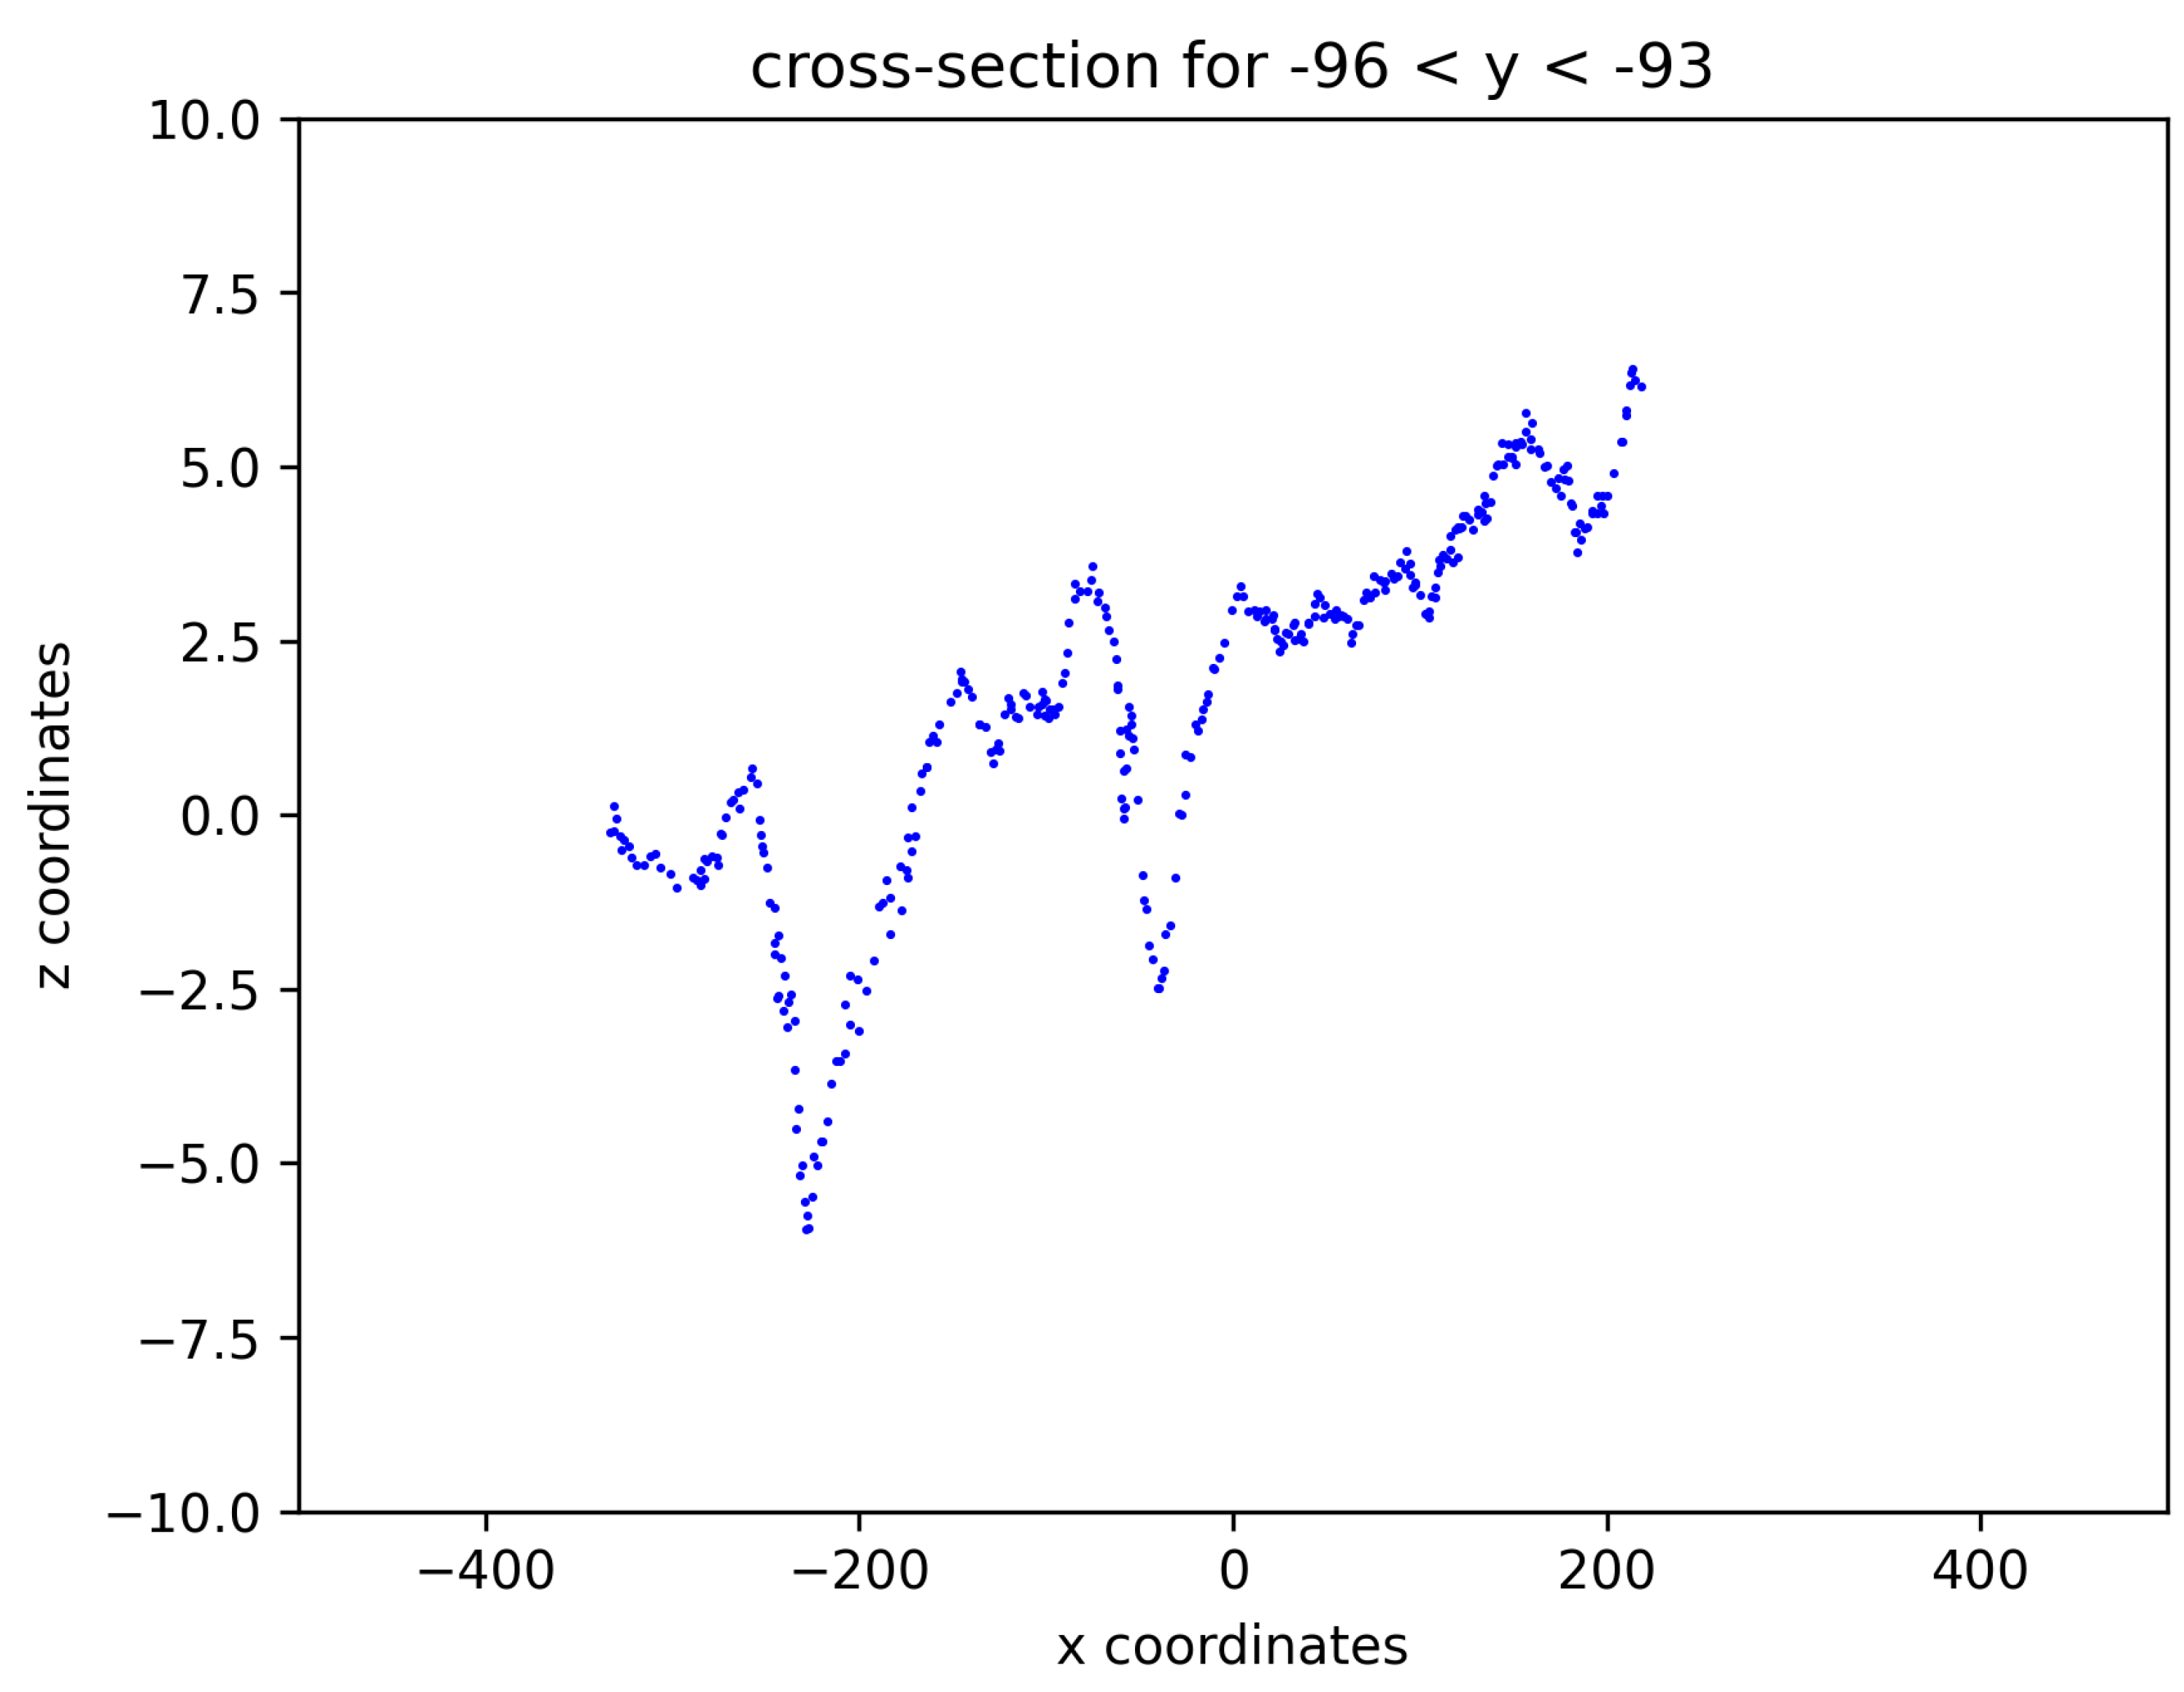
5.4. Cross-Section
5.5. Searching Minimum
5.6. Pattern Removal
6. Discussion
- 3D scanning poses no risk to scanned objects. 3D scanners look like cameras and the equipment never touches the object or emits harmful radiation. This technology deserves the name of a fully non-invasive method of examining historic buildings.
- 3D scanning offers an extremely accurate representation of the object. Mapping unusual and complex shapes with the help of documentation made by hand would be impossible. In addition, 3D scanners are able to document the colours and textures of the scanned surfaces, which makes them useful also in the case of the presence of paint layers, which is very important in the case of petroglyphs.
- While scanning petroglyphs, data related to the surrounding space, e.g., the shape of rocks, is simultaneously collected [20].
- 3D scanning is fast and efficient, especially compared to traditional measurement and documentation methods. Making a 3D model of a petroglyph, without laser scanning, but only on the basis of photos and traditional measurements, also involves a huge expenditure of time and work. However, the time needed to obtain a point cloud of even a very complex object is several minutes [21,22].
- 3D scanning of petroglyphs is considered to be the most accurate monument recording technology that we can create today.
- Virtual objects can be used as exhibits to create virtual museums. These types of exhibitions are increasingly used in the field of museology.
- 3D scans of monuments and cultural heritage are an invaluable aid for museums that want to present their exhibits online. Regardless of their command of the relevant language or their knowledge, recipients can discover the common cultural heritage in an interesting and modern way from anywhere in the world.
- Digital mapping of historic objects also gives the opportunity to assess the level of their damage. This may prove invaluable especially in the case of monuments that have been destroyed or devastated.
- The 3D scans were suitable for further processing and were not rejected by the software due to too many errors.
- Processing data from a point cloud to obtain a mesh model of a petroglyph using Artec Studio 12 is a time-consuming operation and requires quite a lot of computing power [23].
- The model highlighting algorithm can be used for preparatory operations, e.g., before 3D printing. It allows to better visualise the pattern in the digital model.
7. Conclusions
Author Contributions
Funding
Institutional Review Board Statement
Informed Consent Statement
Data Availability Statement
Conflicts of Interest
References
- Beckensall, S.; Laurie, T. Prehistoric Rock Art of County Durham, Swaledale and Wensleydale, 1st ed.; CBD: Beckenham, UK, 1998. [Google Scholar]
- Beckensall, S.; Laurie, T. Prehistoric Rock Art in Northumberland, 1st ed.; CBD: Beckenham, UK, 2001. [Google Scholar]
- Hawass, Z. International Journal of Cultural Property 4.1. In The Egyptian Monuments: Problems and Solutions; UNESCO: Paris, France, 2007; pp. 154–196. [Google Scholar]
- Hawass, Z. Can the Sphinx Be Saved? Archaeology 1994, 47, 42–43. [Google Scholar]
- Amenta, N. Surface Reconstruction Encyclopedia of Algorithms; Springer: New York, NY, USA, 2008; pp. 1–5. [Google Scholar]
- Ronald, M. The Prehistoric Rock Art of Galloway and the Isle of Man, 1st ed.; Blandford Press: London, UK, 1979. [Google Scholar]
- Kęsik, J.; Montusiewicz, J.; Żyła, K. Low-cost 3D Scanning Methods as Tools for Virtual Heritage Expositions. Meas. Autom. Control 2014, 60, 664–667. [Google Scholar]
- Pereira, F.G.; Martínez, J.C.; Lourenço, A.B. Virtual Restoration of a XVIII Century Sculpture. Res. Cent. Sci. Technol. Arts 2009, 3, 4–13. [Google Scholar]
- Castango, R. Il Restauro si fa in 3D Fablab di Parma: “Le Imprese ci Aiutino”. La Rivoluzione Dello Spazio 3D. 2015. Available online: http://parma.repubblica.it (accessed on 29 October 2021).
- Kęsik, J.; Montusiewicz, J.; Kayumov, R. An approach to computer-aided reconstruction of museum exhibits. Adv. Sci. Technol. Res. J. 2017, 11, 87–94. [Google Scholar] [CrossRef] [Green Version]
- Zeppelzauer, M.; Georg, P.; Seidl, M.; Reinbacher, C.; Schulter, S.; Breiteneder, C.; Bischof, H. Interactive 3D Segmentation of Rock-Art by Enhanced Depth Maps and Gradient Preserving Regularization. J. Comput. Cult. Herit. 2016, 9, 19. [Google Scholar] [CrossRef]
- Hedman, F. Improved Visualization of Rock Carvings. Bachelor’s Thesis, Uppsala University, Uppsala, Sweden, 30 November 2016. [Google Scholar]
- Horn, C.; Pitman, D.; Potter, R. An evaluation of the visualisation and interpretive potential of applying GIS data processing techniques to 3D rock art data. J. Archaeol. Sci. Rep. 2019, 27, 13. [Google Scholar] [CrossRef]
- Comes, R.; Buna, Z.; Badiu, I. Creation and Preservation of Digital Cultural Heritage Journal of Ancient History and Archeology. World Sci. Publ. 2008, 1, 150–156. [Google Scholar]
- Berndt, R.; Buchgraber, G.; Havemann, S.; Settgast, V.; Fellner, D. Publishing Workflow for Cultural Heritage Artifacts from 3D Reconstruction to Internet Presentation. In Digital Heritage, Proceedings of the Euro-Mediterranean Conference, Lemessos, Cyprus, 8–13 November; Springer: Berlin/Heidelberg, Germany, 2010; pp. 166–178. [Google Scholar]
- Li, R.; Luo, T.; Zha, H. 3D Digitization and Its Applications in Cultural Heritage. In Digital Heritage, Proceedings of the Euro-Mediterranean Conference, Lemessos, Cyprus, 8–13 November; Springer: Berlin/Heidelberg, Germany, 2010; pp. 381–388. [Google Scholar]
- Pavlidis, G.; Koutsoudis, A.; Arnaoutoglou, F.; Tsioukas, V. Methods for 3D Digitization of Cultural Heritage. J. Cult. Herit. 2007, 8, 93–98. [Google Scholar] [CrossRef] [Green Version]
- Stukowski, A. Visualization and analysis of atomistic simulation data with OVITO—The Open Visualization Tool. Model. Simul. Mater. Sci. Eng. 2010, 18, 015012. [Google Scholar] [CrossRef]
- Sitnik, R.; Mączkowski, G.; Krzesłowski, J. Calculation Methods for Digital Model Creation Based on Integrated Shape, Color and Angular Reflectivity Measurement; Springer: Berlin/Heidelberg, Germany, 2010; pp. 13–27. [Google Scholar]
- Toshew, Y.E.; Hieu, L.C.; Stefanova, L.P.; Tosheva, E.Y.; Zlatov, N.B.; Dimov, S.T. Reverse Engineering and Rapid Prototyping for new orthotic devices. In Intelligent Producion Machines and Systems; Elsevier: Amsterdam, The Netherlands, 2005. [Google Scholar]
- Montusiewicz, J.; Milosz, M.; Kayumov, R. 3D digital technologies in the practical training of archaeologists. In Proceedings of the 10th International Technology, Education and Development Conference (INTED 2016), Valencia, Spain, 7–9 March 2016; pp. 7451–7460. [Google Scholar]
- Liy, Y.; Pottmann, H.; Wang, W. Constrained 3D shape reconstruction using a combination of surface fitting and registration. Comput. Aided Des. 2006, 38, 572–583. [Google Scholar] [CrossRef]
- Raja, V.; Fernandes, K.J. Reverse Engineering. In An Industrial Perspective; Springer: London, UK, 2008. [Google Scholar]
- Montusiewicz, J.; Czyż, Z.; Kayumov, R. Selected methods of making three-dimensional virtual models of museum ceramic objects. Appl. Comput. Sci. 2015, 11, 51–65. [Google Scholar]
- Patay-Horvath, A. The virtual 3D reconstruction of the east pediment of the temple of Zeus at Olympia an old puzzle of classical archaeology in the light of recent technologies. Digit. Appl. Archaeol. Cult. Herit. 2014, 1, 12–22. [Google Scholar] [CrossRef]
- Ramandeep, S.; Ashish, S.; Sneh, A.; Britty, B. Validation of reverse-engineered and additive-manufactured microsurgical instrument prototype. Surg. Innov. 2016, 23, 606–612. [Google Scholar]


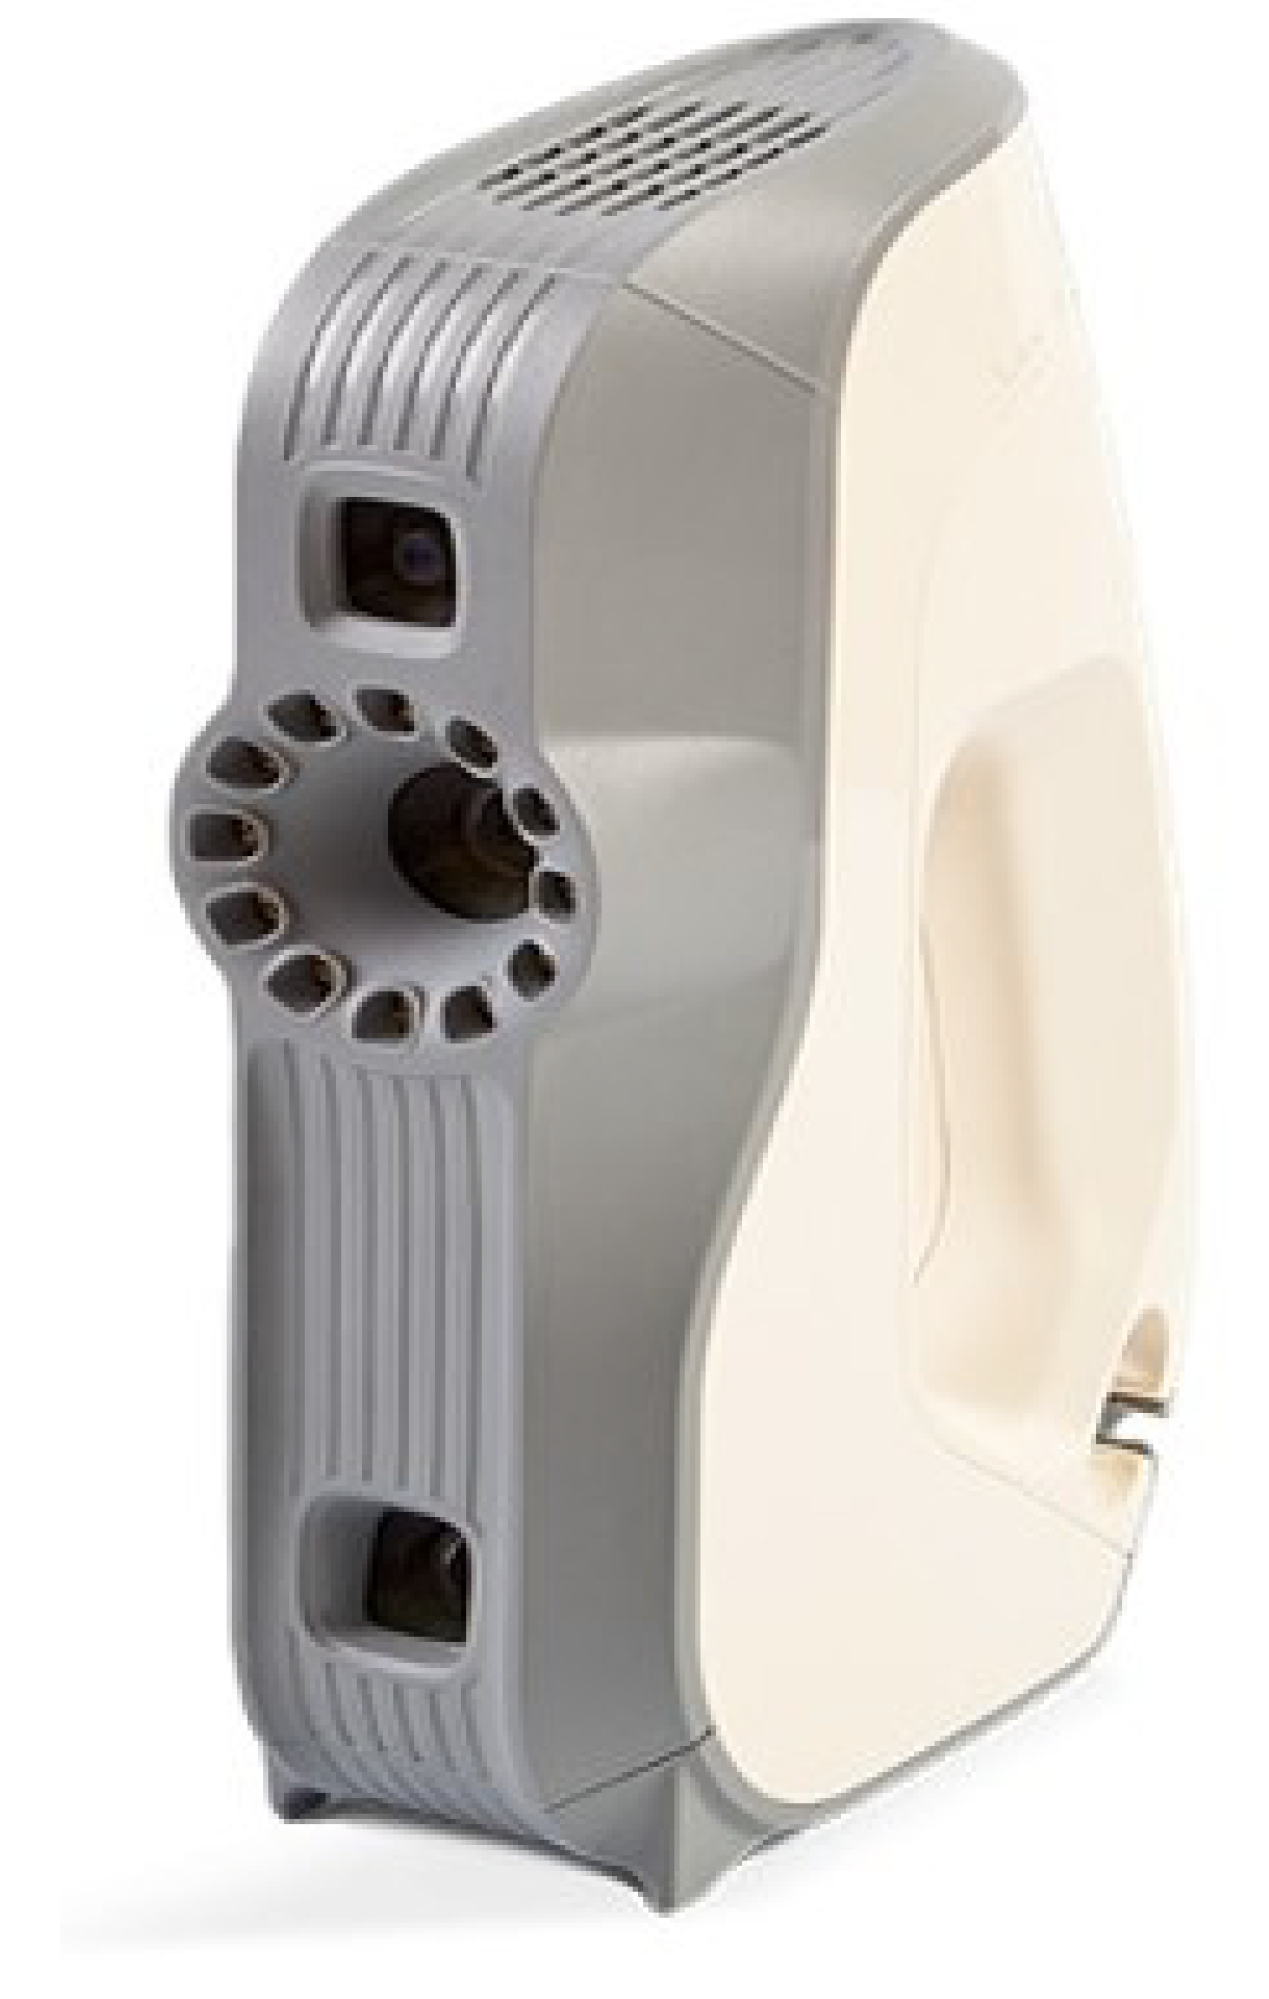
| General Specification | Artec EVA |
|---|---|
| Working distance | 0.4–1 m |
| Measurement area volume | 61,000 cm³ |
| Linear field of view H × W (min) | 214 mm × 148 mm |
| Linear field of view H × W (max) | 536 mm × 371 mm |
| Angular field of view H × W | 30° × 21° |
| 3D resolution, up to | 0.5 mm |
| Accuracy of the 3D point, to | 0.1 mm |
| 3D accuracy at a distance, up to | 0.03 % at 1 m |
| Ability to Capture Texture | Yes |
| Texture Resolution | 1.3 mp |
| Colours | 24 bpp |
| Reconstruction 3D, up to | 16 fps |
| Data download speed, up to | 2 million points per second |
| Structured light source | flash bulb (without laser) |
Publisher’s Note: MDPI stays neutral with regard to jurisdictional claims in published maps and institutional affiliations. |
© 2022 by the authors. Licensee MDPI, Basel, Switzerland. This article is an open access article distributed under the terms and conditions of the Creative Commons Attribution (CC BY) license (https://creativecommons.org/licenses/by/4.0/).
Share and Cite
Wojcicki, P.; Korga, S.; Milosz, M. Preliminary Application of the Algorithm Highlighting Petroglyph Patterns. Appl. Sci. 2022, 12, 1660. https://doi.org/10.3390/app12031660
Wojcicki P, Korga S, Milosz M. Preliminary Application of the Algorithm Highlighting Petroglyph Patterns. Applied Sciences. 2022; 12(3):1660. https://doi.org/10.3390/app12031660
Chicago/Turabian StyleWojcicki, Piotr, Sylwester Korga, and Marek Milosz. 2022. "Preliminary Application of the Algorithm Highlighting Petroglyph Patterns" Applied Sciences 12, no. 3: 1660. https://doi.org/10.3390/app12031660
APA StyleWojcicki, P., Korga, S., & Milosz, M. (2022). Preliminary Application of the Algorithm Highlighting Petroglyph Patterns. Applied Sciences, 12(3), 1660. https://doi.org/10.3390/app12031660