Abstract
Automatic clustering problems require clustering algorithms to automatically estimate the number of clusters in a dataset. However, the classical K-means requires the specification of the required number of clusters a priori. To address this problem, metaheuristic algorithms are hybridized with K-means to extend the capacity of K-means in handling automatic clustering problems. In this study, we proposed an improved version of an existing hybridization of the classical symbiotic organisms search algorithm with the classical K-means algorithm to provide robust and optimum data clustering performance in automatic clustering problems. Moreover, the classical K-means algorithm is sensitive to noisy data and outliers; therefore, we proposed the exclusion of outliers from the centroid update’s procedure, using a global threshold of point-to-centroid distance distribution for automatic outlier detection, and subsequent exclusion, in the calculation of new centroids in the K-means phase. Furthermore, a self-adaptive benefit factor with a three-part mutualism phase is incorporated into the symbiotic organism search phase to enhance the performance of the hybrid algorithm. A population size of was used for the symbiotic organism search (SOS) algorithm for a well distributed initial solution sample, based on the central limit theorem that the selection of the right sample size produces a sample mean that approximates the true centroid on Gaussian distribution. The effectiveness and robustness of the improved hybrid algorithm were evaluated on 42 datasets. The results were compared with the existing hybrid algorithm, the standard SOS and K-means algorithms, and other hybrid and non-hybrid metaheuristic algorithms. Finally, statistical and convergence analysis tests were conducted to measure the effectiveness of the improved algorithm. The results of the extensive computational experiments showed that the proposed improved hybrid algorithm outperformed the existing SOSK-means algorithm and demonstrated superior performance compared to some of the competing hybrid and non-hybrid metaheuristic algorithms.
1. Introduction
Data clustering is an aspect of data mining where knowledge discovery from data requires that the data reveals the existing groups within itself. In cluster analysis, objects are grouped such that the intra-cluster distances among data objects are minimized while the inter-cluster distances are maximized. K-means is one of the most popular traditional clustering algorithms used for cluster analysis, due to its efficiency and simplicity. The k-means algorithm randomly selects a specified k number of initial cluster centroids as a representative center of each group. It then assigns data objects to their nearest cluster, based on the sum of squares point to nearest centroid distance. The mean of each cluster is calculated to generate an initial cluster with an updated cluster centroid. These data object assignment and centroid update processes are iteratively repeated until an optimum cluster solution is obtained. The need to specify the number of clusters a priori makes the K-means algorithm unsuitable for automatic clustering. According to [1], estimating the optimal number of clusters in a dataset is a fundamental problem in cluster analysis, referred to as ‘automatic clustering’. In most cases, K-means is hybridized with metaheuristic algorithms for automatic clustering [2].
The standard K-means algorithm is sensitive to noisy data and outliers [3,4]. Intuitively, the data points that are far away from their nearest neighbors are described as outliers [5]. The sensitivity of K-means to noise and outliers comes from the least square optimization procedure, normally employed for cluster analysis. K-means’ reliance on the outlier-sensitive statistics (mean) for cluster updates compromises the clustering results when outliers are present in datasets. Several proposals have been reported in the literature that add a separate module for detecting and removing outliers as a data pre-processing step embedded in the K-means algorithm, before the actual data clustering procedure. A separate module for outlier detection significantly compromises the efficiency of the K-means algorithm. Chawla and Gionis [6] proposed an algorithm that simultaneously detected and removed outliers from the dataset during the clustering process, eliminating the need for a separate module. Their algorithm incorporated outlier detection into the K-means algorithm without complicated modification to the standard algorithm. However, their algorithm required specifying the desired number of outliers within the dataset, like how the desired number of clusters had to be specified. Olukanmi et al. [7] proposed a K-means variant for automatic outlier detection with the automatic specification of the number of clusters via Chebyshev-type inequalities. This paper incorporated this automatic detection and exclusion of outliers in the centroid update process of the standard K-means section of SOSK-means for a more robust hybridized algorithm.
The symbiotic organisms search (SOS) algorithm is a nature-inspired metaheuristic algorithm proposed by [8]. The algorithm has no basic control algorithm-specific parameter in its initialization stage. It works similarly to other well-known metaheuristic algorithms, such as the genetic algorithm (GA), the particle swarm optimization (PSO) algorithm, and the firefly algorithm (FA). The algorithm is inspired by the symbiotic relationships among organisms in a natural habitat, necessary to their survival in the ecosystem. The three symbiotic relationships (mutualism, commensalism, and parasitism) are modeled to find optimal solutions to optimization problems. As a population-based algorithm, the first two phases (mutualism and commensalism) use the best solution to exploit the population information in searching for potential solutions. The parasitism phase creates new solutions by modifying the existing solution, while, at the same time, removing inferior solutions [9]. The SOS algorithm is rated among the most competitive swarm intelligence-based metaheuristic algorithms for solving optimization algorithms, based on its simplicity and parameter-less attributes. SOS has been used to find the solution to many different real-world problems [10,11,12,13,14,15,16]. Tejani et al. [17] introduced a parameter setting of the beneficial factor, based on the normalized value of organisms, to create an adaptive SOS algorithm for structural optimization problems. A discrete version of SOS was designed and implemented by [18] for task scheduling in a cloud computing environment. Cheng, Prayogo and Tran [11] introduced another discrete SOS for multiple resources leveling optimization. Panda and Pani [10] introduced multi-objective SOS for handling multi-objective optimization problems. Kawambwa et al. [12] proposed a cloud-based model SOS using cloud-based theory to generate random number operators in the mutualism phase for power system distributed generators. Mohammadzadeh and Gharehchopogh [19] proposed three variants of SOS to solve the feature selection challenge, and Cheng, Cao, and Herianto [14] proposed an SOS optimized neural network–long short-term memory for obtaining hyperparameters of the neural network and long short-term memory for the establishment of a robust hybridization model for cash flow forecasting.
SOS has also been employed in solving automatic clustering problems [20,21,22,23,24,25]. Boushaki, Bendjeghaba, and Kamel [20] proposed a biomedical document clustering solution using accelerated symbiotic organisms search, which required no parameter tuning. Yang and Sustrino [25] proposed a clustering-based solution for high-dimensional optimization problems using SOS with only one control parameter. Chen, Zhang, and Ning proposed an adaptive clustering-based algorithm using SOS for automatic path planning of heterogeneous UAVs [22]. Zainal and Zamil [23] proposed a novel solution for software module clustering problems using a modified symbiotic organism search with levy flights. The effectiveness of the SOS algorithm in solving automatic clustering problems was demonstrated by [21], where the SOS algorithm was used in clustering different UCI datasets. SOS has been hybridized with other metaheuristic algorithms for performance enhancement in cluster analysis. Rajah and Ezugwu [24] combined the SOS algorithm with four different metaheuristic algorithms to solve the automatic clustering problem and compared the clustering performances of each hybrid algorithm. Our earlier work combined the SOS algorithm with K-means to boost the traditional clustering algorithm’s performance for automatic clustering [26].
However, SOS exhibits some limitations, such as slow convergence rate and high computational complexity [17,26,27,28]. Modifications have been made to the standard SOS to improve its performance. Tejani, Savsani and Patel [17] introduced adaptive benefit factors to the classical SOS algorithm, proposing three modified variants of SOS for improved efficiency. Adaptive benefit factors and benefit factors were effectively combined to achieve a good exploration–exploitation balance in the search space. Nama, Saha, and Ghosh [27] introduced a random weighted reflective parameter, to enhance searchability within the additional predation phase, to the classical SOS algorithm to improve the solving of multiple complex global optimization problems and improve the algorithm’s performance. Secui [29] sought to improve the algorithm’s capacity for the timely identification of stable and high-quality solutions by introducing new relations for solution updates at the mutualism and commensalism phases. A logistic map-generated chaotic component for finding promising zones was also added for the enhancement of the algorithm’s exploration capacity. The removal of the parasitism phase reduced the computational load. Nama, Saha, and Ghosh [30] combined SOS with simple quadratic interpolation (SQI) for handling large-scale and real-world problems. Although their proposed hybrid SOS algorithm increased the algorithms’ complexity, it provided an efficient and effective quality solution, with an improved convergence rate. Ezugwu and Adewumi [31] improved and extended the classical SOS using three mutation-based local search operators to improve population reconstruction, exploration, and exploitation capability and to accelerate the convergence speed. Other improvements reported in the literature include [32,33,34,35,36,37,38]. According to Chakraborty, Nama, and Saha [9], most of the proposed improvements could not guarantee finding the best optimal solution. As such, they proposed using a non-linear benefit factor where the mutual vector was calculated, based on the weights of two organisms for a broader and more thorough search. They also altered the parasitism phase to reduce the computational burden of the algorithm.
This paper proposes an improved version of the hybrid SOSK-means algorithm [24], called ISOSK-means, to address the common limitations of the individual classical algorithms and their hybridization variants for a more robust, efficient, and stable hybrid algorithm. The algorithm adopted a population size of for a well distributed initial population sample, based on the assumption that selecting the right sample size produces a sample mean that approximates the true centroid on Gaussian distribution [39]. This ensured a substantially large population size at each iteration for early convergence in the SOS phase of the hybrid algorithm. The modified algorithm also employed a global threshold of point-to-centroid distance distribution in the K-means algorithm phase to detect outliers for subsequent exclusion in calculating the new centroids [3]. The detection and exclusion of outliers in the K-means phase assisted in improving the cluster result. The performance of the SOS algorithm was enhanced by introducing self-adaptive benefit factors, with a three-part mutualism phase, as suggested in [28]. These techniques enhanced the search for the optimum centroids in the solution space and improved the convergence rate of the hybrid algorithm. The performance of the proposed algorithm was evaluated on 42 datasets with varying sizes and dimensions. Davies Bouldin (DB) index [40] and cluster separation (CS) index [41] were used as cluster validity indices for evaluating the performance of the algorithm. The choice of the two clustering validity indices was based on the duo’s cluster validity approach of minimizing the intra-cluster similarity and maximizing the inter-cluster similarity, which is the same as the primary objective of data clustering. The CS index was only applied to 12 datasets for comparison with the classical version of the improved hybrid algorithm. The two indices, based on their validity approach, are credited with the ability to produce clusters that are well separated, with the minimum intra-cluster distance and maximum inter-cluster distance [42,43,44]. The DB index can guide the clustering algorithm using a partitioning approach without the need to specify the number of clusters, and the CS index is known for its excellent performance in the identification of clusters with varying densities and sizes [40,41,43]. The enhanced outcomes were compared with the existing hybrid SOSK-means algorithm and other comparative non-hybrid and hybrid metaheuristic algorithms on large dimensional datasets. The performance of the proposed improved hybrid algorithm was further validated using the nonparametric Friedman mean rank tests and Wilcoxon signed-rank statistical tests. The results of the extensive computational experiments showed that the proposed improved hybrid algorithm (ISOSK-means) outperformed the existing SOSK-means algorithm, and demonstrated superior performance over some of the competing hybrid and non-hybrid metaheuristic algorithms. The main contributions of this paper are as follows:
- Integration of a robust module in the proposed SOS-based K-means hybrid algorithm using outlier detection and the exemption technique in the K-means phase for a more effective cluster analysis with compact clusters.
- Integration of a three-part mutualism phase with a random weighted reflection coefficient into the SOS phase, for a more productive search in the solution space for early convergence and reduced computational time.
Adopting a population size of for a well-distributed initial population in the SOS phase, allowing for a large enough solution space per iteration, aimed to ensure early convergence of the proposed clustering algorithm.
The remaining sections of this paper are organized as follows. Section 2 presents related work on hybrid algorithms involving SOS and K-means. It also includes a brief introduction to the standard K-means algorithm, standard SOS algorithm and hybrid SOSK-means. Section 3 describes the improvements integrated into the K-means and SOS algorithms and presents the description of the proposed ISOSK-means. The simulation and comparison of results of the proposed ISOSK-means are presented in Section 4, while Section 5 presents the concluding remarks and suggestions for future directions.
2. Related Work
There are existing works in the literature that reported hybridizations involving either K-means or symbiotic organism search or both. However, it is worth stating here that hybridizations for clustering problems are few. In [45], the SOS algorithm was hybridized with the improved opposition-based learning firefly algorithm (IOFA) to improve the exploitation and exploration of IOFA. SOS was combined with differential evolution (DE) in [46] to improve the convergence speed and optimal solution quality of shape and size truss structure optimization in engineering optimization problems. The conventional butterfly optimization algorithm (BOA) was combined with the first two phases of the SOS for enhancement of global and local search behavior of the BOA. In [47], a modified strategy of SOS was hybridized with the mutation strategy of the DE to ensure the preservation to the SOS local search capability, while maintaining its ability to conduct global search. Other reported hybrids involving SOS include the following: Ref. [48] combined GA, PSO and SOS algorithms for continuous optimization problems; Ref. [24] reported four hybrid algorithms for automatic clustering, combining SOS with FA, for teaching–learning based optimization (TLBO), DE, and PSO algorithms. Other hybridization algorithms involving SOS can be found in the review work on SOS algorithms conducted by [49].
Several hybridizations involving K-means with other metaheuristic algorithms were reported in the review work presented by [2]. Recent hybridizations involving K-means include the following: Ref. [50] combined GA with K-means and support vector machine (SVM) for automatic selection of optimized cluster centroid and hyperparameters tunning; Ref. [51] combined multi-objective individually directional evolutionary algorithm (IDEA) with K-means for multi-dimensional medical data modeling using fuzzy cognitive maps; Ref. [52] presented an hybrid of K-means with PSO for semantic segmentation of agricultural products; Ref. [53], combined K-means algorithm with particle swarm optimization for customer segmentation.
For hybridization involving SOS and K-means, as mentioned earlier, the reported literature works are very minimal showing that research in this aspect is still shallow. In [25], a clustering-based SOS for high-dimensional optimization problems was proposed, combining an automatic K-means with symbiotic organism search for efficient computation and better searching quality. The automatic K-means was used to generate subpopulations for the SOS algorithm to create a sub-ecosystem that made the combination of global and local searches possible. The mutualism and commensalism phases formed the local search, where solutions were allowed to interact within each cluster. For the global search, only best solutions from each cluster were allowed to interact across the clusters under the parasitism phase. In this case, the K-means algorithm was used as a pre-processing phase for the SOS algorithm to enhance its performance in finding solutions to high dimensional optimization problems. In [26], the standard algorithms SOS and K-means were combined to solve automatic clustering problems. The SOS phase resolved the initialization challenge for the K-means algorithm by automatically determining the optimum number of clusters and generating the corresponding initial cluster centers. This ensured the K-means algorithm avoided the possibility of local optimum convergence while improving the cluster analysis capability of the algorithm. However, the problem of low convergence persisted in the hybrid algorithm.
In this work, we hoped to further improve on the clustering performance of the previous SOS-based K-means hybrid algorithm in [26] for automatic clustering of high-dimensional datasets, by incorporating some improvements into each of the standard algorithms, SOS and K-means, so as to achieve better convergence and more compact clusters.
2.1. K-Means Algorithm
The K-means algorithm is a partitional clustering algorithm that iteratively groups a given dataset X in Rd into k number of clusters such that:
based on a specified fitness function. The K-means algorithm handles the partitioning process as an optimization problem to minimize the within-cluster variance :
with cluster center uniquely defining each cluster as:
with the set of centres
representing the solution to the K-means algorithm [54].
The standard K-means algorithm involves three major phases: the initialization phase, the assignment phase, and the centroid update phase. During the initialization phase, the initial cluster centers are randomly selected to represent each cluster. This is followed by the data object assignment phase, where each data point in the dataset is then assigned to the nearest cluster, based on the shortest centroid-point distance. Each cluster centroid is then re-evaluated during the centroid update phase. The last two phases are repeated until the centroid value remains constant in consecutive iterations [44].
The K-means clustering is an NP-hard optimization problem [55], with the algorithm having a time complexity of where represents the number of data points in the dataset, represents the number of clusters, and denotes the number of iterations required for convergence. The computational complexity is a function of the size of the dataset, hence, clustering large real-world, or dynamic, datasets using the K-means algorithm incurs a sizeable computational time overhead. Moreover, the number of clusters is required to be a user-specified parameter for the K-means algorithm. In most real-world datasets, the number of clusters is not known a priori; therefore, specifying the correct number of clusters in such a dataset is arduous. Furthermore, the random selection of initial cluster centroids incurs the possibility of the algorithm getting stuck in the local optimum [54]. Based on these challenges, many variants of K-means have been proposed in the literature [2,4] to improve the performance of the K-means algorithm. One of the areas being exploited for improving the standard K-means algorithm is hybridizing K-means with metaheuristic algorithms [2].
2.2. SOS Algorithm
Cheng and Prayogo [8] proposed the concept of SOS simulating the interactive relationships between organisms in an ecosystem. In an ecosystem, most organisms do not live in isolation because they need to interact with other organisms for their survival. These relationships between organisms, known as symbiotic relationships, are, thus, defined using three possible major interactions: mutualism, commensalism, and parasitism. Mutualism represents a symbiotic relationship where the participating organisms benefit from each other. For instance, an oxpecker feeds on the parasites living on the body of a zebra or rhinoceros, while the symbiont, in turn, enjoys the benefit of pest control. Commensalism describes a relationship where only one of the participating organisms benefits from the association while the other organism does not benefit from the relationship, although it is not negatively affected either. An example of this is orchids, which grow on branches and trunks of trees to access sunlight and obtain nutrients from the branches. As a slim, tender plant, their existence does not harm the tree on which they grow. The relationship between humans and mosquitos provides a perfect scenario of the parasitism symbiotic relationship, in which one of the organisms (mosquito) benefits from the association while simultaneously causing harm to the symbiont (human). These three relationships are captured in the SOS algorithm [8]. In most cases, the type of relationship increases the fitness of benefiting organisms, giving them a long-term survival advantage.
In the SOS algorithm, the three-symbiosis relationship is simulated as the three phases of the algorithm. At the initial stage, a population of candidate solutions are randomly generated to the search space for solution representations for optimal global solution search. This set of solutions forms the initial ecosystem. where each individual candidate solution represents an organism in the ecosystem. A fitness value is associated with each organism to determine the measure of its adaptation capability with respect to the desired objective. Subsequently, each candidate solution is further updated using the three simulated symbiotic relationship phases to generate a new solution. For each phase, a new solution is only accepted if its fitness value is better than the previous one. Otherwise, the initial solution is retained. This iterative optimization process is performed until the termination criteria are met. The three simulated symbiotic relationship phases of the SOS algorithm are described below.
Given two organisms and co-existing in an ecosystem such that and represent the iterative values of the optimization, ranging from to where is the problem dimension and an organism, is randomly selected during the mutualism phase to participate in a mutual relationship with such that the two organisms enjoy a common benefit from their interaction for survival. Their interaction yields new solutions and based on Equations (7) and (8), respectively, with Equation (9) representing the mutual benefit enjoyed by both organisms.
The expression () as shown in Equations (7) and (8), represents the mutual survival efforts exhibited by each organism to remain in the ecosystem. The highest degree of adaptation achieved in the ecosystem is represented by the which acts as the target point for increasing the fitness of the two interacting organisms. Each organism’s benefit level of value 1 or 2 is randomly determined to indicate the organism’s benefit from the relationship, which can either be full or partial. This benefit level is denoted as BF (benefit factor) in the equations. The BF value is generated using Equation (10):
As stated earlier, the newly generated solutions are accepted as a replacement for the existing solution if, and only if, they are better. In other words, new solutions are rejected if the existing solutions are better. Equations (11) and (12) incorporate this:
In simulating the commensalism phase, an organism is randomly selected for interaction with organism exhibiting the characteristic of the commensalism symbiosis relationship where only one of the two organisms derives a benefit from the relationship. This relationship is simulated using Equation (13):
Thus, only the benefiting organisms generate a new solution, as reflected by Equation (10). The new solution is accepted only if it is better, in terms of fitness, than the previous solution before the interaction.
The parasitism phase is the last phase, which is simulated using Equation (14). In simulating the parasitism symbiotic relationship in the SOS algorithm, a duplicate copy of the organism is created as a parasite vector with some of its selected dimensions modified using a random number. An organism is then randomly selected from the ecosystem to play host to the parasite vector . If the fitness value of is better than that of , then replaces in the ecosystem. If the opposite happens, and builds immunity against , then is removed from the ecosystem:
2.3. Description of Data Clustering Problem
In data clustering problems, data objects sharing similar characteristics are grouped together into a cluster, such that data objects in one cluster are different from data objects in other clusters. In most cases, the number of clusters is specified, while in some cases, especially in high dimensional datasets, predetermining the number of clusters is not feasible. In optimization terms, data objects are clustered, based on the similarity or dissimilarity between them, such that the inter-cluster similarity is minimized (maximizing inter-cluster dissimilarity), while maximizing the intra-cluster similarity (or minimizing intra-cluster dissimilarity). The description of a clustering problem as an optimization problem is given below.
Given a dataset of dimension which represents the number of attributes or features of the data objects in the datasets such that where is the number of data objects in the dataset. Each data object where represents all the features for data object . The dataset can be represented in a matrix form as shown in Equation (15):
is required to be grouped into number of clusters to satisfy Equations (1)–(3), using Equation (4) as the objective function, with each cluster having a cluster center defined in Equations (5) and (6). For an automatic clustering, the number of clusters is not defined. Therefore, finding the optimum number of clusters represented by equation (6) becomes the optimization problem that seeks to optimize the function over all possible clustering of where function represents the global validity index for obtaining the best quality clustering solution and represents the distance metric measure, stated in Equation (4).
2.4. Cluster Validity Indices
The cluster validity indices are qualitative methods, like the statistical mathematical functions, for evaluating the clustering quality of a clustering algorithm. A cluster validity index has the capacity to accurately determine the cluster number in a dataset, as well as find the proper structure of each cluster in the dataset [56]. The principal concerns of most validity indices in clustering are to determine clustering compactness, separation, and cohesion. The cluster validity indices are presented as the fitness function during the optimization process of the clustering algorithms. The DB index and CS index are used as the cluster validity indices to evaluate the quality of the clustering results.
The DB index determines the quality of a clustering result by using the average inter-cluster similarity between any two clusters and the intra-cluster similarity between data objects within a cluster. The average intra-cluster similarity value is evaluated against the average inter-cluster similarity value using Equations (16) and (17). In the DB index, the fitness function is minimized during the data clustering. This implies that a smaller index value indicates better compactness or separation, and vice versa:
where and represent the within-cluster distance for clusters and , represents the inter-cluster distance between the two clusters and . The is the inter-cluster distance between the two cluster centroids of the respective clusters and .
The CS index estimates the quality of a clustering result by finding the ratio of the sum of the intra-cluster scatter to the inter-cluster separation using Equation (18):
where represents within-cluster scatter and between-cluster separation with the distance measure given as . The CS index is rated as being more computationally intensive but more efficient, compared with the DB index, and gives a more quality solution than the DB index. In the CS index, the fitness function is also minimized, therefore a lower validity index implies better separation or compactness, while a higher index value implies weak separation or compactness.
2.5. Hybrid SOSK-Means
A hybridization of SOS and K-means proposed by [26] found the solution to the automatic clustering algorithm. The proposed algorithm employed the standard SOS algorithm to globally search for the optimum initial cluster centroids for the K-means algorithm. This resolved the problems associated with the random generation of the initial cluster centroid without initial specification of the value of . The problem of multiple parameter controls required in most nature-inspired population-based metaheuristic algorithms (e.g., GA, PSO, FA) was also avoided, since the SOS required only the basic control parameters for a metaheuristic algorithm, such as the number of iterations and population size, with no algorithm-specific parameters. The SOS as a global search algorithm ensured that K-means returned a global optimum solution to the clustering problem, canceling the possibility of getting stuck in the local optimum. According to [26], the SOSK-means algorithm combined the local exploitation capability of the standard K-means with less parameter tuning and global exploration, as provided by the SOS algorithm with implementation simplicity common to the two algorithms, to produce a powerful, efficient, and effective automatic clustering algorithm. The resulting hybrid algorithm was credited with better cluster solutions than the results from the standard SOS and K-means algorithms executed separately.
The SOSK-means algorithm commences by initializing the population of 𝑛 organisms representing the ecosystem, randomly generated using Equation (19), and the fitness value of each organism is calculated based on the fitness function for the optimization process. The initial organisms are generated by the expression in the equation, representing random and uniformly distributed points within the ecosystem, the solution search space is bounded between specified lower and upper limits and respectively, for the clustering problem:
New candidate solutions are subsequently generated using the three phases of the SOS algorithm, described under the SOS algorithm. The optimum result from the phases of the SOS algorithm is passed as the optimum cluster centroids for initializing the K-means algorithm. These processes are iteratively performed until the stopping criterion is achieved. The details on the design and performance of hybrid SOSK-means can be found in [26]. Algorithm 1 presents the pseudocode for the hybrid SOSK-means algorithm. The flowchart for Algorithm 1 can be found in [26].
| Algorithm 1: Hybrid SOSK-means clustering pseudocode [26] |
| Input:Eco_size: population size ULSS: upper limit for search space |
| Max_iter: maximum number of iterations LLSS: lower limit for search space |
| PDim: problem dimension ObjFn(X): fitness (objective) function |
| Output: Optimal Solution |
| 1: Create an initial population of organisms …, |
| 2: Calculate the fitness of each organism |
| 3: Keep the initial population’s best solution |
| 4: while |
| 5: for do |
| 6: // 1st Phase: Mutualism // |
| 7: Select index j |
| 8: |
| 9: |
| 10: |
| 11: for do |
| 12: |
| 13: |
| 14: end for |
| 15: if |
| 16: |
| 17: end if |
| 18: if |
| 19. |
| 20: end if |
| 21: // 2nd Phase: Commensalism // |
| 22: Select index j randomly |
| 23: for do |
| 24: |
| 25: end for |
| 26: if |
| 27: |
| 28: end if |
| 29: //3rd Phase: Parasitism // |
| 30: Select index j |
| 31: for do |
| 32: if |
| 33: |
| 34: else |
| 35: |
| 36: end if |
| 37: end for |
| 38: if |
| 39: |
| 40: end if |
| 41: Update current population’s best solution BestX |
| 42: //K-means Clustering Section// |
| 43: K-means’ initialization using the position of the BestX |
| 44: Execute K-means clustering |
| 45: end for |
| 46: iter = iter + 1 |
| 47: end while |
3. Modified SOSK-Means
The adoption of standard SOS and K-means algorithms in the hybrid SOSK-means combines the benefits of the two classical algorithms to produce an efficient algorithm. However, some of the individual challenges of the two algorithms remain. The SOSK-means algorithm still suffers from the low convergence rate peculiar to the classical SOS algorithm. The computational time is affected by the dataset size as it is with the classical K-means clustering. The proposed ISOSK-means follows the structure of the original SOSK-means algorithm, described in Section 2.2, with a few modifications incorporated into the two classical algorithms to further enhance the performance of the hybrid algorithm. The summary flowchart for ISOSK-means is shown in Figure 1.
Figure 1.
Flowchart for ISOSK-means clustering algorithm.
3.1. Modification in the SOS Phase
The modifications in the SOS phase affect three major parts of the standard algorithm, the initialization phase, the mutualism phase, and the commensalism phase. During the initialization phase, the population size is required to be specified as an input parameter. This is common to most metaheuristic algorithms, with no specific rule for determining the best population size for optimum algorithm performance. In the improved SOSK-means, the rule for determining the population size suggested by [39] was adopted. The population size was constructed as where , representing the minimum number of possible groupings of the datasets for an optimum search in the metaheuristic algorithm to achieve a well-distributed space for initial population of solutions that scales well with the data size. In this work, the value for was given as . The idea was coined from generalizing the central limit theorem (CLT) for a mixture distribution that infers sample population parameters. The central limit theorem states [57] that the mean (average) of a random sample follows a normal distribution as the mean, and variance, of the population from which it is selected According to [39], the selection of a data sample having a size that is sufficiently large enough to be well above the total number of clusters has a high possibility of containing data objects that belong to each of the clusters. At each iteration, new population samples are randomly selected as initial populations. The use of the population size of ensured that the initial selection of candidate solutions was well spread across the solution search space for the generation of optimum values in the SOS phase for a faster search for the optimum cluster centroids, which, subsequently, served as the K-means algorithm’s initial centroids [39]. The different initial population samples at each iteration in the optimization process represented the varied samples of the initial solution space. Selecting such a sufficiently large population size has a high probability of containing the cluster centroids for all the clusters within the dataset. This invariably increased the convergence rate of the SOS algorithm, and the computational time was, consequently, reduced.
To upgrade the SOS algorithm’s performance, a three-part mutualism phase, with the random weighted reflection coefficient introduced by [28], was incorporated. Three-part mutualism reflects the possibility of three organisms interacting mutually, each deriving benefits that sustain their existence in the ecosystem. A three-part mutual relationship can be observed in the interaction between sloths, algae, and moths. A three-part mutualism is incorporated alongside the use of two interacting organisms in the mutualism phase. In three-part mutualism, three organisms are chosen randomly in the ecosystem to interact for the generation of newer organisms. Each organism is simulated using Equations (20)–(22), respectively. Their mutual benefits are simulated using Equation (23), involving contributions from the three organisms. At the commencement of the mutualism phase for the organism’s update, a random probability is used to determine whether an organism will be engaged in three-part mutualism or not. Thus, a choice is required between the normal dual mutualism interaction and the three-part mutualism. The flowchart depicting the three-part mutualism phase is shown in Figure 2.
Figure 2.
Flowchart for three-part mutualism phase.
The BF is also modified using the modified benefit factor (MBF) in [28] to increase the quality of the solution. In the MBF, the relativity of the fitness value of each organism under consideration, with respect to the maximum fitness value, is incorporated to achieve a benefit factor that is self-adaptable. The MBF for each organism was simulated using Equations (24)–(26). This ensured the automatic maintenance of the values of the benefit factors throughout the search process.
The modified benefit factor (MBF) incorporated the possibility of variations in the actual benefits derived from the interactions, instead of the static 1 or 2 implemented in the standard SOS. As stated earlier, a benefit factor of 1 caused slow convergence by reducing the search step, while a benefit factor of 2 reduced the search ability by speeding up the search process. In the case of the MBF, the benefit accrued to an organism was a factor of its fitness with respect to the best fitness in the ecosystem.
Moreover, a random weight ( suggested by [28], for the SOS algorithm’s performance improvement was added to each dimension of the organism. The weight was simulated using Equation (27):
3.2. Modification in the K-Means Phase
The modification effected in the K-means phase of the improved SOSK-means algorithm addressed the misleading effects of outliers in the dataset, which usually affect the standard K-means algorithm at the centroids update stage. The use of the ‘average’ as the statistic for calculating the new cluster centroid was sensitive to outliers [3]. According to [58,59], K-means assume Gaussian data distribution, being an instance of the Gaussian mixture model. As such, about 99.73% of the data points within a cluster record point-to-centroid distances of three standard deviations from the cluster centroid. Therefore, any point with a point-to-centroid distance that is outside this range with respect to its cluster is considered an outlier. Subsequently, it is excluded in the computation of the centroid update.
According to [59], a standard deviation was taken to be 1.4826 of the median absolute deviation (MAD) for population distribution. The median absolute deviation gave a robust statistical dispersion measure and was more resilient to outliers than the standard deviation [60]. Given a point-to-centroid distance threshold :
The centroid update was calculated using Equation (31) in the classical K-means:
However, in the improved SOSK-means, was introduced for outlier detection and exclusion in the new centroid update using Equation (32):
where represents the sets of points assigned to cluster which has a point-to-centroid distance . The main difference between Equations (31) and (32) is that in the latter equation, the sets of points assigned to a cluster with a point-to-centroid distance greater than thrice the standard deviation were excluded from the centroid update calculation. This excluded the outliers from contributing to the mean square error that was being minimized. Algorithm 2 presents the pseudocode for the proposed improved SOSK-means algorithm.
| Algorithm 2: The proposed improved SOSK-means Pseudocode |
| Eco_size: population size ULSS: Upper limit for search space |
| Max_iter: maximum number of iterations LLSS: Lower limit for search space |
| PDim: problem dimension ObjFn(X): fitness (objective) function |
| Optimal Solution |
| 1: Create an initial population of organisms …, |
| 2: Calculate the fitness of each organism |
| 3: Keep the initial population’s best solution |
| 4: Keep the initial population’s maximum solution |
| 5: while |
| 6: for do |
| 7: // 1st Phase: Mutualism // |
| 8: Select index j |
| 9: Select index k |
| 10: |
| 11: |
| 12: if |
| 13: |
| 14: |
| 15: |
| 16: |
| 17: for do |
| 18: |
| 19: |
| 20: end for |
| 21: if |
| 22: |
| 23: end if |
| 24: if |
| 25: |
| 26: end if |
| 27: else |
| 28: |
| 29: |
| 30: |
| 31: |
| 32: |
| 33: for do |
| 34: |
| 35: |
| 36: end for |
| 37: if |
| 38: |
| 39: end if |
| 40: if |
| 41: |
| 42: end if |
| 43: if |
| 44: |
| 45: end if |
| 46: // 2nd Phase: Commensalism // |
| 47: Select index j randomly |
| 48: |
| 49: for do |
| 50: |
| 51: end for |
| 52: if |
| 53: |
| 54: end if |
| 55: //3rd Phase: Parasitism // |
| 56: Select index j |
| 57: for do |
| 58: if |
| 59: |
| 60: else |
| 61: |
| 62: end if |
| 63: end for |
| 64: if |
| 65: |
| 66: end if |
| 67: Update the current population’s best solution of the BestX |
| 68: //K-means Clustering Phase// |
| 69: K-means initialization using the position of the BestX |
| 70: Execute K-means clustering using equation (32) for cluster update |
| 71: end for |
| 72: iter = iter + 1 |
| 73: end while |
4. Performance Evaluation of Improved SOSK-Means
Forty-two datasets were considered for validating the proposed ISOSK-means algorithm for automatic clustering, of which 24 were real-life datasets and 18 were artificial datasets. All the algorithms were programmed using MATLAB R2018b, running on Windows 10 operating system, installed on a 3.60 GHz Intel® Core i7-7700 processor computer system with 16 GB memory size. For the study, the eco_size was set at . The algorithms were executed 40 times with 200 iterations in each run. The performance results are presented using the minimum, maximum, average, and standard deviation of the fitness values, as well as the average computational time. The improved SOSK-means algorithm’s effectiveness was measured and compared using the following criteria:
- The average best fitness value measured the algorithm’s quality of the clustering solutions.
- The performance speed used the algorithm’s computational cost and convergence curve.
- The statistical significance difference was over 40 replications.
The results were compared with the standard K-means, the standard SOS algorithm, the existing SOSK-means and other state-of-the-art hybrid and non-hybrid metaheuristic algorithms. The best results among the compared algorithms are presented in bold format. The values of the common control parameters were the same for the K-means, standard SOS algorithm and the SOSK-means algorithms. The control parameters for the competing metaheuristic algorithms obtained from literature in [61] are shown in Table 1.
Table 1.
The control parameters for competing metaheuristic algorithms.
4.1. Datasets
During the experiment, 42 datasets were considered. The datasets were grouped into two groups: 18 synthetically generated datasets and 24 real-life datasets. The characteristics of the two categories of datasets are presented in Table 2 and Table 3, respectively.
Table 2.
The characteristics of the 18 synthetically generated datasets.
Table 3.
The characteristics of the 24 real-life datasets.
4.1.1. The Synthetic Datasets
The synthetically generated datasets consisted of the A-datasets (three sets), Birch datasets (three sets), DIM (one set of a low dimensional dataset and seven sets of high dimensional datasets), and the S-generated datasets (four sets). The A datasets had an increasing number of clusters, while the Birch datasets had the number of clusters fixed at 100. The DIM datasets were characterized by well-separated clusters, with DIM002 having 9 predetermined clusters (with varying dimensions ranging from 2 to 15), while others had 16 clusters with dimensions ranging from 16 to 1024. The S1–S4 were two-dimensional datasets, characterized by varying spatial data distribution complexity with a uniform cluster of 15.
4.1.2. The Real-Life Datasets
The real-life datasets consisted of the following: eight shape sets (Aggregation, Compound, D31, Flame, Jain, Path-based, R15 and Spiral datasets); ten datasets from the UCI repository (Breast, Glass, Iris, Jain, Leaves, Letter, Thyroid, Wdbc, Wine and Yeast); two Mopsi locations datasets (Joensuu and Finland); two RGB images datasets (Housec5 and Housec8); one Gray-scale image blocks; and two miscellaneous datasets (T4.8k and Two moons). The real-life datasets had varying clusters, ranging from 2 to 256, their dimensions ranged between 2 and 64, and the number of data objects in the datasets ranged between 150 and 34,112.
4.2. Experiment 1
In the first set of experiments conducted, the improved SOSK-means was run on 12 datasets, initially used for the SOSK-means. These were Breast, Compound, Flame, Glass, Iris, Jain, Path-based, Spiral, Thyroid, Two moons, Wine, and Yeast datasets. The experimental results are summarized in Table 4, showing the values obtained by the ISOSK-means for each of the 12 datasets. The four decimal place values represented the minimum, the maximum, the mean value over 40 simulations and the standard deviations, which measured the range of values the algorithm converged. From the results obtained, the ISOSK-means returned the best mean values for four of the datasets (Compound, Jain, Thyroid, and two-moons) under the DB index, and eight of the datasets (Breast, Flame, Glass, Iris, Path-based, Spiral, Wine and Yeast) had the best mean values under the CS index. The average computational time for achieving convergence for each dataset by the improved algorithm is shown in Figure 3. Even though the CS index returned the best overall average results for the 12 datasets, this was at the expense of higher computational time.
Table 4.
Computational results for improved SOSK-means on 12 real-life datasets.
Figure 3.
Computational time for the ISOSK-means.
Table 5 summarizes the simulated results for each of the four competing algorithms for the automatic clustering of the 12 real-life datasets. The results present the mean and the standard deviation for each algorithm. The values were obtained for the two cluster validity indices, the DB index, and the CS index.
Table 5.
Computation results for the four competing algorithms on 12 real-life datasets.
As shown in Table 5, the ISOSK-means had the best mean score under the DB validity index in 11 of the 12 datasets, with a tie on the Breast dataset for three of the algorithms: ISOSK-means, SOSK-means and K-means. In the same vein, the ISOSK-means recorded the best mean scores under the CS validity index for the ISOSK-means in eight datasets with ties for two of the algorithms: SOSK-means and ISOSK-means, in four of the datasets (Flame, Glass, Jain, and Thyroid). The performance analysis of the four competing algorithms is shown in Figure 4 and Figure 5 for each cluster validity index. These results indicated that the ISOSK-means algorithm performed better than the other three competing algorithms.
Figure 4.
Performance analysis of four competing algorithms, ISOSK-means, SOSK-means, SOS and K-means, under the DB index.
Figure 5.
Performance analysis of four competing algorithms, ISOSK-means, SOSK-means, SOS and K-means, under the CS index.
The average execution times of the SOS, SOSK-means and ISOSK-means algorithms for 200 generations were presented separately for each validity index, as shown in Figure 6 and Figure 7. As expected, being a non-hybrid algorithm, the SOS recorded the lowest computational time under the two validity indices. Under the DB validity index, the ISOSK-means recorded a shorter average execution time than the SOSK-means in nine datasets. This indicated that the ISOSK-means required less execution time to achieve convergence. Under the CS validity index, the ISOSK-means recorded lower execution time in six datasets. Out of the remaining six, only three datasets showed a considerable difference in execution time for the two algorithms in favor of the SOSK-means. Since the CS index usually requires higher computational time, this result showed that the ISOSK-means substantially outperformed SOSK-means in terms of computational cost.
Figure 6.
Analysis of computational times of SOS, SOSK-means and ISOSK-means under the DB index.
Figure 7.
Analysis of computational times of SOS, SOSK-means and ISOSK-means under the CS index.
The convergence curve for the three algorithms, ISOSK-means, SOSK-means and SOS, are illustrated in Figure 8 and Figure 9 for the DB index and CS index, respectively. A rapid and smooth declining curve reflected a superior performance. In all 12 datasets, the ISOSK-means recorded the best performance with rapidly declining smooth curves under the two validity indices.


Figure 8.
Convergence curves for the 12 datasets under DB index.


Figure 9.
Convergence curves for the 12 datasets under the CS index.
4.3. Experiment 2
In Experiment 2, an extensive performance evaluation of the ISOSK-means algorithm on 18 synthetic datasets was demonstrated. Table 6 shows the computational results from the experiment under the DB validity index, showing the best, the worst, the mean, and the standard deviation scores. The results of the ISOSK-means were compared with other existing hybrid algorithms from the literature [61] for the same problem in Table 7. The ISOSK-means recorded a better overall mean value for the 18 synthetic datasets, compared with the other hybrid metaheuristic algorithms. This showed that the mean performance of the improved hybrid algorithm was superior, compared with the competing hybrid metaheuristic algorithms, in solving the automatic clustering problem.
Table 6.
Computational results of ISOSK-means on 18 synthetic datasets.
Table 7.
Performance comparison of ISOSK-means with other hybrid metaheuristic algorithms from literature on 18 synthetic datasets.
4.4. Experiment 3
In Experiment 3, the performance of the ISOSK-means algorithm on 23 real life datasets were evaluated. The computational results from the experiment under the DB validity index are shown in Table 8, showing the minimum, the maximum, the average, and the standard deviation scores for the ISOSK-means algorithm. The results were compared with other existing hybrid algorithms from the literature [61] for the same problem, as presented in Table 9. The ISOSK-means recorded a better mean value for the 23 real-life datasets than the other hybrid metaheuristic algorithms. This indicated that the improved hybrid algorithm performed better, on average, in solving the automatic clustering problem, compared with the competing hybrid metaheuristic algorithms. However, it is worth noting that FADE had the best clustering result in nine of the datasets. Nevertheless, the ISOSK-means recorded the least standard deviation in 18 datasets, with the least mean standard deviation score in all, showing that it produced more compact clusters than the competing hybrid metaheuristic algorithms.
Table 8.
Computational results of ISOSK-means on 23 real-life datasets.
Table 9.
Performance comparison of ISOSK-means with other hybrid metaheuristic algorithms on 23 real-life datasets.
4.5. Experiment 4
In this experiment, the ISOSK-means results were compared with other existing non-hybrid algorithms (DE, PSO, FA, IWO) from the literature [60] for the same problem, and the results are presented in Table 10. The ISOSK-means recorded the best mean scores in four datasets: A1, A2, Birch2 and Housec5. The FA recorded the best mean performance, followed by the proposed ISOSK-means algorithm. FA and ISOSK-means recorded better average performance scores than DE, PSO and IWO. This showed that the improved hybrid algorithm demonstrated a high competing capability with other metaheuristic algorithms in automatic clustering of high dimensional datasets.
Table 10.
Performance comparison of ISOSK-means with other non-hybrid metaheuristic algorithms on high-dimensional datasets.
4.6. Statistical Analysis
The statistical analysis experiment involved using a nonparametric statistical analysis technique to further validate the algorithms’ computational results. The Friedman’s nonparametric test was conducted to draw a statistically verified meaningful conclusion from the reported performances. The reports for the computed Friedman’s mean rank on the four competing algorithms (the ISOSK-means, SOSK-means, SOS, and K-means) are presented in Table 11. The results showed that the ISOSK-means had the best performance, recording 1.13 as its minimum rank value and 2.00 as its maximum rank value, under the DB index, with a 1.15 minimum rank value and 1.99 maximum rank value under the CS index.
Table 11.
Friedman mean rank for ISOSK-means, SOSK-means, SOS, and K-means.
For further verification of the specific significant differences among the competing algorithms, a post hoc test on the Friedman mean-rank test results, using the Wilcoxon signed-rank test, was conducted. The Wilcoxon signed-rank test presents a set of p values which statistically measures whether there is a significant difference between the competing algorithms at a significance level of 0.05.
Table 12 shows the significant differences between ISOSK-means and the other competing algorithms under the DB and CS cluster validity indices. Out of 12 datasets, ISOSK-means recorded about 92%, 100%, and 83% significant differences in its performance from K-means, SOS, and SOSK-means under the DB index, and with a significant difference of 100%, 83% and 58%, respectively, under the CS index. This implied that the modification made to the existing SOSK-means algorithm contributed to the performance enhancement of the existing hybrid algorithm in solving cluster analysis problems.
Table 12.
Wilcoxon signed-rank test for ISOSK-means, SOSK-means, SOS, and K-means.
5. Conclusions and Future Directions
In this study, an improved hybrid ISOSK-means metaheuristic algorithm is presented. Several improvements were incorporated into each of the two classical algorithms combined in the hybridization. In the initialization phase of the SOS algorithm, the population size was constructed using for a well-distributed initial population of solutions that scaled well with the data size. This resulted in a convergence rate increase and lower computational time. For performance upgrade, a three-part mutualism phase, with a random weighted reflection coefficient, was also integrated into the SOS algorithm with a random probability for determining whether an organism would be engaged in the three-part mutualism. To improve the quality of the clustering solution, the benefit factor was modified, by incorporating consideration for fitness value relativity with respect to the maximum fitness value.
The misleading effects of outliers in the dataset were addressed by the improvement incorporated into the K-means phase of the improved hybrid algorithm. A method for detecting and excluding putative outliers during the centroid update phase of the classical algorithm was added. The algorithm uses a point-to-centroid distance threshold for the centroid update, instead of using the means of data points. The point-to-centroid distance threshold uses the median absolute deviation, which is considered to be a robust measure of statistical dispersion and is known to be more resilient to outliers. This ensured that outliers were excluded from contributing to minimizing the mean square error in the K-means. This resulted in a more compact cluster output.
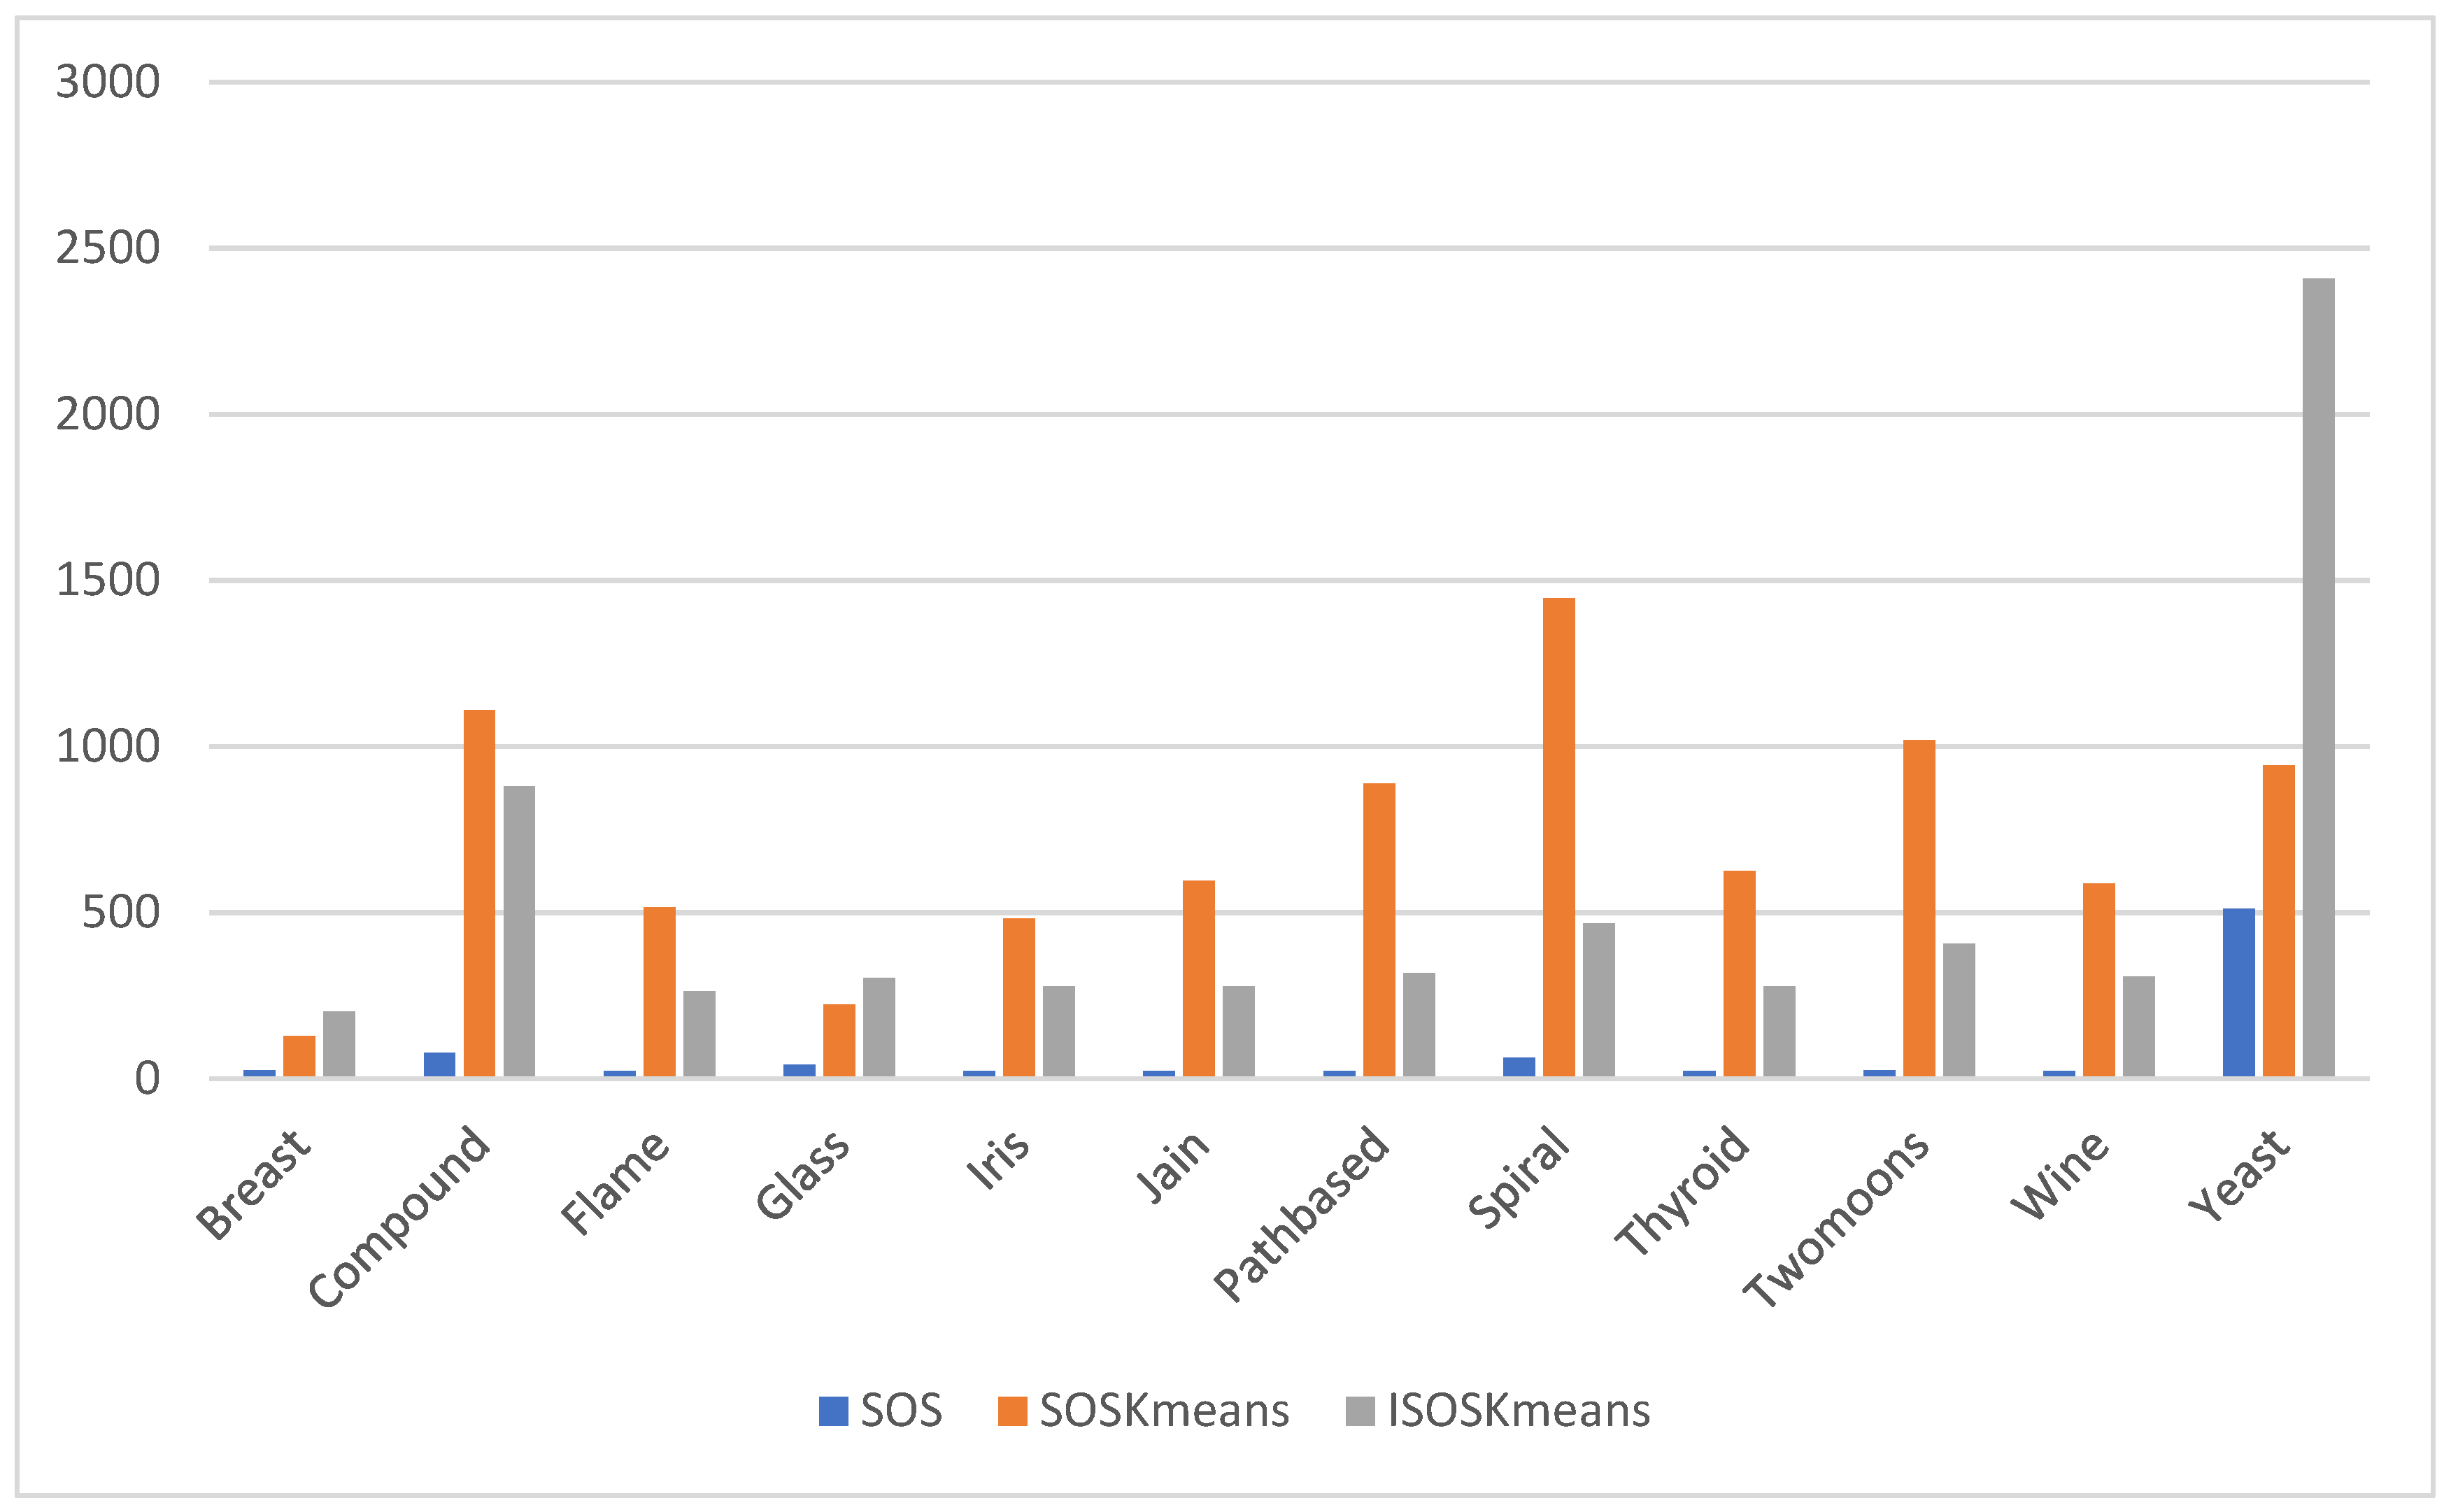
The improved hybrid algorithm was evaluated on 42 datasets (18 synthetic and 24 real-life) with varying characteristics, such as being high dimensional datasets, low dimensional datasets, synthetically generated datasets, image datasets, shape datasets, and location datasets, with varied dataset sizes and clusters. The performance of the improved hybrid algorithm was compared with the standard hybrid and non-hybrid algorithms. The performance was also compared with the two standard algorithms SOS and K-means on 12 real life datasets. A Friedman means rank test was applied to analyze the significant difference between the ISOSK-means and the competing algorithms. A pairwise post hoc Wilcoxon signed-rank sum test was also performed to highlight the performance of the ISOSK-means in comparison with the competing algorithms. The ISOSK-means algorithm outperformed the three algorithms with lower computational time and higher convergence rate, as reflected in the convergence curve for the competing algorithms.
The ISOSK-means clustering results were compared with four non-hybrid metaheuristic algorithms and three hybrid metaheuristic algorithms from the literature. The ISOSK-means had fair competitiveness, in terms of clustering performance measured using the DB validity index, on 42 datasets. The ISOSK-means recorded the lowest standard deviation score for most datasets, compared with the competing algorithms.
For future research, the K-means phase of the hybridized algorithm could be improved to efficiently manage large datasets and, thereby, reduce the algorithm’s computational complexity. Other suggested improvements to the SOS algorithm from literature could also be incorporated into the algorithm, or be used as a replacement to the current SOS phase of the ISOSK-means, for further performance enhancement, while reducing the algorithm run time. The real-life application of the proposed improved hybrid algorithm is another area of research that could be exploited. Using other cluster validity indices in implementing this algorithm would also be an interesting area for future research.
Author Contributions
All authors contributed to the conception and design of the research work. Material preparation, experiments, and analysis were performed by A.M.I. and A.E.E. All authors have read and agreed to the published version of the manuscript.
Funding
This research received no external funding.
Institutional Review Board Statement
Not applicable.
Informed Consent Statement
Not applicable.
Data Availability Statement
Not applicable.
Conflicts of Interest
The authors declare that they have no known competing financial interest or personal relationship that could have appeared to influence the work reported in this article.
References
- José-García, A.; Gómez-Flores, W. Automatic clustering using nature-inspired metaheuristics: A survey. Appl. Soft Comput. 2016, 41, 192–213. [Google Scholar] [CrossRef]
- Ikotun, A.M.; Almutari, M.S.; Ezugwu, A.E. K-Means-Based Nature-Inspired Metaheuristic Algorithms for Automatic Data Clustering Problems: Recent Advances and Future Directions. Appl. Sci. 2021, 11, 11246. [Google Scholar] [CrossRef]
- Olukanmi, P.O.; Twala, B. K-means-sharp: Modified centroid update for outlier-robust k-means clustering. In Proceedings of the 2017 Pattern Recognition Association of South Africa and Robotics and Mechatronics International Conference (PRASA-RobMech), Bloemfontein, South Africa, 29 November–1 December 2017; pp. 14–19. [Google Scholar] [CrossRef]
- Ikotun, A.M.; Ezugwu, A.E.; Abualigah, L.; Abuhaija, B.; Heming, J. K-means Clustering Algorithms: A Comprehensive Review, Variants Analysis, and Advances in the Era of Big Data. Inf. Sci. 2022, 622, 178–210. [Google Scholar] [CrossRef]
- Knorr, E.M.; Ng, R.T.; Tucakov, V. Distance-based outliers: Algorithms and applications. VLDB J. 2000, 8, 237–253. [Google Scholar] [CrossRef]
- Chawla, S.; Gionis, A. k-means–: A unified approach to clustering and outlier detection. In Proceedings of the 2013 SIAM International Conference on Data Mining, Austin, TX, USA, 2–4 May 2013; pp. 189–197. [Google Scholar] [CrossRef]
- Olukanmi, P.; Nelwamondo, F.; Marwala, T.; Twala, B. Automatic detection of outliers and the number of clusters in k-means clustering via Chebyshev-type inequalities. Neural Comput. Appl. 2022, 34, 5939–5958. [Google Scholar] [CrossRef]
- Cheng, M.-Y.; Prayogo, D. Symbiotic Organisms Search: A new metaheuristic optimization algorithm. Comput. Struct. 2014, 139, 98–112. [Google Scholar] [CrossRef]
- Chakraborty, S.; Nama, S.; Saha, A.K. An improved symbiotic organisms search algorithm for higher dimensional optimization problems. Knowl.-Based Syst. 2021, 236, 107779. [Google Scholar] [CrossRef]
- Panda, A.; Pani, S. A symbiotic organisms search algorithm with adaptive penalty function to solve multi-objective constrained optimization problems. Appl. Soft Comput. 2016, 46, 344–360. [Google Scholar] [CrossRef]
- Cheng, M.-Y.; Prayogo, D.; Tran, D.-H. Optimizing Multiple-Resources Leveling in Multiple Projects Using Discrete Symbiotic Organisms Search. J. Comput. Civ. Eng. 2016, 30, 04015036. [Google Scholar] [CrossRef]
- Kawambwa, S.; Hamisi, N.; Mafole, P.; Kundaeli, H. A cloud model based symbiotic organism search algorithm for DG allocation in radial distribution network. Evol. Intell. 2021, 15, 545–562. [Google Scholar] [CrossRef]
- Liu, D.; Li, H.; Wang, H.; Qi, C.; Rose, T. Discrete symbiotic organisms search method for solving large-scale time-cost trade-off problem in construction scheduling. Expert Syst. Appl. 2020, 148, 113230. [Google Scholar] [CrossRef]
- Cheng, M.-Y.; Cao, M.-T.; Herianto, J.G. Symbiotic organisms search-optimized deep learning technique for mapping construction cash flow considering complexity of project. Chaos Solitons Fractals 2020, 138, 109869. [Google Scholar] [CrossRef]
- Abdullahi, M.; Ngadi, A.; Abdulhamid, S.M. Symbiotic organism search optimization based task scheduling in cloud computing environment. Future Gener. Comput. Syst. 2016, 56, 640–650. [Google Scholar] [CrossRef]
- Ezugwu, A.E.-S.; Adewumi, A.O.; Frîncu, M.E. Simulated annealing based symbiotic organisms search optimization algorithm for traveling salesman problem. Expert Syst. Appl. 2017, 77, 189–210. [Google Scholar] [CrossRef]
- Tejani, G.; Savsani, V.J.; Patel, V. Adaptive symbiotic organisms search (SOS) algorithm for structural design optimization. J. Comput. Des. Eng. 2016, 3, 226–249. [Google Scholar] [CrossRef]
- Abdullahi, M.; Ngadi, A. Hybrid symbiotic organisms search optimization algorithm for scheduling of tasks on cloud computing environment. PLoS ONE 2016, 11, e0158229. [Google Scholar] [CrossRef]
- Mohammadzadeh, H.; Gharehchopogh, F.S. Feature selection with binary symbiotic organisms search algorithm for email spam detection. Int. J. Inf. Technol. Decis. Mak. 2021, 20, 469–515. [Google Scholar] [CrossRef]
- Boushaki, S.I.; Bendjeghaba, O.; Kamel, N. Biomedical document clustering based on accelerated symbiotic organisms search algorithm. Int. J. Swarm Intell. Res. 2021, 12, 169–185. [Google Scholar] [CrossRef]
- Zhou, Y.; Wu, H.; Luo, Q.; Abdel-Baset, M. Automatic data clustering using nature-inspired symbiotic organism search algorithm. Knowl.-Based Syst. 2019, 163, 546–557. [Google Scholar] [CrossRef]
- Chen, J.; Zhang, Y.; Wu, L.; You, T.; Ning, X. An adaptive clustering-based algorithm for automatic path planning of heterogeneous UAVs. IEEE Trans. Intell. Transp. Syst. 2021, 23, 16842–16853. [Google Scholar] [CrossRef]
- Zainal, N.A.; Zamli, K.Z.; Din, F. A modified symbiotic organism search algorithm with lévy flight for software module clustering problem. In Proceedings of the ECCE2019—5th International Conference on Electrical, Control & Computer Engineering, Kuantan, Malaysia, 29 July 2019; pp. 219–229. [Google Scholar] [CrossRef]
- Rajah, V.; Ezugwu, A.E. Hybrid Symbiotic Organism Search algorithms for Automatic Data Clustering. In Proceedings of the 2020 Conference on Information Communications Technology and Society (ICTAS), Durban, South Africa, 11–12 March 2020; pp. 1–9. [Google Scholar] [CrossRef]
- Yang, C.-L.; Sutrisno, H. A clustering-based symbiotic organisms search algorithm for high-dimensional optimization problems. Appl. Soft Comput. 2020, 97, 106722. [Google Scholar] [CrossRef]
- Ikotun, A.M.; Ezugwu, A.E. Boosting k-means clustering with symbiotic organisms search for automatic clustering problems. PLoS ONE 2022, 17, e0272861. [Google Scholar] [CrossRef] [PubMed]
- Nama, S.; Saha, A.K.; Ghosh, S. Improved symbiotic organisms search algorithm for solving unconstrained function optimization. Decis. Sci. Lett. 2016, 5, 361–380. [Google Scholar] [CrossRef]
- Nama, S.; Saha, A.K.; Sharma, S. A novel improved symbiotic organisms search algorithm. Comput. Intell. 2020, 38, 947–977. [Google Scholar] [CrossRef]
- Secui, D.C. A modified Symbiotic Organisms Search algorithm for large scale economic dispatch problem with valve-point effects. Energy 2016, 113, 366–384. [Google Scholar] [CrossRef]
- Nama, S.; Saha, A.K.; Ghosh, S. A hybrid symbiosis organisms search algorithm and its application to real world problems. Memetic Comput. 2016, 9, 261–280. [Google Scholar] [CrossRef]
- Ezugwu, A.E.-S.; Adewumi, A.O. Discrete symbiotic organisms search algorithm for travelling salesman problem. Expert Syst. Appl. 2017, 87, 70–78. [Google Scholar] [CrossRef]
- Ezugwu, A.E.; Adeleke, O.J.; Viriri, S. Symbiotic organisms search algorithm for the unrelated parallel machines scheduling with sequence-dependent setup times. PLoS ONE 2018, 13, e0200030. [Google Scholar] [CrossRef]
- Tsai, H.-C. A corrected and improved symbiotic organisms search algorithm for continuous optimization. Expert Syst. Appl. 2021, 177, 114981. [Google Scholar] [CrossRef]
- Kumar, S.; Tejani, G.G.; Mirjalili, S. Modified symbiotic organisms search for structural optimization. Eng. Comput. 2018, 35, 1269–1296. [Google Scholar] [CrossRef]
- Miao, F.; Zhou, Y.; Luo, Q. A modified symbiotic organisms search algorithm for unmanned combat aerial vehicle route planning problem. J. Oper. Res. Soc. 2018, 70, 21–52. [Google Scholar] [CrossRef]
- Çelik, E. A powerful variant of symbiotic organisms search algorithm for global optimization. Eng. Appl. Artif. Intell. 2019, 87, 103294. [Google Scholar] [CrossRef]
- Do, D.T.; Lee, J. A modified symbiotic organisms search (mSOS) algorithm for optimization of pin-jointed structures. Appl. Soft Comput. 2017, 61, 683–699. [Google Scholar] [CrossRef]
- Nama, S.; Saha, A.K.; Sharma, S. Performance up-gradation of Symbiotic Organisms Search by Backtracking Search Algorithm. J. Ambient Intell. Humaniz. Comput. 2021, 13, 5505–5546. [Google Scholar] [CrossRef] [PubMed]
- Olukanmi, P.O.; Nelwamondo, F.; Marwala, T. k-Means-Lite: Real time clustering for large datasets. In Proceedings of the 2018 5th International Conference on Soft Computing & Machine Intelligence (ISCMI), Nairobi, Kenya, 21–22 November 2018; pp. 54–59. [Google Scholar] [CrossRef]
- Davies, D.L.; Bouldin, D.W. A cluster separation measure. IEEE Trans. Pattern Anal. Mach. Intell. 1979, 2, 224–227. [Google Scholar] [CrossRef]
- Chou, C.-H.; Su, M.-C.; Lai, E. A new cluster validity measure and its application to image compression. Pattern Anal. Appl. 2004, 7, 205–220. [Google Scholar] [CrossRef]
- Arbelaitz, O.; Gurrutxaga, I.; Muguerza, J.; Pérez, J.M.; Perona, I. An extensive comparative study of cluster validity indices. Pattern Recognit. 2013, 46, 243–256. [Google Scholar] [CrossRef]
- Chouikhi, H.; Charrad, M.; Ghazzali, N. A comparison study of clustering validity indices; A comparison study of clustering validity indices. In Proceedings of the 2015 Global Summit on Computer & Information Technology (GSCIT), Sousse, Tunisia, 11–13 June 2015. [Google Scholar] [CrossRef]
- Xia, S.; Peng, D.; Meng, D.; Zhang, C.; Wang, G.; Giem, E.; Wei, W.; Chen, Z. Fast adaptive clustering with no bounds. IEEE Trans. Pattern Anal. Mach. Intell. 2020, 44, 87–99. [Google Scholar] [CrossRef]
- Goldanloo, M.J.; Gharehchopogh, F.S. A hybrid OBL-based firefly algorithm with symbiotic organisms search algorithm for solving continuous optimization problems. J. Supercomput. 2021, 78, 3998–4031. [Google Scholar] [CrossRef]
- Nguyen-Van, S.; Nguyen, K.T.; Luong, V.H.; Lee, S.; Lieu, Q.X. A novel hybrid differential evolution and symbiotic organisms search algorithm for size and shape optimization of truss structures under multiple frequency constraints. Expert Syst. Appl. 2021, 184, 115534. [Google Scholar] [CrossRef]
- Huo, L.; Zhu, J.; Li, Z.; Ma, M. A Hybrid Differential Symbiotic Organisms Search Algorithm for UAV Path Planning. Sensors 2021, 21, 3037. [Google Scholar] [CrossRef] [PubMed]
- Farnad, B.; Jafarian, A.; Baleanu, D. A new hybrid algorithm for continuous optimization problem. Appl. Math. Model. 2018, 55, 652–673. [Google Scholar] [CrossRef]
- Gharehchopogh, F.S.; Shayanfar, H.; Gholizadeh, H. A comprehensive survey on symbiotic organisms search algorithms. Artif. Intell. Rev. 2019, 53, 2265–2312. [Google Scholar] [CrossRef]
- Ghezelbash, R.; Maghsoudi, A.; Shamekhi, M.; Pradhan, B.; Daviran, M. Genetic algorithm to optimize the SVM and K-means algorithms for mapping of mineral prospectivity. Neural Comput. Appl. 2022, 1–15. [Google Scholar] [CrossRef]
- Yastrebov, A.; Kubuś, Ł.; Poczeta, K. Multiobjective evolutionary algorithm IDEA and k-means clustering for modeling multidimenional medical data based on fuzzy cognitive maps. Nat. Comput. 2022, 1–11. [Google Scholar] [CrossRef]
- Zhang, H.; Peng, Q. PSO and K-means-based semantic segmentation toward agricultural products. Futur. Gener. Comput. Syst. 2021, 126, 82–87. [Google Scholar] [CrossRef]
- Li, Y.; Chu, X.; Tian, D.; Feng, J.; Mu, W. Customer segmentation using K-means clustering and the adaptive particle swarm optimization algorithm. Appl. Soft Comput. 2021, 113, 107924. [Google Scholar] [CrossRef]
- Olukanmi, P.O.; Nelwamondo, F.; Marwala, T. k-Means-MIND: An Efficient Alternative to Repetitive k-Means Runs. In Proceedings of the 2020 7th International Conference on Soft Computing & Machine Intelligence (ISCMI), Stockholm, Sweden, 14–15 November 2020; pp. 172–176. [Google Scholar] [CrossRef]
- Jain, A.K. Data clustering: 50 years beyond K-means. Pattern Recognit. Lett. 2009, 31, 651–666. [Google Scholar] [CrossRef]
- Das, S.; Suganthan, P.N. Differential Evolution: A Survey of the State-of-the-Art. IEEE Trans. Evol. Comput. 2011, 15, 4–31. [Google Scholar] [CrossRef]
- Kwak, S.G.; Kim, J.H. Central limit theorem: The cornerstone of modern statistics. Korean J. Anesthesiol. 2017, 70, 2, 144. [Google Scholar] [CrossRef]
- Murugavel, P.; Punithavalli, M. Performance Evaluation of Density-Based Outlier Detection on High Dimensional Data. Int. J. Comput. Sci. Eng. 2013, 5, 62–67. [Google Scholar]
- Rousseeuw, P.J.; Croux, C. Alternatives to the median absolute deviation. J. Am. Stat. Assoc. 1993, 88, 1273–1283. [Google Scholar] [CrossRef]
- Leys, C.; Ley, C.; Klein, O.; Bernard, P.; Licata, L. Detecting outliers: Do not use standard deviation around the mean, use absolute deviation around the median. J. Exp. Soc. Psychol. 2013, 49, 764–766. [Google Scholar] [CrossRef]
- Ezugwu, A.E. Nature-inspired metaheuristic techniques for automatic clustering: A survey and performance study. SN Appl. Sci. 2020, 2, 273. [Google Scholar] [CrossRef]
- Das, S.; Konar, A. Automatic image pixel clustering with an improved differential evolution. Appl. Soft Comput. 2009, 9, 226–236. [Google Scholar] [CrossRef]
- Bandyopadhyay, S.; Maulik, U. Nonparametric genetic clustering: Comparison of validity indices. IEEE Trans. Syst. Man Cybern. Part C Appl. Rev. 2001, 31, 120–125. [Google Scholar] [CrossRef]
- Zhou, X.; Gu, J.; Shen, S.; Ma, H.; Miao, F.; Zhang, H.; Gong, H. An automatic K-Means clustering algorithm of GPS data combining a novel niche genetic algorithm with noise and density. ISPRS Int. J. Geo-Inf. 2017, 6, 392. [Google Scholar] [CrossRef]
- Bandyopadhyay, S.; Maulik, U. Genetic clustering for automatic evolution of clusters and application to image classification. Pattern Recognit. 2002, 35, 1197–1208. [Google Scholar] [CrossRef]
- Lai, C.-C. A novel clustering approach using hierarchical genetic algorithms. Intell. Autom. Soft Comput. 2005, 11, 143–153. [Google Scholar] [CrossRef]
- Lin, H.-J.; Yang, F.-W.; Kao, Y.-T. An Efficient GA-based Clustering Technique. J. Appl. Sci. Eng. 2005, 8, 113–122. [Google Scholar]
- Liu, R.; Zhu, B.; Bian, R.; Ma, Y.; Jiao, L. Dynamic local search based immune automatic clustering algorithm and its applications. Appl. Soft Comput. 2014, 27, 250–268. [Google Scholar] [CrossRef]
- Kundu, D.; Suresh, K.; Ghosh, S.; Das, S.; Abraham, A.; Badr, Y. Automatic Clustering Using a Synergy of Genetic Algorithm and Multi-objective Differential Evolution. In International Conference on Hybrid Artificial Intelligence Systems; Springer: Berlin/Heidelberg, Germany, 2009; pp. 177–186. [Google Scholar] [CrossRef]
- Kumar, V.; Chhabra, J.K.; Kumar, D. Automatic Data Clustering Using Parameter Adaptive Harmony Search Algorithm and Its Application to Image Segmentation. J. Intell. Syst. 2016, 25, 595–610. [Google Scholar] [CrossRef]
- Anari, B.; Torkestani, J.A.; Rahmani, A. Automatic data clustering using continuous action-set learning automata and its application in segmentation of images. Appl. Soft Comput. 2017, 51, 253–265. [Google Scholar] [CrossRef]
- Kuo, R.; Huang, Y.; Lin, C.-C.; Wu, Y.-H.; Zulvia, F.E. Automatic kernel clustering with bee colony optimization algorithm. Inf. Sci. 2014, 283, 107–122. [Google Scholar] [CrossRef]
- Liu, Y.; Wu, X.; Shen, Y. Automatic clustering using genetic algorithms. Appl. Math. Comput. 2011, 218, 1267–1279. [Google Scholar] [CrossRef]
- Chowdhury, A.; Das, S. Automatic shape independent clustering inspired by ant dynamics. Swarm Evol. Comput. 2011, 3, 33–45. [Google Scholar] [CrossRef]
- Kumar, V.; Chhabra, J.K.; Kumar, D. Automatic cluster evolution using gravitational search algorithm and its application on image segmentation. Eng. Appl. Artif. Intell. 2014, 29, 93–103. [Google Scholar] [CrossRef]
- Sheng, W.; Chen, S.; Sheng, M.; Xiao, G.; Mao, J.; Zheng, Y. Adaptive multisubpopulation competition and multiniche crowding-based memetic algorithm for automatic data clustering. IEEE Trans. Evol. Comput. 2016, 20, 838–858. [Google Scholar] [CrossRef]
- Das, S.; Chowdhury, A.; Abraham, A. A Bacterial Evolutionary Algorithm for Automatic Data Clustering. In Proceedings of the 2009 IEEE Congress on Evolutionary Computation, Trondheim, Norway, 8–21 May 2009. [Google Scholar]
- Talbi, E.-G. Metaheuristics: From Design to Implementation; John Wiley & Sons: Hoboken, NJ, USA, 2009. [Google Scholar]
- Chowdhury, A.; Bose, S.; Das, S. Automatic Clustering Based on Invasive Weed Optimization Algorithm. In Proceedings of the International Conference on Swarm, Evolutionary, and Memetic Computing 2011, Visakhapatnam, India, 19–21 December 2011; pp. 105–112. [Google Scholar] [CrossRef]
- Zhang, X.; Li, J.; Yu, H. Local density adaptive similarity measurement for spectral clustering. Pattern Recognit. Lett. 2011, 32, 352–358. [Google Scholar] [CrossRef]
- Agbaje, M.B.; Ezugwu, A.E.; Els, R. Automatic data clustering using hybrid firefly particle swarm optimization algorithm. IEEE Access 2019, 7, 184963–184984. [Google Scholar] [CrossRef]
Publisher’s Note: MDPI stays neutral with regard to jurisdictional claims in published maps and institutional affiliations. |
© 2022 by the authors. Licensee MDPI, Basel, Switzerland. This article is an open access article distributed under the terms and conditions of the Creative Commons Attribution (CC BY) license (https://creativecommons.org/licenses/by/4.0/).