1. Introduction
Precision Livestock Farming (PLF) [
1] is currently a hot research topic, and presents important prospects for the optimization of livestock activities in both the agriculture and livestock sectors [
2]. It relies on the sensing of a variety of processes using Internet of Things (IoT) techniques combined with analyses of their evolution, as well as the extraction of predictions for the future values of each process.
The use of inertial sensors to monitor animal behavior has been identified as being the most efficient way of doing so [
3,
4]. Such methodologies are inexpensive, not invasive, do not cause animal discomfort, and are highly efficient in many scenarios. On the basis of an analysis of the literature related to animal monitoring using wearable sensors, it is possible to identify a highly extensive set of work carried out, mostly on cattle [
5,
6], as well as on sheep [
7] and goats [
8]. These works analyzed the eating behaviors of animals, identified sets of actions (eating, brooding, resting, walking), social habits, and even issues related to animal health, by studying events related to animals such as parturition [
7,
9,
10], estrus [
11,
12], and health [
9,
10,
13]. Studies have reported the use of devices integrated into collars [
2], or attached to the animals’ legs [
8,
14], and were mostly carried out offline, due to the use of unsuitable loggers in communication systems capable of transferring information in real time to systems with the computational capacity to allow data analysis to be performed [
9]. These studies focused on the study of animal behavior during the day, since ruminants are considered diurnal animals, but the night period represents approximately half of animals’ daily lives, and thus their nocturnal behavior has a strong impact on their well-being and livestock outcome. Resting time impacts the energy expended by the animal, just as their safety impacts their well-being [
15].
A small number of studies have analyzed sleep, with the cycle having been characterized as being composed of phases of variable activity [
16,
17,
18], while Toutain et al. [
19], in a study that involved electrophysiological recording, described the states of vigilance as including awake, drowsy, slow-wave sleep, and paradoxical sleep, on the basis of duration and energy expenditure determined from respiratory exchange.
Smith et al. [
9] studied the behavior of 76 pregnant ewes fitted with a three-axis enabled collar system for up to 17 days, recording births during the field trials with day- and night-vision cameras to detect parturition time. They analyzed the changes in ewes’ activity, and measured their activity across time by computing the distance between activity distribution and baseline activity. The results showed that the best-performing algorithm variant had a Mean Absolute Error (MAE) of 5.33 h between the estimated values and human-registered values for occurrence of parturition [
20].
Williams et al. and Zobel et al. studied lying behavior [
21], but of goats, using rear left leg data loggers enabled with inertial sensors in video-equipped pens. They concluded that the loggers were able to efficiently record lying behavior in mature, pregnant, and younger goats, and they were able to identify left- and right-side lying positions of the animal, despite indicating reporting problems associated with the rotation of the sensor around the leg. They also monitored the lying behavior of 420 dairy goats with the same datalogger [
22] to study the relationship between the dry period and negative energy balance, and to determine whether changes in lying behavior were indicative of the metabolic status of dairy goats [
21]. They successfully validated data loggers for the identification of lying behavior in both housed [
21] and grazing flocks [
23].
Ruckebush et al. [
20] studied the changes in different components of the hypnogram of horses, cattle, sheep, and pigs in response to changes in the physical environment, social context, and diet. He studied four-year-old adult sheep in borderer metabolic cages and performed several experiments with animals, studying the effects on the animals’ hypnogram and behavior. He reported sleep profile disturbances caused by feeding changes, and that after full adaptation to the test environment, they did not report significant changes in behavior caused by the lack of laboratory activity on weekends. He also reported that after the first five-day habituation period, the presence of drowsiness increased due to the security in the stall environment. Morag reported a similar effect of dietary change on sheep sleep in a previous study [
24].
Hazel et al. [
16] studied the sleep–wake patterns in 21 fetal lambs through intrauterine monitoring of electrocortical activity. Their study reported sleep pattern differences between fetal lambs and adult sheep, and they noted a change in sleep–wake patterns occurring in the third trimester in fetal lambs, although this could be considered to be due to quantitative changes in behavioral states and cycle duration that continue throughout the gestation period.
Most studies regarding the nocturnal period involve the use of invasive techniques such as electroencephalograms, and changes in the resting environment, daily activity, or feeding of the animals, ultimately influencing their behavior and activity. The use of wearable sensors allows the animals’ daily habits to be maintained, allowing the animals’ activity to be recorded in a non-invasive way, with no impact caused by the monitoring process. Is the use of wearable sensors a viable technique for the characterization of nocturnal activity?
The present work consists of a preliminary study, performed with a small number of animals, to validate inertial sensors for the evaluation of animal activity during the night period. Specifically, through the monitoring of inertial data. The goal of this monitoring study is to infer energy expenditure at night and to detect phenomena related to abnormal nocturnal activity. A publicly available dataset related to animal monitoring at night (gathered in previous work) [
25] is analyzed in order to characterize rest and activity periods, and their lying habits.
The rest of this document is organized as follows. In
Section 2, we describe the materials and the methods used. The results are presented in
Section 3.
Section 4 discusses the results, comparing them with related results presented in the literature. Finally,
Section 5 concludes the paper by presenting conclusions and identifying future work.
2. Materials and Methods
The present study made use of a publicly available dataset [
25] created using iEwe from iFarmTec collars (
http://ifarmtec.pt/produtos.html, accessed on 11 November 2022), applied to 18 female sheep (
Ovis aries) of the Serra da Estrela autochthonous breed, between 18 November 2021 and 16 February 2022. The study consists of an activity analysis during the nocturnal period to detect activity patterns and their intensity. In accordance with [
25], animals were collected, milked, and taken to a closed compartment at 18:00, after the space had been prepared and food had been placed there. After that, they were closed in until the handler staff returned the next morning, at which time they were taken to be milked, and later they were released in the pasture meadow. During the night there was no human intervention, and since the space is in an uninhabited place, there was no disturbance of any kind.
2.1. The Dataset and the Flock
The data structure includes a timestamp, accelerometer (Dx, Dy, and Dz) data, pitch and roll angles, the distance between the collar and the ground as measured by ultrasound, and behavior classification as performed by the collar (i.e., standing, eating, moving, running). The data were sampled at intervals of 10 s and periodically reported from the collars to a central gateway [
26] that stored the data.
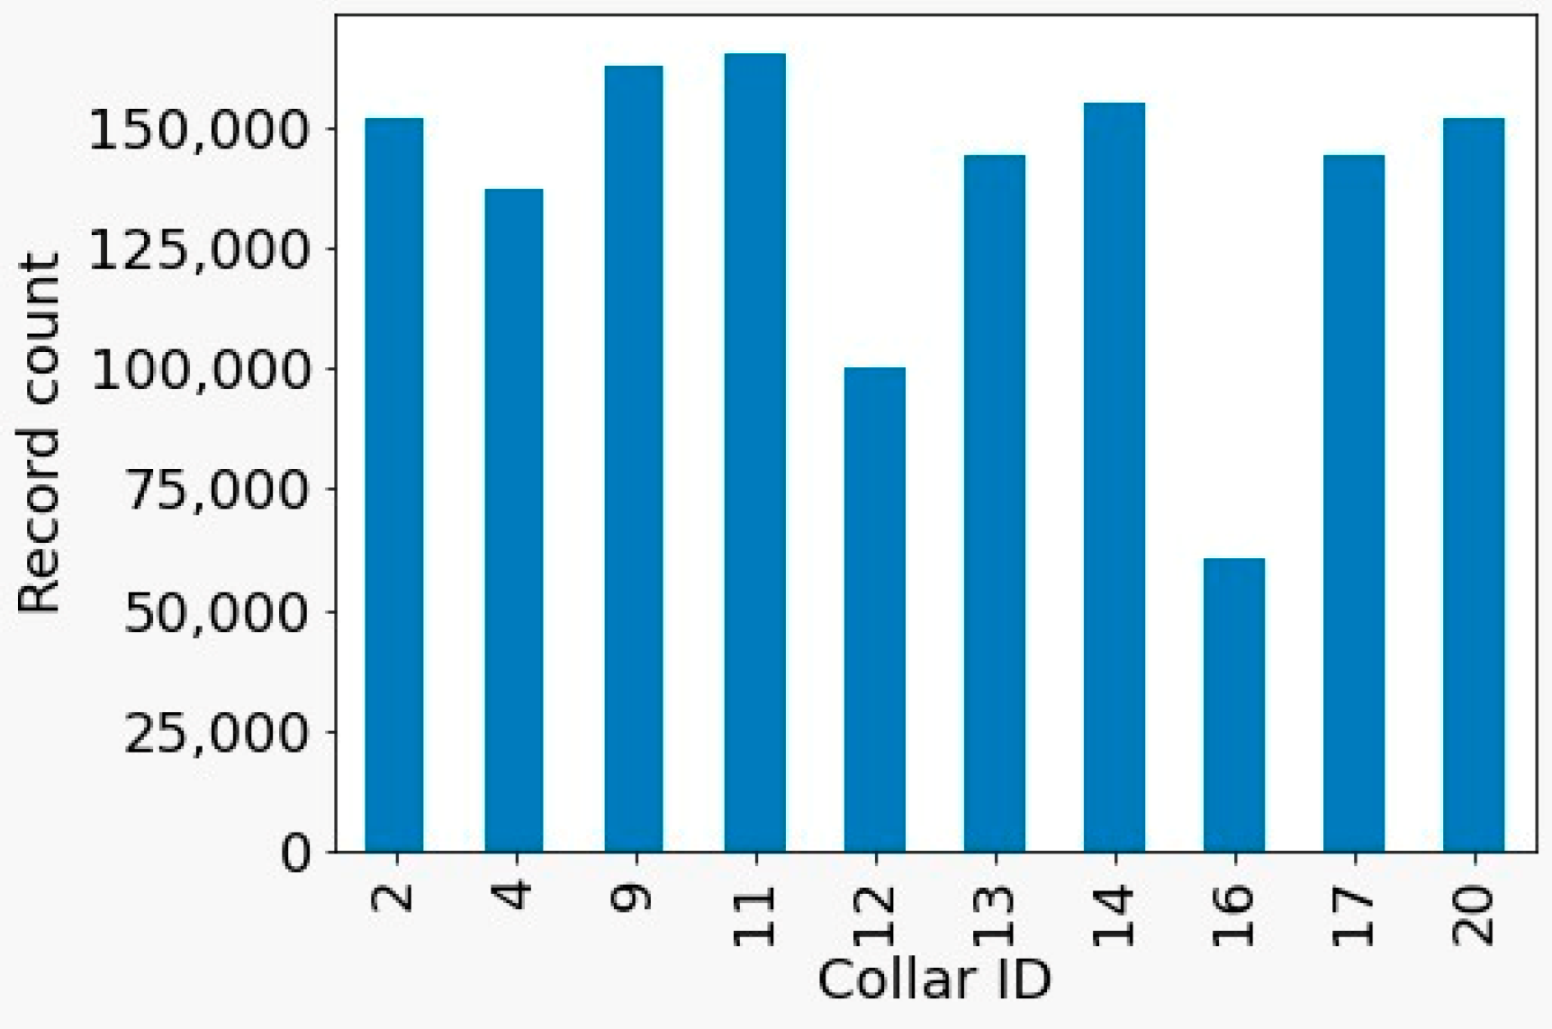
Most collars recorded the animals’ activity for more than 200 h (see
Figure 1), and most records corresponded to the night period during which the animals were stabled. To standardize the analysis process, collars with fewer than 100 h of data (i.e., 1, 5, 8, 10, and 15) were excluded from analysis.
2.2. Data Processing
In contrast to electrocorticography-based approaches [
19,
27], in the present study, animal activity was analyzed on the basis of collar sensors, so we defined activity indicators based on accelerometer intensity, also usually referred to as Dynamic Body Acceleration (DBA) [
28,
29]. Two DBA metrics are typically applied when studying animal activity, the first of which, according to Wilson et al. [
29], is the Vectorial sum of Dynamic Body Acceleration (VeDBAtwo), which is most suitable for the analysis of animal movement, and can be defined as shown in Equation (1).
The second one, Overall Dynamic Body Acceleration (ODBA), is most suitable for estimating energy expenditure, and can be described as shown in Equation (2).
Given the still exploratory nature of the present work, the MDA metric used was VeDBAtwo. To guarantee the presence of the animals in the sheepfold, and to obtain uniform duration intervals, in our analysis, we only used records gathered between 18:00 and 9:00. DBA values were plotted over time and we looked for activity patterns that correspond to those documented in the literature [
16,
19], with cycles of activity interspersed with periods of rest and inactivity.
Having confirmed the presence of activity indicators like those described in [
30], the data were then statistically analyzed. Based on the activity level, we identified the activity changes in order to characterize the rest cycles, and their durations were analyzed, the number of cycles per night was counted, and the laterality of the movement (get up, lie down) was verified, as well as the laterality of the period in which the animals were lying down. The code used for this analysis is available here (
https://github.com/ATNoG/sheep, accessed on 11 November 2022).
The statistical analysis was straightforward: based on the activity value computed by Equation (1), we defined a filtering system based on two thresholds. For each sheep, and for each night, the activity value was selected, and the 40th and 80th percentiles were computed. Any activity value below 40% was considered to represent sleep, and any activity value above 80% was considered to be awake. Activity values in between represented soft activity or sleeping, and were not considered. Alongside the dataset, two weeks’ worth of footage was recorded of the sheep within the compartment. The thresholds were defined by manual inspection of a sample of the dataset corresponding to the weeks that were recorded. It is also important to point out that the threshold was applied equally to all sheep, and we did not compute thresholds individually for each sheep. The focus of the work was on showing that external monitorization of sheep can yield the same results as other (more intrusive) methods.
Two smoothing filters based on the Exponential Moving Average were applied to account for rash movements and the sensitivity of the sensors.
A similar analysis was performed in order to verify from which side the sheep get up. Instead of using the previously mentioned thresholds, the accelerometer roll angles were considered, which had a range of [−10, 10] degrees. Any values exceeding this range were classified as indicating left or right, respectively. If the roll value was within the range, it was classified as the center.
Finally, the average (±standard deviation) time that sheep spent in each state was calculated, as well as the time they spent lying on each side.
3. Results
The activity analysis of the animals during the night period allows us to verify several periods of inactivity interspersed with periods of activity [
16,
17,
18,
19]. As an example,
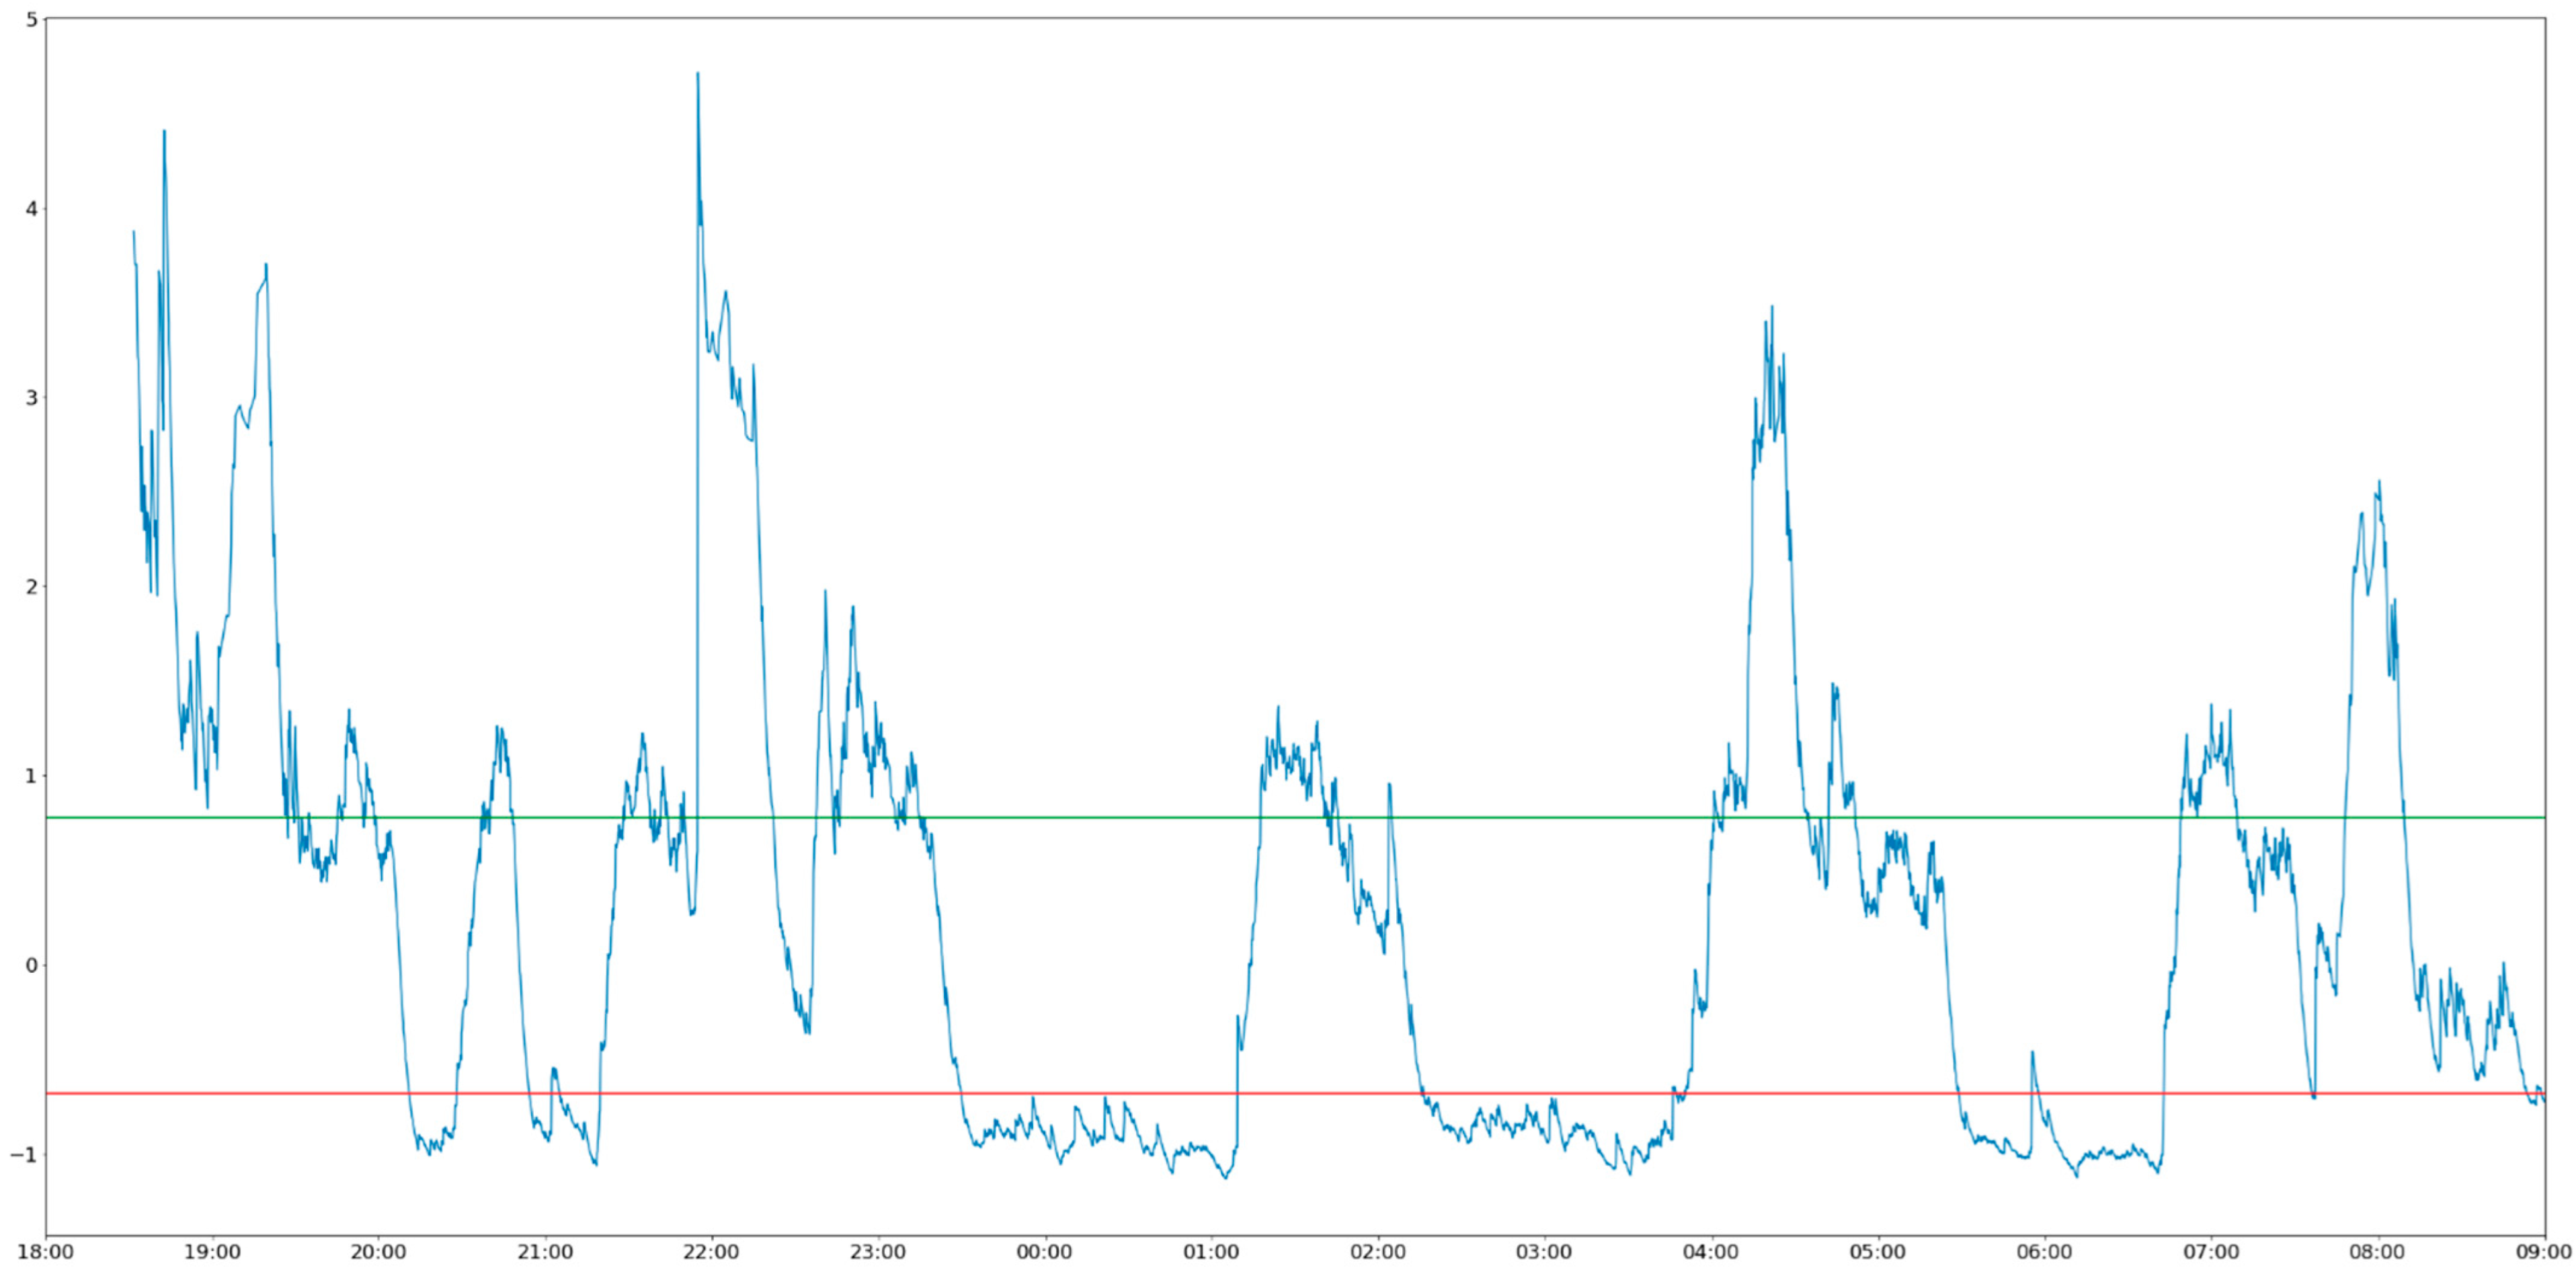
Figure 2 illustrates the activity diagram of the sheep wearing collar 2 between 6:00 p.m. on 6 December and 9:00 a.m. on 7 December.
On the basis of
Figure 2, alternating periods of rest and activity can be observed following the stabilization of the herd occurring after 20:00. The periods between 22:30 and 1:00, between 1:00 and 4:00, and between 4:00 and 7:00 are especially clear. It is important to mention that the activity values (defined using Equation (1)) were standardized by removing the mean and scaling to unit variance. The same standardization was applied to the results presented in
Figure 3.
Activity monitoring makes it possible to detect differences in patterns, detecting events such as lying down and getting up. Animals’ movements correspond, in terms of the monitoring performed by the sensors, to a peak of activity detected by the inertial sensors, corresponding to a slight increase in the distance between the sensor and the ground, as measured by ultrasound.
Table 1 shows the results for the number of movements counted for each animal. In the period under analysis, the sheep laid down and got up on average 8 ± 3 times each night.
An analysis of the dataset makes it possible to analyze the laterality of the acts of lying down and getting up during the period under examination. In the present study, we defined an interval in the lateral inclination (roll) angle of the collar, and we determined the laterality of the acts of getting up and lying down, as well as the laterality during the period in which the animals were lying down. This analysis showed that there was a pattern leaning mostly towards the center, with a smaller number of cases to the left side, both when lying down and when getting up.
The rest periods begin with lying down movements, but continue with periods of immobilization of the animal corresponding to low activity values.
Table 2 shows the daily average of the number of rest cycles and their duration in terms of the durations of both rest and active periods, obtained through the number of surveys detected during the 45 days of monitoring.
An analysis of the present dataset made it possible for us to measure the average inactivity duration per resting cycle as being 38.65 ± 20.33 min, while the average active duration per resting cycle was 28.48 ± 19.82 min. A statistical interpretation of the data clearly demonstrates the limitations of the sample, given that the amplitude of the standard deviation is greater than the average of the values, which is understandable, since the study was based on records acquired using just 10 collars. The values do not follow a Gaussian curve, so obtaining accurate averages requires that more tests be performed, with more animals.
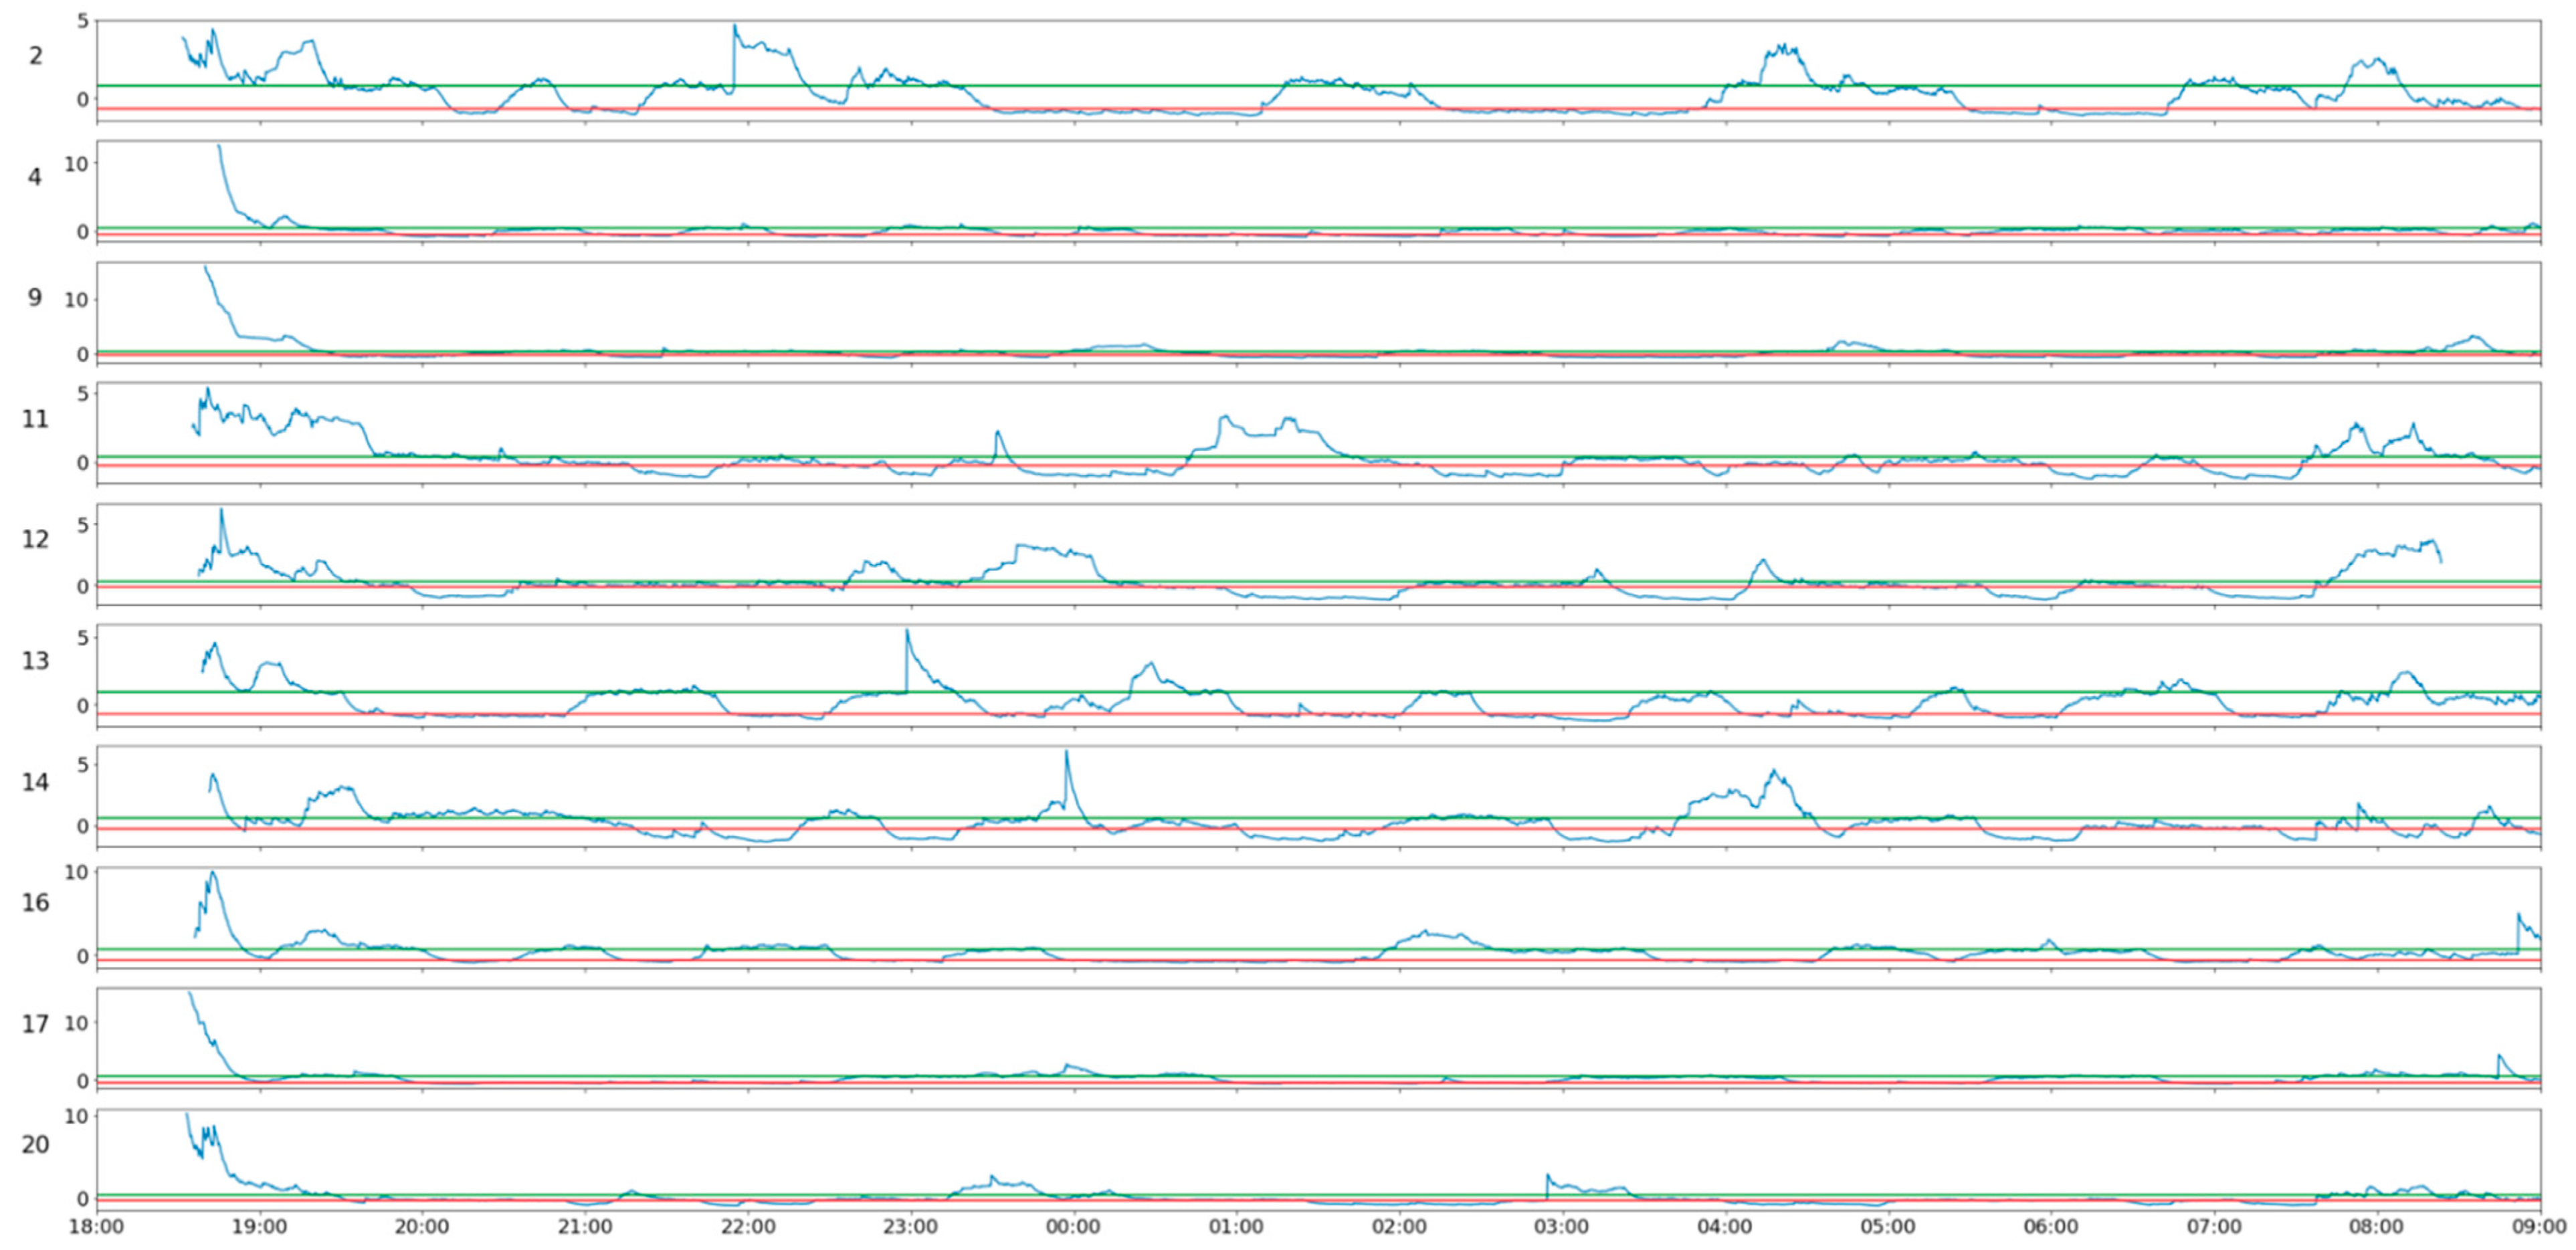
The joint analysis of the activity of the whole herd, illustrated in
Figure 3, makes it possible for us to identify significant differences in the amplitude of the activity peaks between different sheep, and that these activity peaks do not occur at the same time. Ignoring the initial period until approximately 20:00, when the animals are probably still eating and the herd is stabilizing, the analysis presented in
Figure 3 allows us to verify that individual periods of activity occur in a desynchronized way, with each animal getting up at its own time, while the others remain inactive.
The activity over the period is not constant, either in terms of when the animals are standing up or when they are lying down, so the analysis presented in
Figure 3 does not facilitate the identification of the individual activity of each animal over time.
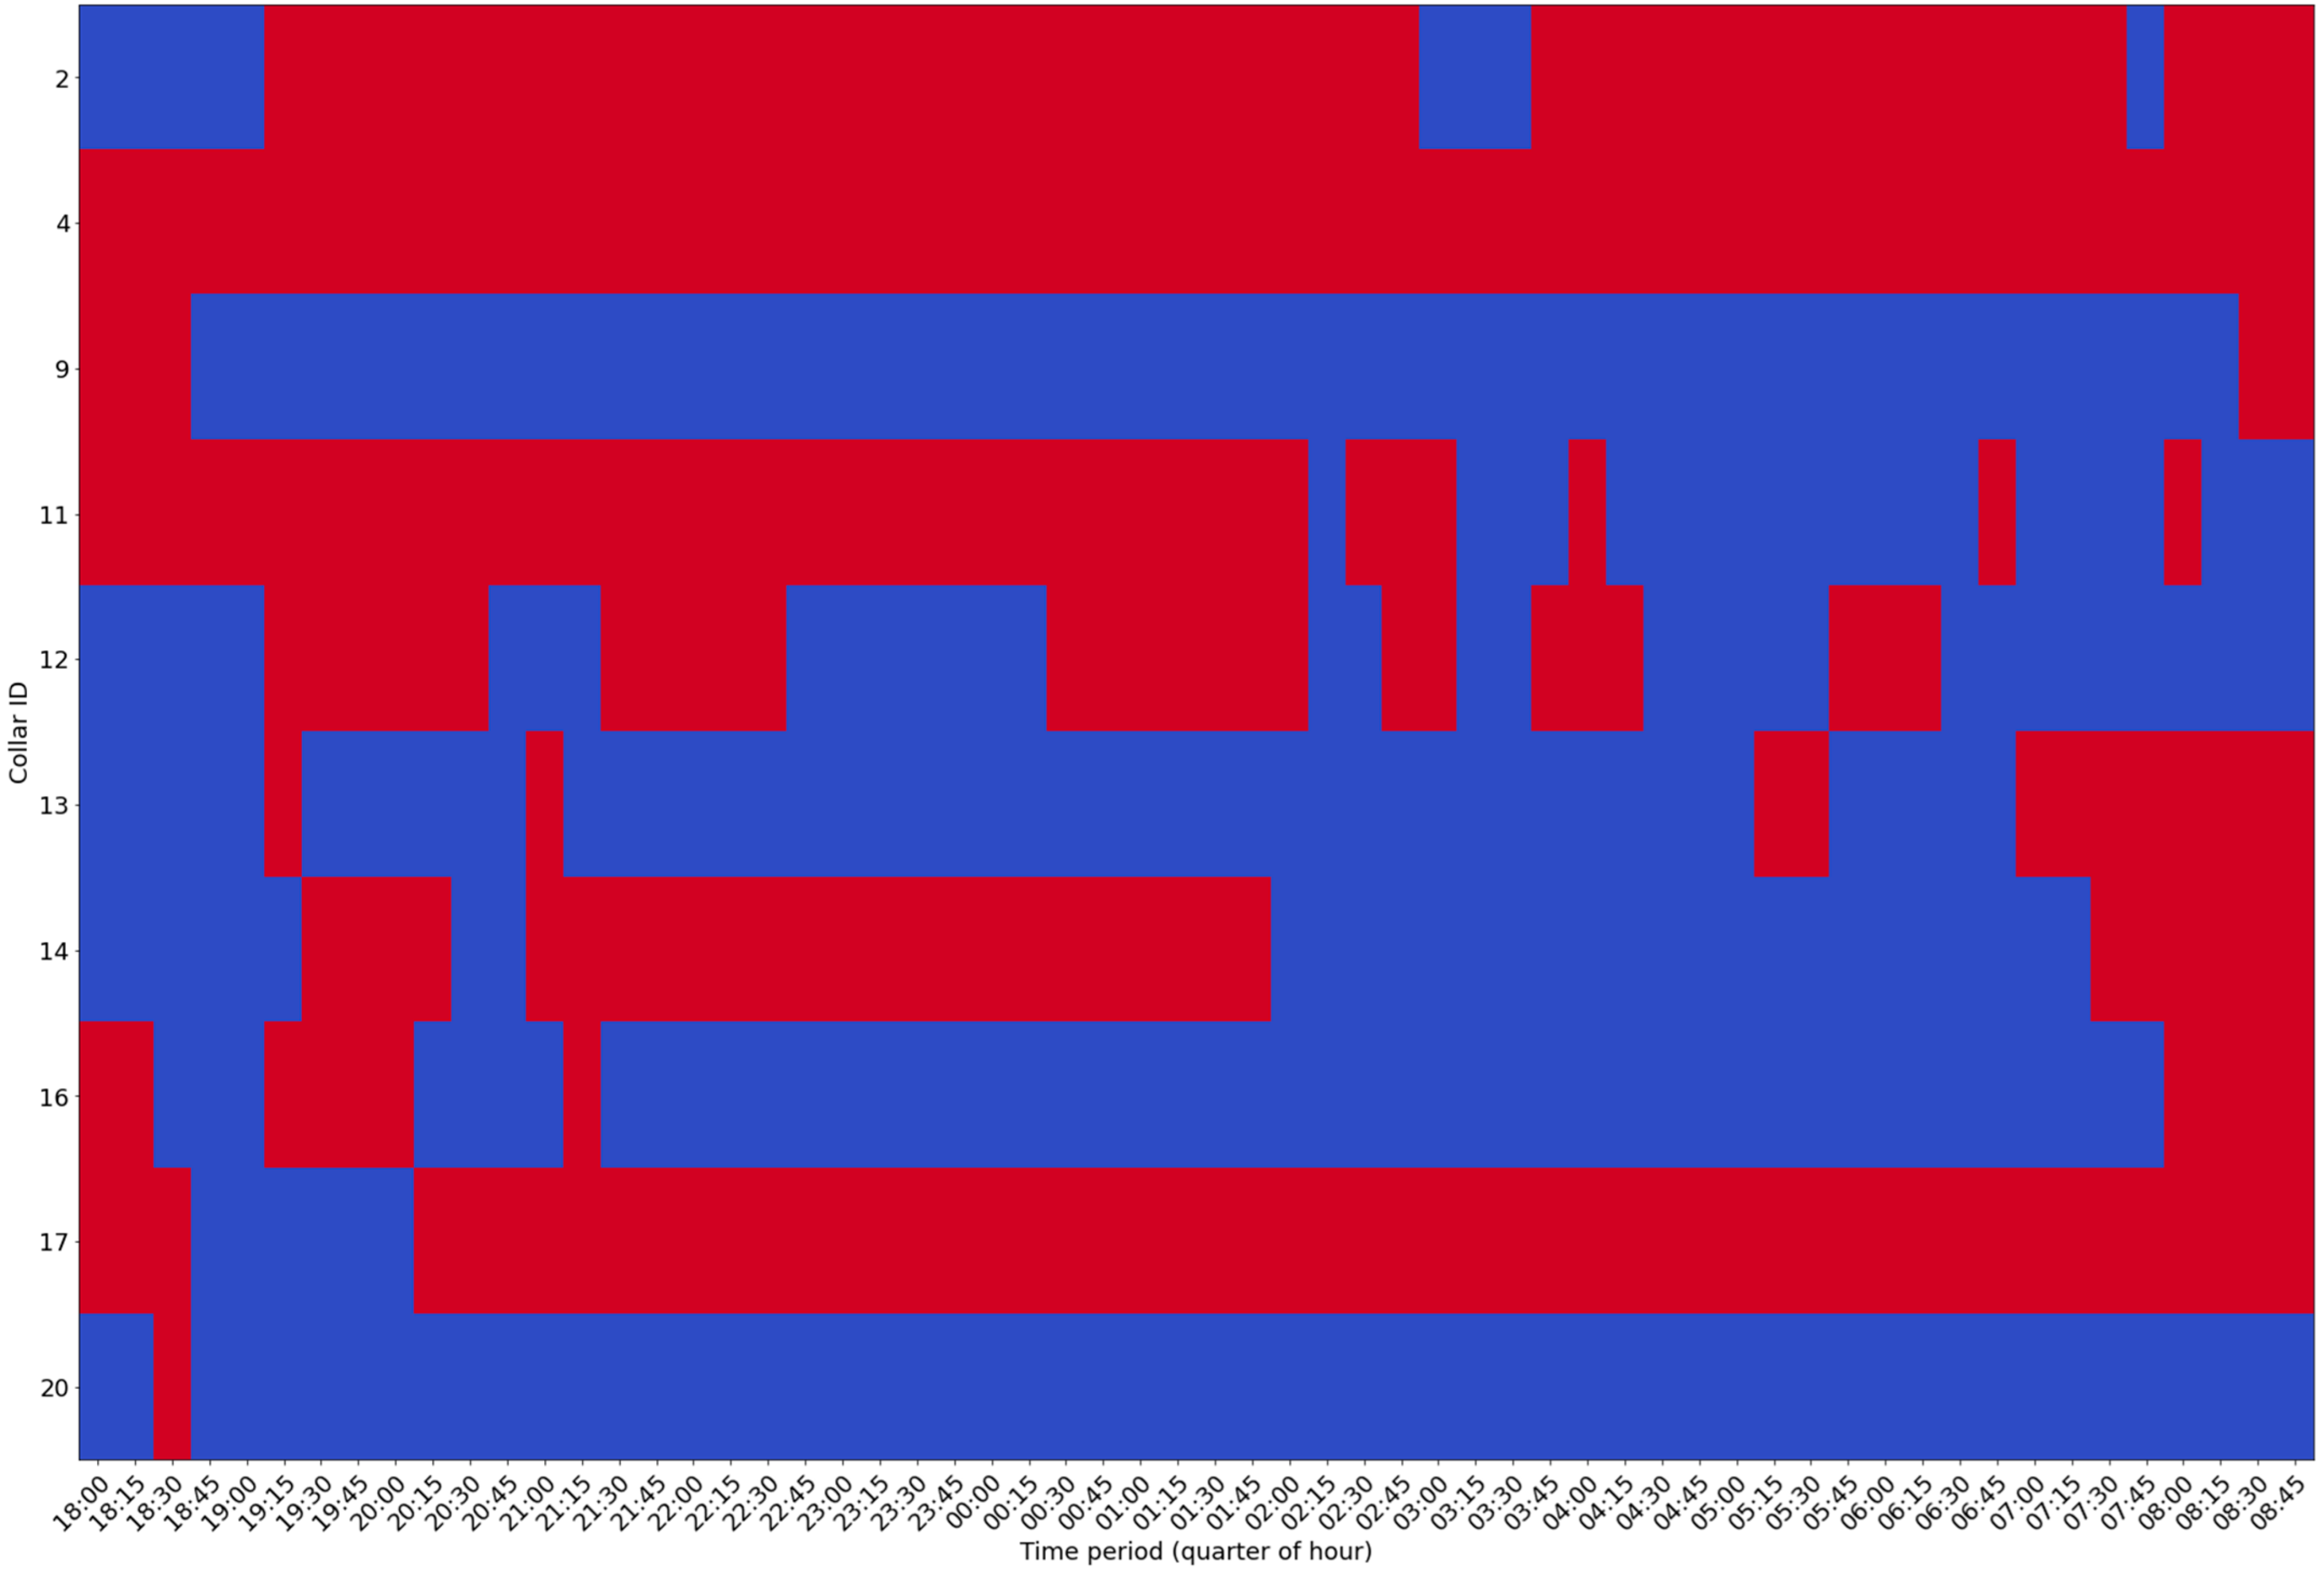
To identify the individual activity of each element of the herd, and to visually identify those moments, we processed the data that were used to generate
Figure 3, aggregating the data every 15 min and deciding on the basis of the majority the status of each animal in each of the moments. More details of the processing algorithm can be obtained by examining the code shared in the repository. Each interval generated in the aggregation process, from each of the sheep, was then drawn, and the image presented in
Figure 4 was created.
A caveat must be made regarding the data from collar 4 which, due to an error in the collar, or the gathering process performed at the gateway, were erroneous, and the effect of this error is even more visible in the graph of
Figure 4, where it shows continuous activity all night.
4. Discussion
The analysis of the results allows us to confirm the existence of activity cycles composed of periods of activity and rest. There is great variation in the duration of the cycles among different animals, the durations of some of which are as much as approximately four times longer. Toutain et al. [
30] specified a set of times spent by sheep in various states (awake, drowsy, slow-wave, paradoxical) that sum up to 554 min in an inactive state within a 15 h interval for old thin animals and 606 min for old fat animals. On the other hand, Campbell et al. described the total sleep time for sheep as averaging 3.8 h (16%) per 24 h, 87% of which occurring at night [
31]. Anyhow, considering eight rest cycles per night, the period of inactivity would be in line with the times reported in the literature.
In addition to the variability among individuals in the flock, there is another possible explanation for the differences in the length of rest cycles. The literature indicates that rest time among sheep depends on the environment in which they are resting, and that periods of inactivity are shorter outdoors than they are indoors [
20]. In addition, there are even references reporting that rest time still depends on animals’ habits with respect to resting in a typical location [
20]. In contrast to the process when performing more invasive experiments [
16,
19], the sheep used in the creation of this dataset were kept in their usual resting place and maintained the routine of grazing and shelter [
25], which might have had an impact on the measurements. In addition, the dataset includes monitoring records of only 10 animals, which, despite being common in animal studies, is not a very representative sample.
The analysis of movements made it possible to determine the laterality of the lying-down and getting-up movements, allowing us to observe a consistent tendency among all animals to perform movements in the center, with a percentage of approximately 79%, with the remaining movements turning to the left side (20%), while movements to the right accounted for 1% of the observations. Observation also made it possible to verify that resting posture exhibited a very similar distribution of positions.
Although the obtained values are within the margins of error reported by previous studies, both in terms of the number of rest cycles and in the duration of activity and inactivity, the results reported in the present study fail to characterize the energy expended by the animals. The data obtained using inertial sensors did not allow us to differentiate between sleep phases [
17], which, according to Toutain et al. [
19], have different degrees of energy consumption. Therefore, the quantification of the energy spent by each animal during the complete cycle, and consequently during the nocturnal period, could not be performed. Additionally, this dataset does not include information regarding the individual weight of the animals, which is a value that was considered by Toutain et al. [
19].
The analysis of joint activity demonstrates the diversity of rest cycle duration, as well as the huge differences in activity amplitude among the different animals. Some animals, despite maintaining their activity cycles, they move around, producing much smaller values of acceleration in the accelerometer. The literature on the nocturnal activity of ruminants relates periods of nocturnal activity to vigilance states [
19,
20], allowing the animals to detect threatening events such as the presence of predators. The data in
Figure 3 are consistent with this thesis, as they confirm periodic activity phenomena, which may be related to this issue. An analysis of these data seems to show a kind of rotation in individual activity (
Figure 4), with some remaining active while others rest. This fact, combined with the surveillance states mentioned in the literature [
19,
20], and with the strong sense of group that exists in sheep, may be related to a collective mechanism of herd surveillance.
The last assumption obviously cannot be proved by the data studied in the present study alone for several reasons: (i) the animal sample consisted of just 10 animals; (ii) there were probably more animals staying overnight in the same space, which could participate in the guard process; and (iii) animals can remain alert despite remaining inactive.
5. Conclusions
The present study was an exploratory application analyzing the nocturnal activity of 10 sheep registered in a publicly available dataset. The dataset analyzed included monitoring data collected over 45 days, during the night period. A new and broader trial should be rolled out with an increased number of animals to allow more detailed statistical analysis.
A fundamental difference in the present activity study compared to the analyzed nocturnal activity studies is the non-invasive nature of the monitoring process. The present study focused on analyzing activity data obtained through wearable sensors, and therefore did not permit the differentiation of sleep states from other periods of inactivity, as has been performed in studies using more invasive methods. Animal activity was analyzed by recording the values measured by an accelerometer and a distance sensor, and the activity cycles of the animals were identified and characterized. Data analysis made it possible to identify periods of activity interspersed with periods of rest, and to confirm the cyclical character of these periods, as described in the literature. The results showed enormous variability with respect to the duration of active and inactive periods among animals, and even among different cycles of the same animal. Moreover, the results also showed significant differences in activity intensity among different members of the herd.
In general, the test results revealed a very high similarity with results documented in the existing literature, which were mainly obtained using invasive methods and expensive processes, thus encouraging the investment in activity monitoring methods based on inertial sensors. Specifically, according to Toutain’s work [
19], a typical cycle has a duration of 60 min, 46 of which are inactive, while the remaining 14 are active. These values are supported by our results. Unfortunately, the method of testing did not allow us to accurately measure the energy expended by the animals, due to the impossibility of identifying the various phases of the rest cycle, and because the animals were not weighed during the experiment. Even so, the information collected using the sensing platform could be used to feed machine learning processes, and while it does not give precise indications regarding energy expenditure by itself, differences from baseline can be easily identified. For example, by joining the VeDBAtwo metrics with individual weight data and/or milk production, and with information about daily feeding monitored by the collar, it would be possible to close the control loop of animals’ food processes, enabling the optimization of food management.
The energy consumption metrics defined in the literature for each of the phases of the sleep cycle may be a good starting point for establishing an average energy expenditure during the rest cycle and may allow the calculation of the energy spent during the night period. An additional period of monitoring is planned with more animals, while also analyzing other values such as the age, the breed, the weight of the animals, and the temperature, thus enabling the characterization of the energy expenditure of each animal throughout the night period. Another limitation of the present work has to do with the fact that it does not consider environmental factors, such as temperature, humidity, or rain; nor does it consider the density of animals in the same space. Future studies should include daily records of animals in the sheepfold, as well as correlating the weather data with the daily record of animal behavior.
Comparing the periods of activity among different animals of the same flock showed that the sleep cycles were out of phase, with periods of activity and rest that were not synchronized, which may be related to an attitude of vigilance typical of sheep and their strong sense of group, resulting in a kind of collective guard for the herd. Guard rotation is an assumption that requires more tests to be performed, with more animals, while ensuring that it is possible to monitor all of the animals present in the same space, in order to confirm or disprove the hypothesis.


