Abstract
Acoustic microimaging (AMI), a technology for high-resolution imaging of materials using a scanning acoustic microscope, has been widely used for non-destructive testing and evaluation of electronic packages. Recently, the internal features and defects of electronic packages have reached the resolution limits of conventional time domain or frequency domain AMI methods with the miniaturization of electronic packages. Various time-frequency domain AMI methods have been developed to achieve super-resolution. In this paper, the sparse representation of AMI signals is studied, and a constraint dictionary-based sparse representation (CD-SR) method is proposed. First, the time-frequency parameters of the atom dictionary are constrained according to the AMI signal to constitute a constraint dictionary. Then, the AMI signal is sparsely decomposed using the matching pursuit algorithm, and echoes selection and echoes reconstruction are performed. The performance of CD-SR was quantitatively evaluated by simulated and experimental ultrasonic A-scan signals. The results demonstrated that CD-SR has superior longitudinal resolution and robustness.
1. Introduction
AMI can evaluate the surface layer, sub-surface layer and internal structure of materials with non-destructive, precision and high sensitivity. It has been used in the fields of microelectronics [1], materials science [2], technical science [3], etc. AMI is particularly sensitive to area defects such as poor adhesion and closed cracks in multi-layer structures, making it especially suitable for failure analysis and reliability evaluation of electronic packages [4,5,6,7]. The thickness of each layer of an electronic package is about micron to sub-millimeter level. Considering the penetration depth and resolution, the ultrasonic frequencies required for electronic packages detection are 20–200 MHz. Recently, electronic packages have been evolving towards ultra-miniaturization and ultra-high density, which creates challenges for their AMI. When the thickness of the layer is less than or equal to the length of the ultrasonic wave, the echo overlap and waveform distortion of the adjacent interface are caused by insufficient longitudinal resolution. As shown in Figure 1, when the top and bottom layers of the die are detected, the top echo and the bottom echo are overlapped with other echoes. While increasing the ultrasonic frequency can improve longitudinal resolution, it also means greater attenuation and lower penetration. In addition, the attenuation of high-frequency ultrasound results in a relatively low signal-to-noise ratio [8].
Figure 1.
Scanning acoustic microscopy of electronic packages: (a) common structure of electronic packages; (b) acoustic microimaging (AMI) signal.
The above problems make the traditional time domain AMI methods no longer applicable, and the resolution limit of time domain AMI has been reached. Frequency domain AMI methods obtain single-frequency images by processing the threshold echoes through FFT, which can reveal some features and defects below the resolution limit of time domain AMI, but the improvement of the resolution is limited because of the spectrum overlap and frequency shifting [9,10]. Since ultrasonic echoes are non-stationary signals limited by time and frequency, the time-frequency analysis method is more suitable for the analysis of overlapping echoes [11]. Wavelet analysis-based deconvolution (WABAD) [12], continuous wavelet transform (CWT) [13], sparse representation (SR) [14] and other time-frequency domain AMI methods have been proposed to achieve super-resolution and high robustness. Among them, SR can adaptively select the atoms that match the signal from the atom dictionary and concentrate the information or energy contained in the signal on a few atoms, which can effectively reveal the time-frequency structure of the signal. Studies [13,15] have shown that SR has certain advantages in solving the above problems and has been applied to resolution improvement [10,16], noise suppression [17,18], pulse detection [15,19,20], blind source separation [21], multi-mode guided wave separation [22], etc.
The SR method uses an atom dictionary as a decomposition set [23], which is concise and adaptive. The key to successfully using the SR method is to select an appropriate atom dictionary [24]. Atom dictionaries can be divided into traditional dictionaries and learning dictionaries. The commonly used traditional dictionaries are the Chirplet dictionary [25], Daubechies dictionary [26] and Gabor dictionary [27,28], which show a strong resemblance to ultrasonic echoes. Traditional dictionaries contain extensive time-frequency features, sufficient diversity and high redundancy, which are not suitable for processing overlapping echoes. Lu et al. [24,29] proposed an adaptive and interpolated Gabor dictionary for the analysis of complex ultrasonic echoes. Researchers have proposed learning dictionaries, such as the ICA learning dictionary [8], FOCUSS-CNDL learning dictionary [30] and K-SVD learning dictionary [31], to obtain a more sparse representation. Learning dictionaries obviously match the echo better, but its versatility is poor and engineering implementation is also difficult. Furthermore, most of the existing studies address the overlap of two echoes [8,10,12,13], while there are few studies on the overlap of multiple echoes for electronic packages detection. In order to quantitatively discuss [14] the overlap of multiple echoes and effectively improve the longitudinal resolution, it is necessary not only to improve the matching between the atoms in the dictionary and the echoes before overlap [32], but also to improve the accuracy of the decomposition and reconstruction algorithm [33].
In this paper, the AMI signal model and sparse representation theory are reviewed, and a constraint dictionary-based sparse representation (CD-SR) method is proposed to achieve super-resolution and high robustness in Section 2. In Section 3, a simulation model of the electronic package is developed to quantitatively test and compare the performance of the traditional SR method and the CD-SR method. Experimental results for 20 MHz and 200 MHz are given in Section 4. We conclude in Section 5.
2. Materials and Methods
2.1. General Formulation
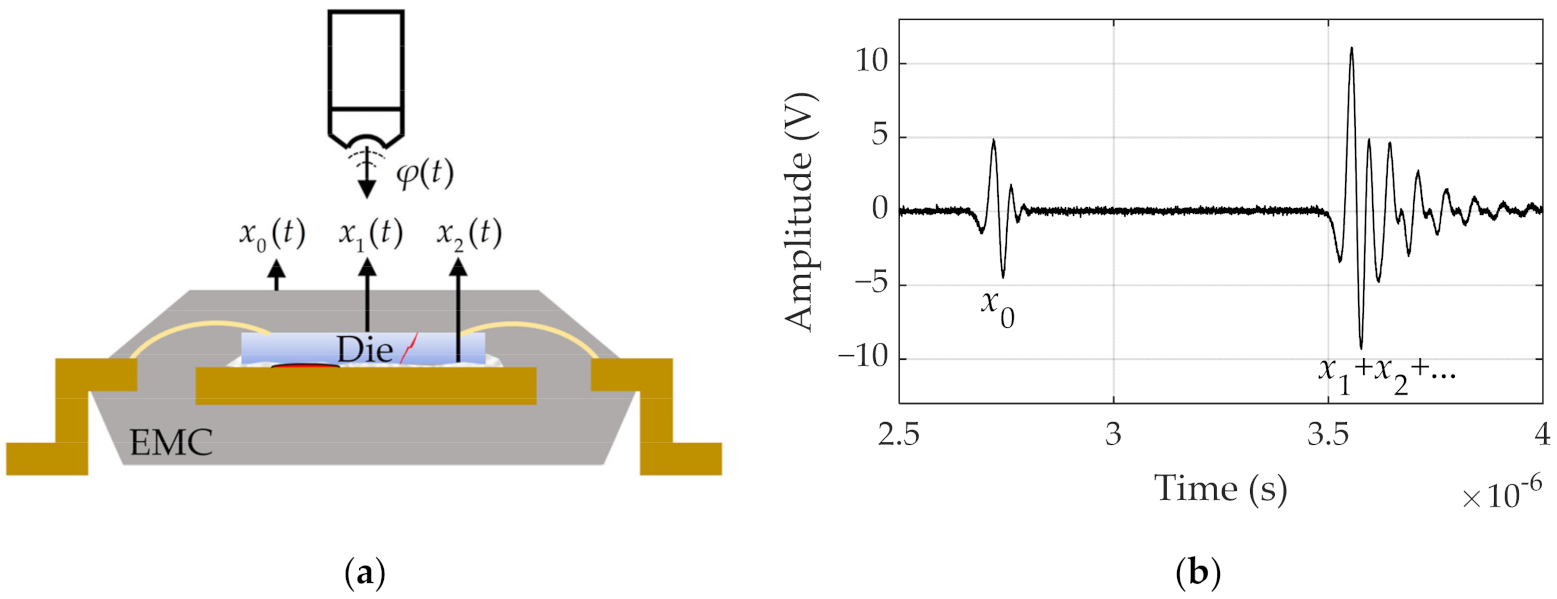
2.1.1. Acoustic Microimaging Signals Model
Generally, in a reflective ultrasonic detection system, the A-scan AMI signal can be expressed as a linear combination of reflected echoes from different interfaces in the sample, i.e.,
where is the noise from the detection system and material. In scanning acoustic microscopy, the shape of the ultrasonic wave will change during propagation due to focusing effects, frequency-dependent attenuation and microstructural scattering of the medium. At this time, the AMI signal can be written as:
where is the reflection coefficient, is the “quasi” incident pulse at the th interface, which is not a real incident pulse, but a pulse that includes dual-way transmission and attenuation. In the matrix format, Equation (2) becomes [8,10]:
In fact, the AMI signal is composed of a finite number of echoes, that is, is finite, so it can be assumed that the AMI signal has a sparse representation in the appropriate atom dictionary [34].
2.1.2. Sparse Representation
Sparse representation takes the form of adaptively selecting atoms in the atom dictionary to approximate the signal using a sparse decomposition algorithm. Considering the sparsity of the solution, decomposition speed and accuracy, Matching pursuit (MP) [27] is one of the most commonly used sparse decomposition algorithms. The MP algorithm is a greedy algorithm to find sub-optimal sparse decomposition locally. Given that the atom dictionary , is the atom, and is the parameter set, through orthogonal projection in the dictionary , is decomposed into [23,35]:
where , is the residual signal after is approximated in the direction. In order to make as small as possible, the atom should satisfy:
We perform decomposition times, then,
The atoms in the atom dictionary have localized characteristics in time and frequency. It is shown that the Gabor dictionary can simulate AMI signals well and is the most commonly used dictionary for processing AMI signals [10,15,29]. The Gabor dictionary is defined as [27]:
where is the Gaussian window function, is the time-frequency parameter, is the scale factor, is the displacement factor, is the frequency factor, and is the phase factor. In practical applications, is discretized as [27,36]:
where , , , , , , , . The number of atoms is determined by the signal length , and .
The energy of the echoes is mainly concentrated in small time-frequency subspaces, while the noise is distributed over the entire time-frequency plane. In the sparse decomposition process, the echoes are decomposed into several atoms, and the noise usually does not match any atoms. In order to achieve super-resolution and high robustness, the time-frequency window is determined according to the frequency of the transducer and the target interface or defect location in the sample. In addition, the atom with the center in the time-frequency window and the largest decomposition coefficient is selected. The selected atom and its decomposition coefficient are respectively used as the approximation of the incident pulse and the reflection coefficient [8,10].
2.2. Constraint Dictionary-Based Sparse Representation
Mathematically, the above Gabor dictionary is concise and complete. However, when dealing with overlapping echoes, the above Gabor dictionary contains quite a lot of atoms that do not match the actual echoes, which affect the calculation efficiency. In addition, the above Gabor dictionary may contain atoms that match the echoes after overlap, so that the echoes before the overlap cannot be distinguished and the improvement of longitudinal resolution is limited. In order to effectively improve longitudinal resolution, the CD-SR method is proposed. The constraint dictionary and algorithm design are as follows.
2.2.1. Constraint Dictionary
In order to constrain the time-frequency parameters of the Gabor dictionary so that the atoms match the echoes better, a reference echo is introduced. The reference echo is selected from non-overlapping echoes, as in Figure 1b, and can be taken as the reference echo, whose expression is adopted from the Gabor function, i.e.,
The time-frequency parameter of the reference echo are calculated. Based on the reference echo , the constraint method for the Gabor dictionary time-frequency parameters applicable to the electronic packages AMI is as follows.
- 1.
- When ultrasonic waves propagate inside an electronic package, absorption attenuation is dominant, and the transfer function is:
Therefore, the discrete range of the frequency factor can be constrained to , where is a constant less than 1, which is used to eliminate calculation errors and prevent over-constraining.
- 2.
- The full width at one-tenth maximum (FWTM) of the Gaussian window is about , and the duration of Gabor atoms in the time domain can be approximated by FWTM, that is, . Relating the scale factor to the frequency factor , can be expressed as:
- 3.
- The displacement of the reference echo is , so the displacement of the target echo is , where is the longitudinal wave velocity in the medium. Therefore, the discrete range of the displacement factor can be constrained to .
- 4.
- Due to the frequency-dependent attenuation of the medium, the target echo and the reference echo are no longer simply in-phase or anti-phase, but show a certain difference. Therefore, the dispersion range of the phase factor can be constrained to .
Figure 2 shows the spatial sampling of the frequency factor before and after the constraint. Before the constraint, the sweep interval of the frequency gradually becomes dense as the octave value increases. After the constraint, the sweep interval of the frequency is small and constant, and the frequencies of the atoms are close to the echo frequency. On the one hand, the calculation accuracy and efficiency are improved. On the other hand, signals with serious overlap can be separated.
Figure 2.
Spatial sampling of the frequency factor before (a) and after (b) constraint.
2.2.2. Algorithm Design
The sparse representation based on the constraint dictionary is equivalent to an approximate solution of the following optimization problem:
Its astringency has been be proved [27]. In this paper, the time-frequency parameters of the atom dictionary are constrained to form a constraint dictionary according to AMI signals. Then MP algorithm is utilized to adaptively choose atoms from the constraint dictionary to decompose the signal. Finally, atoms are selected according to the time-frequency window to reconstruct the echoes before overlap. The detailed algorithm design is as follows.
- 1.
- Initialization: given the overlapping AMI signal , the constrained Gabor dictionary and the residual signal threshold , set the initial solution support set and the initial residual signal .
- 2.
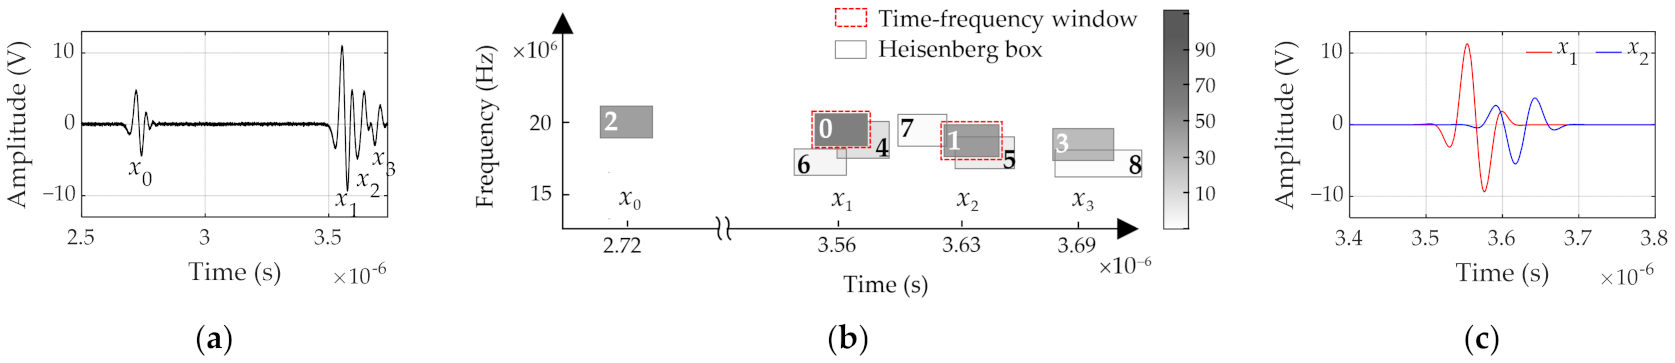
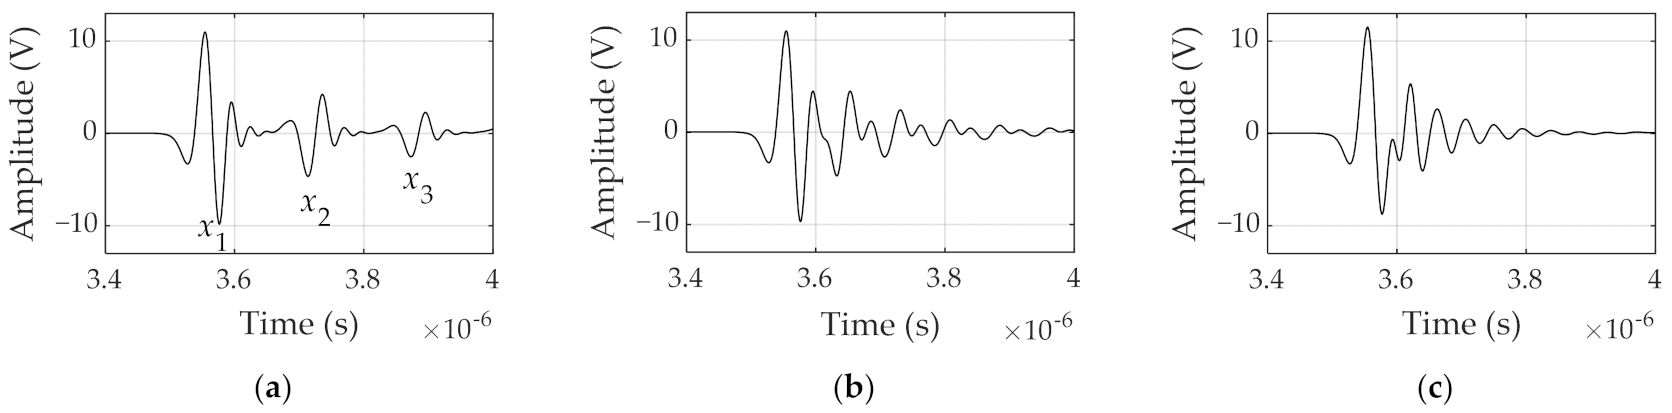
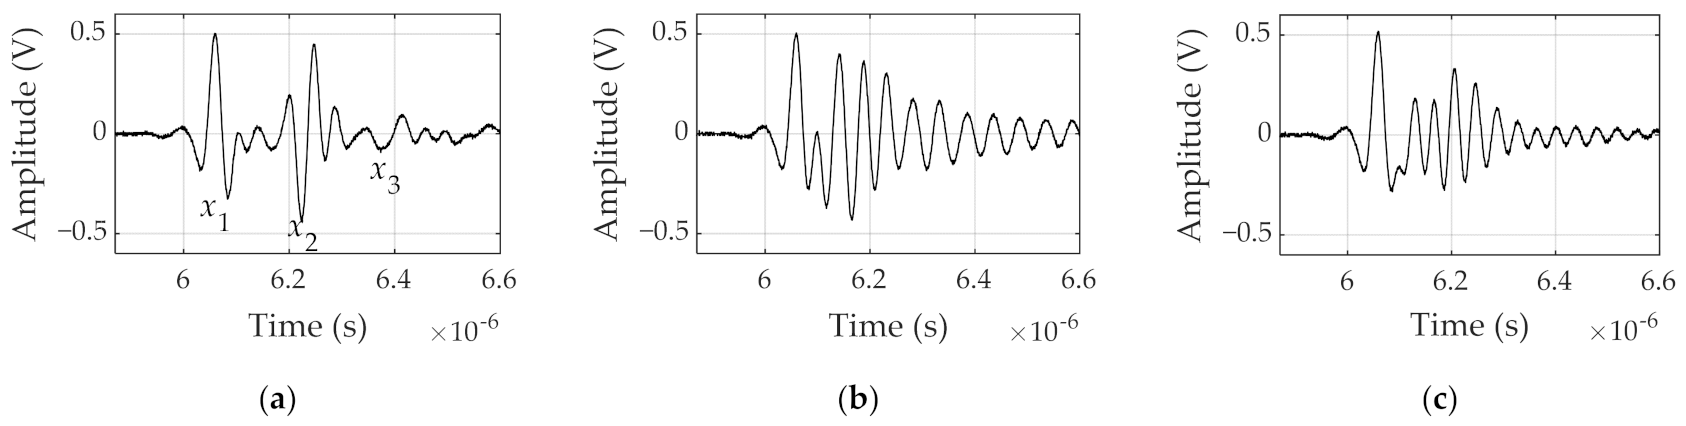
- Discretization of constraint dictionary: the AMI signal is exemplified in Figure 3a, where is selected as the reference echo and the target echoes are and . According to the constraints above, discretization is performed at a small discrete interval to achieve high resolution.
Figure 3. Sparse decomposition and echoes reconstruction: (a) AMI signal; (b) time-frequency diagram of atoms obtained by sparse decomposition; (c) reconstructed and . - 3.
- Matching pursuit ():
- (a)
- All the atoms are sequentially inner producted with the residual signal to find the atom whose decomposition coefficient satisfies , and update the support set . (Since inner product operations can be converted into a cross-correlation operation, FFT can be used to quickly implement cross-correlation operations to increase the calculation speed [23].)
- (b)
- Update residual signal: .
- (c)
- Stop condition: .
- 4.
- Selection and reconstruction:
- (a)
- As shown in Figure 3b, each atom obtained by the matching iteration is represented by a Heisenberg box, and the decomposition coefficient is represented by the darkness of the box. The larger the coefficient, the darker the box.
- (b)
- According to the target echoes and , atoms with the largest decomposition coefficients are selected as the time-frequency window, respectively.
- (c)
- The atom and its decomposition coefficient are considered as the approximation of the incident pulse and the reflection coefficient [8,10]. The atoms whose centers lie within the time-frequency window are chosen to reconstruct and before the overlap, i.e., , , resulting in Figure 3c.
- (d)
- Display the peak value of the target echo at each x-y position to generate a C-scan image.
3. Simulations
3.1. Simulation Model
As shown in Figure 4a, a simple model of scanning acoustic microscopy of electronic packages was established using PZFlex software (Weidlinger Associates, Los ltos, CA, USA), where the electronic package was simulated by Epoxy Molding Compound (EMC) and silicon die. The transducer frequency was set to 20 MHz, and the material properties are listed in Table 1. As shown in Figure 4b, the reference interface is the top layer of the EMC, corresponding to the reference echo , and the target interfaces are the top and bottom layers of the die, corresponding to the target echoes and , respectively. to are the multiple reflected echoes within the die. When the thickness of the die becomes smaller, to will all move toward , resulting in the overlap of multiple echoes. The degree of overlap is defined as the relative size of the overlap between and .
where is the thickness of the die, is the longitudinal wave velocity in the die, and is the FWTM duration of . When the thickness of the die is half-wavelength, that is, , the degree of overlap is zero. By changing the thickness of the die, different degrees of overlap between and can be simulated. Figure 5a–c are the cases where the overlap degree is −45%, 30% and 60%, respectively.
Figure 4.
Simple model of scanning acoustic microscopy of electronic packages (a) and AMI signal (b).
Table 1.
Material properties.
Figure 5.
AMI signals with different degrees of overlap: (a) ; (b) ; (c) .
3.2. Simulation Results
3.2.1. Longitudinal Resolution
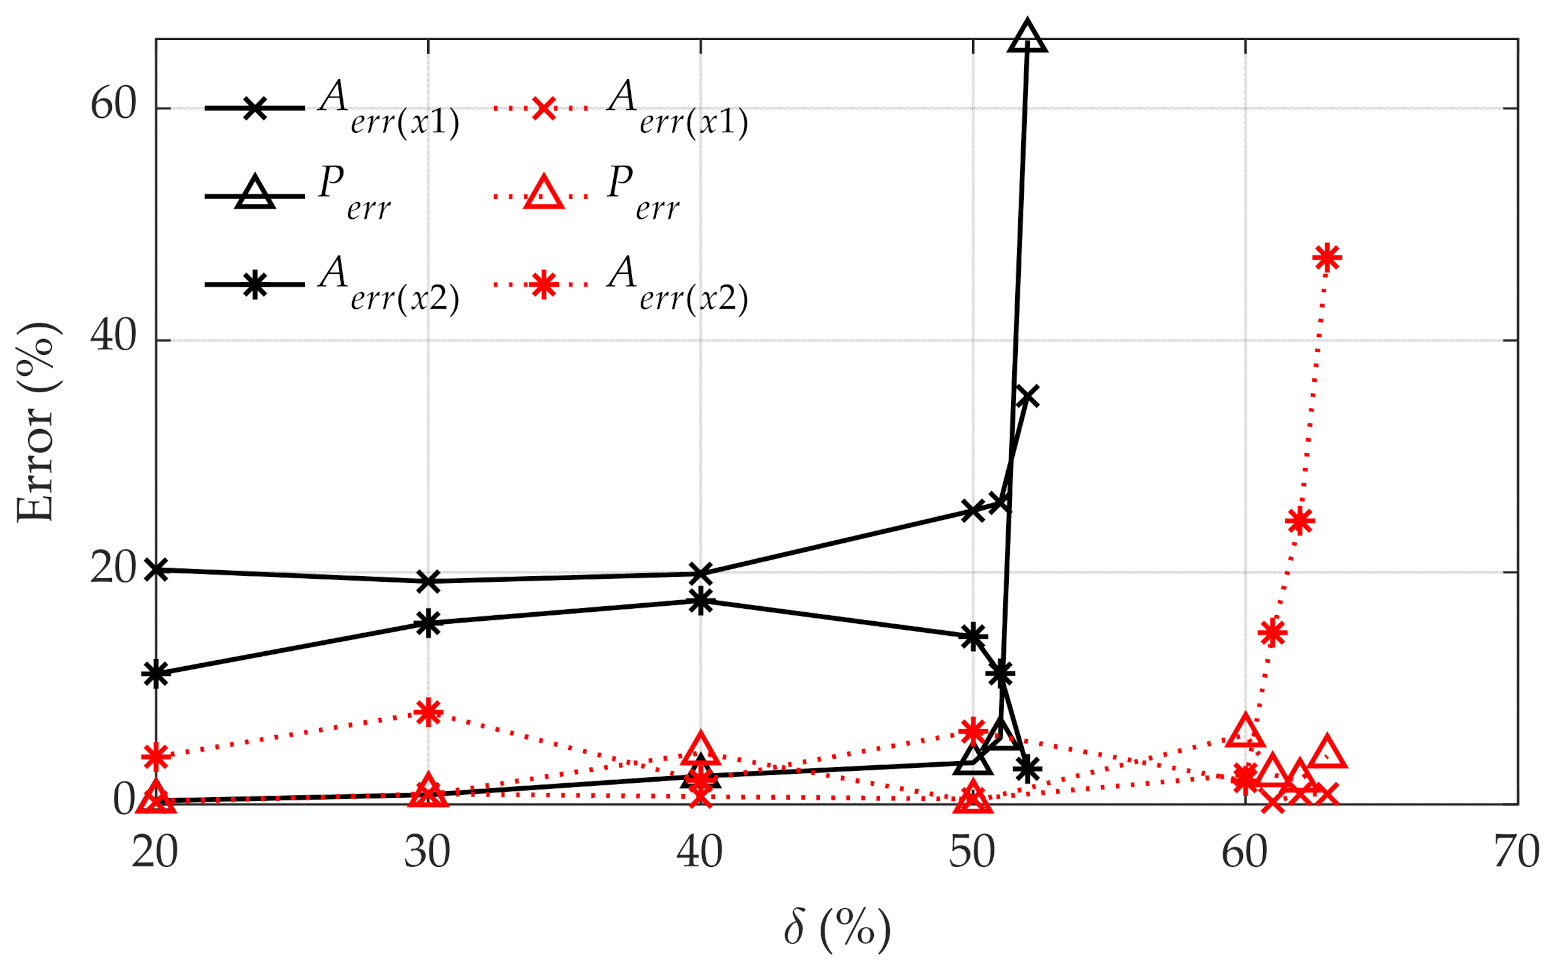
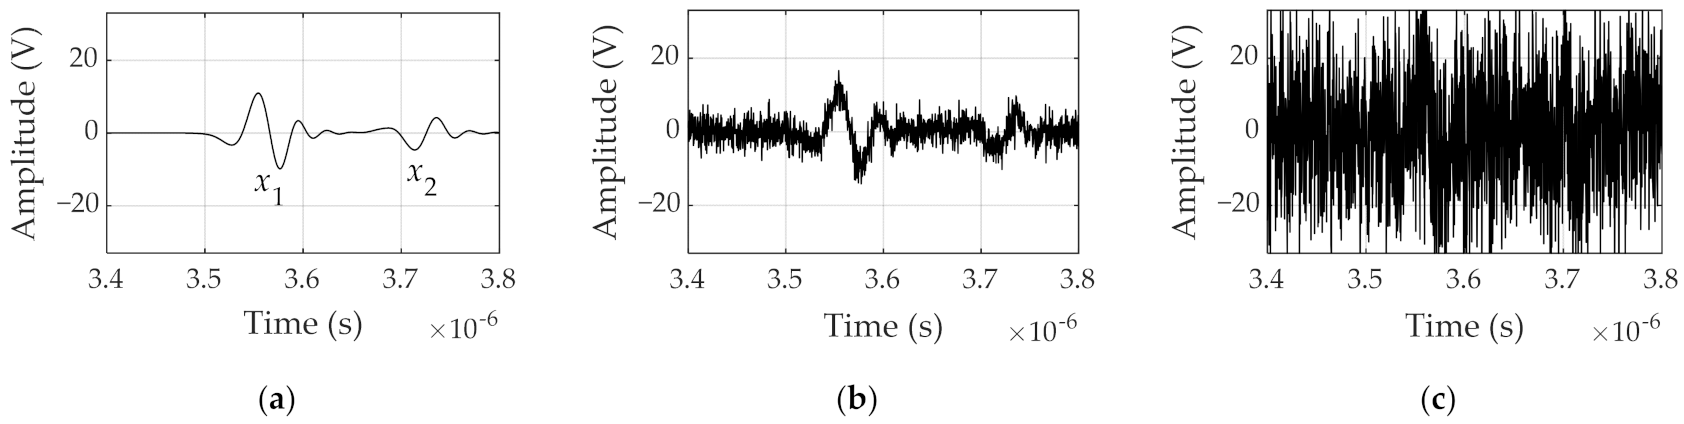
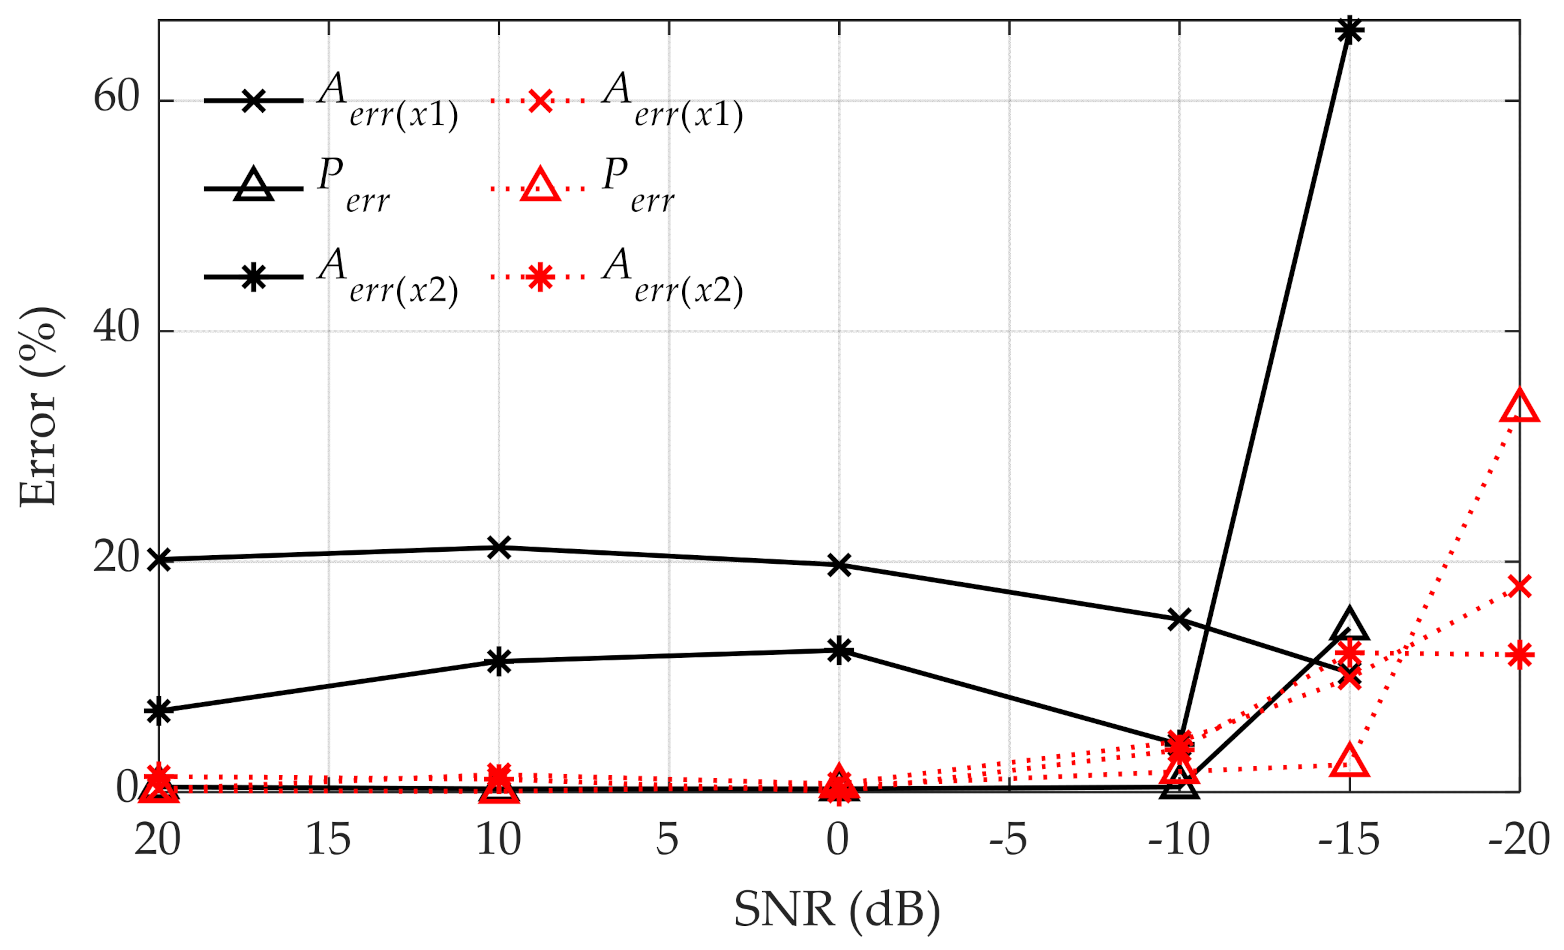
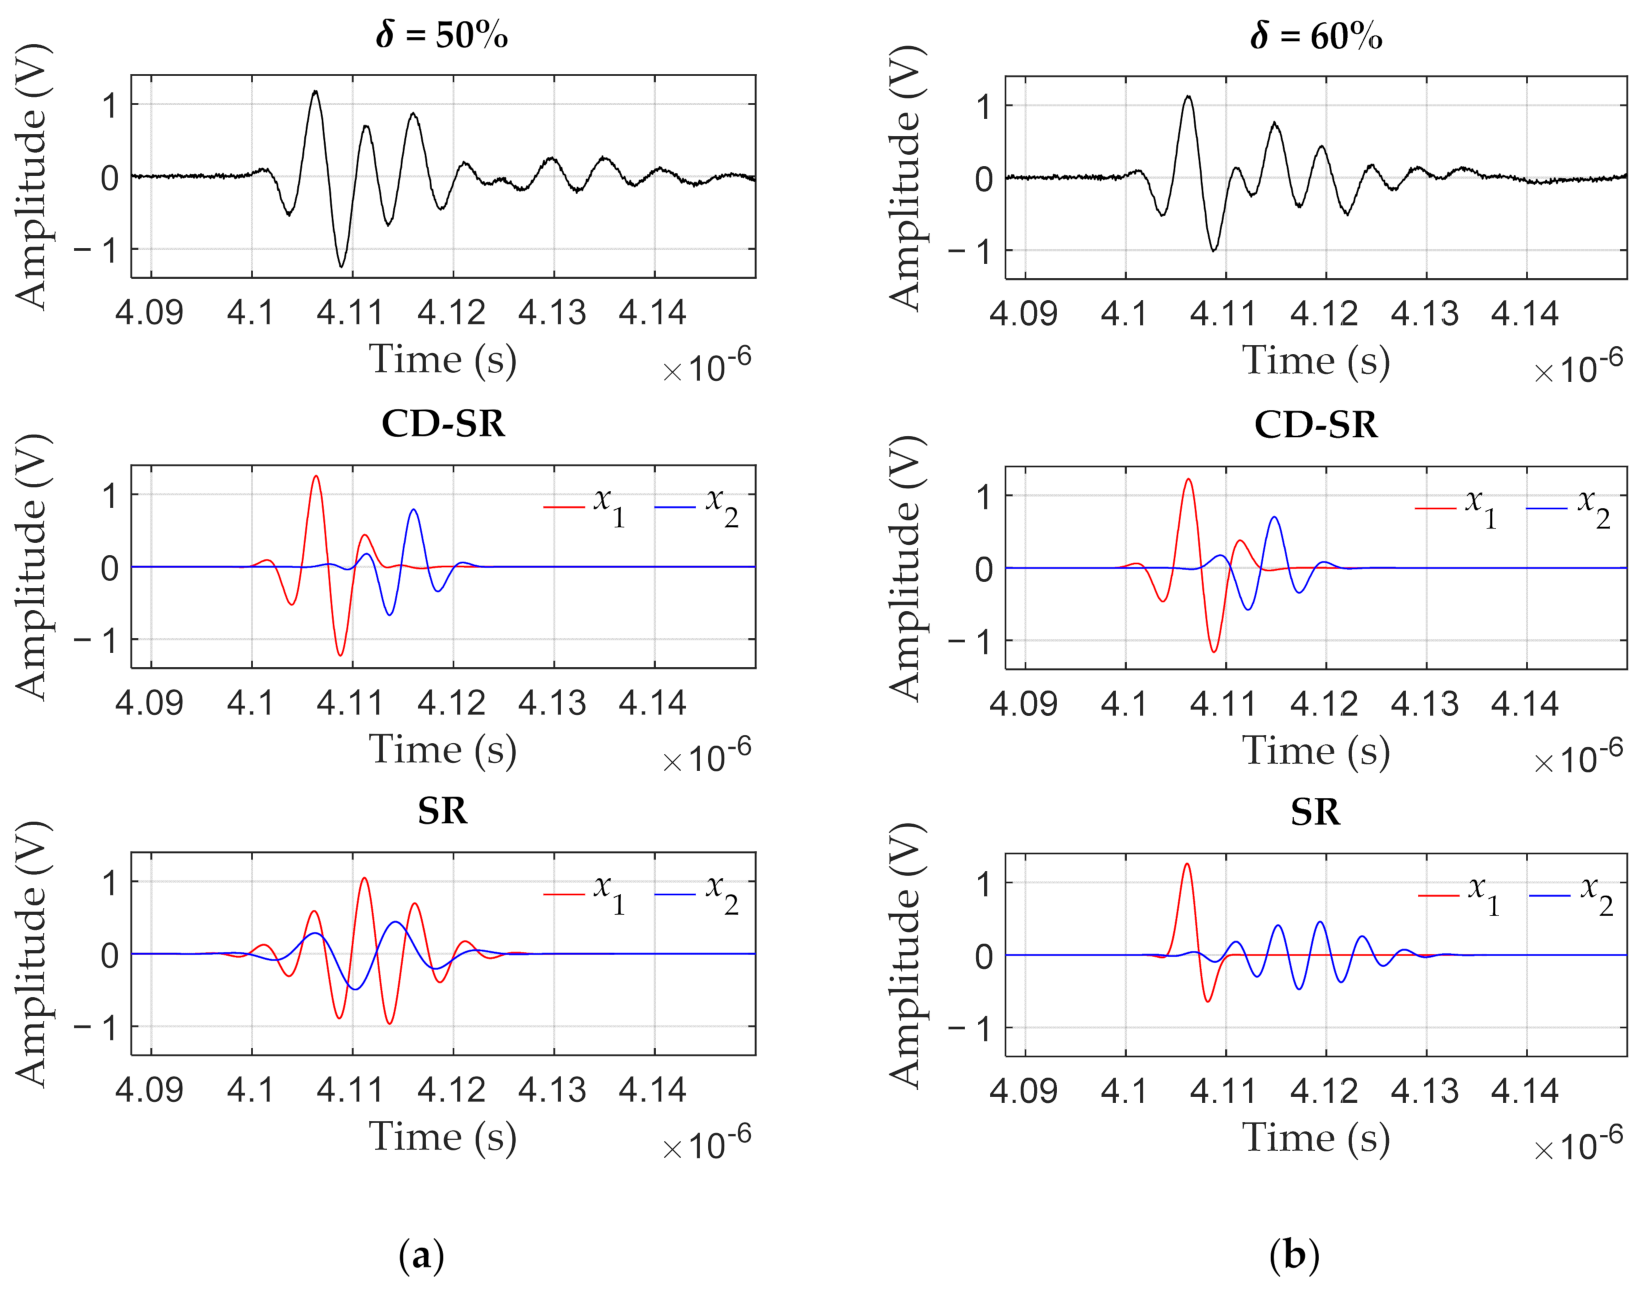
AMI signals with different degrees of overlap can be obtained by the above simulation model, and are used to test the performance of SR and CD-SR methods in improving the longitudinal resolution. To quantitatively evaluate the performance, the amplitude error and the position error of the reconstructed echo are used, which are defined as:
In the case of an equal number of dictionary atoms, the results is shown in Figure 6, where and are the amplitude errors of and , respectively, and is the error in the relative positions of and . The simulation results demonstrated that CD-SR has a better ability to distinguish overlapping echoes, and can distinguish and reconstruct echoes with overlap less than 63%. SR can only distinguish echoes with overlap less than 52%, and the amplitude error and position error are relatively large.
Figure 6.
Comparison of errors (Red: constraint dictionary-based sparse representation (CD-SR), Black: sparse representation (SR)).
In addition, the waveform characteristics of the reconstructed echoes are compared. When , the comparison result is shown in Figure 7a. It can be observed that the waveforms of and reconstructed by CD-SR are more consistent with the actual waveforms (see Figure 5a), while SR has a larger error. Figure 7b shows the reconstruction results when . The waveforms obtained by CD-SR still match the actual waveforms, while SR can no longer successfully separate the overlapping echoes.
Figure 7.
Comparison of reconstructed echoes: (a) ; (b) .
3.2.2. Robustness
The noise problem of scanning acoustic microscopy is more prominent than traditional ultrasonic testing. In order to test the robustness of SR and CD-SR, zero-mean Gaussian white noise was added to the AMI signal to construct AMI signals with different signal-to-noise ratios. Figure 8a shows and without noise. After adding noise, as shown in Figure 8b,c, the signal-to-noise ratio is 0 and −15 dB, respectively.
Figure 8.
AMI signals with different signal-to-noise ratios (SNR): (a) ; (b) ; (c) .
The comparison results are shown in Figure 9. Compared with SR, CD-SR has smaller amplitude error and position error in reconstructing echoes, and is more robust for cases with poorer signal-to-noise ratio. In the case of a signal-to-noise ratio of −15 dB, the reconstructed echoes are shown in Figure 10. The waveforms obtained by CD-SR are still consistent with the actual waveforms (see Figure 8a), but SR can no longer successfully separate the echoes.
Figure 9.
Comparison of errors (Red: CD-SR, Black: SR).
Figure 10.
Comparison of reconstructed echoes ().
4. Experiments
4.1. Conventional Experiment
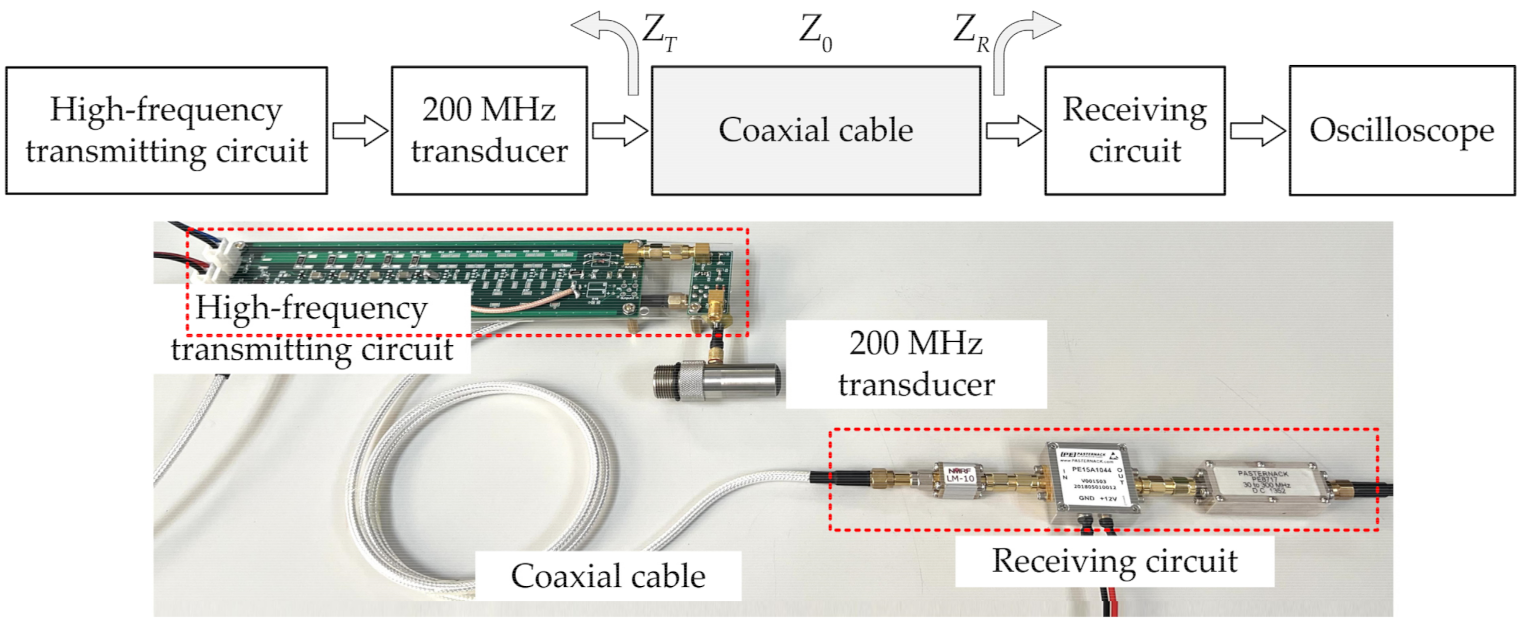
4.1.1. Experimental Setup
In order to verify the performance of the SR and CD-SR methods, an experimental platform consistent with the simulation was established. As shown in Figure 11, the Olympus V316 20 MHz (Olympus NDT, Waltham, MA, USA) focused transducer was excited with an Olympus 5800 Pulser-Receiver (Olympus NDT, Waltham, MA, USA) and the signal was acquired with a Tektronix MDO3032 oscilloscope (Tektronics, Beaverton, OR, USA). The sample was composed of polystyrene sheets and silicon wafer, and the material properties are shown in Table 2. The reference echo is from the top layer of polystyrene sheet. The target echoes are the top layer echo (whose FWTM duration is ) and the bottom layer echo of the silicon wafer. Three cases were designed by changing the thickness of the silicon wafer. Figure 12a–c are the cases where the overlap degree is −30%, 50% and 60%, respectively.
Figure 11.
The 20 MHz experimental platform.
Table 2.
Material properties.
Figure 12.
AMI signals with different degrees of overlap: (a) ; (b) ; (c) .
4.1.2. Experimental Results
As shown in Figure 13, when the degree of overlap is 50% or 60%, the waveforms of and reconstructed by CD-SR are consistent with the actual waveforms (see Figure 12a), but SR can no longer successfully separate the overlapping echoes. The reason why SR fails in the experiment is that the actual overlapping echoes have relatively small differences in time-frequency parameters, while SR distinguishes overlapping echoes based on the difference in time-frequency parameters of the echoes. CD-SR forms a dictionary through pre-calculation and constraint. The atoms in the constraint dictionary are similar to the echoes before the overlap, and none of them are similar to the overlapping echoes, so the overlapping echoes can be successfully decomposed and reconstructed. Due to the tailing and noise of the experimental echoes, the experimental performance is not as good as the simulation. Table 3 shows the amplitude error and position error of CD-SR, indicating that the errors are small.
Figure 13.
Comparison of reconstructed echoes: (a) ; (b) .
Table 3.
Reconstruction errors of CD-SR.
4.2. Analogous Experiment for Very High Frequency
4.2.1. Experimental Design
To verify the performance of the SR and CD-SR methods in the very high frequency range (30–300 MHz), the thickness of the silicon die is required to be tens of microns, which undoubtedly has high requirements on the production accuracy. Considering the analogy between acoustics and electricity, the propagation of ultrasonic waves in a die is analogous to the propagation of electromagnetic waves in a coaxial cable, and the reflection of ultrasonic waves caused by the difference in acoustic impedance on the surface of the die is analogous to the reflection of electromagnetic waves caused by the difference in electrical impedance at the two ends of the coaxial cable. Therefore, echoes with different degrees of overlap can be obtained simply by changing the length of the coaxial cable. The experimental device is shown in Figure 14. The CTS VF428 200 MHz acoustic lens-focused transducer (CTS, Lisle, IL, USA) was excited with a high-frequency transmitting circuit. The receiving circuit and the Keysight MSO9254A oscilloscope (Keysight, Santa Rosa, CA, USA) were used to amplify and acquire the AMI signal (lens echo), respectively. The coaxial cable was located between the transducer and the receiving circuit. When the length of the coaxial cable is zero, the reference echo was obtained. The FWTM duration of the electromagnetic wave is , and the properties of the coaxial cable are shown in Table 4. Three cases were designed by changing the length of the coaxial cable. Figure 15a–c are the cases where the overlap degree is −25%, 50% and 60%, respectively.
Figure 14.
The 200 MHz experimental device.
Table 4.
Coaxial cable properties.
Figure 15.
AMI signals with different degrees of overlap: (a) ; (b) ; (c) .
4.2.2. Experimental Results
As shown in Figure 16, CD-SR successfully separates the overlapping echoes when the degree of overlap is 50% or 60%, and the reconstructed waveforms of and are consistent with the actual waveforms (see Figure 15a). However, SR cannot successfully separate the overlapping echoes. The results are consistent with the results of conventional experiment in Section 4.1. Table 5 shows the amplitude error and position error of CD-SR, indicating that the errors are as small as the simulation results.
Figure 16.
Comparison of reconstructed echoes: (a) ; (b) .
Table 5.
Reconstruction errors of CD-SR.
5. Conclusions
With the miniaturization of electronic packages, the resolution limits of traditional time domain AMI and frequency domain AMI have been reached. SR is a time-frequency domain AMI method that can improve longitudinal resolution. The SR method with traditional Gabor dictionary distinguishes overlapping echoes based on the differences in the time-frequency parameters of the echoes, and is often used to separate two echoes with certain differences. For the overlap problem of multiple similar echoes in electronic packages detection, the SR method has limited separation effect.
In this paper, the CD-SR method is proposed to achieve super-resolution and high robustness. The innovation lies in: (1) Quantitative discussion on the overlap of multiple echoes. The degree of overlap and the performance of the method are quantitatively analyzed. (2) Constraint dictionaries are proposed. The constraint dictionary differs from the conventional dictionary in that its time-frequency parameters are determined according to the AMI signal to be processed and used to achieve higher matching accuracy. (3) The sparse decomposition and reconstruction algorithm of AMI signals is improved to achieve more accurate decomposition and reconstruction.
Simulation and experimental results demonstrated that the reconstruction errors of CD-SR remains within 13% when the echo overlap degree is as high as 60%, with superior longitudinal resolution and robustness. Although the Gabor dictionary is used in this paper for constraint, the proposed constraint idea is universal and can be used for different types of dictionary to solve the problems in ultrasonic detection, such as resolution improvement, noise suppression, pulse detection, etc.
Author Contributions
Conceptualization, K.W., T.L. and J.M.; methodology, K.W. and T.L.; validation, J.M. and G.L.; simulation, K.W. and T.L.; experiment, K.W. and T.L.; data curation, K.W.; writing—original draft preparation, K.W.; writing—review and editing, T.L., J.M., G.L. and C.Z.; visualization, T.L., J.M., G.L. and C.Z. All authors have read and agreed to the published version of the manuscript.
Funding
This research received no external funding.
Institutional Review Board Statement
Not applicable.
Informed Consent Statement
Not applicable.
Data Availability Statement
Data is contained within the article.
Conflicts of Interest
The authors declare no conflict of interest.
References
- Hertl, M.; Mialhe, F.; Richard, I. On the replacement of water as coupling medium in scanning acoustic microscopy analysis of sensitive electronics components. Microelectron. Reliab. 2020, 114, 113860. [Google Scholar] [CrossRef]
- Altun, B.; Demirkan, I.; Isik, E.O.; Kocaturk, O.; Unlu, M.B.; Garipcan, B. Acoustic impedance measurement of tissue mimicking materials by using scanning acoustic microscopy. Ultrasonics 2020, 110, 106274. [Google Scholar] [CrossRef] [PubMed]
- Zinin, P.V.; Kutuza, I.B.; Titov, S.A. Near-Field Defects Imaging in Thin DLC Coatings Using High-Frequency Scanning Acoustic Microscopy. J. Surf. Investig. X-ray Synchrotron Neutron Tech. 2018, 12, 1285–1293. [Google Scholar] [CrossRef]
- Mehr, M.Y.; Bahrami, A.; Fischer, H.; Gielen, S.; Corbeij, R.; Van Driel, W.D.; Zhang, G.Q. An overview of scanning acoustic mi-croscope, a reliable method for non-destructive failure analysis of microelectronic components. In Proceedings of the 2015 16th International Conference on Thermal, Mechanical and Multi-Physics Simulation and Experiments in Microelectronics and Microsystems, EuroSimE 2015, Budapest, Hungary, 19–22 April 2015. [Google Scholar]
- Yu, X.; Huang, H.; Xie, W.; Gu, J.; Li, K.; Su, L. Simulation Research on Sparse Reconstruction for Defect Signals of Flip Chip Based on High-Frequency Ultrasound. Appl. Sci. 2020, 10, 1292. [Google Scholar] [CrossRef] [Green Version]
- Wolter, K.J.; Speck, M.; Heinze, R. Reliability analysis in microelectronic packaging by acoustic microscopy. In Proceedings of the 28th International Spring Seminar on Electronics Technology: Meeting the Challenges of Electronics Technology Progress, Wiener Neustadt, Austria, 19–20 May 2005. [Google Scholar]
- Ma, L.; Bao, S.; Lv, D.; Du, Z.; Li, S. Application of C-mode scanning acoustic microscopy in packaging. In Proceedings of the Electronic Packaging Technology Conference, EPTC, Sparks, NV, USA, 29 May–1 June 2007. [Google Scholar]
- Zhang, G.-M.; Harvey, D.M.; Braden, D.R. An improved acoustic microimaging technique with learning overcomplete representation. J. Acoust. Soc. Am. 2005, 118, 3706. [Google Scholar] [CrossRef]
- Semmens, J.E.; Kessler, L.W. Application of Acoustic Frequency Domain Imaging for the Evaluation of Advanced Micro Electronic Packages. Microelectron. Reliab. 2002, 42, 1735–1740. [Google Scholar] [CrossRef]
- Zhang, G.-M.; Harvey, D.; Braden, D. Advanced Acoustic Microimaging Using Sparse Signal Representation for the Evaluation of Microelectronic Packages. IEEE Trans. Adv. Packag. 2006, 29, 271–283. [Google Scholar] [CrossRef]
- Feng, W.; Chen, X.; Wang, C.; Shi, Y. Application research on the time–frequency analysis method in the quality detection of ultrasonic wire bonding. Int. J. Distrib. Sens. Networks 2021, 17, 15501477211018346. [Google Scholar] [CrossRef]
- Jhang, K.; Jang, H.; Park, B.; Ha, J.; Park, I.; Kim, K. Wavelet analysis based deconvolution to improve the resolution of scanning acoustic microscope images for the inspection of thin die layer in semiconductor. NDTE Int. 2002, 35, 549–557. [Google Scholar] [CrossRef]
- Zhang, G.-M.; Harvey, D.M.; Braden, D.R. Resolution improvement of acoustic microimaging by continuous wavelet transform for semiconductor inspection. Microelectron. Reliab. 2006, 46, 811–821. [Google Scholar] [CrossRef]
- Zhang, G.-M.; Zhang, C.-Z.; Harvey, D.M. Sparse signal representation and its applications in ultrasonic NDE. Ultrasonics 2012, 52, 351–363. [Google Scholar] [CrossRef] [PubMed]
- Qi, A.L.; Ma, H.W.; Liu, T. A weak signal detection method based on artificial fish swarm optimized matching pursuit. In Proceedings of the 2009 WRI World Congress on Computer Science and Information Engineering, Los Angeles, CA, USA, 31 March–2 April 2009; Volume 6, pp. 185–189. [Google Scholar]
- Duan, J.; Zhong, H.; Jing, B.; Zhang, S.; Wan, M. Increasing Axial Resolution of Ultrasonic Imaging with a Joint Sparse Representation Model. IEEE Trans. Ultrason. Ferroelectr. Freq. Control 2016, 63, 2045–2056. [Google Scholar] [CrossRef]
- Ruiz-Reyes, N.; Vera-Candeas, P.; Curpián-Alonso, J.; Mata-Campos, R.; Cuevas-Martínez, J. New matching pursuit-based algorithm for SNR improvement in ultrasonic NDT. NDTE Int. 2005, 38, 453–458. [Google Scholar] [CrossRef]
- Jabarulla, M.Y.; Lee, H.-N. Speckle Reduction on Ultrasound Liver Images Based on a Sparse Representation over a Learned Dictionary. Appl. Sci. 2018, 8, 903. [Google Scholar] [CrossRef] [Green Version]
- Qi, A.-L.; Zhang, G.-M.; Dong, M.; Ma, H.-W.; Harvey, D.M. An artificial bee colony optimization based matching pursuit approach for ultrasonic echo estimation. Ultrasonics 2018, 88, 1–8. [Google Scholar] [CrossRef] [PubMed] [Green Version]
- Wang, B.; Li, Y.; Zhao, W.; Zhang, Z.; Zhang, Y.; Wang, Z. Effective Crack Damage Detection Using Multilayer Sparse Feature Representation and Incremental Extreme Learning Machine. Appl. Sci. 2019, 9, 614. [Google Scholar] [CrossRef] [Green Version]
- Zibulevsky, M.; Pearlmutter, B. Blind Source Separation by Sparse Decomposition in a Signal Dictionary. Neural Comput. 2001, 13, 863–882. [Google Scholar] [CrossRef]
- Wang, W.; Bao, Y.; Zhou, W.; Li, H. Sparse representation for Lamb-wave-based damage detection using a dictionary algorithm. Ultrasonics 2018, 87, 48–58. [Google Scholar] [CrossRef] [PubMed]
- Elad, M. Sparse and Redundant Representations; Springer: New York, NY, USA, 2010; ISBN 978-1-4419-7010-7. [Google Scholar]
- Lu, Y.; Michaels, J.E. Ultrasonic Signal Decomposition via Matching Pursuit with an Adaptive and Interpolated Dictionary. AIP Conf. Proc. 2007, 894, 579–586. [Google Scholar] [CrossRef]
- Hong, J.-C.; Sun, K.H.; Kim, Y.Y. Waveguide damage detection by the matching pursuit approach employing the dispersion-based chirp functions. IEEE Trans. Ultrason. Ferroelectr. Freq. Control. 2006, 53, 592–605. [Google Scholar] [CrossRef]
- Yang, G.; Zhang, Q.; Que, P.-W. Matching-pursuit-based adaptive wavelet-packet atomic decomposition applied in ultrasonic inspection. Russ. J. Nondestruct. Test. 2007, 43, 62–68. [Google Scholar] [CrossRef]
- Mallat, S.; Zhang, Z. Matching pursuits with time-frequency dictionaries. IEEE Trans. Signal Process. 1993, 41, 3397–3415. [Google Scholar] [CrossRef] [Green Version]
- Boßmann, F.; Plonka, G.; Peter, T.; Nemitz, O.; Schmitte, T. Sparse Deconvolution Methods for Ultrasonic NDT. J. Nondestruct. Evaluation 2012, 31, 225–244. [Google Scholar] [CrossRef] [Green Version]
- Lu, Y.; Michaels, J.E. Numerical implementation of matching pursuit for the analysis of complex ultrasonic signals. IEEE Trans. Ultrason. Ferroelectr. Freq. Control. 2008, 55, 173–182. [Google Scholar] [CrossRef]
- Murray, J.F.; Kreutz-Delgado, K. Learning Sparse Overcomplete Codes for Images. J. VLSI Signal Process. Syst. Signal Image Video Technol. 2006, 46, 1–13. [Google Scholar] [CrossRef] [Green Version]
- Feng, J.; Song, L.; Yang, X.; Zhang, W. Sub clustering K-SVD: Size variable dictionary learning for sparse representations. In Proceedings of the Proceedings—International Conference on Image Processing, Las Vegas, NV, USA, 13–16 July 2009; pp. 2149–2152. [Google Scholar] [CrossRef]
- Rubinstein, R.; Bruckstein, A.M.; Elad, M. Dictionaries for Sparse Representation Modeling. Proc. IEEE 2010, 98, 1045–1057. [Google Scholar] [CrossRef]
- Elad, M.; Yavneh, I. A Plurality of Sparse Representations Is Better Than the Sparsest One Alone. IEEE Trans. Inf. Theory 2009, 55, 4701–4714. [Google Scholar] [CrossRef]
- Zhang, G.-M.; Harvey, D.M.; Braden, D.R. Microelectronic package characterisation using scanning acoustic microscopy. NDT E Int. 2007, 40, 609–617. [Google Scholar] [CrossRef]
- Qi, A.L.; Ma, H.W.; Liu, T. Ultrasonic signal detection via improved sparse representations. In Proceedings of the 2009 WRI Global Congress on Intelligent Systems, Xiamen, China, 19–21 May 2009; Volume 1, pp. 309–313. [Google Scholar]
- Lobo, A.; Loizou, P. Voiced/unvoiced speech discrimination in noise using Gabor atomic decomposition. In Proceedings of the ICASSP, IEEE International Conference on Acoustics, Speech and Signal Processing, Hong Kong, China, 6–10 April 2003; Volume 1, pp. 820–823. [Google Scholar] [CrossRef]
Publisher’s Note: MDPI stays neutral with regard to jurisdictional claims in published maps and institutional affiliations. |
© 2022 by the authors. Licensee MDPI, Basel, Switzerland. This article is an open access article distributed under the terms and conditions of the Creative Commons Attribution (CC BY) license (https://creativecommons.org/licenses/by/4.0/).