Abstract
Today, up to hundreds of RGB and W-LEDs are positioned in a vehicle’s interior context and are able to be individually controlled in intensity, color and sequence. However, which kind of illumination distracts or supports car occupants and how to define such a modern illumination system is still under discussion and unknown. For that, first a definition for an in-vehicle lighting system is introduced. Second, a globally distributed study was performed based on a free-access online survey to investigate in-vehicle lighting for visual signaling within 10 colors, eight positions and six dynamic patterns. In total, 238 participants from China and Europe rated color preferences, color moods, light-position preferences, differences between manual and autonomous driving and also different meanings for dynamic lighting patterns. Out of these, three strong significant (p < 0.05) color preference groups were identified with a polarized, accepted or merged character. For the important driving-signaling mood attention, we found a significant hue dependency for Europeans which was missing within the Chinese participants. In addition, we identified that light positioned at the door and foot area was globally favored. Furthermore, we evaluated qualitative results: men are primarily focusing on fast-forward, whereas women paid more attention on practical light usage. These findings conclude the need for a higher lighting-car-occupant adaptation in the future grounded by deeper in-vehicle human factors research to achieve a higher satisfaction level. In interdisciplinary terms, our findings might also be helpful for interior building or general modern cockpit designs for trains or airplanes.
1. Milestones of In-Vehicle Lighting
In the last few decades, automotive interior lighting has changed significantly. This started with white tungsten lamps, which were turned on if one of the vehicle doors opened, during night driving if car occupants want to have a quick look on the printed road map, during searching for a lost key in the vehicle or just by unlocking it. By introducing an area of light-emitting diodes (LEDs), covering the three primary colors, red, green and blue, the vehicle interior lighting scenery was expanded by adding function and patterns which concluded in the dynamic changing bus-controlled lighting systems as shown in Figure 1.
In details, within the last 5 years, the automotive industry has presented dynamic lighting effects in intensities and colors, adaptive light cone systems, pattern illumination and fully user customized smart lighting systems. Today, selected welcome-light scenarios have also been established [1]. Within several lighting zones, brightness and color adapt for a warm-welcome to the car occupants. Furthermore, these lighting systems change according to people’s mood or level of energy [2]. To increase the driving safety, visual warning signals can enhance driver’s reaction time in dangerous driving situations.

Figure 1.
Chronology of in-vehicle lighting system [3,4,5].
2. Definition and Sorting
As illustrated in Figure 1, in-vehicle lighting achieved by industrial realization major complexity and variability. A general definition and classification are performed based on this development in the following sections.
According to a definition proposal a general ambient light system not only applies to the vehicle context: “An ALS (ambient light system) is a system positioned in the periphery of a person’s attention that conveys information using light encodings in a non-distracting way most of the time” [6]. In addition, “we consider ambient light systems as a subgroup of ambient displays that have a specific focus on a light modality as carrier of information in the periphery” [6].
This definition might be suitable for some aspects, but cannot cover the complete spectrum specified of in-vehicle lighting. Therefore, we started to categorize previous research about in-vehicle lighting in three parts:
- The first part focuses on technology driven approaches like new LED communication protocols, calibration processes for the single red-green-blue chips and temperature compensation methods including end of line testing and light-technical analysis [7,8].
- The second part focuses on visual aspects which are directly motivated out of the presence of in-vehicle lighting systems. Examples for that are space perception, interior quality and functionality which are higher perceived with the attendance of these systems compared to those without [9]. These are used as a driving assistant like for a lane changing assistant [10,11], brake accelerator [12] and parking assistant [13] or as a overtaking request indicator between manual and autonomous driving [14], and were designed with different visual stimuli but were not able to increase significantly the reaction time compared with no visual stimuli [15]. Compared to a display system, a LED light bar as a HMI warning interface achieved a higher subjective driver satisfaction rate but with missing significance [16]. In addition, trust in the vehicle [17] and steering reaction time are significantly improved with a supported in-vehicle lighting system for assistance compared to those without [18]. It is questionable if auditory or visual stimuli are more preferred for an autonomous driving vehicle-driver communication [19]. A combination of both might be suitable since a visual-accuracy and an auditory-reaction time relation was reported [20]. All these stimuli were placed in a peripheral vision area. For foveal vision, there might be an influence on the driver’s road or traffic participant perception based on color and brightness changes by in-vehicle lighting [21]. Brightness studies for in-vehicle lighting within the coming visual communication approach are initialized also under daylight conditions [22].
- The third part can be classically categorized to non-visual aspects. In a recent study, color, brightness and dynamic factors were varied and three car occupants’ mood ratings about satisfaction, tension and unique were analyzed. They found a significant correlation between arousal with light color and dynamic [23]. Also, in-vehicle lighting can achieve a general positive effect on car occupants by increasing the concentration level on high-speed driving. In addition, an idea is also to reduce cognitive workload by in-vehicle lighting, which is currently only a concept [24]. On the other side, further study participants recognized the additional visual stimuli as distracting or causing higher stress level [25]. Furthermore, blue-enriched white in-vehicle light might have the potential as a counter measurement for driving fatigue by increasing reaction time, although precise driving tasks had less accuracy within this condition [26]. For a long wavelength orange light illumination, simulated driving behavior is constant but characterized with larger driving errors under blue light illumination with reduced reaction time [27]. Only a prior driving light shower with a high brightness (5600 lx at eye, 4100–5000 K) for 45 min could improve the simulated driving behavior versus a dim light condition (35 lx, 4100–5000 K) under sleep deprivation [28].
We conclude that the previous definition of ALS as a subgroup of ambient display systems might lead to a wrong direction in the vehicle context. First, a one-dimensional LED array is more a light-bar than a screen and ambient light systems are not automatically realized by LED arrays. Also, only a single LED with the usage of a light guide is able to realize an ambient atmosphere in the peripheral vision and can also transport information in a limited way [29]. Therefore, we propose the following vision science-motivated sight of view [30] for the in-vehicle context:
An in-vehicle lighting system (iVLS) is able to achieve visual and non-visual human stimuli, which are placed in an arbitrary driving or vehicle interior context. A more visual approach will focus on visual and task performances like discrimination in brightness and color, clarity, glare, brightness preferences including light-distribution preferences based on direct- or indirect illumination. Non-visual effects focus on color-preferences, vehicle scene-preferences, color-mood relations, surrounding effects (time, location, weather) or biological active lighting e.g., they focus on a human’s circadian clock. The expression system indicates an interaction between different sublayers. If the purpose of the system is to transmit information which should perceived from car occupants, it is called iVLSa.
3. The Next Level: Human-Centric In-Vehicle Lighting
Which further functions can an iVLS provide for humans centered in the in-vehicle context? Imagine individual settings for a general driving context like a holiday/weekend trip or a daily work or shopping trip together with friends and family or with a specialized focused on the driver alone. Furthermore, a more adaptive lighting system would support vehicle atmospheres, driving, working, watching movies, relaxing or sleeping, for warning car occupants or simply information transmission. In addition, vary according subjective preferences, daily mood, favorite songs, navigation, weather, road conditions and time of the day to attract, support, underline or emphasize people’s third living place. Therefore, a next generation human-vehicle-context with a manual to autonomous driving approach instead of only considering the classical lighting-circadian clock relations [8]. In this field, the following research questions will be answered in this study as a first approach for a modern human-centric in-vehicle lighting system, which to the best of our knowledge have not been answered before:
- q1: Is the preference of an iVLS with its color and position options within age, gender and origin the same?
- q2: How does surrounding effects like time and weather affect preferences of an iVLS?
- q3: Are meanings of light pattern perceived in a unique-understandable way transmitted by an iVLSa?
4. Methods—Survey Based
To answer mentioned questioned before, a globally distributed study was rolled out in April 2021 and was finalized in November 2021. Realized as a global free-access online questionnaire, in an anonymous and self-hosted way, participants inside and outside China were asked to rate the state-of-the-art in-vehicle lighting systems, which are displayed in Figure 1, for the year 2021. Commonly used internet-access devices like notebooks, tablets or smartphones were used to complete the online survey by applying responsible web design techniques in dark-mode. To speed up the distribution, we shared a reference QR-code on social media platforms like Facebook, WhatsApp or WeChat. Since our target audience should be inside and outside China, participants could choose between English or Chinese as the operating language. Out of the in-vehicle lighting context, the focus of this study was set to ambient illumination only realized as line-shape lights, displayed in 10 different colors at eight different positions. In addition, six different dynamic pattern meanings should be assigned to each other. At the beginning of the survey, the user information was collected. These answerers can be used to identify:
- Personal: Living country, living region, age class and genders.
- Surroundings: Current weather condition, date and time of the day.
- Driving experience: The time spent inside a vehicle during a normal week (without consider the COVID-19 pandemic), if a subject drove a vehicle before.
- Social status: Age of subject’s own vehicle, acceptable price for buying a new vehicle.
- Visual performance: Color vision check by Ishihara test and contrast vision test.
- -
- Color vision test: Necessary to confirm that all subjects have no color-blindness.
- -
- Contrast vision test: Necessary to make sure that all subjects were able to identify the displayed information in a proper way, since there was no external observation and verification possible.
Only if a subject was able to answer all questions in a proper way the participant was forwarded to the in-vehicle lighting questions. These mandatory questions were divided in five categories. First the investigated colors are shown including their RGB color code values as listed in Table 1 according to the US department of transportation. For white, a clear rendered visual separation was focused, based on a multiple device pre testing.

Table 1.
Color settings used in the online survey [31,32].
All colors for rating, compare Table 1, were presented at the door position, as displayed in Table 2 and the following two questions were raised:
Table 2.
Position settings used in the survey.
- 1.
- Color Preferences:People were asked to rate all 10 colors according to their preferences. Rating was performed on Likert-like scales with alternating five items (like–bit like–neutral–bit dislike–dislike) or four items (no neutral element).
- 2.
- Color and Emotions:People were asked to rate the same 10 colors in the context of four different emotions, named as joy, fatigue, attention and relax. These emotions were selected out of the driving context. Rating was performed on Likert-like scales, as in question 1.
The next category focused on the positions for in-vehicle lighting. In total, nine position settings were selected out of historically established or possible in-vehicle areas as displayed in Table 2. The following question was raised about position preferences:
- 3.
- Lighting Positions:People should imagine two different situations: First, just sit at the second row as the perspective of the pictures. Second, sit at the first row and they are driving a vehicle. For each situation we collected ratings for each position on Likert-like scales using the same method as introduced before in Questions 1 and 2.
The final two quantitative categories focused on autonomous driving connected with dynamic lighting patterns:
- 4.
- Lighting System for Manual and Autonomous Driving:In this category, people were able to select out of 10 possible colors and eight different lighting positions (without option all), which lighting system they preferred for manual or autonomous driving. Multiple selections were possible.
- 5.
- Meaning of Dynamic Lighting Patterns:People were asked about a spontaneous meaning for six different light patterns. The meanings were pre-defined and a single one could be selected out of a scroll-bar.
After the participant was able to answer all questions, three qualitative questions were raised. These last questions were set as optional and could also be passed by the subject manually.
- i.
- Question 1, q1:Which lighting system do you want to have in your future vehicle?
- ii.
- Question 2, q2:If you don’t like your current interior lighting in your vehicle, which proposals you have to improve?
- iii.
- Question 3, q3:If you have some additional comments, please write down your opinions.
5. Results
5.1. Demographics
To answer our research Question q1–q3, Section 3, we were able to collect 247 answers from 143 males and 104 females which were submitted when answering all study questions. Since we decided to follow a comparison between people from China and Europe, we excluded nine English participants out of other world regions. A detailed demographic overview of the participants is presented in Table 3:
Table 3.
Demographics of survey attendances.
All submitted answers were primary divided in two groups named as China, for people, who operated the survey in Chinese language out of China and Europe for people who operated the survey in English language out of a European country. Its participants were primarily from Germany as shown in Table 4.
Table 4.
Demographics of survey attendances, category Europe.
In addition, Table 5 shows a detailed overview about the age distribution including the time of the day and weather conditions in which participants answered the survey.
Table 5.
Age, participated time and weather condition during the survey.
In the second row of Table 3 it is obvious that the English participants are older than the Chinese participants. Within the Chinese participants, the age class of 25 to 44 years is younger whereas the English participants are more equally distributed, as shown in Table 5, first row. Because attendance in the online survey was anonymous, age classes were the only way of recording it. There is a 60:40 ratio between the participated time on the Chinese side, whereas an 80:20 ratio on the English side meaning that 60% of the Chinese participated between 6 a.m. to 6 p.m., whereas 80% of the English side participated in the same time range. Most participants joined during a sunny day in China and cloudier weather in Europe.
The next section considered more on the driving behavior of the participants. Since the online survey focuses on in-vehicle ambient lighting, it is important to note that most of the participants drove a vehicle before, to understand the study context. On average, Chinese participants spent 8.0 h per week in a vehicle, whereas English participants similarly spent 7.5 h. The detailed distribution is presented in Table 6.
Table 6.
Driving behavior.
5.2. Question II—Color Preferences
Since we used Likert-like scales with four or five items, which were alternately rated between all participants, resulting scales are in the ordinary range [33]. By calculating mean values out of Likert items, the new scale might have interval scale properties, which is controversially discussed in the literature [34]. Meaning, for the calculation of the significance p, we used only ordinary scale tests: for independent groups, the Mann–Whitney-U test and for depended groups, the Wilcoxon signed rank test. Both tests were applied to prove the null hypotheses H0: The distribution between the investigated groups is equal, and we concluded this to be an equal median. If the test result leads to a rejection of H0, the alternative hypothesis H1 would be valid, meaning the opposite of H0.
In Figure 2a the results of the color preferences are displayed, including significant dependencies in b.
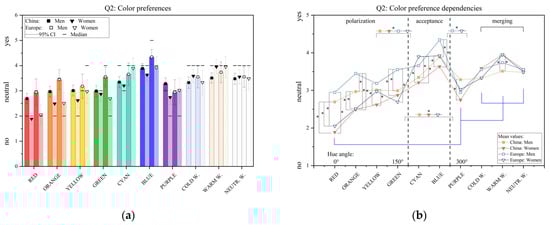
Figure 2.
(a) Color preferences rating and (b) statistical evaluation separated between the Chinese- and Europe-group and genders. Statistical significances p < 0.05 marked with *.
Following Newton’s color circle [35], we sorted the investigated colors according to their hue angle. By doing so, three color groups were identified: polarization, acceptance and merging. Within the polarization group most significant differences could be identified between genders and origins. The statistical power was calculated using coefficient r [36] and evaluated according its power for strong, medium or weak following Cohen [37]. Furthermore, since the sample size is n > 30, we calculated the asymptotic p and set the significance level α = 0.05. If p was smaller than α, H0 was rejected, meaning that the alternative hypothesis H1 was valid. Table 7 shows the detailed statics and results of the Mann–Whitney-U test rounded for three digits.
Table 7.
Statistical evaluation of the color preference rating, differences of the mean values Δ, z-score, probability value p, effect power r and quantification of it. If p < 0.05, it is bold marked. Participants for each group are summed up in the heading.
The highest significance values are in the red, orange and blue color regions within gender and origin. Within the polarization group, there are within each color significant color preference differences. Cyan, blue and warm white are the highest preferred colors for the displayed door lighting scenery for both genders and origins. Within the multichromatic colors, there is a preferable region which is globally and gender-wide accepted. To prove this merging effect, a variance calculation should be performed. However, since the original scale level might be ordinal, at this level we argue with the less significant differences for this color region between genders and origins, marked as a blue bracket in Figure 2b.
The following Table 8 shows the detailed statistics between the three identified groups polarization, acceptance and merging using the Wilcoxon signed rank test. These groups were created by a separate calculation of the mean values of each of the 238 participants and for each investigated group individual to keep the sample size and scale level equal: men and women, from China and Europe. Between the polarization and the acceptance group there are significant differences between all four origin and gender groups. The English participants showed a significant difference between the acceptance and the merging group. On the other hand, the Chinese and European women participants showed a population projected difference between the polarization and the merging group. The effect power shows a medium to strong correlation.
Table 8.
Statistical evaluation of the three identified groups, differences of the mean values Δ, z-score, probability value p, effect power r and quantification of it. If p < 0.05, it is bold marked. Participants for each group are summed up in the first column.
5.3. Question III—Color and Mood Relations
The third part of the questionnaire followed the same schematic from the second part but changed the focus point to moods and color connections. We asked the question: Do you have a feeling of joy, fatigue, attention or relax by seeing a defined color? Answers were collected with Likert-like scales and static calculations were performed according to Section 5.2. The results are displayed as follows, first for feeling joy, Figure 3.
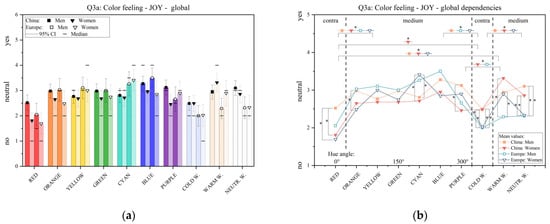
Figure 3.
(a) Color-joy rating and (b) statistical evaluation separated between Chinese and European participants and genders. Statistical significances p < 0.05 marked with *.
The first observation was that we could not identify any color that, just based on the visual perception of it, is able to create a feeling of joy. Nevertheless, red and cold-white had for most gender or origin groups an opposite effect. Second, within all gender and origin groups there are no big differences and the major tendency is around Likert item three, meaning “neutral”.
The second feeling, which was investigated was the feeling of fatigue. In the following Figure 4, the results are displayed. Statistical evaluation followed the same procedure as in the last section.
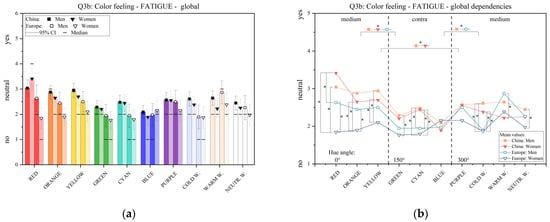
Figure 4.
(a) Color-fatigue rating and (b) statistical evaluation separated between Chinese and European participants and genders. Statistical significances p < 0.05 marked with *.
Similar to the feeling of joy, there was no color observed which has a positive impact to make people sleepy. There is a small tendency observed that for the color green, cyan and blue there might be an opposite effect observed within the color blue for all investigated groups. The highest confirmation rating was identified within the color range red, orange and yellow with a meaning around “neutral”.
In the third round, we asked about the feeling of attention. Statistical evaluation was performed in the same way as before. Figure 5 shows the result.
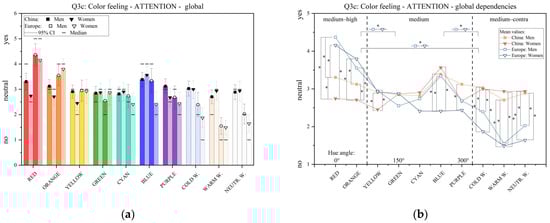
Figure 5.
(a) Color-attention rating and (b) statistical evaluation separated between Chinese and European participants and genders. Statistical significances p < 0.05 marked with *.
Compared to the other two feelings, joy and fatigue, there are controversial ratings between origin and gender observed. The highest attention level was achieved within the red and orange group for the English survey participants. Within the Chinese participants, the color blue was rated as the color with the highest attention potential. Significant differences for red within the Chinese participants were calculated as z = 2.17, p = 3.00 × 10⁻² and r = 0.17 indicating a weak effect power. Between Chinese women and English men as, z = −4.87, p = 1.21 × 10⁻⁶ and r = 0.48 indicating a medium effect power.
The last feeling was relaxing. Following the same procedure for questioning, answering and statistical evaluation, the result is shown in Figure 6.
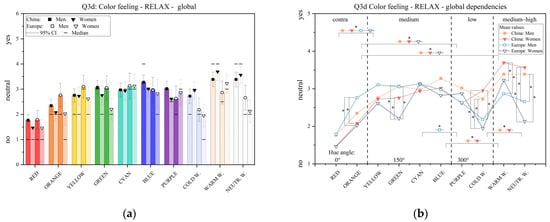
Figure 6.
(a) Color-relax rating and (b) statistical evaluation separated between Chinese and European participants and genders. Statistical significances p < 0.05 marked with *.
The first two colors with the lowest hue angles showed an opposite effect for relaxing, similar to purple and cold-white. From the color yellow to blue there was a medium level of relaxing observed. The final two multichromatic colors, out of that especially the warm-white color, had the highest potential to create a feeling of relaxing within the 238 participants asked. Complete statistical tables for the color and mood relations are added in the Supplementary Materials of this study, Section S1, Tables S1–S8.
5.4. Question IV—Lighting Positioning Rating
The next part of the questionnaire focused on lighting positioning rating within the in-vehicle limited space. Compared to Table 2, we asked the participants to rate nine different position settings with a constant color cyan, color code in RGB: (6, 206, 179), within two driving contexts according their preferences: The first one asked about the positioning rating if the person is sitting at the second row and the vehicle is driving, Q4a, whereas the second context focused on the first row, where the participant is driving actively, Q4b. The rating was performed on the same four and five items on Likert-like scales and statistical evaluation followed the same two test procedures: For independent groups, we used the Mann–Whitney-U test and for dependent groups the Wilcoxon signed rank test. Figure 7 shows the results of both driving scenarios, where a + b focus on the second row and c + d focus on the first row.
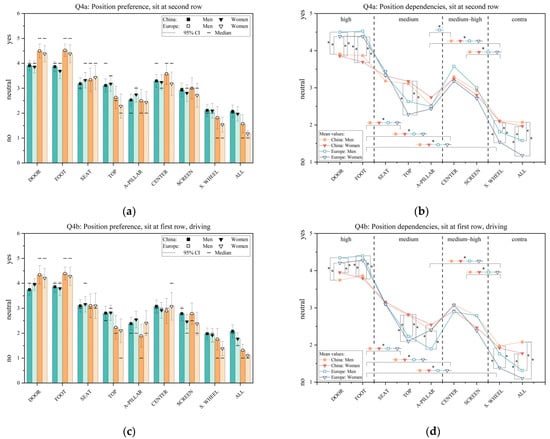
Figure 7.
Light-positioning rating: (a,b) Sit at the second row and not active driving, vehicle is driving; (c,d) Sit at the first row and active driving. Statistical significances p < 0.05 marked with *, separated between the Chinese and European groups and genders.
Within all genders and origins and for both scenarios there were similar tendencies observed. The door and the foot area, compared in Figure 7, were highly rated but with significant differences between the participants. For the seat, top and a-pillar position there was a general more dislike tendency observed within all groups. For the center and screen illumination there was again a slightly higher preference level shown. Finally, the steering wheel and the combination of all lighting positions together were rated significantly worst within all groups. The strongest effect was between China:female and Europe:male with z = −4.02, p = 5.78 × 10⁻⁵ and r = 0.40 for the foot position in Q4a and z = 4.12, p = 3.83 × 10⁻⁵ and r = 0.41 for all positions at Q4b between China:female and Europe:female, indicate different expectations about in-vehicle light positioning. In addition, four major position groups could be identified with strong significant differences between Chinese and European participants marked as high, medium-high, medium and opposite preferences represented by a statistical effect power r between 0.34 and 0.86. Detailed statistical tables for the lighting position relations are placed in the Supplementary Materials of this study, Section S2, Tables S9–S12.
5.5. Question V—Definition of Lighting Systems for Manual and Autonomous Driving
The fifths part of the online survey changed the answering style. Instead of ratings, participants were asked to select their own color and position preference for two driving systems: The first one, as a manual driving person and the second one within a self-driving vehicle. Since there are nominal scales, selected or not selected, we present differences for the evaluation between both driving scenarios for the color and position selection in Figure 8. Multiple selections of different colors and positions were possible.
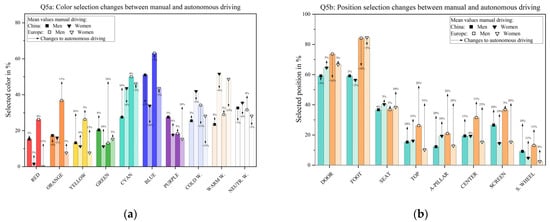
Figure 8.
(a) Light-color and (b) light-positioning selections shown in bars for manual driving and percentage changes to autonomous driving are added in black arrows including numeric, separated between the Chinese and European groups and genders.
Depending on the origin and genders, colors were more or less selected between autonomous or manual driving. There was no clear tendency observed. Blue and cyan were the two most selected colors, which were also the highest rated ones in the survey Section 5.2 about color preferences, see Figure 2. For the positioning there was an increased selection observed from changing to autonomous driving for all positions which were less selected in the manual driving mode. As identified in Section 5.4, about the lighting positioning preferences, the door and the foot area were most selected for manual driving. This changed for autonomous driving, as percentages indicate.
5.6. Question VI—Meaning of Dynamic Light Pattern
The next part asked participants to assign out of 12 predefined meanings of the vehicle context six predefined light patterns. Table 9 shows the pattern overview.
Table 9.
Dynamic light pattern description used as short animation within the survey.
We designed these different light patterns at the center position only, see Table 2. These so-called dynamic light effects were all presented without any further introduction, explanation or teaching sessions. To each light effect, only a single meaning could be assigned. Each animation had a total duration of 6 s besides the segment-bouncing effect with 10 s. Participants were able to repeat these animations and finally they chose out of predefined meanings, by context-intuition matching. The defined meanings were: warning, welcome, guiding, attention, processing, goodbye, relaxing, error, driving start, driving stop, driving and none. The results out of 102 female and 136 male global selections are displayed in Figure 9. Most people selected the center-to-side effect as a welcome greeting. For a fading light effect, the attention or warning level was most selected. The vehicle status of processing was connected with segment bouncing. Outside-inside and left-right had no clear meaning and for a flashing light, several possibilities are identified.
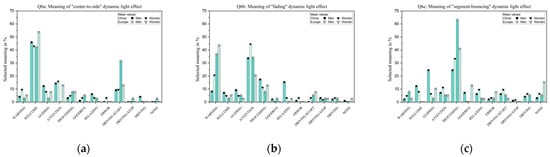
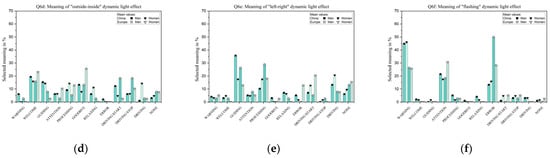
Figure 9.
For pattern (a–c) nearly unique meanings were identified. Besides, also multiple meanings were selected as shown in (f). For (d,e) no clear pattern meaning was identified.
5.7. Question VII—Qualitative Results
The last part of the online survey used three qualitative non-mandatory questions to give the participants the possibility to write from their point of view. To display the answers of Questions i–ii, see Section 4; the word cloud technique from MATLAB © was applied. Results are separated between genders and shown in Figure 10a–d.
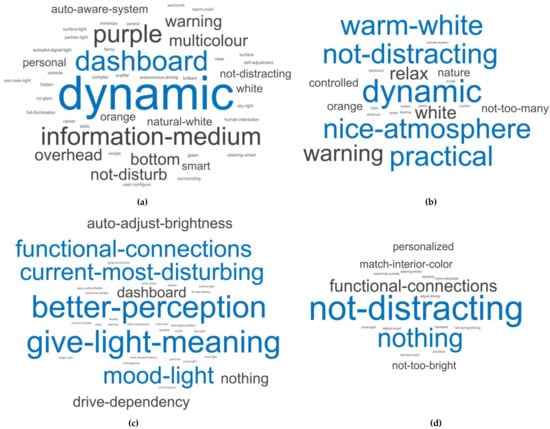
Figure 10.
Word cloud results displayed for Q1 as “Which light system do you want to have in your future vehicle?” in (a,b). For Q2 as “If you don’t like your current interior lighting in your vehicle, which proposals you have to improve it?” in (c,d). Results are separated by genders globally. Amount n of participants for each question: (a) male answers with n = 59; (b) female answers with n = 47; (c) male answers with n = 36; (d) female answers n = 25.
The first question asked which in-vehicle lighting system participants preferred for their future vehicle. Within all male answers, there is an identification for fast-forward, dynamic and information-medium. The female participants answered in a more balanced way with multichromatic colors, nice atmosphere and controlled systems. The answers of the second question, the improvements to their current in-vehicle lighting system, were similar between both groups in terms of not distracting and safety aspects. The male side preferred more functional and perceptional improvements, whereas the female side was more conservative with “nothing” to improve.
5.8. Combined Results
The first part of the questionnaire collected user information. Besides the gender or origin background, which was primary focused for the previous results analysis, Section 5.2, Section 5.3, Section 5.4, Section 5.5, Section 5.6 and Section 5.7, there are more settings which might influence the color preference level. Since the Chinese participants were the bigger group with 161 subjects, relations between participant’s age and time of the day were investigated within this group only. Statistical tests were performed using the Mann–Whitney-U procedure, asymptotic p and the significance level α = 0.05. The results are displayed in Figure 11, for age dependency in a and time of the day dependency in b.
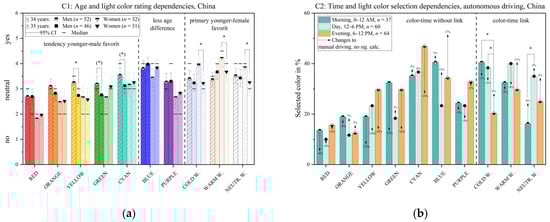
Figure 11.
Within the Chinese participants only: (a) age and light color preferences; (b) time of the day and color selection dependencies; including statistical evaluations with significances p < 0.05 marked with * or for p ≤ 0.06 marked with (*).
Significant differences were observed within the Chinese age settings: blue and purple were less age-dependent, other monochromatic colors might have a more attractive function for younger male and multichromatic ones might be more related to younger female Chinese participants. Effect power r indicated a weak to medium size with r between 0.23 and 0.38. Within the time of the day, more Chinese participants selected as their preferred colors multichromatic ones in the evening time for autonomous driving. For manual driving, no significances were found. Effect power r shows a weaker distribution within 0.20.
Significant differences within all participants globally regarding the weather settings were also identified, as shown in Figure 12a. Cyan and blue colors were more selected during no-sunshine settings compared to sunny days, with a weak effect size of r around 0.14–0.23. Last, there was a considerable support for in-vehicle lighting identified within all participants globally. In Figure 12b, 79% of all participants wanted to have an interior lighting system in their new vehicle as presented in this online survey. Most of them already in moderate vehicle price classes. Detailed statistics for the combined results are added in the Supplementary Materials of this study, Section S3, Tables S13–S15.
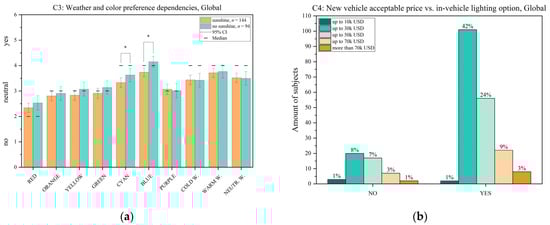
Figure 12.
(a) Global relations between weather and color preferences; (b) expected vehicle price with in-vehicle lighting options. Statistical evaluations with significances p < 0.05 marked with *.
6. Discussion
At around 17 min as shown in Table 3, the total participation time of the subject was quite long. Common marketing questionnaires can be completed within several minutes. An efficient time range of 10–20 min for scientific surveys could be identified out of the literature [38], which shows that our survey duration is within the higher recommendation time. On the one hand, since the complete survey was globally published with free access, a longer time can be used as a kind of protection against not meaningful or just-for-fun answers. On the other hand, if the number of questions is too high, the subjects might start to lose interest or become annoyed, which leads finally to a cancellation without finishing the survey. Within our analysis, we only considered fully completed answers. Definitely, the comments out of the quantitative results can be interpreted as meaning full and topic-based participation which points to the fact that we reached a valuable target group, compare Figure 10.
After the collection of the personal information, the first lighting question asked about color preferences realized as a line-shape at the door position. Within all four participating groups, Chinese male and female, European male and female, three categories could be identified named as polarization, attraction and merging as shown in Figure 2. Color preferences between genders and origins are already scientifically established. In one investigation, a comparison between people from China and the United Kingdom, the resulting preference tendency followed synchronized within all gender distributions with a small variation for the UK male group for several hue angles [39]. The average highest preference level within females was for the reddish-pink and for the male the bluish-green area, which partially match our results where the blue-cyan area was the highest preferred level, too. Since in our study the pink hue is missing, there is no comparison. In addition, there might be a physiological-evolutional-gender-based explanation which is connected with the opponent color theory by Ewald Hering, on chromosome or on testosterone levels, as mentioned in some theories [40,41]. A more reasonable explanation might be on the context-based level: a color-preference is grounded based on growing-up, learning, education, social experiences and background as already shown by a color rating of daily used objects [42]. Supporting studies found that the preference rating for the color red clearly depended on the context in which it was rated [43]. The gender and origin merging effect of the multichromatic one can also be explained more besides the opponent color theory, because sunlight preferences might be available within all people. In addition, for warm-white and cold-white ones a recently performed study confirmed a higher satisfaction level within their 29 Korean students as subjects within a vehicle context [23].
The second part of the survey showed connections between joy, fatigue, attention and relaxation within the 10 proposed hues. For joy and fatigue there was no color identified which has a significant positive impact to one of these emotions. In comparison to attention and relax, where clear colors could be identified either for support or contradiction within genders and origins. Other studies found more lighter colors like yellow, orange or red are connected to joy and in addition with blue and green color for relaxation [44]. The missing clear color connection between joy and fatigue in our survey might be connected with the way how the colors are presented: we used a black dark-mode theme with small line lights positioned at the door for a major signaling purpose. The ratio of the color compared to the background might be too low to achieve a high-level feeling like joy or fatigue. On the other hand, to achieve an impulse of attention or relaxing, these settings might be useful as we could achieve there more significant differences within genders and origins. In particular, for red as the highest attention level and multichromatic colors as the lower level, supporting results from other studies could be found [23]. By evaluating the slope tendencies between the Europe and the Chinese attention ratings, there is a clear difference shown: for Chinese participants, the slope is nearly horizontal with a small blue peak. By contrast: for the Europeans curve the fitting slope is clear negative by visuals, meaning there might be additional stimuli or dynamics needed for setting up a global feeling of attention.
For both groups, the first two color topics about preference and moods, by sorting the colors according to increasing hue angles, we were able to achieve synchronized tendencies within origin and gender. As with the Geneva Emotion Wheel [45,46], it might be possible by more detailed research to create a vehicle-mood color wheel including at least origin and gender in-wheel selections.
There were no differences observed between lighting positions if the context changed from the second row to the first row. Within both settings, the foot and the door area followed by the center, seat and screen area were highly rated within both genders and origin groups. Other studies confirmed the higher rating for the door position adding interpretation of a more luxury feeling, an activating effect and better perception of the vehicle interior in the door illumination context [9]. They found a worse rating for the foot area as less pleasant and less comfortable, which are opposite results compared to our study. In a recent study, foot and door in-vehicle lighting collected the second and third highest ranking after lights for reading purposes, which supports our findings as well [47]. By using iVLS for information transmission as iVLSa, the centralized dashboard position was assumed as a preferred position by 58 participants from Germany with no gender or statics information [24]. Differences between autonomous and manual driving are major observed for the lighting positioning selection, in which for the vehicle self-driving mode, most subjects preferred more light at more in-vehicle positions. Within the colors, there were more subjective changes observed, see Figure 8a,b.
For the meaning of the dynamic light pattern, at first the interpretation of male and female participants is closer within all six different light effects. For welcome, attention, processing, guiding and warning favorable effects were identified. Nevertheless, especially for the commonly used flash-light effect, three meanings out of the driving context were identified which could match to its appearance. This is a clear recommendation that light alone as communication medium might be less meaningful without global standards and learning sessions especially for the coming autonomous driving evolution.
The answers to the quantitative questions 1 and 2, see Figure 10a–d, continue to support that there are expected differences between male and female priorities for the future automotive iVLS. Women focused more on safety or practical reasons, whereas men concentrated more to follow the trend of fast-forward. From a sociological point of view, we know that women primary looking for more stable conditions and men have more tendencies for risk orientation although the latest studies evaluated this long clientele in a different way based on modern risk definitions [48]. Anyway, this more stable controlled and orientated female setting was also observed for mentioned color-mood group like connecting a nice atmosphere with a warm-white color, see Figure 10b.
The last findings of this study were derived indirectly, not as a result of questions asked in the survey. First, by using the bigger Chinese participant group, age- and time-color relations and within all participants globally, weather-color relations could also be identified. These so-called surrounding influences are already well understood for general indoor illumination settings. Focusing on healthy lighting, high brightness with cold-white color settings should be applied in the morning and warm-white with low brightness settings should be applied during evening times to support our biological clock and follow the natural sunlight spectrum [49]. For in-vehicle lighting, such a correlation with the driving context is still not fully understood.
Within the complete study, there were some limitations which should be summarized. First, the sample size of subjects out of the English survey participants was relatively small. Since our study was based on voluntary participation compared to commercial approaches, like using Amazon’s MTurk service, we focused also on interests, shown in the quantitative section. However, the observed statistical power is lower compared to the Chinese group. In addition, more balanced sample groups would lead to a further increase of the statistical power. However, we preferred to show smaller effects within smaller sample groups instead of skipping them to underline the needs for the so far less investigated iVLS. Second, since globalization is an active part of our current society, we set the preferred operating language including their origin as the group divider between Chinese and European participants. Other approaches for a stricter culture-based group division could be based on religion, which we did not track during our data collection. Third, there might be an increased family error or type-1 error by multiple testing of the same sample size since we did not perform any alpha correction. The major reason for this is that we wanted to identify significant changes within our uncontrolled online condition. By applying an alpha correction method, the type-2 statistical error, which represents the not-identification of a population-connected tendency, would be increased. Since our study was an initial analysis, we focused more on findings of tendencies. In addition, the meaning of applying the alpha correction is still being discussed [50]. Finally, there was no control about color or brightness accuracy following standards like CIE 1931 since we were only able to use RGB values to realize a spectral stimulus without the proof of a calibrated display. Also, for the selected CCT values categorized for a warm, neutral and cool appearance, a clear visual rendered difference was focused upon, not its actual value. Therefore, all our selected colors are widely separated between each other to achieve a clear initial identification which will be confirmed in coming laboratory studies.
7. Conclusions
The orientation for the current evolution within the automotive industry is clear: do not just develop a vehicle. Instead, design a personalized, highly connected and self-adapting third living driving space with meaningful illumination following a literature conclusion that in-vehicle lighting is more important for long time preference, whereas exterior lighting motivates the first impression of a vehicle [47]. However, which in-vehicle lighting setting should a modern vehicle serve for this new generation? Our study presented a first approach to identify differences between women and men from China and Europe for a signaling purpose. Main findings out of 238 study participants are significant relations (p < 0.05) between 10 hues with preferences, moods, driving-modes, age, time and weather conditions within the in-vehicle context. Within these, three key findings are highlighted:
- -
- Identification of three color-preference groups with a polarized, accepted or merged character.
- -
- For the important driving-signaling mood of attention, a strong hue dependency for European participants was observed but was missing for the Chinese participants.
- -
- No differences were observed for all eight light positions between Chinese and European participants. The door and the foot position are favored for both.
According to these findings from global subjects, we were able to start a novel iVLS categorization for light colors and light positions in a signaling purpose, which was never achieved before. In addition, from the subjective opinions of participants a demand for light was observed to support car occupants as a new partner in a safe way. For that aim, our result presents a starting point of the modern human based in-vehicle lighting context which was very less investigated until now. To create this new framework which is able to fulfill these highly adaptable new requirements, further human-factor research needs to be performed to detail our approach.
Supplementary Materials
The following are available online at https://www.mdpi.com/article/10.3390/app12020552/s1, Section S1, Tables S1–S8: Statistics of color-moods preferences, Section S2, Tables S9–S12: Statistics of light position preferences, Section S3, Tables S13–S15: Statistics of color-age-, color-time- and color-weather distribution.
Author Contributions
Conceptualization, C.W.; methodology, C.W.; software, C.W.; formal analysis, C.W.; writing—original draft preparation, C.W.; writing—review and editing, C.W., Y.L. and T.Q.K.; supervision, Y.L. and T.Q.K. All authors have read and agreed to the published version of the manuscript.
Funding
This research received no external funding.
Institutional Review Board Statement
Not applicable.
Informed Consent Statement
Not applicable.
Data Availability Statement
The data presented in this study are available in Supplementary Materials.
Acknowledgments
The authors would like to thank all people who participated in the study.
Conflicts of Interest
The authors declare no conflict of interest.
References
- Prodin, T.; Miller, R.; Lossing Jeffrey, S.; McQuad Heldke Michelle, L. Vehicle Interior Lighting System with Welcome and Farewell Stages. U.S. Patent 8,476,832 B2, 2 July 2013. [Google Scholar]
- Daimler AG. Meet the S-Class DIGITAL: “Luxury & Well-Being”: Personal Wellness Oasis: Comfortable Travel While Staying Fit. Available online: https://media.daimler.com/marsMediaSite/en/instance/ko.xhtml?oid=47054163 (accessed on 30 September 2021).
- Automotive-World. Camaro 2016 Wows Visitors with Flowing Ambient Light from Hella. Available online: https://www.automotiveworld.com/news-releases/camaro-2016-wows-visitors-flowing-ambient-light-hella (accessed on 30 September 2021).
- Daimler AG. Der Fond der Neuen Mercedes-Maybach S-Klasse. Available online: https://media.mercedes-benz.com/article/da2c8da8-ca36-4ebc-951f-794dd9a5ffc1 (accessed on 30 September 2021).
- I-Micronews. Automotive Interior—From Lighting, Sensing to Display Technologies 2020. Available online: https://www.i-micronews.com/products/automotive-interior-from-lighting-sensing-to-display-technologies-2020 (accessed on 30 September 2021).
- Matviienko, A.; Rauschenberger, M.; Cobus, V.; Timmermann, J.; Fortmann, J.; Löcken, A.; Müller, H.; Trappe, C.; Heuten, W.; Boll, S. Towards New Ambient Light Systems: A Close Look at Existing Encodings of Ambient Light Systems. Interact. Des. Archit. (S) J.-IxDA 2015, 26, 10–24. [Google Scholar]
- Cervi, M.; Pappis, D.; Campos, A.; Prado, R.N.D. Omnibus interior lighting system using LEDs and automotive communication network. Sba Controle Automação Soc. Bras. Autom. 2006, 17, 205–212. [Google Scholar] [CrossRef][Green Version]
- Blankenbach, K.; Hertlein, F.; Hoffmann, S. Advances in automotive interior lighting concerning new LED approach and optical performance. J. Soc. Inf. Disp. 2020, 28, 655–667. [Google Scholar] [CrossRef]
- Caberletti, L.; Elfmann, K.; Kummel, M.; Schierz, C. Influence of ambient lighting in a vehicle interior on the driver’s perceptions. Lighting Res. Technol. 2010, 42, 297–311. [Google Scholar] [CrossRef]
- Löcken, A.; Yan, F.; Heuten, W.; Boll, S. Investigating driver gaze behavior during lane changes using two visual cues: Ambient light and focal icons. J. Multimodal User Interfaces 2019, 13, 119–136. [Google Scholar] [CrossRef]
- Löcken, A.; Heuten, W.; Boll, S. Supporting lane change decisions with ambient light. In Proceedings of the 7th International Conference on Automotive User Interfaces and Interactive Vehicular Applications, Nottingham, UK, 1–3 September 2015; pp. 204–211. [Google Scholar]
- Wilbrink, M.; Kelsch, J.; Schieben, A. Ambient light based interaction concept for an integrative driver assistance system—A driving simulator study. In Proceedings of the Human Factors and Ergonomics Society Europe, Prague, Czech Republic, 26–28 October 2016; pp. 171–182. [Google Scholar]
- Hipp, M.; Löcken, A.; Heuten, W.; Boll, S. Ambient Park Assist: Supporting Reverse Parking Maneuvers with Ambient Light. In Proceedings of the 8th International Conference on Automotive User Interfaces and Interactive Vehicular Applications, Ann Arbor, MI, USA, 24–26 October 2016; pp. 45–50. [Google Scholar]
- Morales-Alvarez, W.; Sipele, O.; Léberon, R.; Tadjine, H.H.; Olaverri-Monreal, C. Automated Driving: A Literature Review of the Take over Request in Conditional Automation. Electronics 2020, 9, 2087. [Google Scholar] [CrossRef]
- Capalar, J.; Olaverri-Monreal, C. Hypovigilance in limited self-driving automation: Peripheral visual stimulus for a balanced level of automation and cognitive workload. In Proceedings of the 2017 IEEE 20th International Conference on Intelligent Transportation Systems (ITSC), Yokohama, Japan, 16–19 October 2017. [Google Scholar]
- Mahlke, S.; Rösler, D.; Seifert, K.; Krems, J.; Thuering, M. Evaluation of Six Night Vision Enhancement Systems: Qualitative and Quantitative Support for Intelligent Image Processing. Hum. Factors 2007, 49, 518–531. [Google Scholar] [CrossRef] [PubMed]
- Löcken, A.; Frison, A.-K.; Fahn, V.; Kreppold, D.; Götz, M.; Riener, A. Increasing User Experience and Trust in Automated Vehicles via an Ambient Light Display. In Proceedings of the 22nd International Conference on Human-Computer Interaction with Mobile Devices and Services, Oldenburg, Germany, 5–8 October 2020. [Google Scholar]
- Yang, Y.; Karakaya, B.; Dominioni, G.C.; Kawabe, K.; Bengler, K. An HMI Concept to Improve Driver’s Visual Behavior and Situation Awareness in Automated Vehicle. In Proceedings of the 2018 21st International Conference on Intelligent Transportation Systems (ITSC), Maui, HI, USA, 4–7 November 2018. [Google Scholar]
- Louw, T.; Madigan, R.; Lee, Y.M.; Marco, C.D.; Mallada, J.L.; Merat, N. Don’t Worry, I’m in Control! Is Users’ Trust in Automated Driving Different When Using a Continuous Ambient Light HMI Compared to an Auditory HMI? In Proceedings of the AutomotiveUI ’21, Leeds, UK, 9–14 September 2021; pp. 220–222. [Google Scholar]
- Wang, M.; Liao, Y.; Lyckvi, S.L.; Chen, F. How drivers respond to visual vs. auditory information in advisory traffic information systems. Behav. Inf. Technol. 2020, 39, 1308–1319. [Google Scholar] [CrossRef]
- Flannagan, M.J.; Devonshire, J.M. Effects of Automotive Interior Lighting on Driver Vision. Leukos 2012, 9, 9–23. [Google Scholar] [CrossRef]
- Blankenbach, K.; Brezing, K.; Reichel, S. Evaluation of luminance vs. brightness for automotive RGB LED light guides in autonomous cars. In Proceedings of the Illumination Optics VI, Madrid, Spain, 13–16 September 2021; Volume 11874. [Google Scholar]
- Kim, T.; Kim, Y.; Jeon, H.; Choi, C.-S.; Suk, H.-J. Emotional Response to In-Car Dynamic Lighting. Int. J. Automot. Technol. 2021, 22, 1035–1043. [Google Scholar] [CrossRef]
- Löcken, A.; Unni, A.; Müller, H.; Rieger, J.; Heuten, W.; Boll, S. The Car That Cares: Introducing an in-vehicle ambient light display to reduce cognitive load. In Proceedings of the AutomotiveUI ’13, Eindhoven, The Netherlands, 27–30 October 2013. [Google Scholar]
- Hooft van Huysduynen, H.; Terken, J.; Meschtscherjakov, A.; Eggen, B.; Tscheligi, M. Ambient Light and its Influence on Driving Experience. In Proceedings of the 9th International Conference on Automotive User Interfaces and Interactive Vehicular Applications, Oldenburg, Germany, 24–27 September 2017; pp. 293–301. [Google Scholar]
- Rodríguez-Morilla, B.; Madrid, J.A.; Molina, E.; Pérez-Navarro, J.; Correa, Á. Blue-Enriched Light Enhances Alertness but Impairs Accurate Performance in Evening Chronotypes Driving in the Morning. Front. Psychol. 2018, 9, 688. [Google Scholar] [CrossRef]
- Rodríguez-Morilla, B.; Madrid, J.A.; Molina, E.; Correa, A. Blue-Enriched White Light Enhances Physiological Arousal But Not Behavioral Performance during Simulated Driving at Early Night. Front. Psychol. 2017, 8. [Google Scholar] [CrossRef] [PubMed]
- Weisgerber, D.M.; Nikol, M.; Mistlberger, R.E. Driving home from the night shift: A bright light intervention study. Sleep Med. 2017, 30, 171–179. [Google Scholar] [CrossRef] [PubMed]
- Wördenweber, B.; Boyce, P.; Hoffman, D.D.; Wallaschek, J. Automotive Lighting and Human Vision; Springer: Berlin/Heidelberg, Germany, 2007; Volume 1. [Google Scholar]
- Wolska, A.; Sawicki, D.; Tafil-Klawe, M. Visual and Non-Visual Effects of Light: Working Environment and Well-Being; CRC Press: Boca Raton, FL, USA, 2020. [Google Scholar] [CrossRef]
- US Department of Transportation. National Standards for Traffic Control Devices; The Manual on Uniform Traffic Control Devices for Streets and Highways; 23 CFR Part 655, FHWA Docket No. FHWA–2007–28977; Federal Highway Administration: Washington, DC, USA, 2009.
- Werner, A. New colours for autonomous driving: An evaluation of chromaticities for the external lighting equipment of autonomous vehicles. Colour Turn 2018. [Google Scholar] [CrossRef]
- Jamieson, S. Likert scales: How to (ab)use them. Med. Educ. 2004, 38, 1217–1218. [Google Scholar] [CrossRef] [PubMed]
- De Winter, J.F.; Dodou, D. Five-point likert items: T test versus Mann-Whitney-Wilcoxon (Addendum added October 2012). Pract. Assess. Res. Eval. 2010, 15, 11. [Google Scholar]
- Newton, I. Opticks: Or, A Treatise of the Reflections, Refractions, Inflections and Colours of Light; Sam. Smith & Benj.: London, UK; p. 1704.
- Fritz, C.O.; Morris, P.E.; Richler, J.J. Effect size estimates: Current use, calculations, and interpretation. J. Exp. Psychol. Gen. 2012, 141, 2–18. [Google Scholar] [CrossRef] [PubMed]
- Cohen, J. Statistical Power Analysis for the Behavioral Sciences, 2nd ed.; Routledge: New York, NY, USA, 1988. [Google Scholar]
- Revilla, M.; Ochoa, C. Ideal and Maximum Length for a Web Survey. Int. J. Mark. Res. 2017, 59, 557–565. [Google Scholar] [CrossRef]
- Hurlbert, A.C.; Ling, Y. Biological components of sex differences in color preference. Curr. Biol. 2007, 17, R623–R625. [Google Scholar] [CrossRef]
- Hurvich, L.M.; Jameson, D. An opponent-process theory of color vision. Psychol. Rev. 1957, 64, 384. [Google Scholar] [CrossRef]
- Fider, N.A.; Komarova, N.L. Differences in color categorization manifested by males and females: A quantitative World Color Survey study. Palgrave Commun. 2019, 5, 142. [Google Scholar] [CrossRef]
- Smet, K.; Lin, Y.; Nagy, B.; Németh, Z.; Duque-Chica, G.; Quintero, J.; Chen, H.-S.; Luo, M.; Safi, M.; Hanselaer, P. Cross-cultural variation of memory colors of familiar objects. Opt. Express 2014, 22, 32308–32328. [Google Scholar] [CrossRef] [PubMed]
- Maier, M.A.; Barchfeld, P.; Elliot, A.J.; Pekrun, R. Context specificity of implicit preferences: The case of human preference for red. Emotion 2009, 9, 734–738. [Google Scholar] [CrossRef]
- Jonauskaite, D.; Althaus, B.; Dael, N.; Dan-Glauser, E.; Mohr, C. What color do you feel? Color choices are driven by mood. Color Res. Appl. 2019, 44, 272–284. [Google Scholar] [CrossRef]
- Scherer, K.R. What are emotions? And how can they be measured? Soc. Sci. Inf. 2005, 44, 695–729. [Google Scholar] [CrossRef]
- Scherer, K.R.; Shuman, V.; Fontaine, J.; Soriano Salinas, C. The GRID meets the Wheel: Assessing emotional feeling via self-report. Compon. Emot. Mean. A Sourceb. 2013. [Google Scholar] [CrossRef]
- Stylidis, K.; Woxlin, A.; Siljefalk, L.; Heimersson, E.; Söderberg, R. Understanding light. A study on the perceived quality of car exterior lighting and interior illumination. Procedia CIRP 2020, 93, 1340–1345. [Google Scholar] [CrossRef]
- Morgenroth, T.; Fine, C.; Ryan, M.K.; Genat, A.E. Sex, Drugs, and Reckless Driving. Soc. Psychol. Personal. Sci. 2018, 9, 744–753. [Google Scholar] [CrossRef]
- Biologically Effective Illumination-Design Guidelines; DIN SPEC 67600: 2013-04; Beuth Verlag: Berlin, Germany, 2013.
- Perneger, T.V. What’s wrong with Bonferroni adjustments. BMJ 1998, 316, 1236–1238. [Google Scholar] [CrossRef]


Publisher’s Note: MDPI stays neutral with regard to jurisdictional claims in published maps and institutional affiliations. |
© 2022 by the authors. Licensee MDPI, Basel, Switzerland. This article is an open access article distributed under the terms and conditions of the Creative Commons Attribution (CC BY) license (https://creativecommons.org/licenses/by/4.0/).