1. Introduction
1.1. Motivations
Vulnerabilities are weaknesses in the computational logic (e.g., code) of software and hardware components that, when exploited, have a negative effect on confidentiality, integrity, or availability [
1,
2,
3]. New vulnerabilities will be added to the numerous vulnerability databases, with the National Vulnerability Database (NVD) of the United States being among the most well-known. According to NVD statistics, there is a time delay between the Common Vulnerabilities and Exposures (CVEs) in the National Vulnerability Database (NVD) and the Common Vulnerability Scoring System (CVSS) information attached to the published CVEs. Research by Chen, H. and Ruohonen, J. showed that vulnerability assessors’ assessment of the severity of vulnerability lags behind the time of vulnerability exposure by more than 130 days [
4,
5]. However, there is an urgent need for the repair of high-risk vulnerabilities. For instance, the US BINDING OPERATIONAL DIRECTIVE 19-02 states that federal agencies in the US must remediate critical vulnerabilities within 15 calendar days of initial detection and vulnerabilities with high severity within 30 calendar days of initial detection [
6,
7]. If vulnerability severity is not evaluated in a timely manner, vulnerability remediation efforts will be greatly hampered in the face of rising vulnerabilities. This study aims to provide a method for rapidly assessing vulnerability metric values in order to aid assessment experts in accelerating the assessment process and reducing the time necessary for evaluation.
1.2. Background
1.2.1. Vulnerability Outbreak Trend
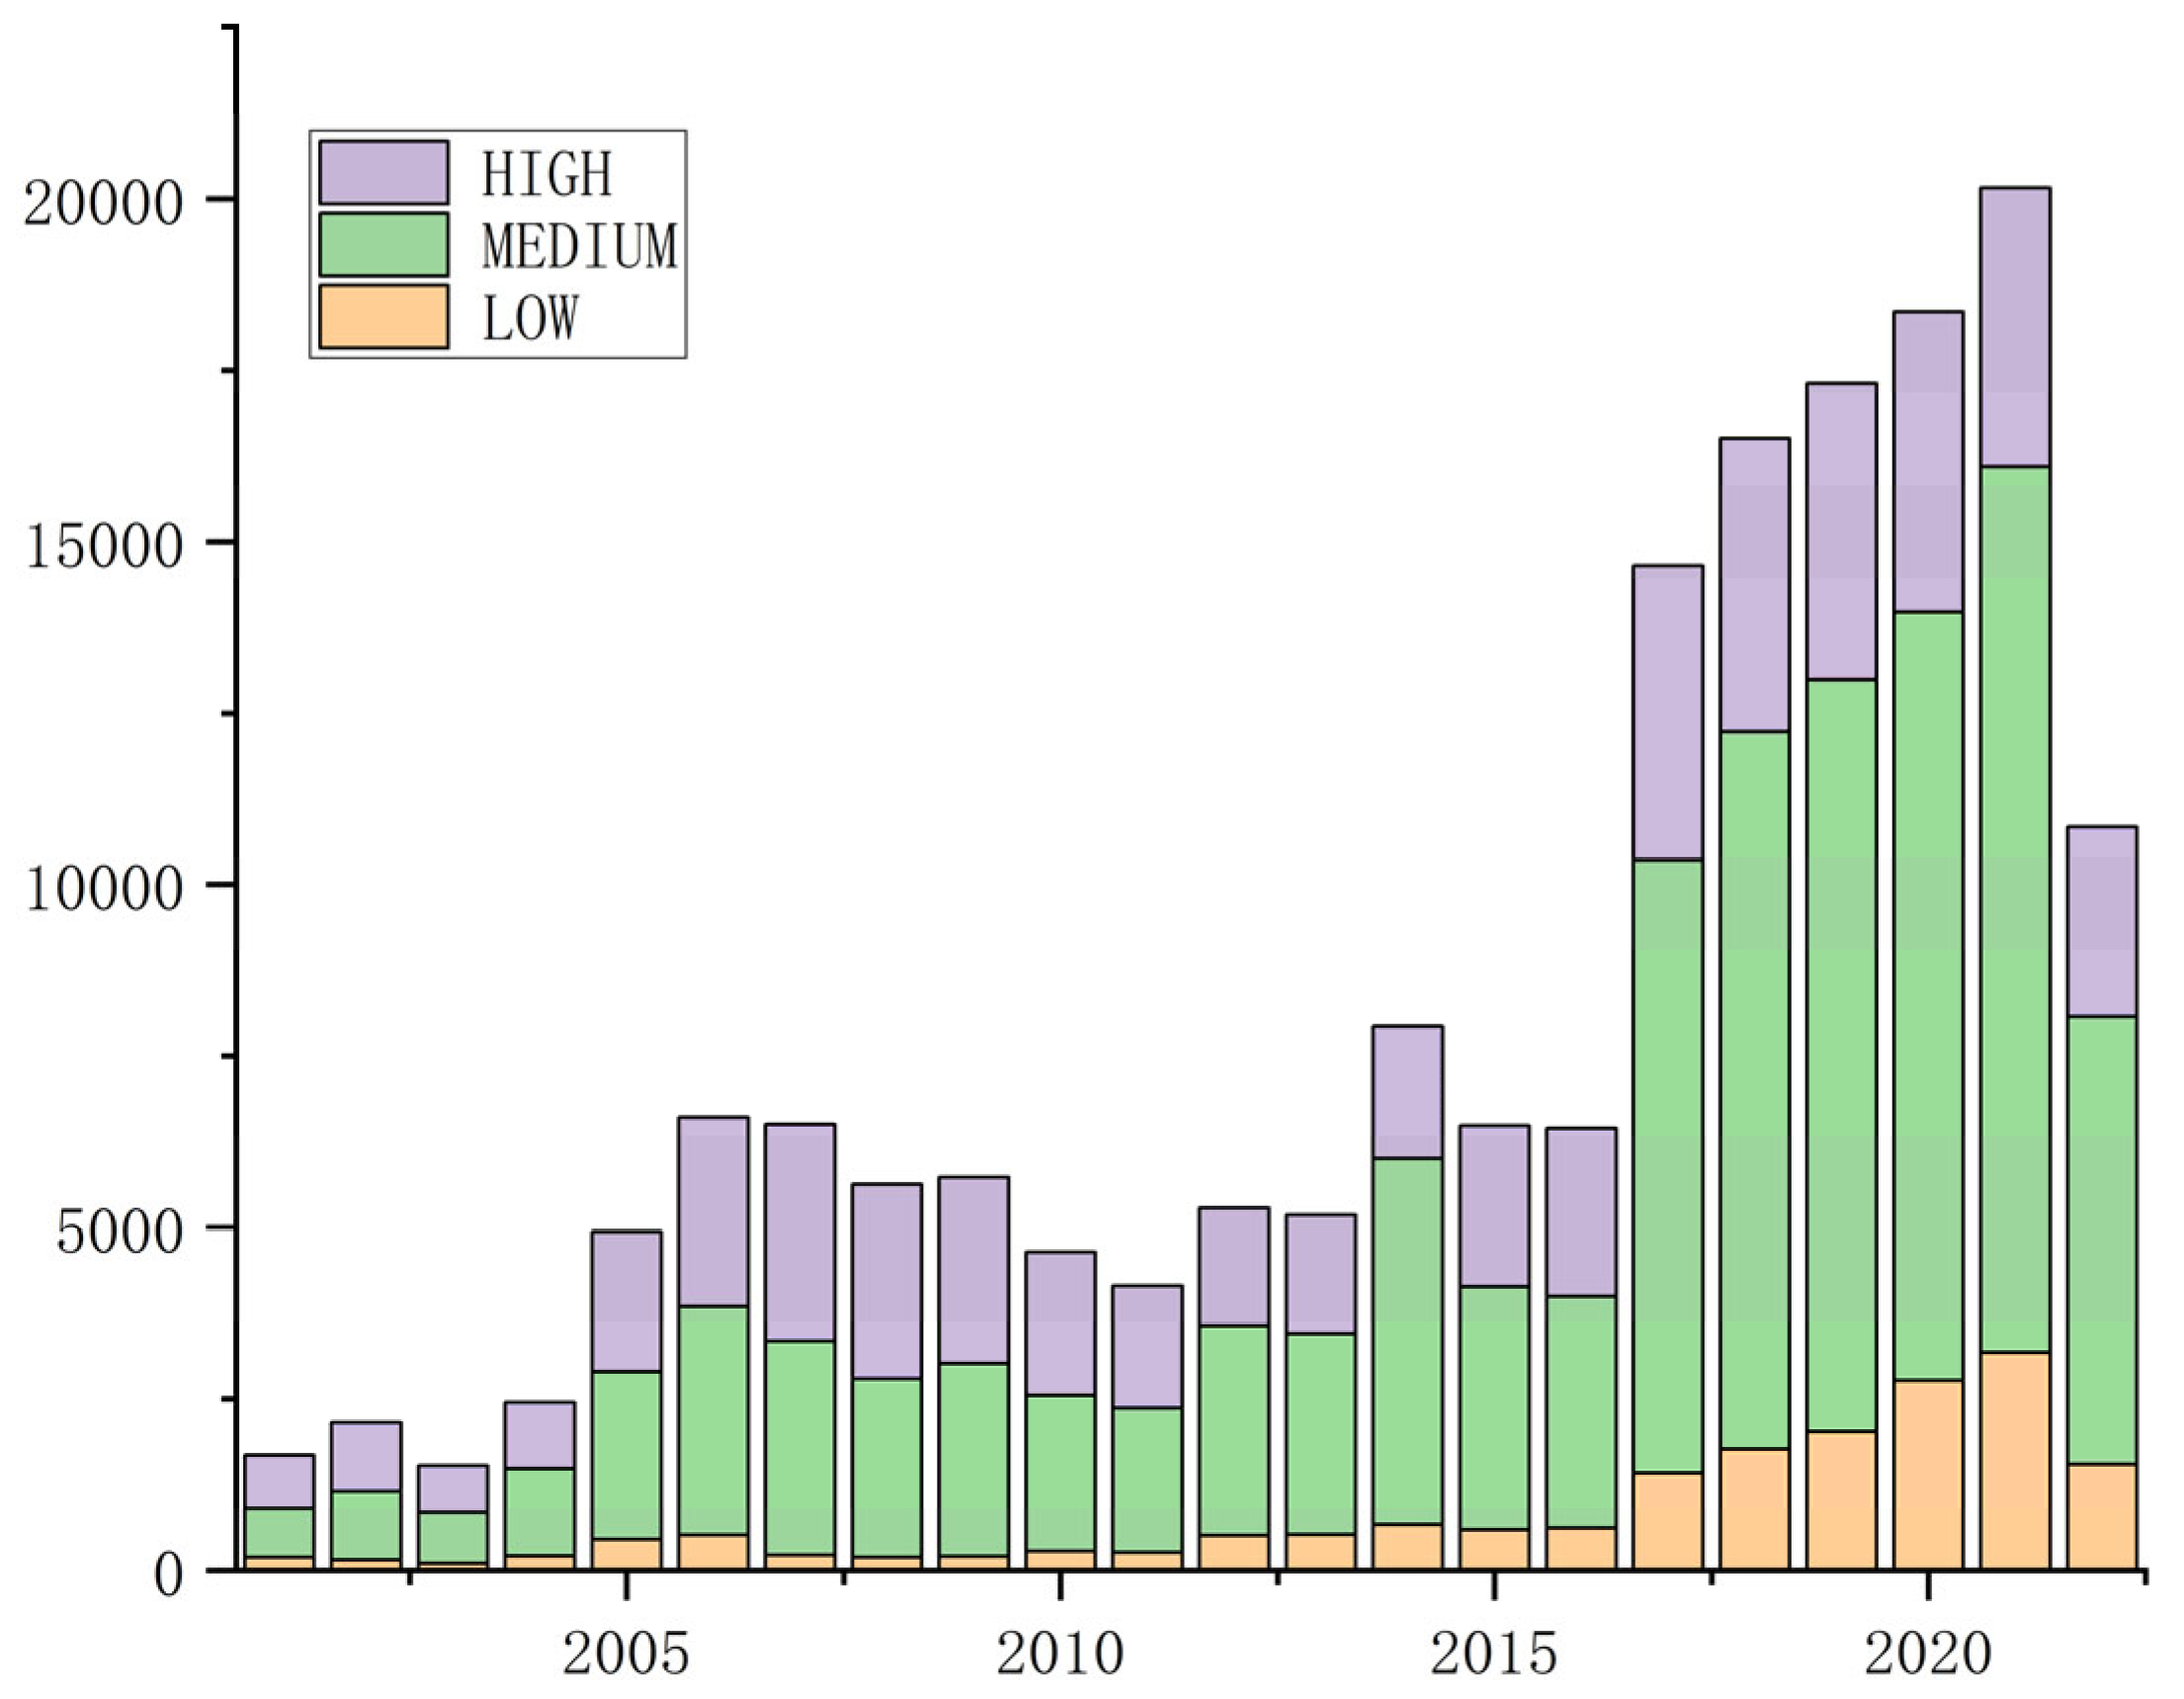
According to NVD statistics, the number of vulnerabilities exhibited a year-over-year increase and entered a period of rapid expansion in 2017. The relevant trend is shown in
Figure 1, as of 18 June 2022, the NVD vulnerability database has registered 189,155 vulnerabilities. So far this year, 11,644 vulnerabilities have been accepted, with 2757 vulnerabilities undergoing analysis and 259 vulnerabilities awaiting investigation [
8]. Work on vulnerability assessment must be expedited in order to respond to the present circumstances of a widespread outbreak of vulnerabilities.
1.2.2. The Common Vulnerability Scoring System
CVSS Overview
The Common Vulnerability Scoring System (CVSS) is an open framework developed by FIRST.Org, Inc. (FIRST) to characterize and quantify vulnerabilities. CVSS consists of three metric groups: base metric group, temporal metric group, and environmental metric group. Since major vulnerability databases only provide base scores, the base metric group is the most used. The focus of this study is the base metric group. The base metric group reflects the inherent properties of vulnerabilities that remain unchanged over time and across user environments [
9]. The base metric group generates scores ranging from 0 to 10. The score and severity mapping table defined by CVSS is shown in
Table 1. The CVSS score can also be shown as a vector string, which is a textual and compact way of representing the metric value. The NVD, when using the CVSS, usually gives a string representation of the description and the corresponding vulnerability metric values. The composition and value range of the base metric group and the vector strings corresponding to the metric values for both versions are shown in
Table 2 and
Table 3. When using CVSS for scoring, the metric values for each metric in
Table 2 and
Table 3 are selected. The metric values are substituted into the CVSS quantification formula to obtain the base score. Finally, the base score can be converted into a vulnerability rating according to
Table 1. The data in
Table 1,
Table 2 and
Table 3 are from the CVSS official website [
10,
11].
Introduction to CVSS Metrics
1.2.3. XLNet Model
XLNet is an autoregressive language model that can acquire bidirectional contextual information. To achieve bidirectional contextual information, XLNet mainly adopts three methods, i.e., the permutation language model, two-stream self-attention, and the circulation mechanism [
12]. The core of XLNet is the permutation language model. To extract bidirectional contextual information, the algorithm uses the random ordering of the initial input order while maintaining the one-way model of the autoregressive model. For a text of length
, there are
different sorting methods; the bidirectional contextual information can be obtained indirectly by considering the whole ranking order of the text. However, computing all the ordering would consume a lot of arithmetic power. Therefore, XLNet only predicts a partial sequence. The mathematical expression of its loss function is as follows:
where
denotes the collection of total permutations of the text with a length of
,
is one of the total permutations,
denotes the
th element, and
represents the first
elements.
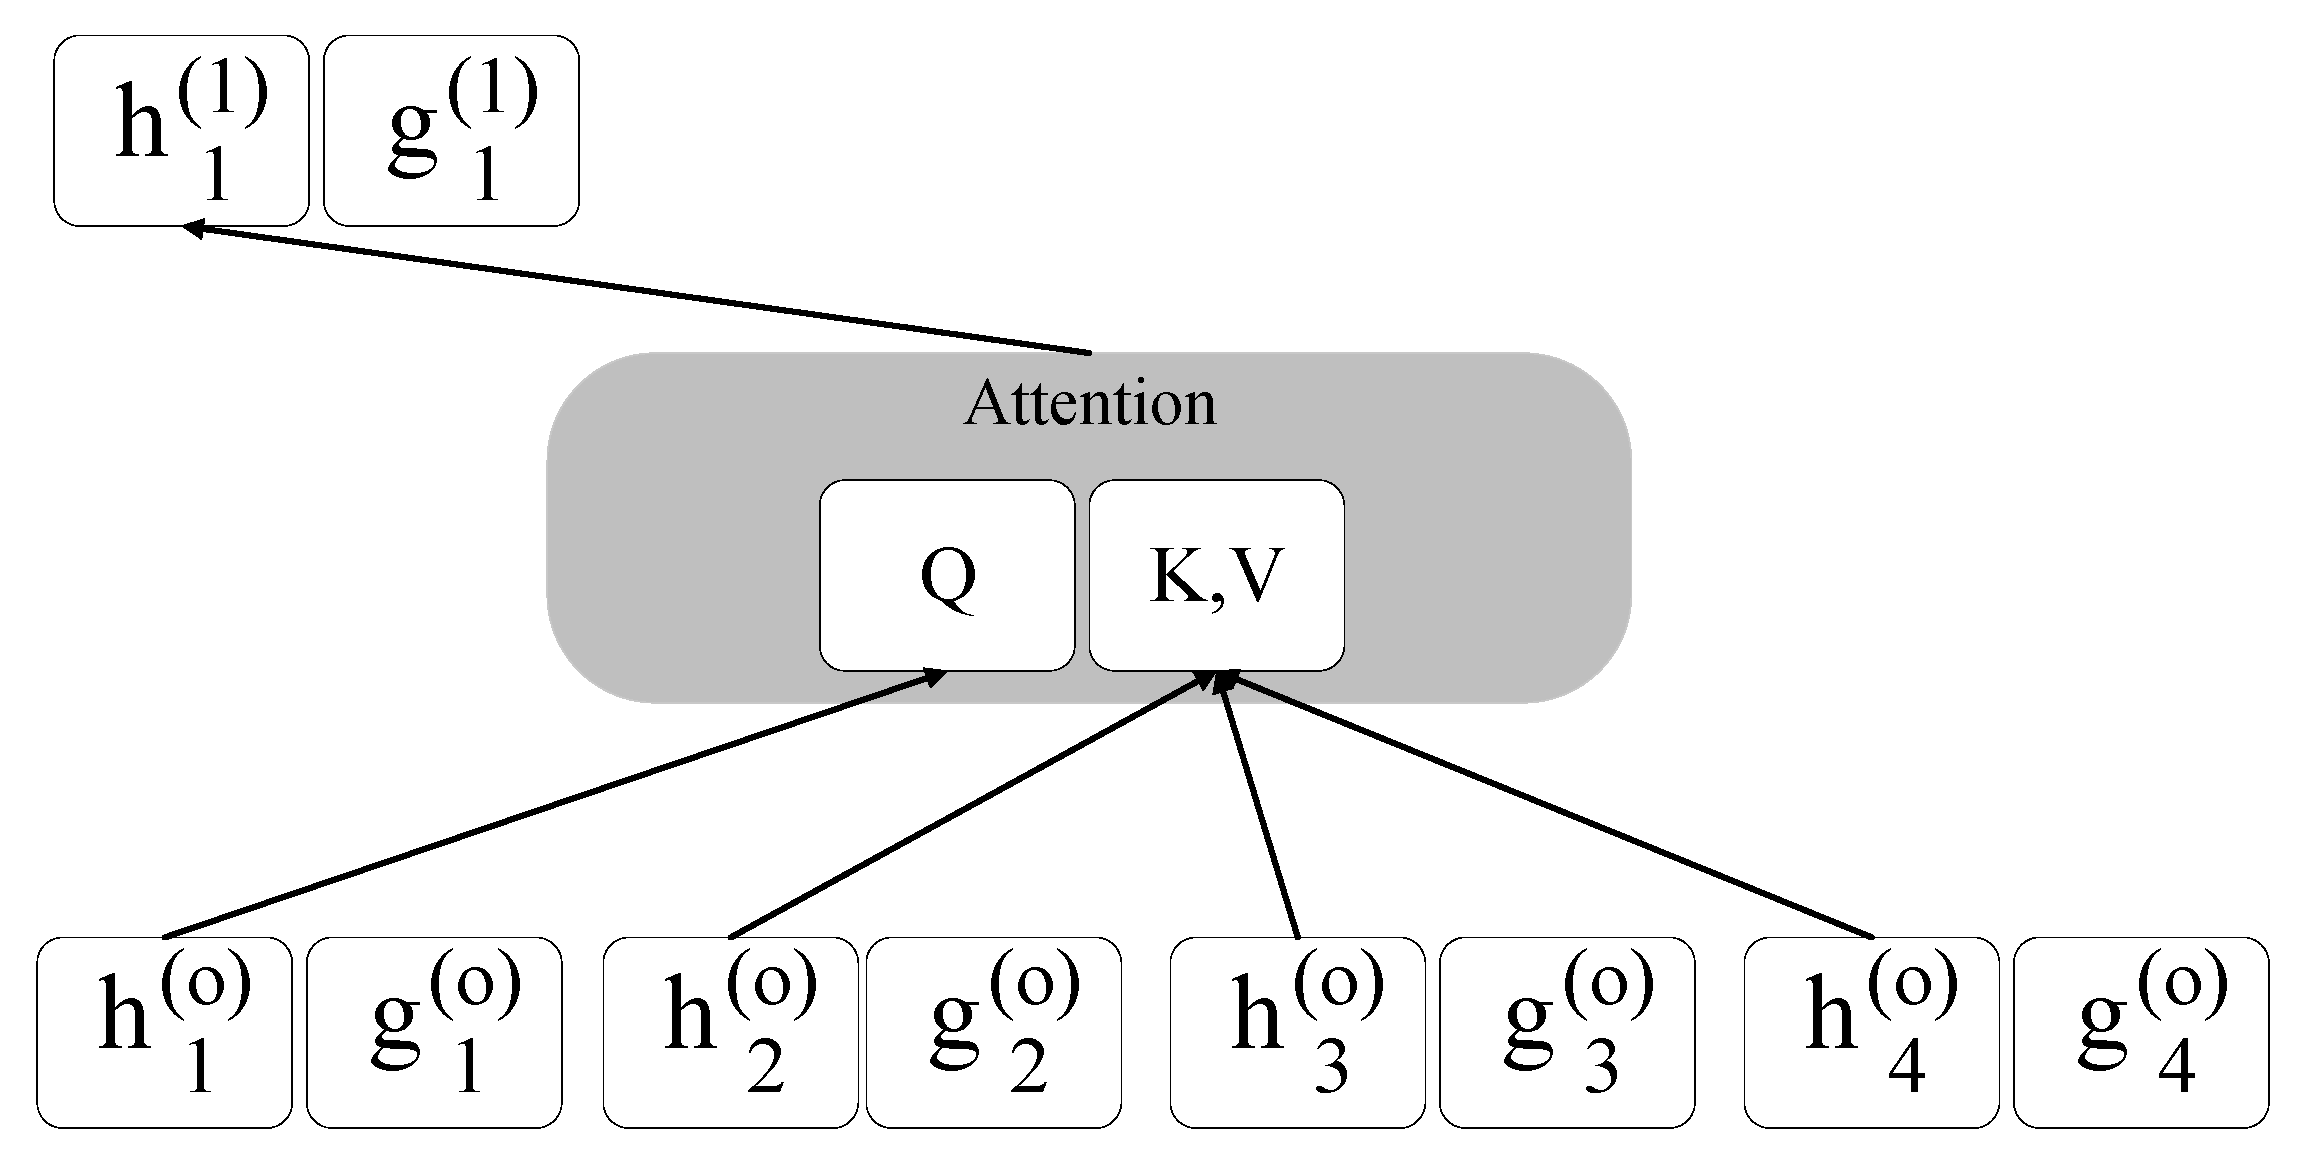
There remains one oversight to address in applying the permutation language model. For example, predicting 2 in the sequence of [1, 3, 2, 4] requires the semantic position information of 1 and 3, but only the position information of 2. However, predicting 1 in the sequence of [2, 3, 1, 4] requires the semantic information of 2, 3, 1 and the position information. In two different permutations, sometimes only the location information of 2 is needed. Sometimes, both the semantic and location information of 2 are required. In response to this issue, XLNet proposes two-stream self-attention that combines the two types of information.
Figure 2 depicts the structure of two-stream self-attention, where
represents a unit containing both semantic and location information;
represents a unit with only location information.
Moreover, XLNet integrates the current optimal autoregressive language model Trans-former-XL into XLNet and introduces two key techniques of Transformer-XL into XLNet, namely the relative positional encoding scheme and the segment recurrence mechanism.
1.3. Related Work
1.3.1. Limitations of the Common Vulnerability Scoring System
CVSS [
13,
14,
15] (Common Vulnerability Scoring System) is a de facto industry standard meant to measure the severity and urgency of vulnerabilities. A vulnerability metric value is used to represent the severity of a vulnerability. Some objective metric values are straightforward to determine, such as how the attack is launched. However, some metrics are difficult to judge, such as the possible confidentiality, availability, and overall impact of the vulnerability, which is a subjective metric that requires strong experience and expertise [
16]; different people may have different judgments, thus making it more time-consuming to assess. In contrast to the non-basic aspects of the CVSS scores, there are also researchers who evaluate vulnerabilities from a different perspective. Exploit Prediction Scoring System (EPSS) improves vulnerability prioritization by combining descriptive information about vulnerabilities (CVEs) with evidence of actual exploitation in the wild in order to assess the likelihood of vulnerabilities being exploited [
17,
18]. Keskin, Omer et al. evaluated vulnerabilities by considering the functional dependencies between vulnerable assets, other assets, and business processes. The severity of the vulnerabilities assessed based on this approach changed significantly compared to their CVSS base score [
19]. These different ideas provide good inspiration for vulnerability assessment work.
1.3.2. Limitation of Previous Studies
Currently, there are two versions of CVSS: v2 [
14] and v3 [
20]. Although the latest version is v3.1, the v2 version is still widely used and has a certain lifespan. Current research on vulnerability assessment is often limited to a single CVSS version. However, the metric systems of the two versions are different, and the findings of one version cannot be effectively transferred to the other. Current research on vulnerability metrics tends to study metrics individually. However, there may be correlations between the metrics of vulnerabilities. Thus, predicting metrics separately may diminish the effectiveness of prediction. Shahid, M.R. [
21], Gong, X. [
22], and Costa, J.C. [
23] applied pre-trained models and deep learning algorithms to metric prediction work in order to improve the prediction of metric values. Nevertheless, they did not consider the correlation of the metrics’ relationships. Some studies have used word vector techniques to characterize text, although such methods do not consider the influence of context, which may contain rich information that could enhance the final prediction. Khazaei, A. [
24], Wang, P. [
25], Han, Z. [
26], and Liu, K. [
27] characterized vulnerability descriptions using traditional word vector algorithms. However, these methods did not incorporate contextual information, and hence the amount of information needed to be enhanced. Other studies directly gave possible values for severity without the intermediate process values, which is not substantially helpful to an industry that relies on CVSS quantitative equations for vulnerability assessment work. Spanos, G. [
28], Ali, M. [
29], Ameri, K. [
30], and Kudjo, P.K. [
31] applied traditional machine learning algorithms and deep learning algorithms to CVSS score prediction. These methods allowed CVSS assessment work to become more convenient, although they did not give specific metric values. This did not help in the quantitative formulation of CVSS scores that relied on metric values for scoring.
1.4. Contributions
This study provides a vulnerability metric value prediction method based on the XLNet model to enable rapid vulnerability metric value prediction. The method discovers contextual characteristics from vulnerability descriptions in order to forecast potential metric values. As compared to previous work, the paper’s main contributions are as follows:
The concept of transfer learning [
24] is presented in the realm of vulnerability assessment. The existing pre-trained model has increased maturity. Compared with the traditional model, the performance has been greatly improved. However, the application is not popular. The study extends the pre-trained model to the subject of vulnerability assessment, therefore generating novel ideas for cyber security research.
Traditional machine learning techniques simply assess the influence of word frequency on the outcomes, ignoring the context-based improvement on the final output. This paper employs the XLNet model, which incorporates contextual information and enhances the classification impact of the model.
This paper constructs two versions of the CVSS v2 and v3.1 datasets. It concurrently investigates CVSS v2 and v3.1, providing assessment experts with reasonable metric value suggestions and reducing the workload of assessors, therefore speeding up the vulnerability severity assessment.
2. Problem Formulation
Vulnerability metric value prediction is a multi-label text classification problem. A multi-label text classification algorithm is used to obtain possible metric values from vulnerability descriptions. The vulnerability description as textual information cannot be directly input into the classification model. The text information is usually converted into word vector information by the word vector algorithm. Common algorithms include One-hot, TFIDF [
32], word2vec [
33], and BERT [
34].
This paper defines the vulnerability metric value generation model as follows:
where
is a feature extracted from the text information,
is an adjustable model parameter,
is the structure of the generative model required to determine a prediction function,
denotes the probability that the value of the vulnerability metric to be predicted is within [0, 1].
is used to transform the probabilistic form of the metric values into a textual form, denotes the transformed metric values.
In this paper, the dataset of vulnerability metrics prediction is denoted as , where , and is the description of the th vulnerability. Accordingly, is the truth-value label vector, while is the label of . In this paper, a multi-label classification text problem is investigated. To get the probability of each label value, we split the multi-label multi-classification text problem into a multi-label text binary classification problem, where , , refers to the number of categories owned by the th metric, represents the total number of metric values to be predicted, and denotes whether the th metric value exists. To achieve vulnerability metric prediction, is converted into the feature matrix , where are the features extracted from , while is the number of feature dimensions. As stated in (2), the expected result for is , where , , is the predicted probability corresponding to each metric value. Since vulnerability metric value generation is a multi-label binary classification task, the objective of prediction model parameter optimization is to lower the model’s loss function according to the machine learning convention. Therefore, the mission of this study is to construct a better and to find the appropriate in order to achieve the task of predicting vulnerability metric values with better performance.
3. Methods
This study aims to design an efficient machine learning approach using vulnerability description text to predict multiple vulnerability features. This approach will help security analysts to quickly analyze the CVSS metric values of vulnerabilities. As opposed to building multiple prediction models to predict various metric values, this paper proposes a learning method based on the XLNet model, which fine-tunes the XLNet model to improve the model’s learning efficiency and prediction accuracy.
3.1. Methodology Overview
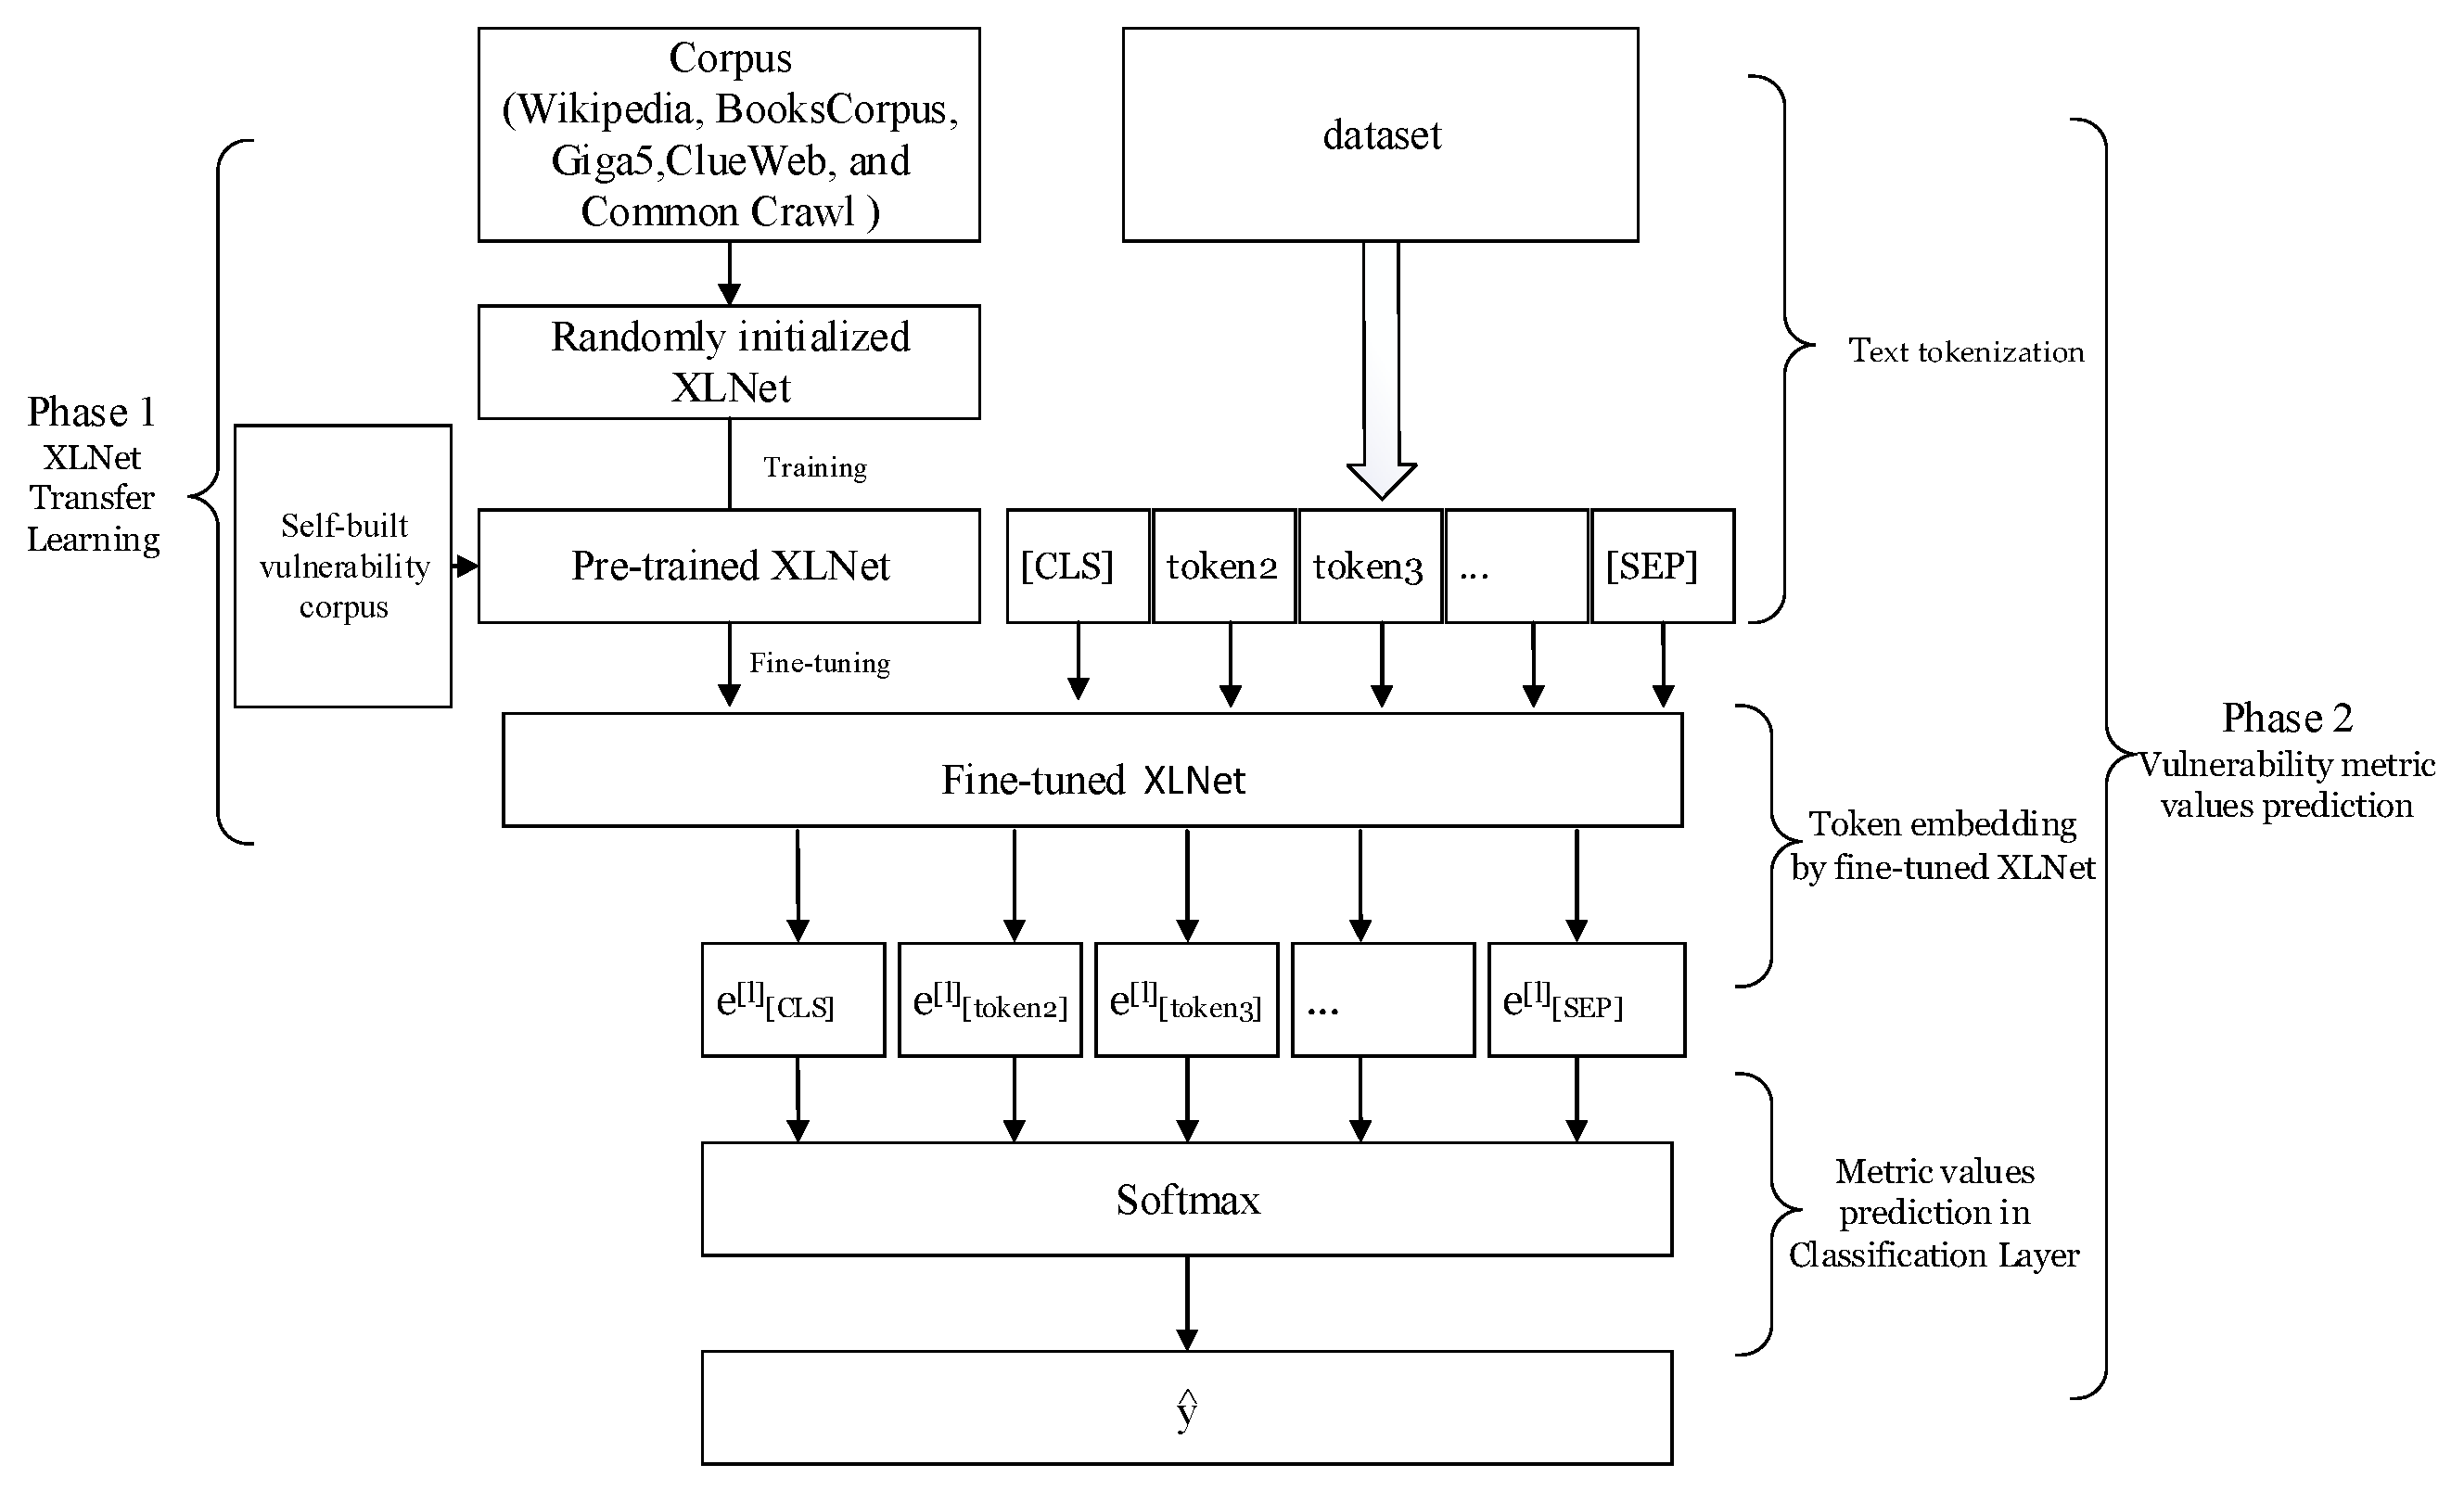
Figure 3 depicts this paper’s two primary phases: XLNet transfer learning and vulnerability metric value prediction. By employing XLNet transfer learning, a fine-tuned model is developed to predict vulnerability metric values. Metric value prediction is a three-step process, i.e., text tokenization, transfer layer token embedding, and metric value prediction. These steps are shown in
Figure 3. First, the vulnerability description content is divided into numerous tokens during the tokenization stage, and then tokens are embedded into the XLNet model. Finally, the softmax function to predict the likelihood
of the vulnerability metric values is used. The remainder of this section will provide a detailed description of the framework.
3.2. XLNet Transfer Learning
XLNet transfer learning fine-tunes the pre-trained model utilizing the self-built corpus collected in the study. The pre-trained XLNet is trained by random initialization on multiple pre-trained corpora. XLNet transfer learning begins with downloading the appropriate pre-trained XLNet model. In this study, the pre-trained model is ‘XLNet-base-cased’, which consists of 12 transfer layers. A domain corpus is constructed from 1999–2022 NVD vulnerability descriptions. The input and output relationships for the transfer layer of the XLNET model are shown in Equation (4):
where
is a sequence of the token list with
tokens, which are tokenized based on the vulnerability description text;
is the pre-trained XLNet model’s
th layer token embedding;
represents the trained XLNet model parameters;
is the conversion function of
and
, determined by the XLNet structure;
is the
th layer token embedding of the
th token
,
, where
is the XLNet
th layer’s hidden layer size. By transfer learning, the parameters of XLNet are changed from its pre-trained state
to its fine-tuned state
. Compared to training an XLNet model from scratch, using transfer learning on an XLNet model maintains a comprehensive model’s high performance while avoiding high training costs and the lack of domain data [
35].
3.3. Vulnerability Metric Prediction
3.3.1. Text Tokenization
Text tokenization is a data preprocessing step in which the description text is turned into token sequences ; is the token sequences obtained from the description ; and is the maximum sequence length of the pre-set token. The symbol denotes the th token obtained from the characterization of the description text , , .
3.3.2. Token Embedding by Fine-Tuned XLNet
When text tokenization is completed, the result is what goes into token embedding. When the fine-tuned XLNet is given a token list
, different transfer layers will give different levels of token embedding. For instance, this is how the token embedding of layer
from the fine-tuned XLNet is shown:
Similar to Equation (4), is a token sequence that consists of tokens, while represents the th layer of token embedding. is the th token , , where is the XLNet th hidden layer size.
3.3.3. Vulnerability Metrics Prediction Using the Softmax Function
For this research, we utilized the softmax function as a classifier, which can leverage exponential property to translate the prediction result into the range of non-negative integers and then apply the normalization technique to turn the result into the probability between [0, 1]. The following is the formula used: , where is the probability of the vulnerability metric value, and are the functions’ weights and biases, and is the token embedding of the final layer output.
4. Experiments and Results
4.1. Experimental Data and Experimental Setup
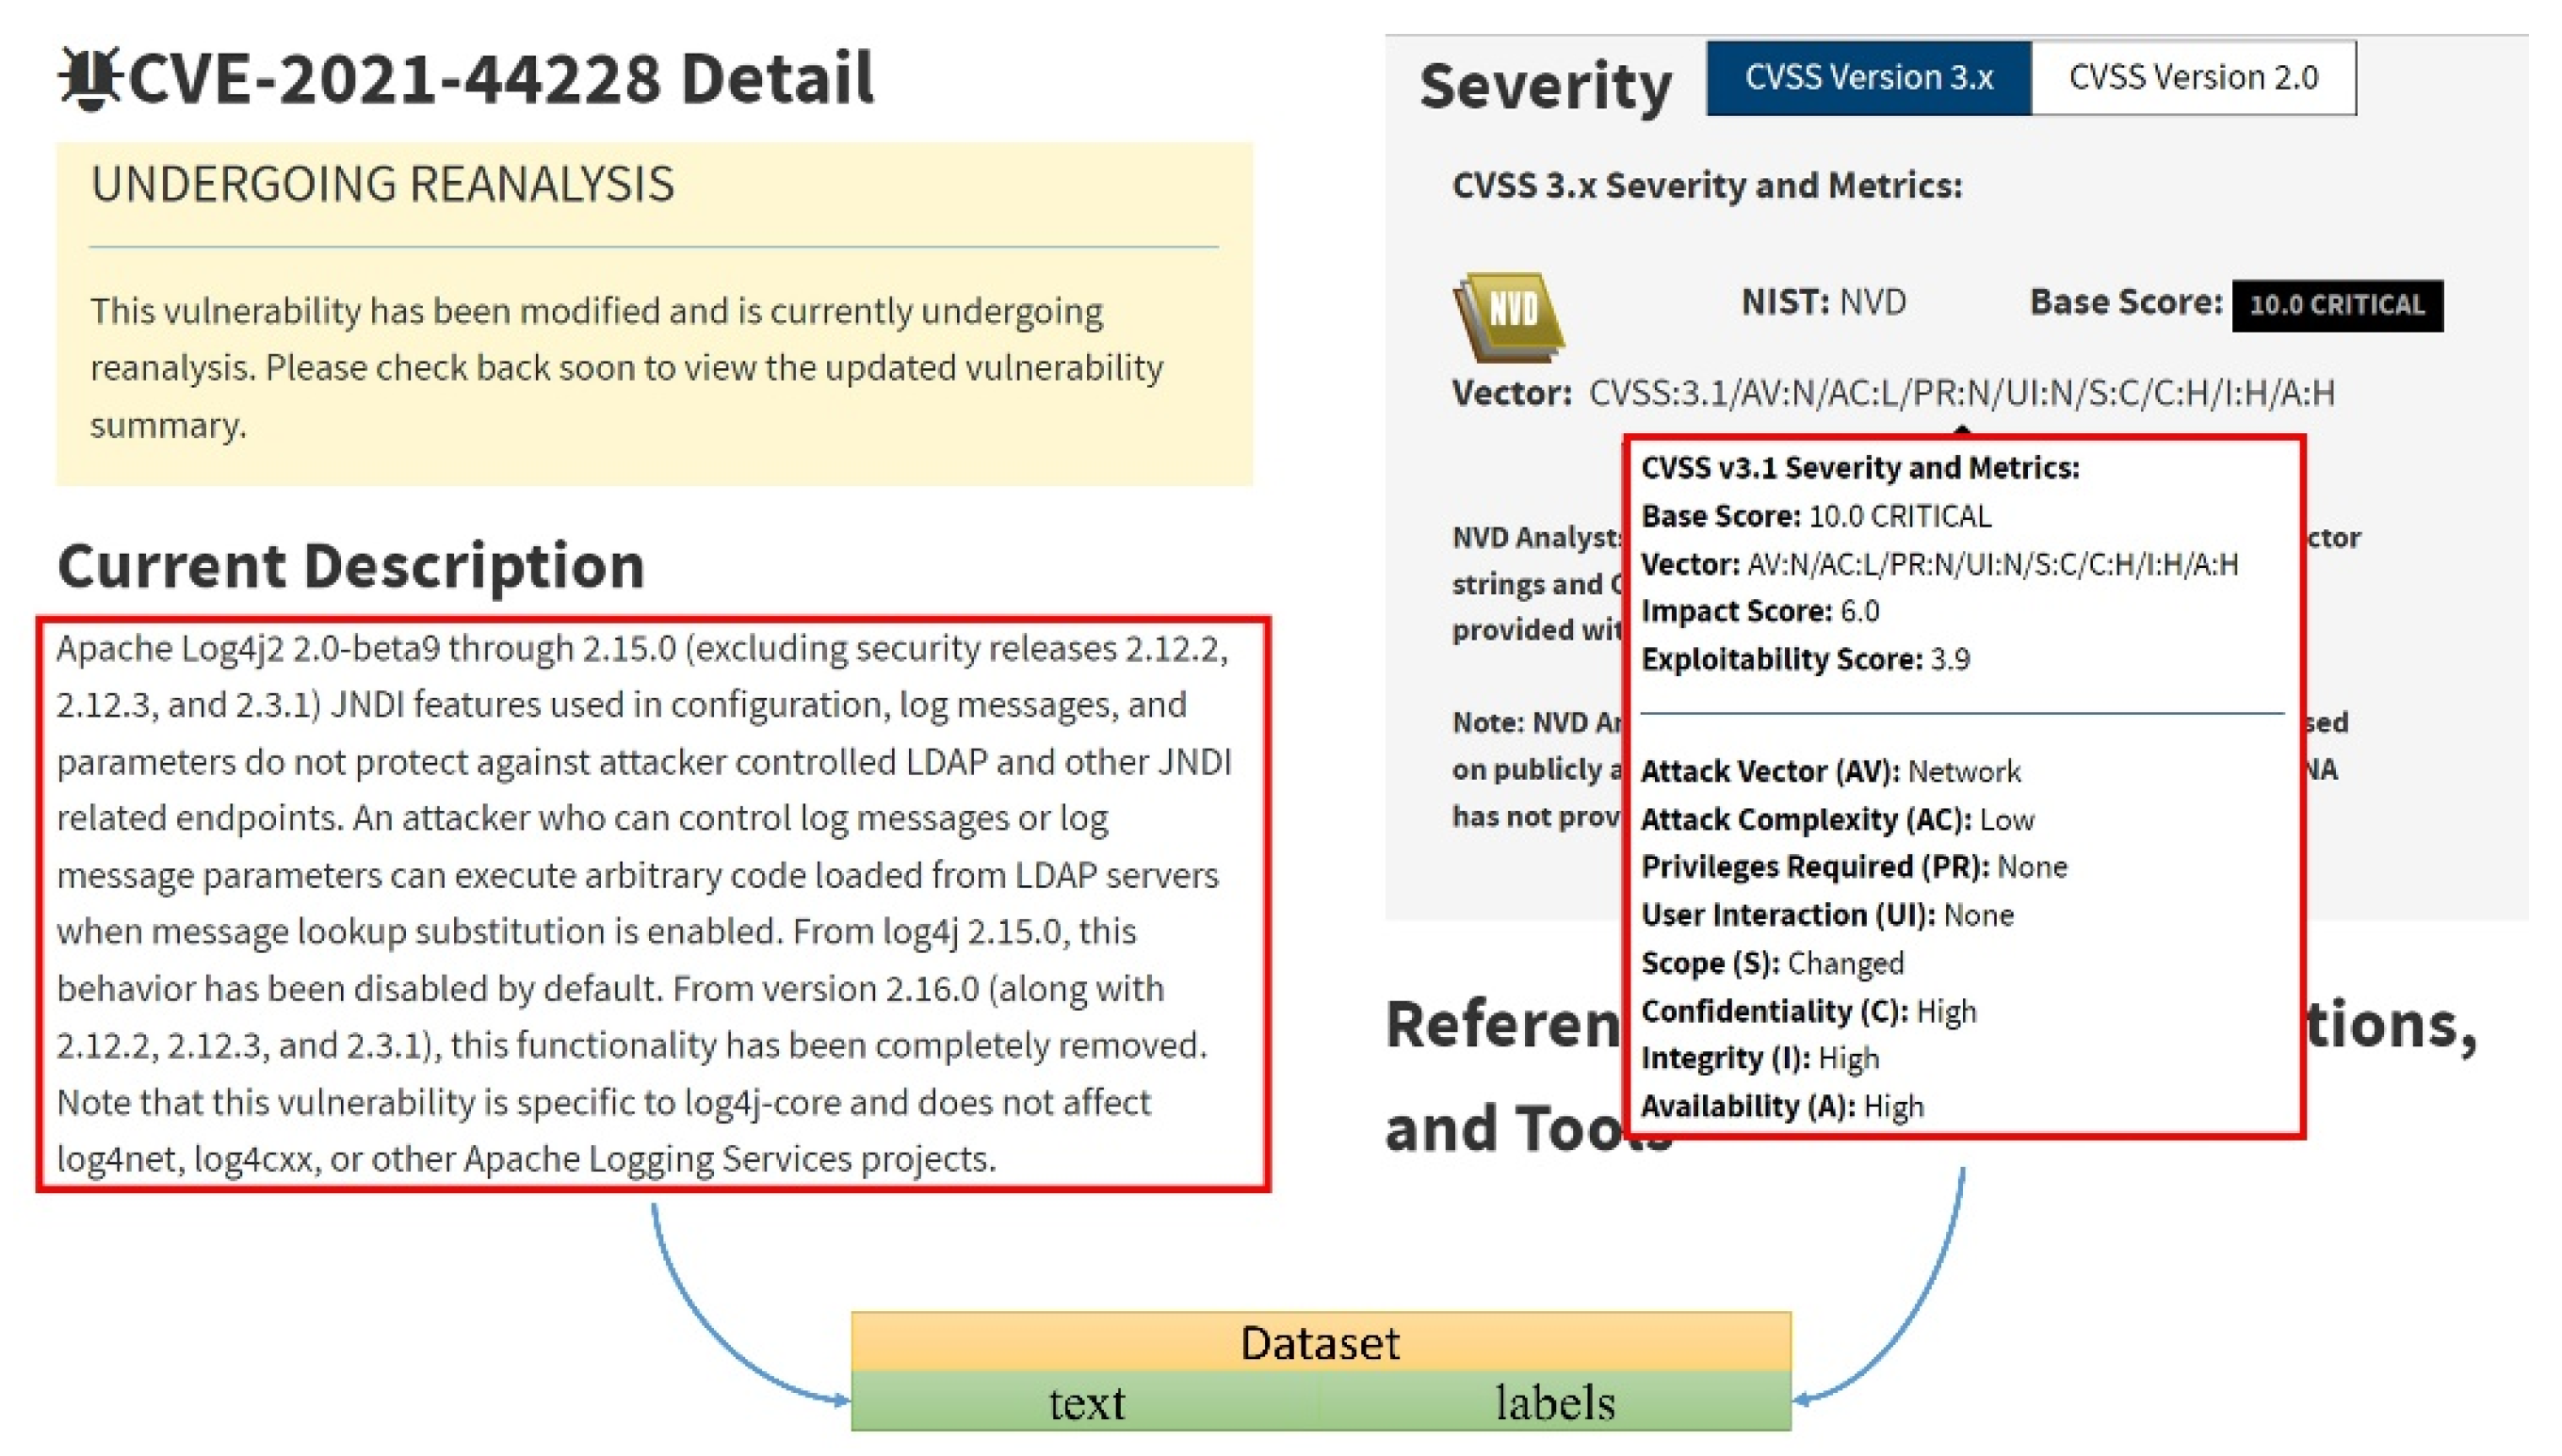
This paper used data from the US National Security Vulnerability Database [
1], which contains all security vulnerabilities released from 1999 to May 2022. The vulnerability description information on the web page was used as the dataset’s text item, and the vulnerabilities’ metric values were processed into label items. The data sources are shown in
Figure 4. If the metric value existed, 1 was assigned to the label. If it did not exist, the value 0 was assigned. Finally, the collected dataset was represented by
. After processing, two datasets were obtained for this study: the CVSS version 2.0 dataset containing 174,838 vulnerabilities and the CVSS version 3.1 dataset containing 101,519 vulnerabilities. The datasets were split into the training and test datasets in the following proportions: 80%:20%. The statistics indicate that 97.72% of CVSSv3.1 vulnerability descriptions have fewer than 128 words, with an average of 43.90 words per sample, and 98.62% of CVSS v2 vulnerability descriptions have fewer than 128 words, with an average of 40.99 words per sample. After tokenization, 99% of the descriptions in CVSS v2 and v3 have less than 256 tokens. The pre-trained XLNet model used in the paper is the XLNet-base model, with 12 transfer layers and 768 hidden layers. All vulnerability descriptions of CVSS v2 and v3.1 were used to fine-tune the pre-trained XLNet model. Two NVIDIA GeForce RTX 3090 GPUs were used for fine-tuning and training.
4.2. Hyperparameter Selection
In this paper, we used the grid search method to select the best hyperparameters. From the results in
Figure 5, it can be seen that if the learning rate is too high, the network will not converge, resulting in the output lingering around the ideal value. If the learning rate is too low, the network will converge slowly and affect the learning efficiency. According to experiments, the loss function converges better when epochs = 3 and learning rate = 5 × 10
−5.
4.3. Comparative Study
To verify the proposed method’s effectiveness, three types of experiments were conducted in this section to compare, respectively, the XLNet model with other pre-trained models, the XLNet model with traditional machine learning algorithms, and the results with other similar studies. Each metric’s best model is highlighted in bold. To measure the performance of each algorithm on this task, the evaluation metrics of accuracy, precision, recall, and F1-score were used in this study.
4.3.1. Pre-trained Models—Effect Analysis
To evaluate the efficacy of different pre-trained models in this research, three pre-trained models—BERT, ROBERTA, and DISTILBERT—which can be used for text classification, were selected and compared with XLNet. The hyperparameter settings of the relevant models were consistent with XLNet.
Table 4 compares the effects of the four pre-trained models on the v3.1 dataset.
Table 5 compares the impact of the four pre-trained models on the v2 dataset.
4.3.2. Traditional Models—Effect Analysis
To compare pre-trained and conventional machine learning models in vulnerability assessment, five traditional machine learning models, i.e., decision tree, nearest neighbor, multilayer perceptron, plain Bayesian, and logistic regression, were selected and compared with XLNet.
Table 6 shows the effect of traditional models and XLNet on the v3.1 dataset.
Table 7 shows the impact of conventional models and XLNet on the v2 dataset comparison.
4.3.3. Comparison with Other Similar Works
In this study, the accuracy, precision, recall, and F1 of XLNET are compared to those of similar works. The results of other works were taken from the original papers [
21,
22,
23].
Table 8 and
Table 9 display pertinent data. The results demonstrate that the fine-tuned XLNet enhances the performance of vulnerability metric value prediction.
4.4. Analysis of Results
In this study, the experimental results of the XLNet model were compared with several pre-trained models, several traditional machine learning algorithms, and similar studies.
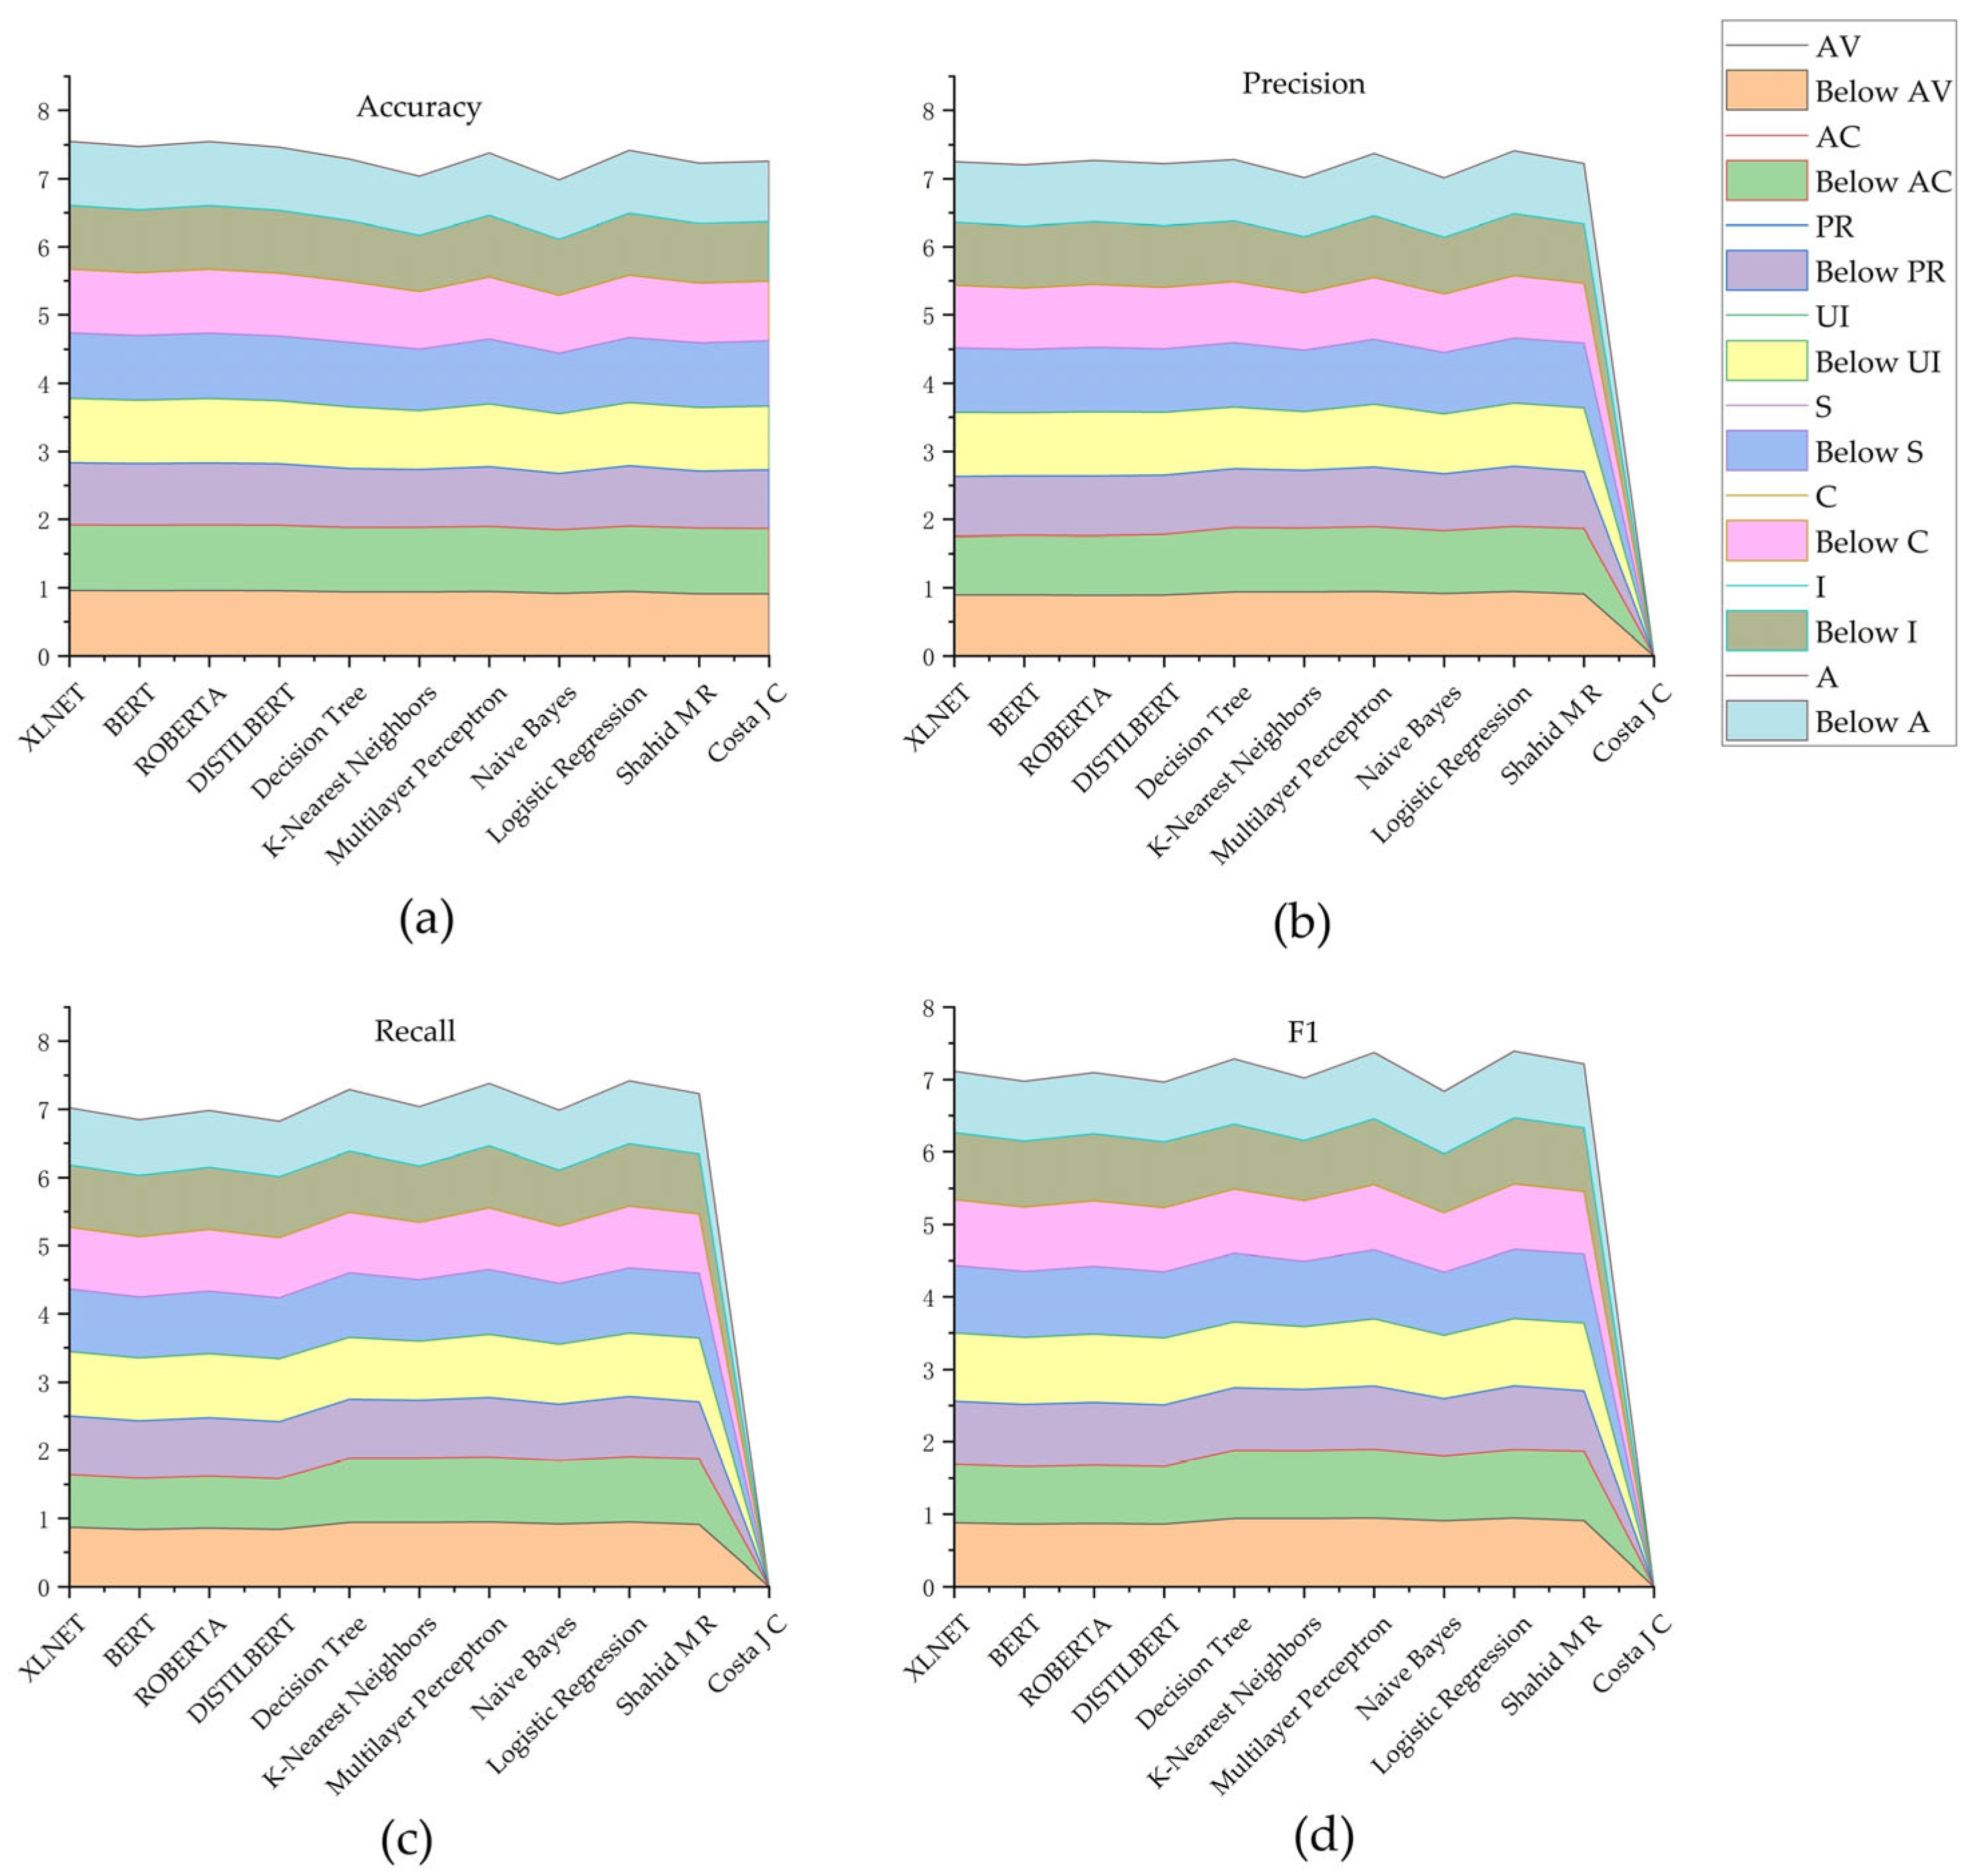
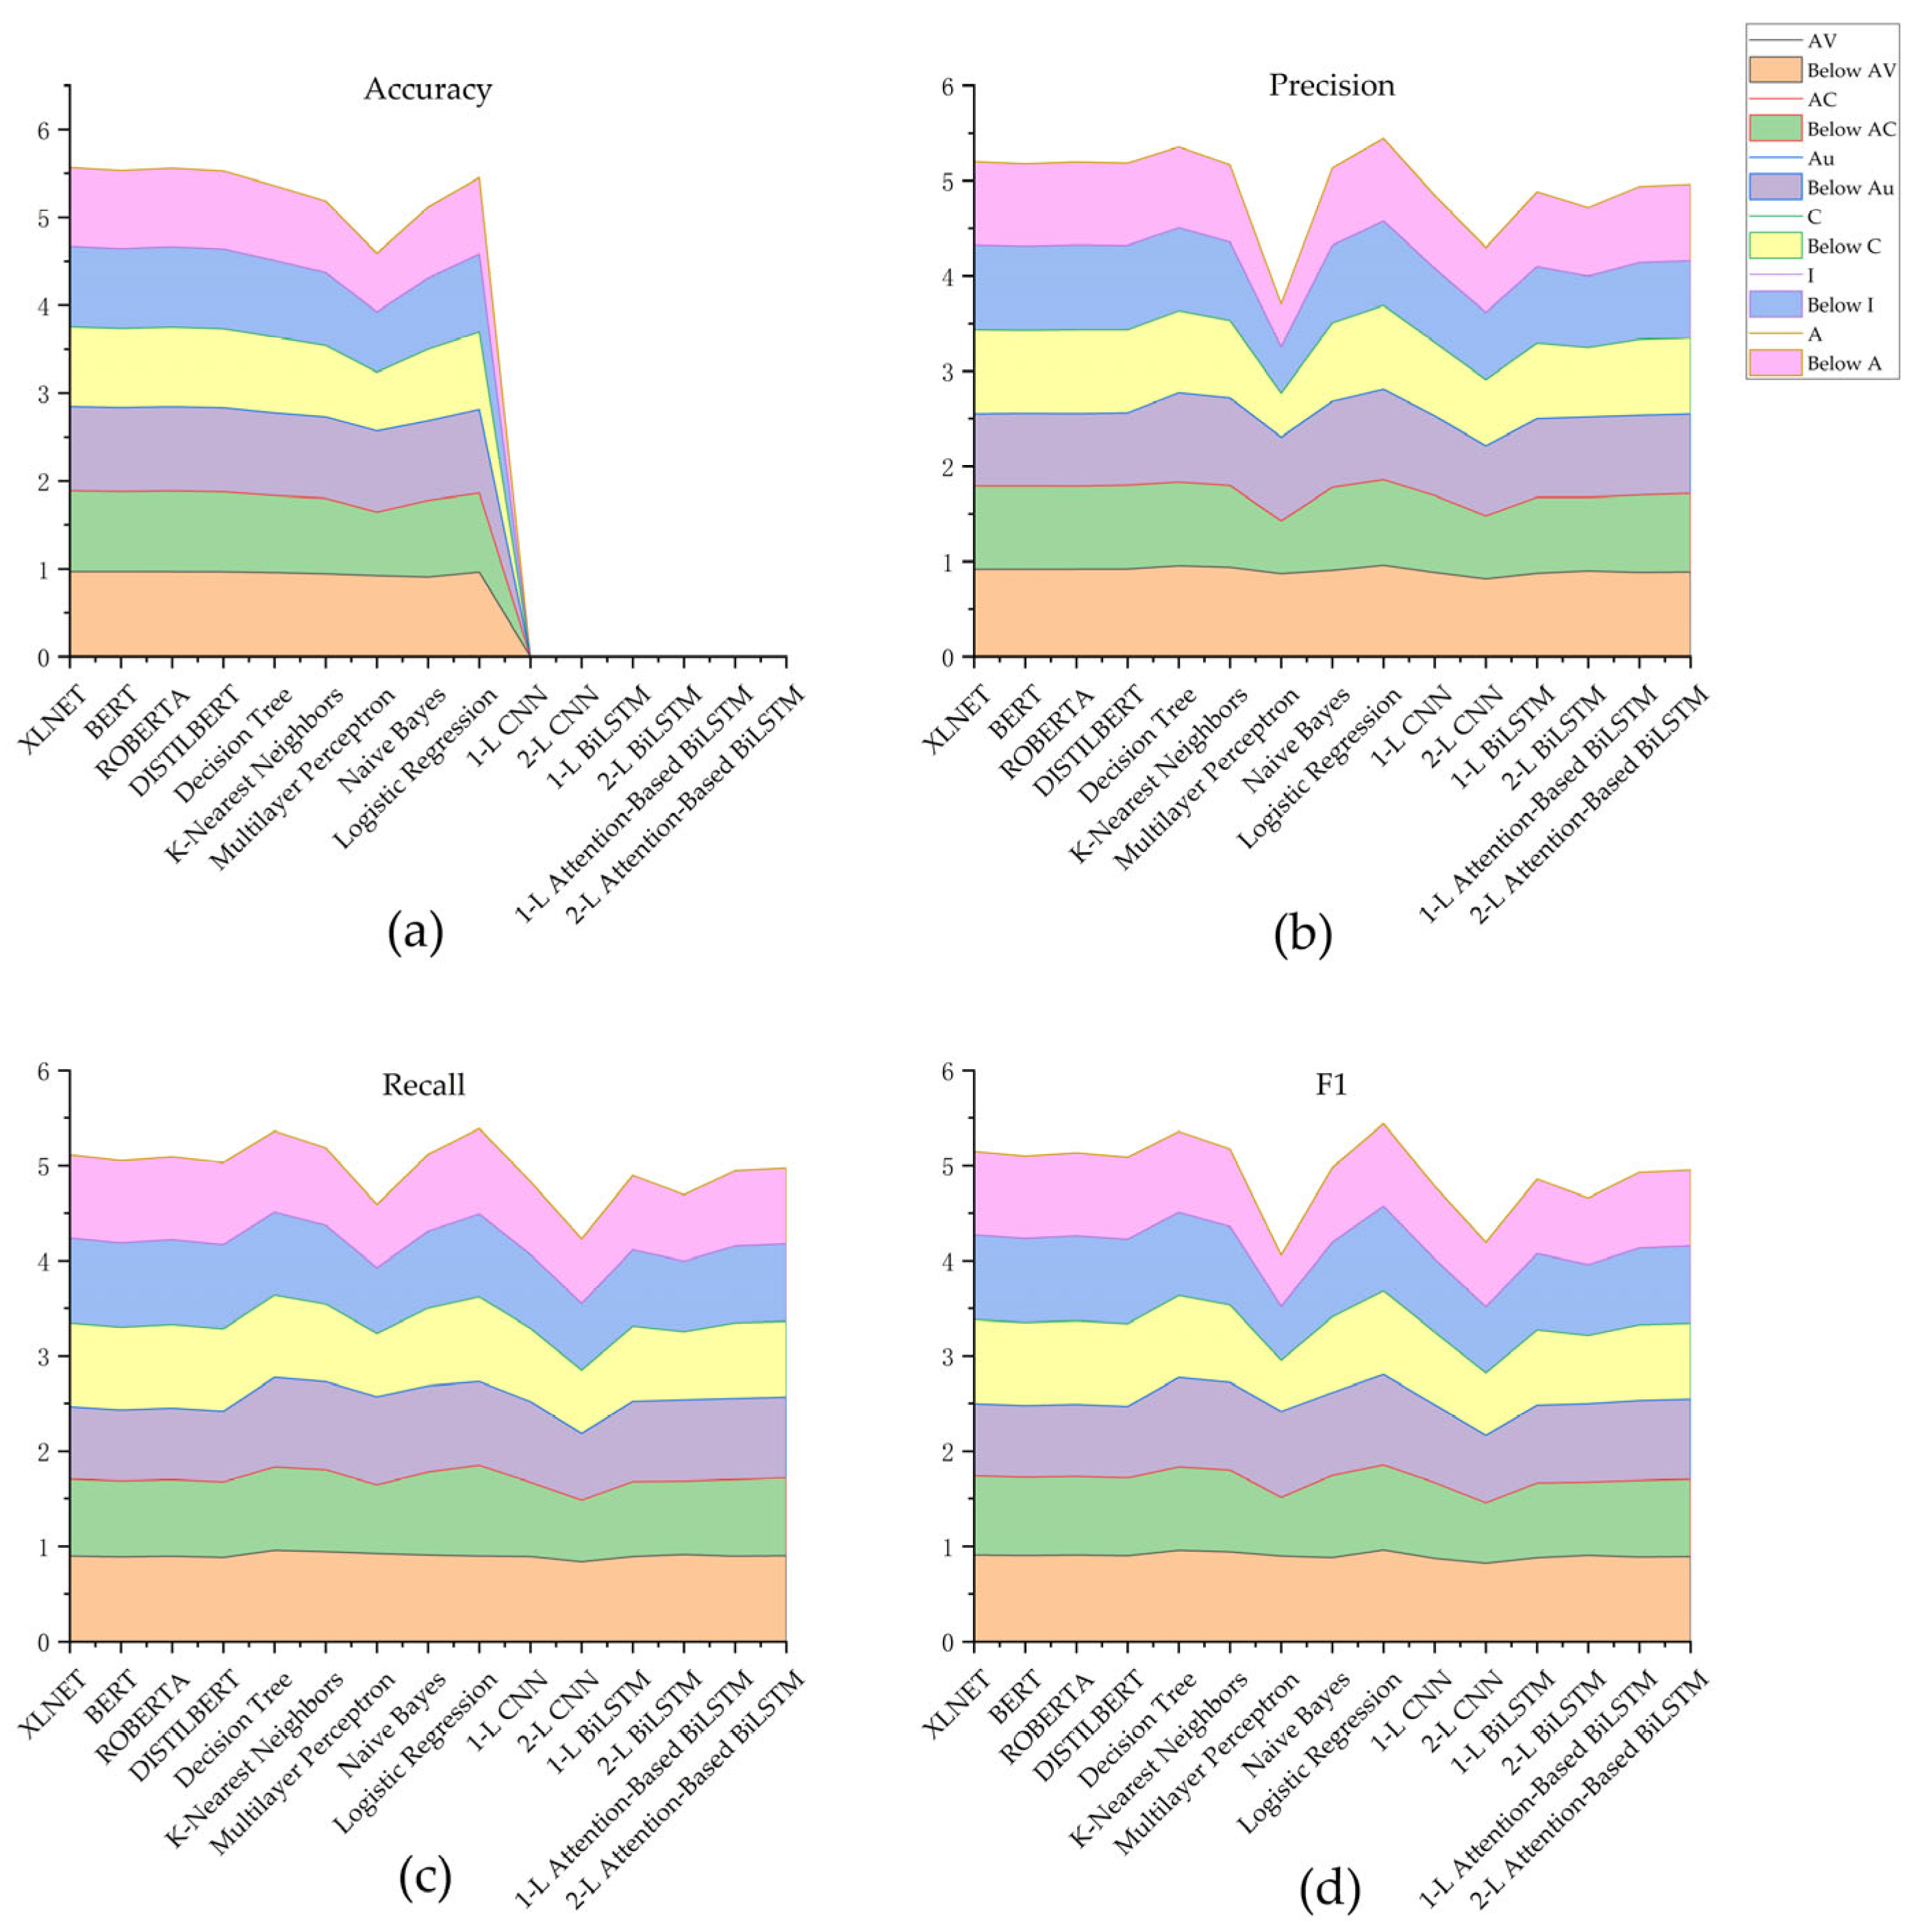
Figure 6 and
Figure 7 present the essential data in two bar charts to simplify analysis. It can be seen that the XLNet model is superior to other models in assessment metrics, as shown by the aforementioned experimental findings. Comparing this study’s methodology to previous studies demonstrates that it likewise reaches superior performance levels.
5. Discussion
The experimental findings demonstrate that the fine-tuned XLNet model indeed enhanced the vulnerability metric prediction, which benefits both the strength of the pre-trained model and the domain knowledge provided by the fine-tuning. Compared to conventional machine learning and deep learning, the XLNet model acquired substantial knowledge from the large-scale corpus. This information partially compensated for the difficulty created by inadequate data in the downstream tasks, thus significantly improving the downstream tasks. In addition, the findings indicate that the fine-tuned XLNet model is not significantly superior to the logistic regression method in terms of prediction impact, and that the model’s interpretability is weak. In our future studies, we will conduct research on the fusion of pre-trained and traditional models, combining the advantages of pre-trained and classic models to produce superior outcomes. We will also research model interpretability in order to make the model’s output more convincing.
6. Conclusions
Every year, the Internet discloses tens of thousands of vulnerabilities to the public. In order to remedy high-priority vulnerabilities promptly, it is critical to assess the severity of the vulnerability rapidly. Nevertheless, manual assessment of vulnerabilities using the CVSS metric has proved to be time-consuming. To find a faster way of assessing vulnerability severity, this paper proposed a method for vulnerability metric prediction using an XLNet pre-trained model. With this method, the XLNet model was fine-tuned based on a self-built cybersecurity corpus, and then the fine-tuned XLNet model was used to extract semantic features from the vulnerability description text. Subsequently, the CVSS metric values were split, the multi-classification problem was converted into a multi-label classification problem, and finally, multi-label classification was performed based on the extracted text features in order to achieve the purpose of predicting vulnerability metric values. The experimental results on 276,357 actual vulnerabilities demonstrate that XLNet can achieve state-of-the-art performance in CVSS metric value prediction.
Author Contributions
Conceptualization, F.S. and S.K.; methodology, S.K.; software, S.K.; validation, J.Z. and Y.Z.; formal analysis, F.S.; investigation, S.K.; resources, F.S.; data curation, Y.Z.; writing—original draft preparation, S.K.; writing—review and editing, F.S.; visualization, Y.Z.; supervision, F.S. All authors have read and agreed to the published version of the manuscript.
Funding
This research was funded by the National Key Research and Development Program of China, grant number 2021YFB3100500. This is a project led by Professor Shi Fan, which focuses on the network public nuisance governance.
Institutional Review Board Statement
Not applicable.
Informed Consent Statement
Not applicable.
Data Availability Statement
Not applicable.
Conflicts of Interest
The authors declare no conflict of interest.
References
- National Vulnerability Database. Available online: https://nvd.nist.gov/vuln (accessed on 1 September 2022).
- Tang, M.; Alazab, M.; Luo, Y. Big data for cybersecurity: Vulnerability disclosure trends and dependencies. IEEE Trans. Big Data 2017, 5, 317–329. [Google Scholar] [CrossRef]
- Viegas, V.; Kuyucu, O. IT Security Controls, 1st ed.; Apress: Berkeley, CA, USA, 2022; p. 193. [Google Scholar]
- Chen, H.; Liu, J.; Liu, R.; Park, N.; Subrahmanian, V. VEST: A System for Vulnerability Exploit Scoring & Timing. In Proceedings of the Twenty-Eighth International Joint Conference on Artificial Intelligence (IJCAI-19), Macao, China, 10–16 August 2019; pp. 6503–6505. [Google Scholar]
- Ruohonen, J. A look at the time delays in CVSS vulnerability scoring. Appl. Comput. Inform. 2019, 15, 129–135. [Google Scholar] [CrossRef]
- Binding Operational Directive 19-02—Vulnerability Remediation Requirements for Internet-Accessible Systems. Available online: https://www.cisa.gov/binding-operational-directive-19-02 (accessed on 15 June 2022).
- Ahmadi, V.; Arlos, P.; Casalicchio, E. Normalization of severity rating for automated context-aware vulnerability risk management. In Proceedings of the 2020 IEEE International Conference on Autonomic Computing and Self-Organizing Systems Companion (ACSOS-C), Online, 17–21 August 2020; pp. 200–205. [Google Scholar]
- CVE Status Count. Available online: https://nvd.nist.gov/general/nvd-dashboard (accessed on 15 June 2022).
- Kai, S.; Zheng, J.; Shi, F.; Lu, Z. A CVSS-based Vulnerability Assessment Method for Reducing Scoring Error. In Proceedings of the 2021 2nd International Conference on Electronics, Communications and Information Technology (CECIT), Sanya, China, 27–29 December 2021; pp. 25–32. [Google Scholar]
- A Complete Guide to the Common Vulnerability Scoring System. Available online: https://www.first.org/cvss/v2/guide (accessed on 2 July 2022).
- Common Vulnerability Scoring System v3.1: Specification Document. Available online: https://www.first.org/cvss/v3.1/specification-document (accessed on 1 September 2022).
- Yang, Z.; Dai, Z.; Yang, Y.; Carbonell, J.; Salakhutdinov, R.R.; Le, Q.V. Xlnet: Generalized autoregressive pretraining for language understanding. Adv. Neural Inf. Process. Syst. 2019, 32, 1–18. [Google Scholar]
- Common Vulnerability Scoring System SIG. Available online: https://www.first.org/cvss/ (accessed on 15 June 2022).
- Schiffman, M.; Wright, A.; Ahmad, D.; Eschelbeck, G.; National Infrastructure Advisory Council; Vulnerability Disclosure Working Group; Vulnerability Scoring Subgroup. The Common Vulnerability Scoring System; National Infrastructure Advisory Council: Washington, DC, USA, 2004. [Google Scholar]
- Mell, P.; Scarfone, K.; Romanosky, S. Common vulnerability scoring system. IEEE Secur. Priv. 2006, 4, 85–89. [Google Scholar] [CrossRef]
- Eiram, C.; Martin, B. The CVSSv2 Shortcomings, Faults, and Failures Formulation; Technical Report; Forum of Incident Response and Security Teams (FIRST): Cary, NC, USA, 2013. [Google Scholar]
- Exploit Prediction Scoring System (EPSS). Available online: https://www.first.org/epss/model (accessed on 1 September 2022).
- Jacobs, J.; Romanosky, S.; Edwards, B.; Adjerid, I.; Roytman, M. Exploit prediction scoring system (epss). Digit. Threats Res. Pract. 2021, 2, 1–17. [Google Scholar] [CrossRef]
- Keskin, O.; Gannon, N.; Lopez, B.; Tatar, U. Scoring Cyber Vulnerabilities based on Their Impact on Organizational Goals. In Proceedings of the 2021 Systems and Information Engineering Design Symposium (SIEDS), Online, 29–30 April 2021; pp. 1–6. [Google Scholar]
- Team, C. Common Vulnerability Scoring System v3.0: Specification Document; Forum of Incident Response and Security Teams (FIRST): Cary, NC, USA, 2015. [Google Scholar]
- Shahid, M.R.; Debar, H. CVSS-BERT: Explainable Natural Language Processing to Determine the Severity of a Computer Security Vulnerability from its Description. In Proceedings of the 2021 20th IEEE International Conference on Machine Learning and Applications (ICMLA), Pasadena, CA, USA, 13–16 December 2021; pp. 1600–1607. [Google Scholar]
- Gong, X.; Xing, Z.; Li, X.; Feng, Z.; Han, Z. Joint prediction of multiple vulnerability characteristics through multi-task learning. In Proceedings of the 2019 24th International Conference on Engineering of Complex Computer Systems (ICECCS), Guangzhou, China, 10–13 November 2019; pp. 31–40. [Google Scholar]
- Costa, J.C.; Roxo, T.; Sequeiros, J.B.; Proença, H.; Inácio, P.R. Predicting CVSS Metric Via Description Interpretation. IEEE Access 2022, 10, 59125–59134. [Google Scholar] [CrossRef]
- Khazaei, A.; Ghasemzadeh, M.; Derhami, V. An automatic method for CVSS score prediction using vulnerabilities description. J. Intell. Fuzzy Syst. 2016, 30, 89–96. [Google Scholar] [CrossRef]
- Wang, P.; Zhou, Y.; Sun, B.; Zhang, W. Intelligent prediction of vulnerability severity level based on text mining and XGBboost. In Proceedings of the 2019 Eleventh International Conference on Advanced Computational Intelligence (ICACI), Guilin, China, 7–9 June 2019; pp. 72–77. [Google Scholar]
- Han, Z.; Li, X.; Xing, Z.; Liu, H.; Feng, Z. Learning to predict severity of software vulnerability using only vulnerability description. In Proceedings of the 2017 IEEE International conference on software maintenance and evolution (ICSME), Shanghai, China, 17–22 September 2017; pp. 125–136. [Google Scholar]
- Liu, K.; Zhou, Y.; Wang, Q.; Zhu, X. Vulnerability severity prediction with deep neural network. In Proceedings of the 2019 5th International Conference on Big Data and Information Analytics (BigDIA), Kunming, China, 8–10 July 2019; pp. 114–119. [Google Scholar]
- Spanos, G.; Angelis, L.; Toloudis, D. Assessment of vulnerability severity using text mining. In Proceedings of the 21st Pan-Hellenic Conference on Informatics, Larissa, Greece, 28–30 September 2017; pp. 1–6. [Google Scholar]
- Ali, M. Character level convolutional neural network for Arabic dialect identification. In Proceedings of the Fifth Workshop on NLP for Similar Languages, Varieties and Dialects (VarDial 2018), Santa Fe, NM, USA, 20 August 2018; pp. 122–127. [Google Scholar]
- Ameri, K.; Hempel, M.; Sharif, H.; Lopez, J., Jr.; Perumalla, K. CyBERT: Cybersecurity Claim Classification by Fine-Tuning the BERT Language Model. J. Cybersecur. Priv. 2021, 1, 615–637. [Google Scholar] [CrossRef]
- Kudjo, P.K.; Chen, J.; Mensah, S.; Amankwah, R.; Kudjo, C. The effect of Bellwether analysis on software vulnerability severity prediction models. Softw. Qual. J. 2020, 28, 1413–1446. [Google Scholar] [CrossRef]
- Qaiser, S.; Ali, R. Text mining: Use of TF-IDF to examine the relevance of words to documents. Int. J. Comput. Appl. 2018, 181, 25–29. [Google Scholar] [CrossRef]
- Goldberg, Y.; Levy, O. Word2vec Explained: Deriving Mikolov et al.’s negative-sampling word-embedding method. arXiv 2014, arXiv:1402.3722. [Google Scholar]
- Devlin, J.; Chang, M.-W.; Lee, K.; Toutanova, K. Bert: Pre-training of deep bidirectional transformers for language understanding. arXiv 2018, arXiv:1810.04805. [Google Scholar]
- Yin, J.; Tang, M.; Cao, J.; Wang, H. Apply transfer learning to cybersecurity: Predicting exploitability of vulnerabilities by description. Knowl. Based Syst. 2020, 210, 106529. [Google Scholar] [CrossRef]
| Publisher’s Note: MDPI stays neutral with regard to jurisdictional claims in published maps and institutional affiliations. |
© 2022 by the authors. Licensee MDPI, Basel, Switzerland. This article is an open access article distributed under the terms and conditions of the Creative Commons Attribution (CC BY) license (https://creativecommons.org/licenses/by/4.0/).
