1. Introduction
Direct laser writing consists in focusing a high-intensity laser inside a crystalline or an amorphous material in order to locally modify its physical properties [
1]. Since their development about thirty years ago, femtosecond lasers have been used in particular for this laser writing technique. Thanks to ultra-short pulses, these lasers can reach intensities higher than TW/cm² at the focal point. With non-linear absorption of the material due to these high intensities, the material is permanently modified in a confined volume of a few µm
3. This direct femtosecond laser writing (FLDW) is therefore of great interest for its numerous writing possibilities, as well as for a number of accessible materials, especially in the fabrication of complex 3D photonic components. Indeed, current advanced femtosecond laser systems offer a myriad of material interactions in glassy media: nanocrystals precipitation [
2], metallic nanoparticles precipitation and shaping [
3], nanogratings formation [
4], or 3D refractive index changes profiling (based on nanoscale structural changes) [
1]. These materials’ interactions depend on both the laser parameters and the material chemical composition. The FLDW technique is especially studied for the creation of nanogratings and optical waveguides [
5] but attracts the attention of researchers in many different fields such as diffractive and polarization optics but also gradient index optics [
6] and geometric phase optics [
7].
This technique has been extensively studied in silica in order to fabricate new integrated optical components: waveguides, lenses, birefringent optics, etc. However, these studies are mainly limited to visible and near-infrared wavelengths [
1,
8,
9]. Today, the studies of the FLDW technique are growing in materials such as silicon performing in infrared [
10]. Indeed, the development of integrated optical components in infrared has many attractive civilian (home automation, smartphones, automotive, etc.) and military applications.
The materials that can be used at mid-wavelength infrared (MWIR: 3–5 µm) and long-wavelength infrared (LWIR: 8–12 µm), besides silicon, are non-silicate glasses such as chalcogenides [
11], fluorides [
12], and heavy oxide glasses [
13]. In particular, chalcogenide materials have a very wide transmission band from visible to LWIR (8–14 µm). Despite their growing use in the field of infrared optical imaging for their optical qualities, studies of their utilization with fs-laser writing are mainly limited to the fabrication of mid-IR waveguides for space applications [
5,
12]. The use of the FLDW technique to fabricate complex optical components embedded in these infrared materials is a fairly new and developing area [
5,
14].
In order to open the door to the fast prototyping of complex 3D optics (geometric phase lens, gradient index optics, etc.) for infrared applications, our study seeks to understand the modifications implemented in a set of well-chosen glasses as a function of the writing parameters (laser pulse duration, pulse energy, writing speed, etc.). We are particularly interested in the quantification of both phase and refractive index modifications, which would allow the 3D inscription of freeform objects that are more and more developed in optical imaging [
15]. According to the literature, chalcogenide glasses can reach very high index contrasts: higher than
[
16], while heavy oxides reach lower values of a few
[
13], but they have better thermal and mechanical stability. Besides chalcogenides, heavy oxide glasses transmit only up to MWIR, but they are chemically stable, manufacturable by conventional means (melt-quenching), and mechanically resistant. In this paper, we study the photosensitivity of one chalcogenide glass: 75(GeS
2)-15(In
2S
3)-10(CsCl), also named GeS
2. Two commercial heavy oxide glasses are also studied: Schott SF10 (a lead oxide silicate) and Corning 9754 (a calcium alumino-germanate glass), named, respectively, SF10 and 9754 in the following. Here, we compare the main optical performances under FLDW: types of modifications, thresholds of appearance according to laser energy and writing speed, refractive index variations, and photo-induced spectral losses.
3. Results and Discussion
Determination of the optical modifications landscape in the energy–speed domain: During laser direct writing, the non-linear absorption of laser energy by the material locally modifies its physical properties. Different types of permanent modifications can then appear according to the defined parameters. Three main types of modifications are defined in the literature [
1,
10,
17]. Type I is defined as the appearance of a smooth, homogeneous, and permanent variation in the refractive index. The threshold for the appearance of the Type I change is at low energy. This type of modification allows 3D engineering of the index profiles with fine control of the refractive index variation. It is therefore a type of modification particularly interesting for the manufacture of optical components, especially in the field of imaging or for optical waveguides and gratings. Type II corresponds to an anisotropic modification of the refractive index whose orientation can be controlled by the writing laser polarization. In most oxide glasses, and according to specific conditions of pulse duration, repetition rate, pulse number and pulse energy, and self-assembled periodic nanostructures can appear and make the glass locally birefringent. With higher laser intensities, voids resulting from micro-explosions can appear in the material: this is the Type III modification. We can finally define the last type of modification appearing at high laser intensities. Often abusively called “heat accumulation regime” in the literature, this modification corresponds to a smooth and homogeneous variation of the refractive index with a significant increase in the size of the modified area compared to the size of the energy source. This spatially broadened Type I modification will therefore be referred to as the “spatial broadening regime” that described this phenomenon more accurately [
18].
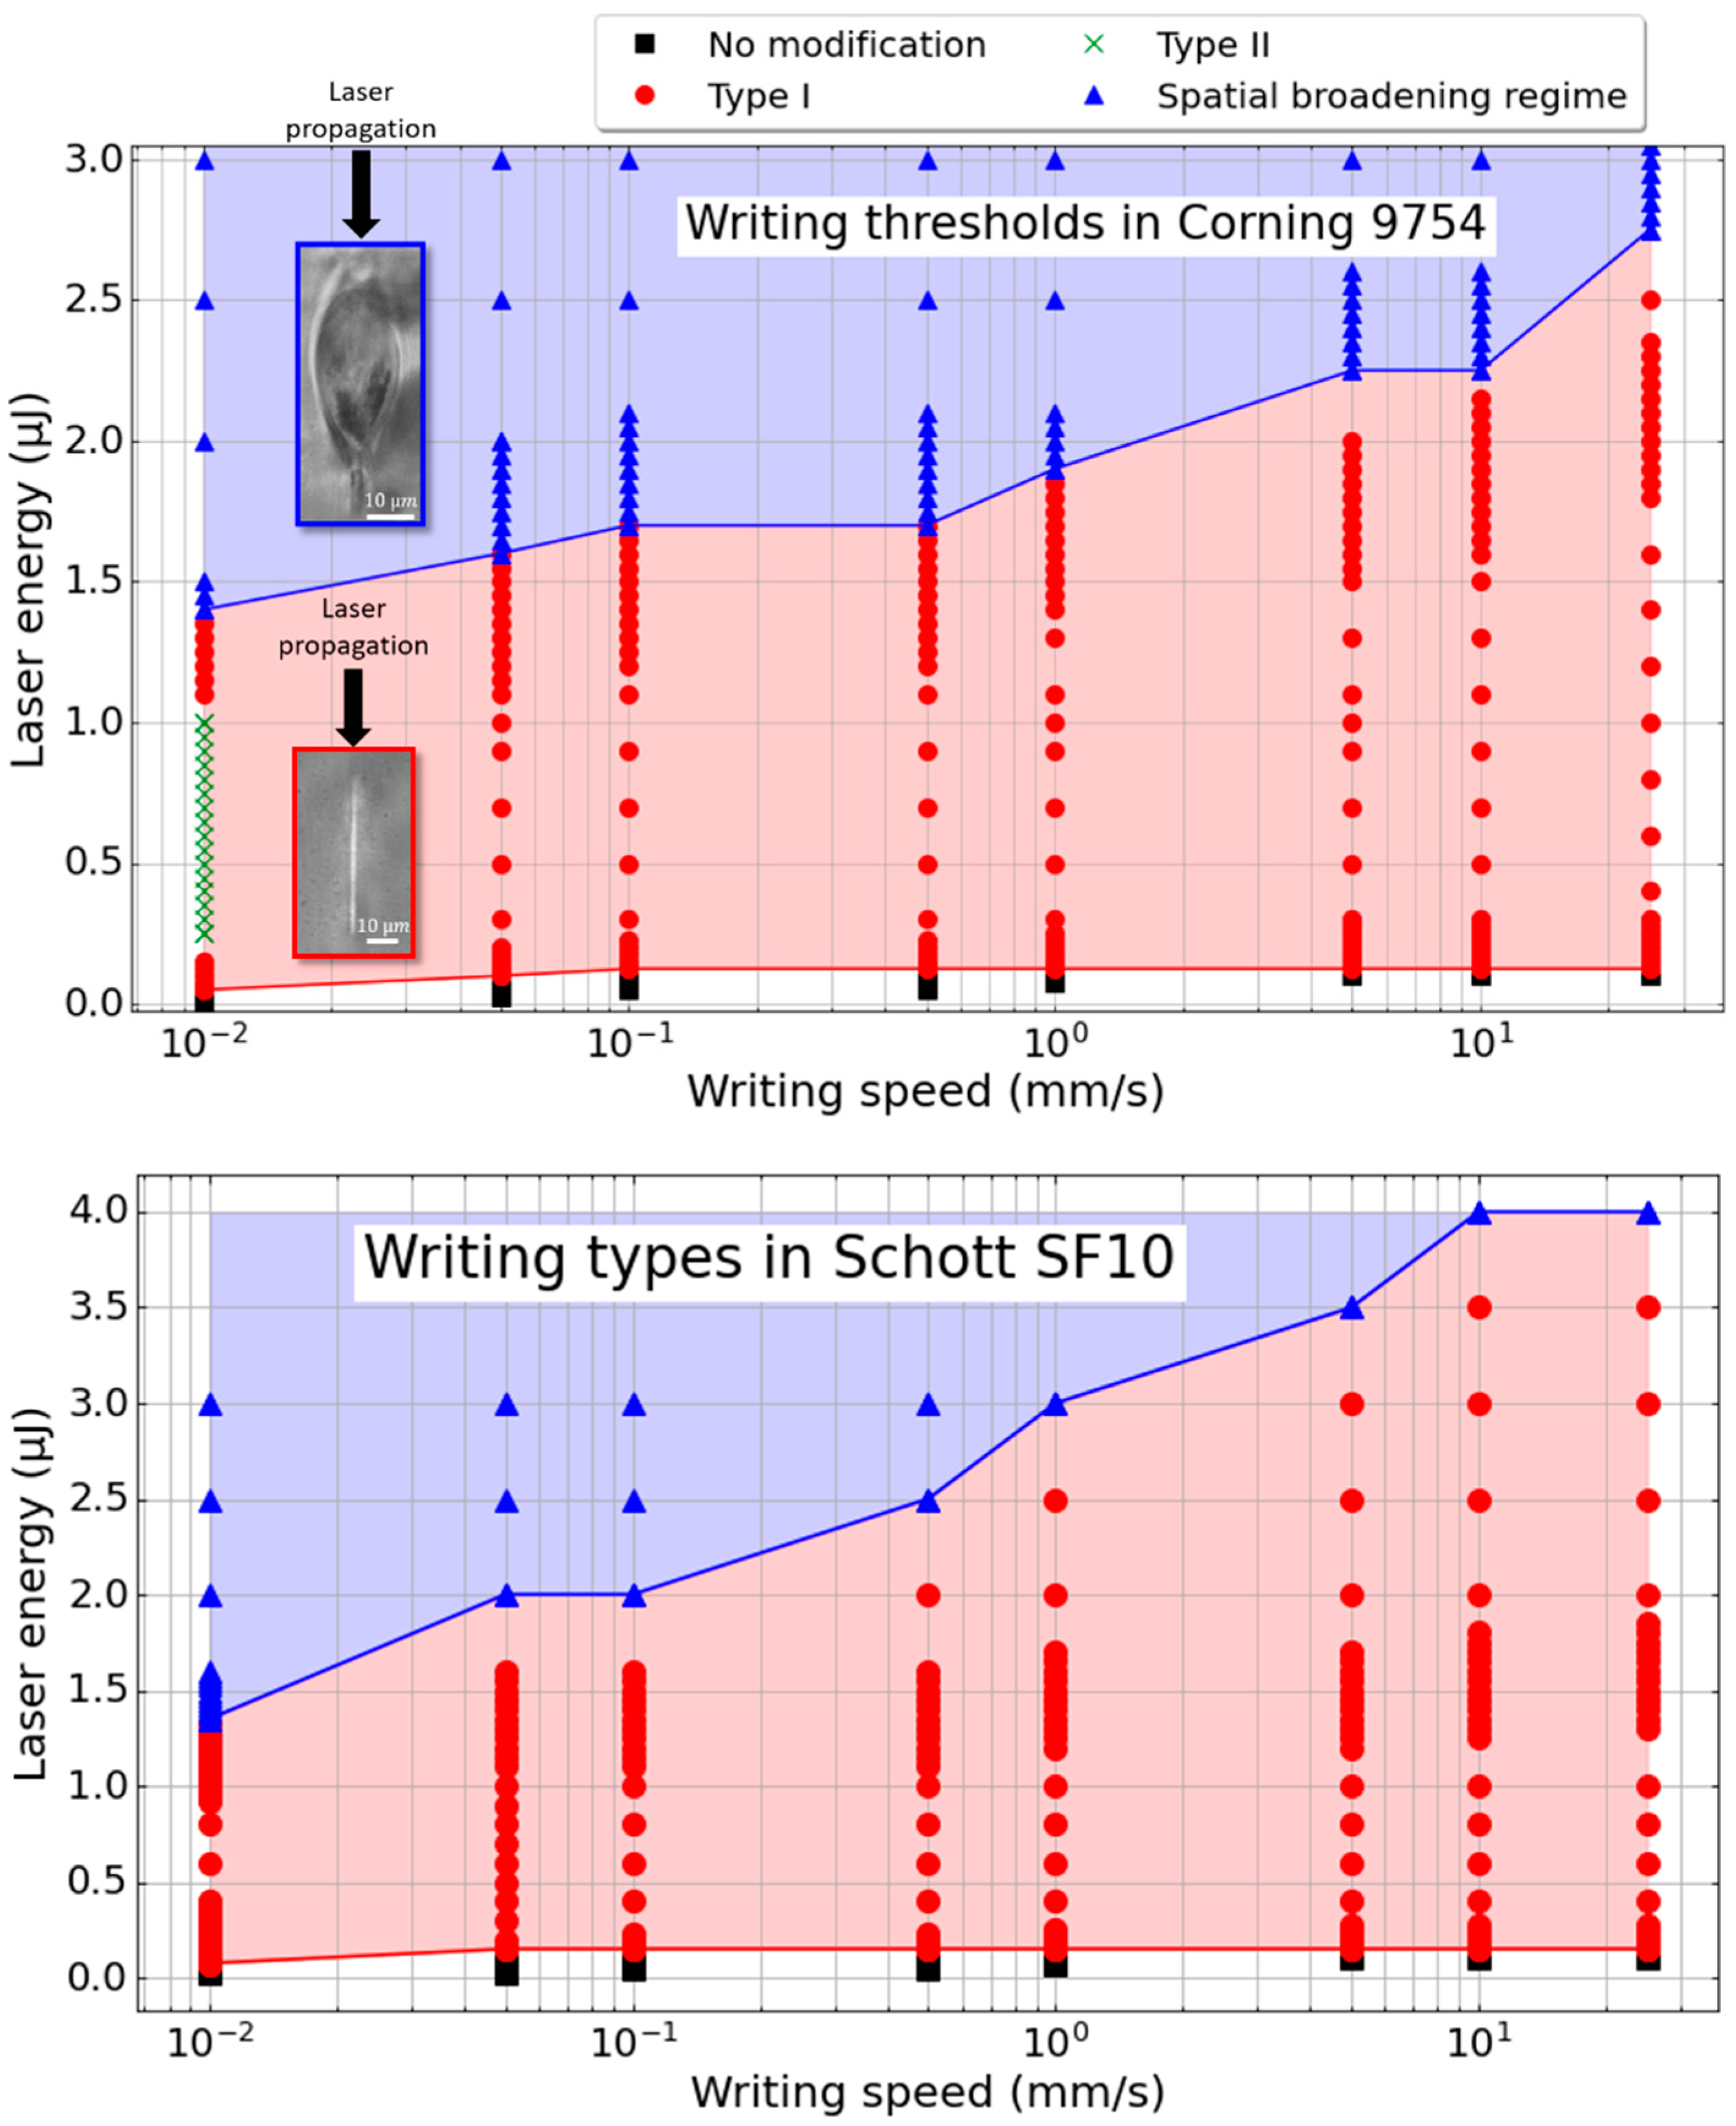
After the 2D micro-writing of the samples, we made an initial observation with an Olympus BX51 polarized optical microscope in order to determine the thresholds of appearance of the different types of modification. In the following, Type I is defined as a permanent refractive index contrast seen in natural light but not in crossed polarizers and whose size remains limited to the laser beam waist. In contrast, the spatial broadening regime is not necessarily a new type of modification because it is also detected as an isotropic refractive index contrast observed through optical microscopy (so in that sense it is quite similar to Type I). However, its threshold was defined here by an increase of 20% in the imprinted laser track width beyond the beam waist. Type II is detected under polarized optical microscopy and is characterized by the formation of a linear birefringence whose orientation is almost linearly dependent on the laser polarization.
Figure 1 shows the different types obtained as a function of the scanning speed and the laser pulse energy in 9754 and GeS
2 glasses. SF10 has writing-type threshold graphs similar to those of 9754 in
Figure 1. In particular, the energy thresholds needed for the appearance of Type I or spatial broadening regimes are similar: about 0.1 µJ for Type I and between 1.5 µJ and 2 µJ for the “spatial broadening regime”. It should be noted, however, that 9754 is the only one, which shows the appearance of Type II, and none of the three materials showed Type III—voids formation. For a low writing speed (typ. 0.01 mm/s) self-assembled periodic nanostructures appear in 9754 glass, creating a birefringence whose neutral axes are oriented by the femtosecond laser polarization [
19]. In contrast, we note that the chalcogenide glass has low Type I thresholds of a few nJ at low scanning speeds and a few 10 s nJ at high scanning speeds (>1
, up to
). The spatial broadening regime also appears for low energies of a few
. On the contrary, SF10 and 9754 oxide glasses show thresholds of about one order higher for both Type I threshold and spatial broadening regime. Taking into account the size of the laser beam, we can express the Type I thresholds in terms of fluence (J/cm²). In our typical writing conditions, at the scanning speed of 1 mm/s, we calculate the corresponding fluence per pulse in GeS
2 at 2.7 J/cm², in 9754 at 11.1 J/cm², and in SF10 at 13.3 J/cm².
Moreover, the threshold of appearance of the different regimes depends on the number of pulses sometimes called the “incubation effect”. Typically, one can find a decrease by a factor of 2 for oxide glasses, e.g., from 13.3 J/cm² to 6.6 J/cm² in SF10 when decreasing the speed down to 0.01 mm/s (i.e., ). Following a similar trend in GeS2, but more pronounced, the threshold decreases progressively from 4.4 J/cm² for 5 pulses/μm (speed of 25 mm/s) to 2.7 J/cm² for 120 pulses/μm and down to 0.4 J/cm² for (0.01 mm/s). We also note that the size (longitudinal) of the modified zone increases with the energy but not with the number of pulses; on the other hand, the ∆n increases with the number of pulses. In addition, the width of the laser tracks remains quite similar within the whole Type I regime. This contrasts with the so-called spatial broadening regime where the width increases progressively with the pulse energy.
Therefore, we suggest here that Type I modifications are related to the accumulation of point defects leading to a glass network depolymerization, which favors a structural relaxation. For example, this is confirmed in GeS
2 by Raman measurements indicating that the refractive index increase is associated not only to point defects generation but rather to glass densification (e.g., an increase in the population of edge-sharing tetrahedra in GeS
2) [
20]. Then, in agreement with the literature, the measured Type I thresholds decrease when the number of pulses increases. Indeed, using moderate focusing (0.25 NA), Schäffer et al. [
21] observed “incubation effects” leading to a decrease in the damage threshold in oxide glasses when increasing the number of pulses, as observed during surface experiments [
22,
23]. In the latter case, it has been demonstrated [
24] that the effect of incubation is twofold: (i) it modifies the absorption by the accumulation of point defects, and (ii) it introduces new possibilities of energy deposition in the glass network, e.g., in addition to electron-phonon coupling. These possibilities are based on a coupling of electrons trapped in the lattice. The increase in defect concentration is proportional to the initial defect concentration and the increment in the number of pulses and also depends on the number of atomic sites likely to be affected during this accumulation process.
Then, there is likely a second mechanism acting in the spatial broadening regime, which enlarges progressively the laser track’s width. In a simplified view, the spatial extension of the laser tracks (beyond the light beam size) is likely related to a temperature increase with the pulse energy [
25]. Now, if we increase the energy of the pulses, the maximum temperature reached at the laser focal point increases but the spatial distribution of heat (defined by the Fourier’s law) remains unchanged. The maximum temperature is given by [
25]:
where
is the energy absorbed per unit volume,
is the glass density,
is the heat capacity,
is the beam waist radius, and
is the longitudinal laser beam size (depending on the NA, pulse duration, and non-linear effects). Thus, the increase in energy
induces an increase in temperature
and thus a spatial enlargement (beyond the light affected zone) of the imprinted laser track. This corresponds to the volume within which the temperature is higher than a threshold temperature (i.e., a transformation temperature), leading to glass structural relaxation and thus permanent index changes.
From that point, one could explain the decrease in the spatial broadening threshold when the writing speed decrease, which is a general trend observed in all three samples. Here, one explanation could be based on the accumulation of point defects (also called color centers) from pulse to pulse. This results in an increase in the absorption coefficient , with , either through an increase in the multiphoton absorption cross-section or even a reduction in the multiphoton process order by passing through a relay state (i.e., an electronic absorption level attributed to a point defect). Then, the resulting increase in energy absorbed per unit of volume () leads to a reduction in the spatial broadening threshold when reducing the writing speed.
Quantification of the photo-induced refractive index changes: In addition to microscopic observations, we performed a quantitative measurement of the phase variation implemented by fs-laser direct writing [
26]. Using Quantitative Phase Microscopy (QPM, Iatia), we were able to measure a mapping of the localized phase (expressed in rad) compared to the pristine background. To study the photo-induced phase variations, a constant writing speed was set at 1 mm/s. This speed was chosen as a compromise in order to achieve fast laser writing while maintaining a high and constant index profile all along the spiral trajectory.
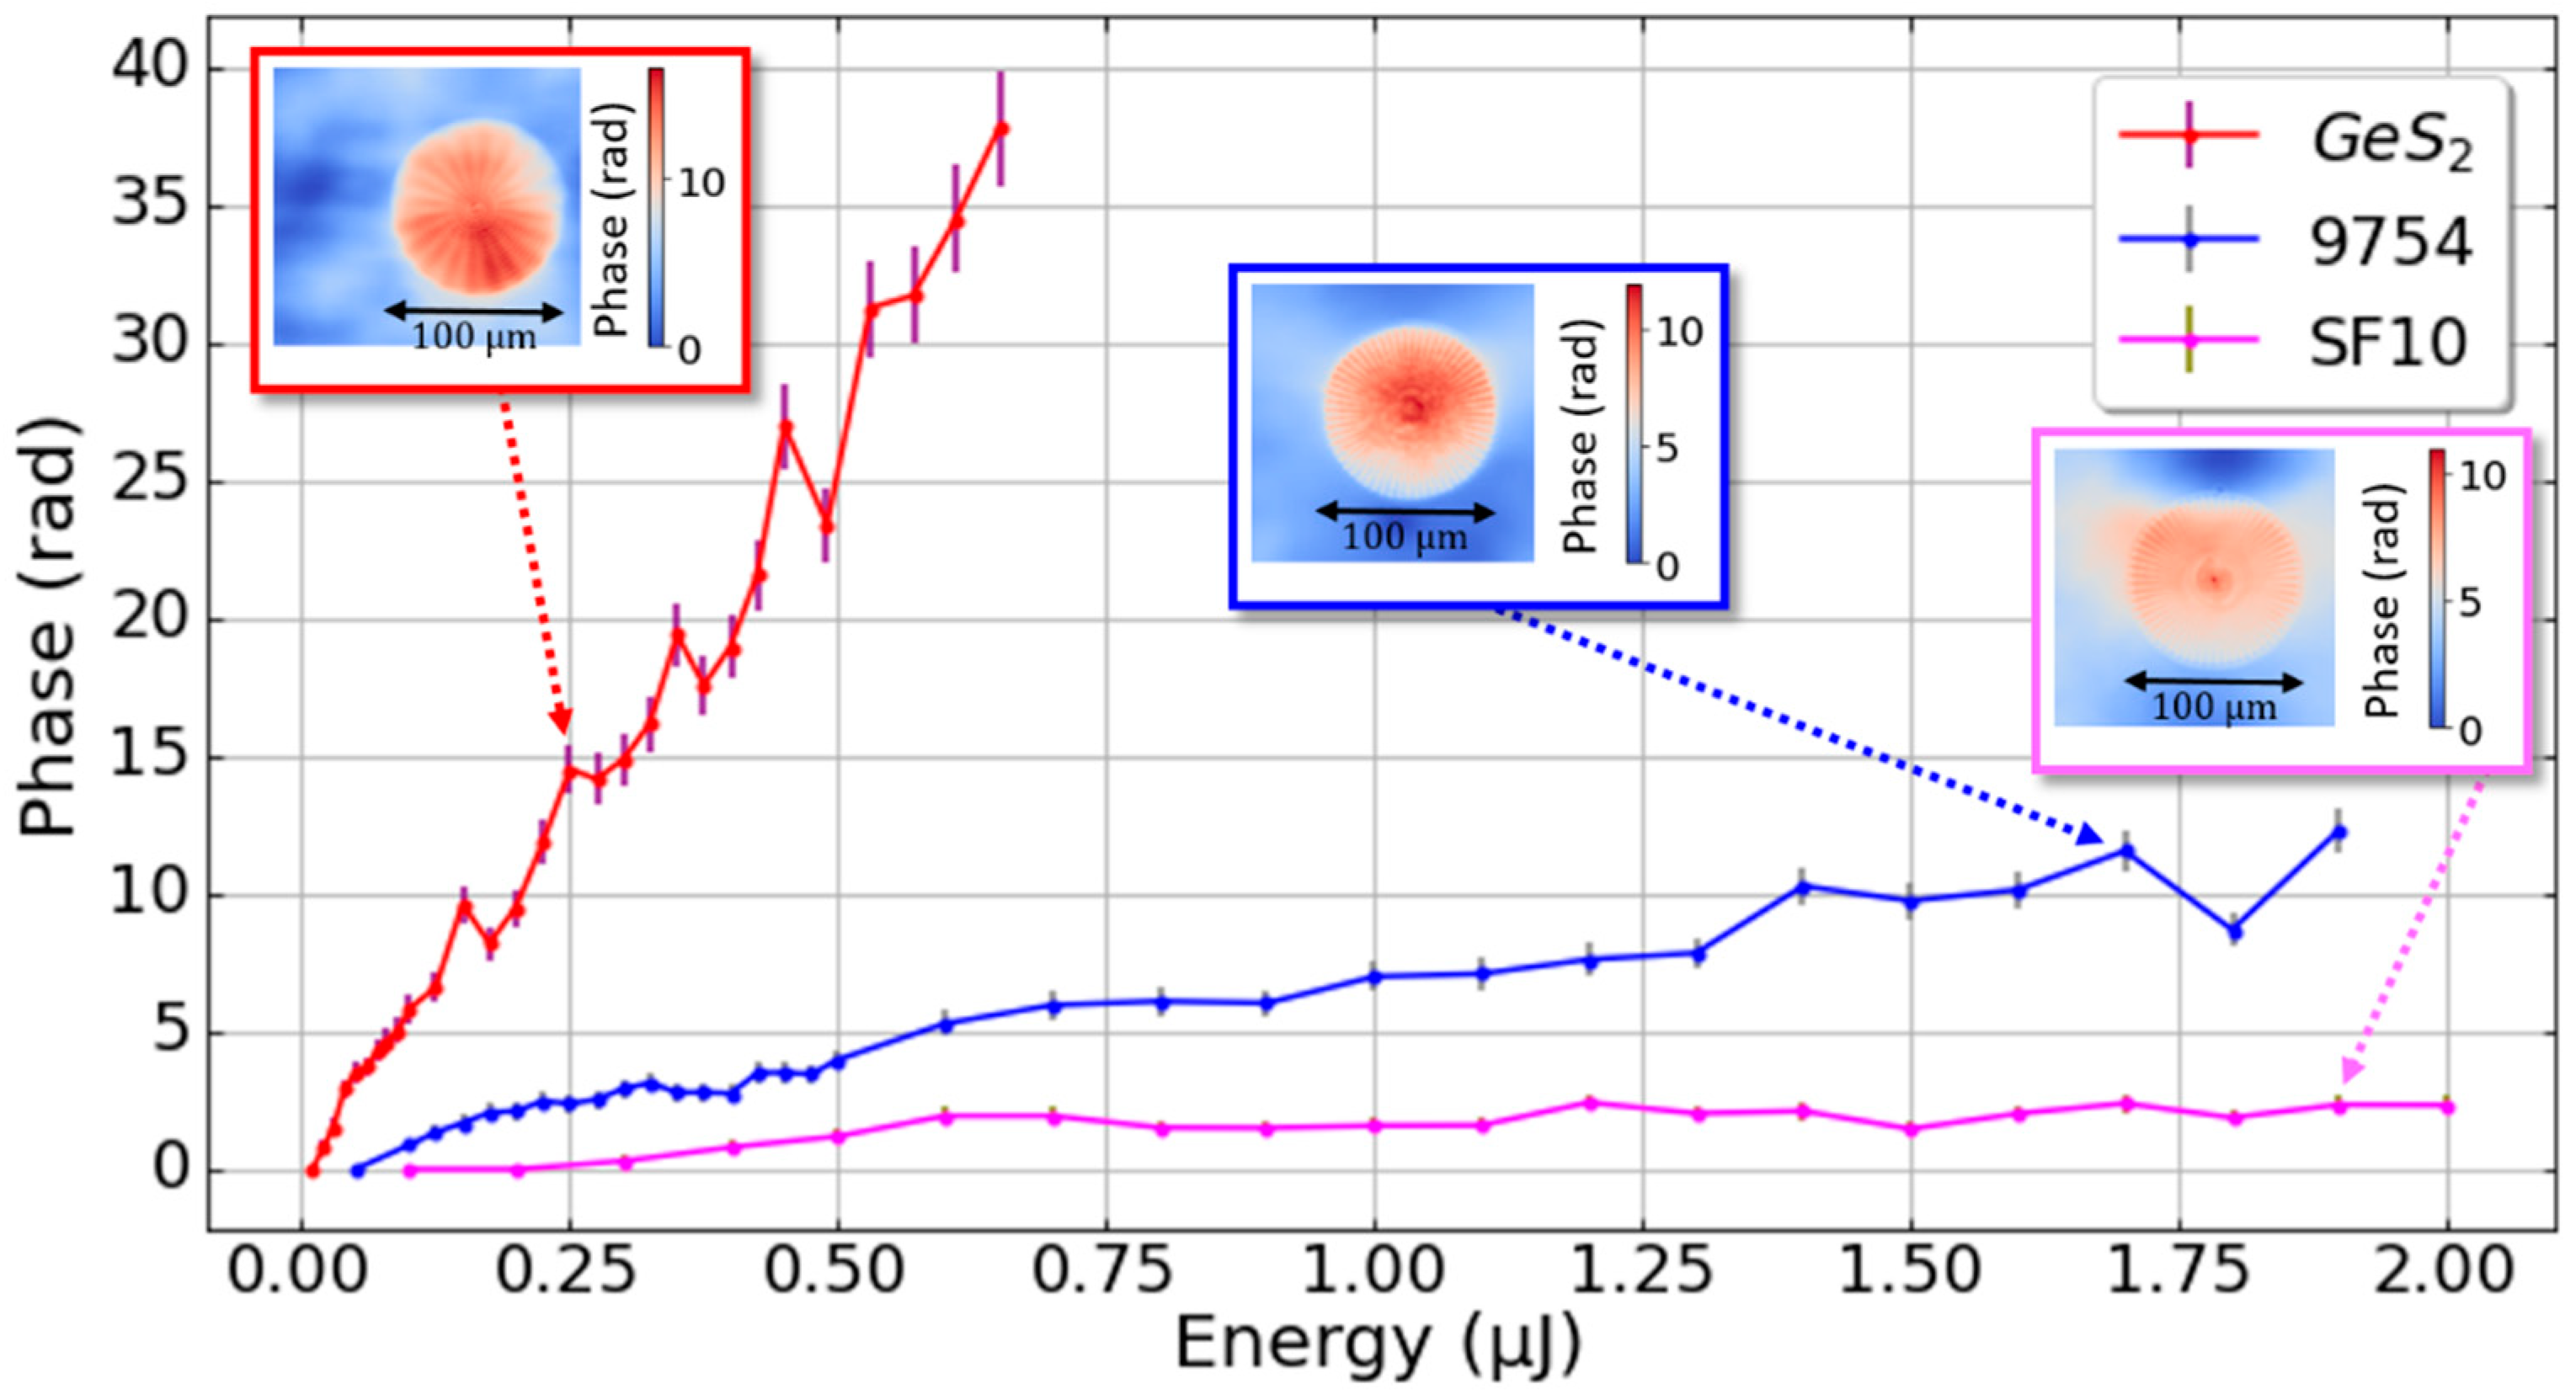
Figure 2 plots the phase variation implemented in each material as a function of laser pulse energy. We notice that a strong phase variation appears at a very low energy in the GeS
2 (about
at 0.125 µJ). We also note that SF10 remains on a nearly constant phase variation above 0.7 µJ (
). On the other hand, the 9754 glass exhibits a monotonous growing over a wide range of energies and allows reaching relatively strong phase variations (around
at 1.7 µJ). All these glasses are of interest for the fabrication of 3D geometric phase optics [
7]. Variations of
with a precise phase distribution are sufficient to create most of the complex optics.
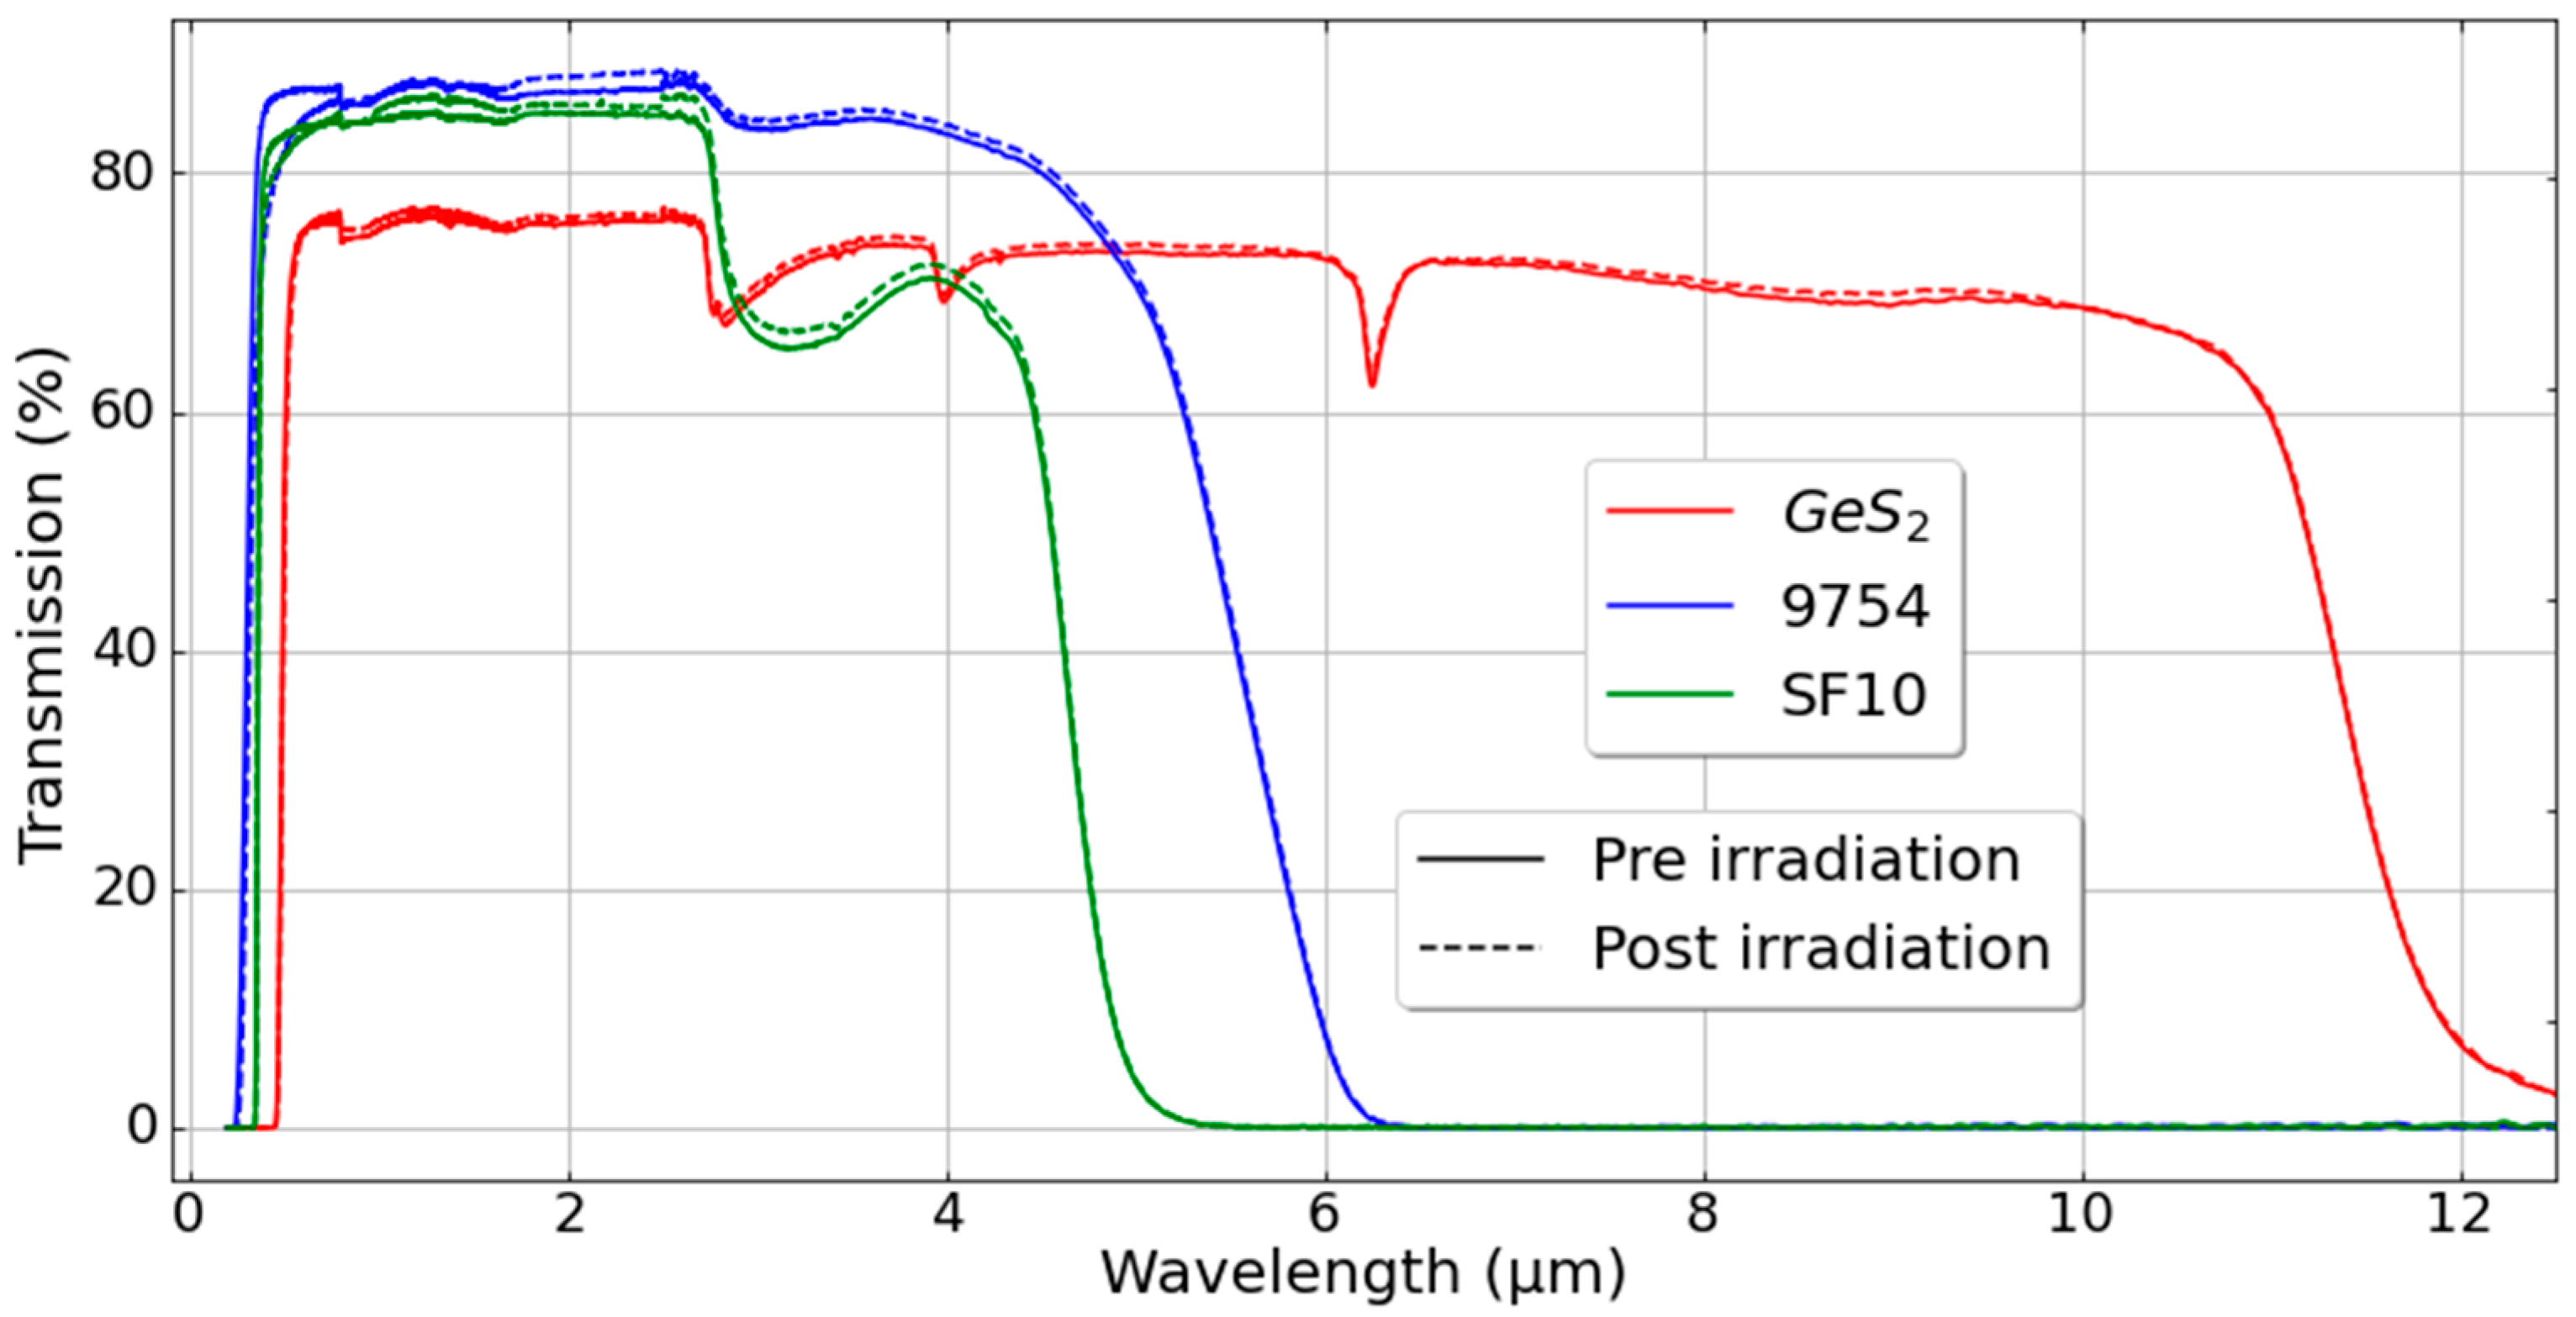
The FLDW technique locally changes the glass density of the glasses but also creates some point defects, which in turn affect its optical transmission [
27]. Therefore, we measured the optical transmission as a function of wavelength for all samples before and after laser irradiation. In order to measure the room temperature’s optical transmission of the samples over a wide spectral band, we used two spectrophotometers: an Agilent Cary 5000 (
) and a Bruker Equinox 55 (
). Thanks to the results presented in
Figure 2 of the phase variation as a function of laser energy, we were able to implement a phase change in
in our materials. We chose this
variation because it is a phase shift particularly used to design Fresnel lenses, binary ring phase masks, etc.
We can observe in
Figure 3 a rather important difference in transmission between the chalcogenides, transmitting up to 10–12 µm, and the heavy oxides transmitting only up to 4–5 µm. Then we notice in particular that the difference in transmission before and after femtosecond laser texturing remains quite negligible for a photo-induced phase variation of
. Although it is likely that implementing a larger phase variation would imply additional optical losses in these materials, the results in
Figure 3 are encouraging and bode well for a small change in the optical transmission of these glasses despite a useful magnitude of the observed changes in the refractive index.
We have seen that we are able to implement a strong phase variation in these glasses and more particularly in GeS
2 because of its binding energy, which is much lower than those of the heavy oxide glasses. The formation energy of GeS
2 is about −0.66 eV/atom, whereas the formation energy of PbO (a key constituent of SF10) is about −1.47 eV/atom and −2.07 eV/atom for GeO
2 and −3.41 eV/atom for Al
2O
3. These data are extracted from The Material Project website and calculated based on Ref [
28]. For many applications, it would be necessary to convert phase variation (
in rad) into refractive index changes written by the femtosecond laser. In this view, it is sufficient to measure the thickness of the laser-modified region d to have:
where
is the probe wavelength used for the quantitative phase measurement (here
). This value of
is only an approximation. Indeed, it is assumed that the FLDW technique implements a constant index variation over a cylinder in the thickness of the material. In fact, the real shape of the trace depends first of all on the focusing optics, on the index, and on the non-linear index of the material. There is then a competition between the Kerr effect focusing the rays and the defocusing due to the plasma created by the fs-laser [
29].
Nevertheless, we aim to use the FLDW technique to fabricate gradient index optics and geometric phase optics for infrared imaging systems. Thus, for the fabrication of graded index optics, we need to know the index variation implemented by the laser. One of the current development axes of the direct femtosecond laser writing technique is to find the materials and the laser parameters allowing one to obtain the highest possible refractive index variations. Indeed, the greater the range of index variation available, the more freedom the optical designer will have to create the optical component needed for their system. We have therefore reviewed in
Figure 4 the different ranges of index variation obtained in the literature (data collected from Refs. [
5,
9,
18,
29,
30,
31]). Several glass families are considered, in particular mid-IR glasses: fluorides, chalcogenides, and heavy oxides, including Barium Gallo-Germanate (BGG).
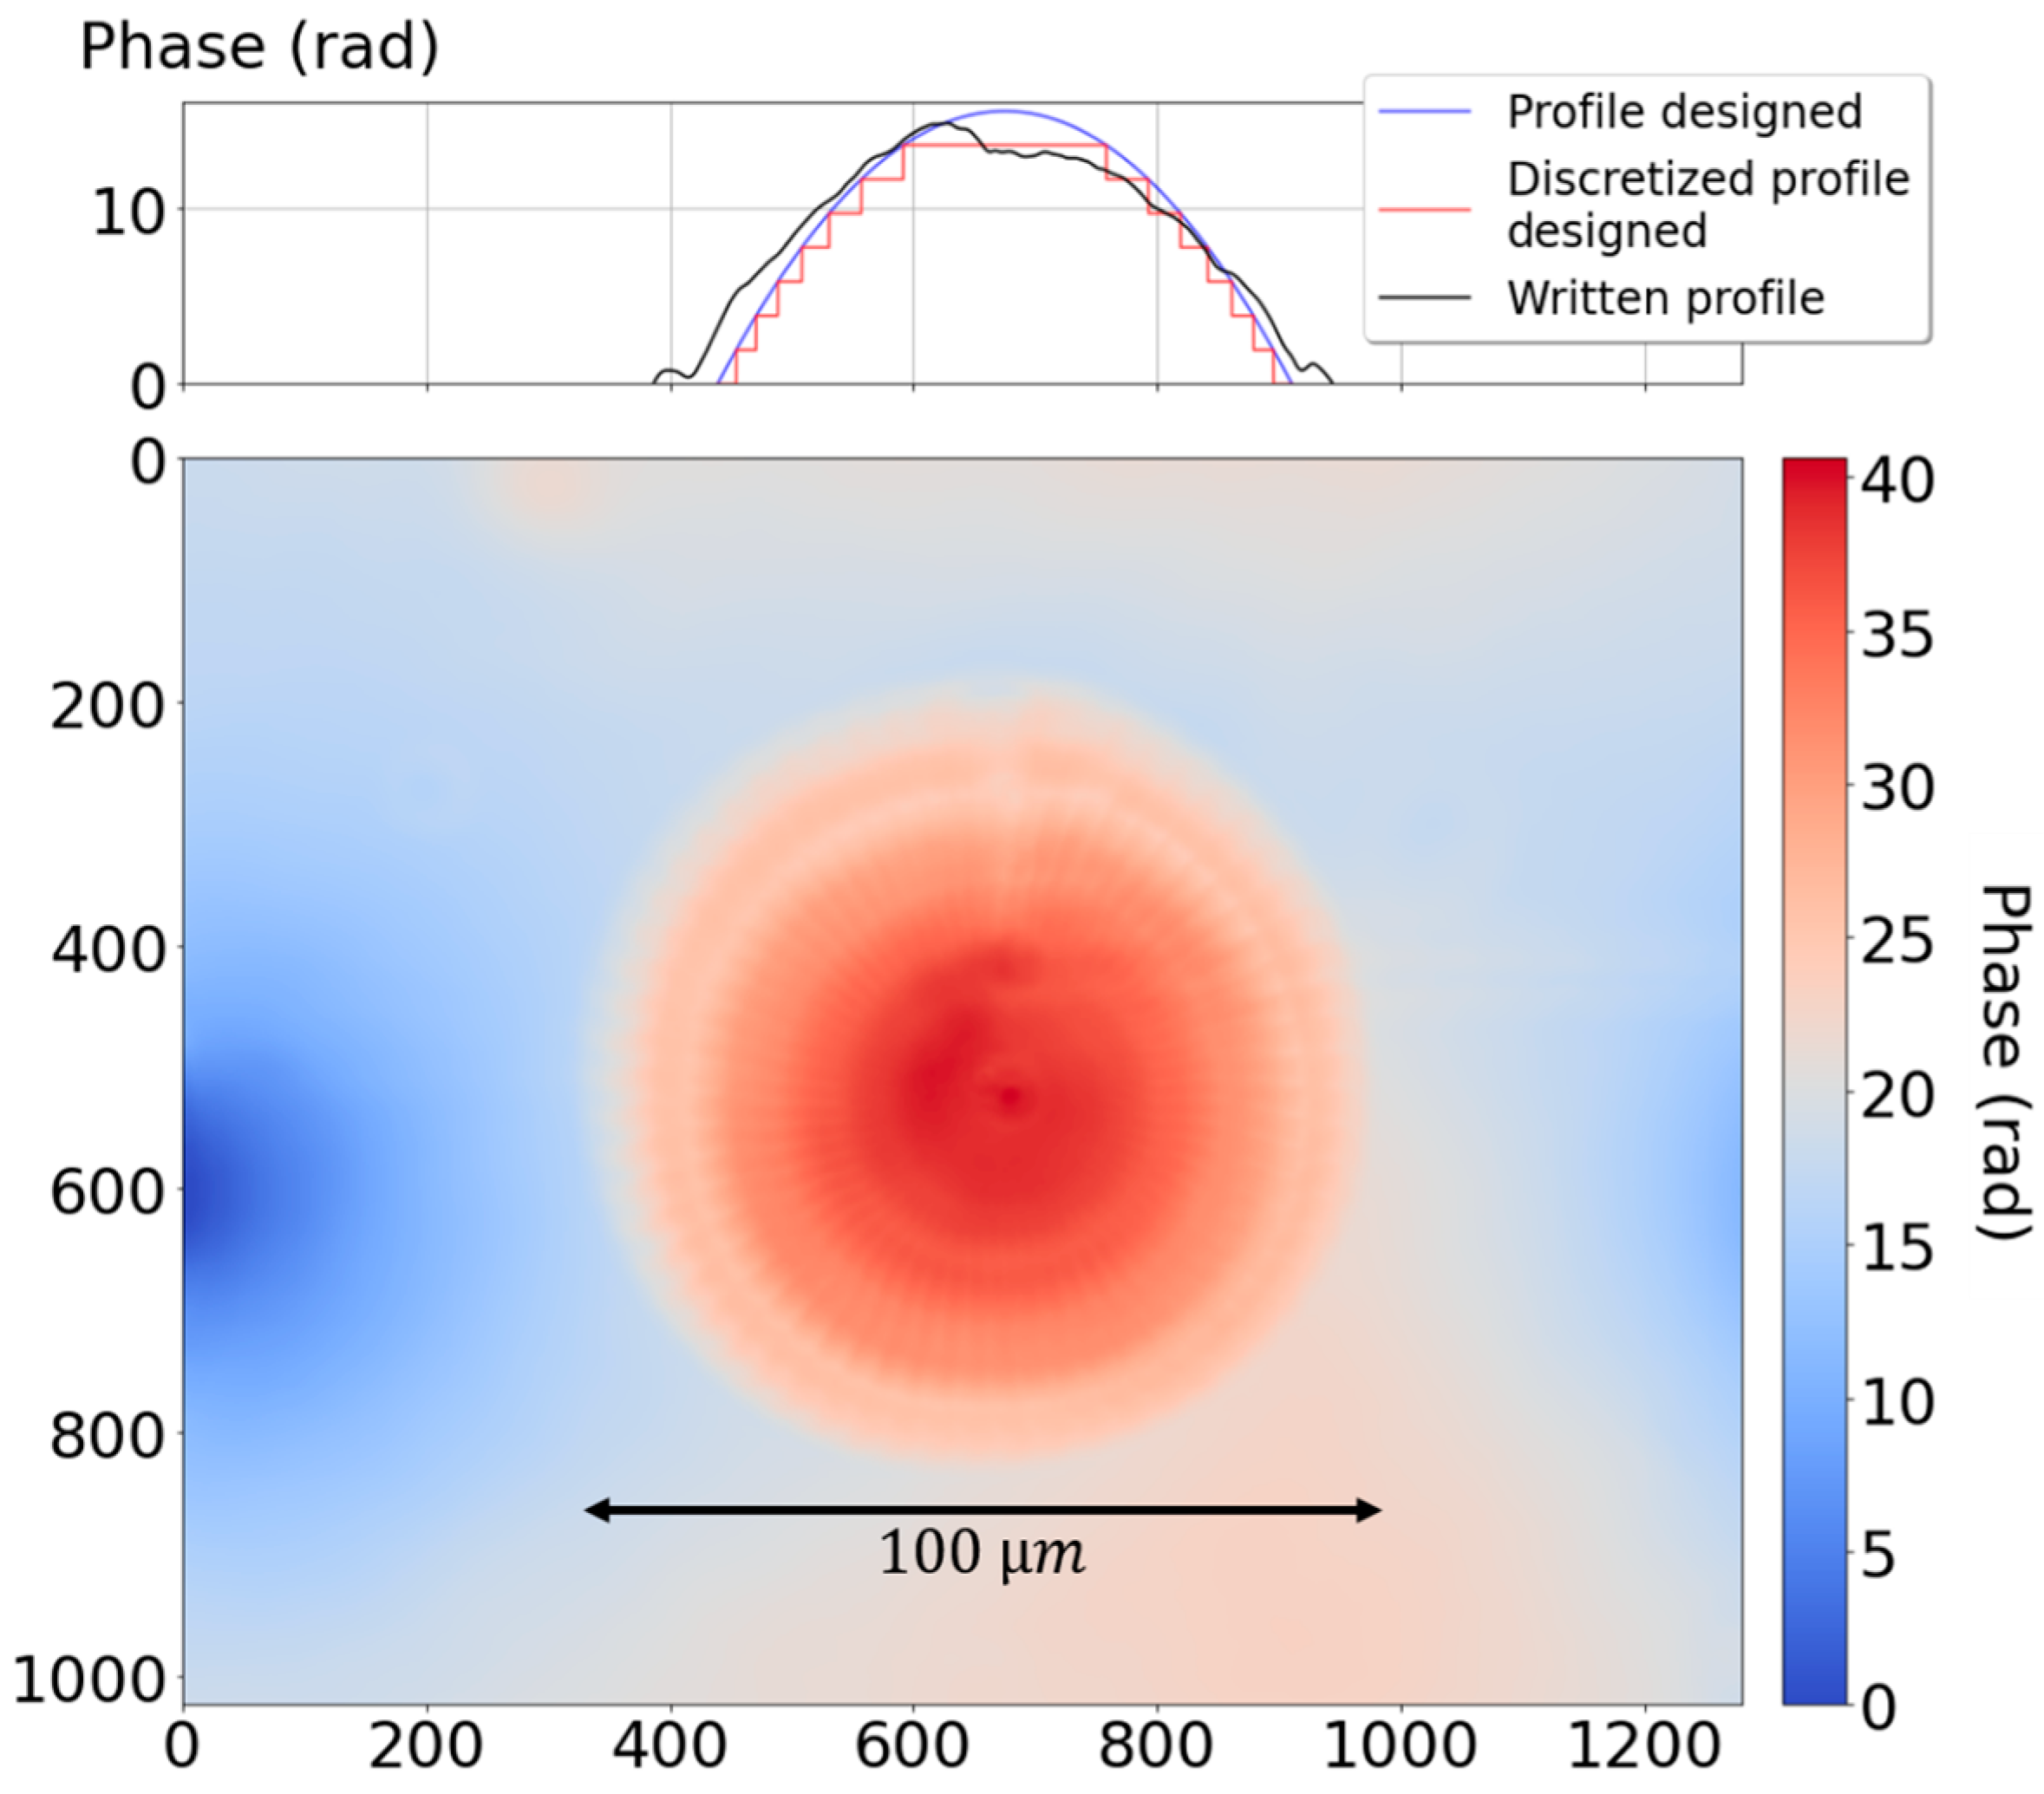
The phase profile and the picture illustrated in
Figure 4 show a distribution of the refractive index variation inside the GeS
2 material that can be roughly seen as two parts of thickness,
and
. The upper part contributes twice as much as the lower part (
, which can be deduced from the cross-section phase profile shown in the inset of
Figure 4), where
and
, respectively, represent the phase variations in the first part and the second part of the material. Therefore, the total phase variation is
. Thus, for a disc written in a single pass at high energy, we obtain two index variation sections along the z-axis, with a total thickness
:
with
(estimated from phase profile, see inset of
Figure 4). Consequently, with a total phase variation of
inside the GeS
2 material (
Figure 2), we obtained:
The results presented in
Figure 4 confirm the good photosensitivity (i.e.,
at “saturation”) of chalcogenide glasses to fs-laser writing. Indeed, refractive index changes
up to
in GeS
2 were successfully implemented. In contrast, the two heavy oxide glasses studied achieved quite large index variations for their class and in particular
in the Corning 9754 glass and
in the SF10 glass.
Implementation of a GRIN lens phase profile using FLDW: We are now well aware of the phase variation implemented in these materials as a function of laser energy (see
Figure 2), and we can now fabricate optical components embedded in the substrate by the fs-laser writing method.
Two types of gradients, described in
Figure 5, are possible in order to create the phase profile of a lens by the FLDW technique. We will call the first type a thickness gradient. For this thickness gradient, only one value of refractive index variation is chosen. The phase variation is then created by the superposition of layers of the uniform index but different diameters. It is therefore a classical lens of constant refractive index
immersed in a material of constant index
:
. The second type of gradient is the refractive index gradient. Here, the thickness of the texturing is constant, and it is the refractive index that varies spatially. The index modified by the laser power variation during the writing process is then defined by
. The phase profiles of these two types of gradients are identical but are fabricated in different ways. It will be simpler to manufacture a thickness gradient lens in that only a specific value of index variation is required. It is therefore sufficient to know the laser energy required for a single-phase variation. However, many layers are needed to manufacture a gradient thickness lens, while only one layer may be sufficient for a gradient index lens. The gradient index lens will therefore be written more quickly. For example,
Figure 6 shows a
diameter gradient index lens written on eight layers. The lens was written at a scanning speed of
(corresponding to about 120 pulses/μm), and we can see after removing the background in the phase map that the obtained phase profile is equivalent to the designed one.


 ,
, 


