Article

Microstructural Characteristics, Modeling of Mechanical Strength and Thermal Performance of Industrial Waste Glass Blended Concrete

by
Moruf Olalekan Yusuf
1,
Khaled A. Alawi Al-Sodani
1,*,
Adeshina A. Adewumi
1,
Ali H. Alateah
1,
Mohammed M. H. Al-Tholaia
1,
Sami M. Ibn Shamsah
2,
Umair Yaqub Qazi
3 and
Ghazi Dibas S. Alanazi
1
1
Department of Civil Engineering, College of Engineering, University of Hafr Al Batin, P.O. Box 1803, Hafr Al Batin 39524, Saudi Arabia
2
Department of Mechanical, College of Engineering, University of Hafr Al Batin, P.O. Box 1803, Hafr Al Batin 39524, Saudi Arabia
3
Department of Chemistry, College of Science, University of Hafr Al Batin, P.O. Box 1803, Hafr Al Batin 39524, Saudi Arabia
*
Author to whom correspondence should be addressed.
Appl. Sci. 2022, 12(17), 8600; https://doi.org/10.3390/app12178600
Submission received: 21 July 2022 / Revised: 17 August 2022 / Accepted: 24 August 2022 / Published: 27 August 2022
(This article belongs to the Special Issue Innovative Building Materials)

Abstract

:
The need to get rid of solid waste in the environment necessitates the incorporation of waste glass powder (WGP) in mortar and concrete. The blending of WGP (G) with ordinary Portland cement (OPC) is a valorization technique that is not only cost efficient but also environmentally friendly. The replacement level is denoted as CxG10−x, where x is 0–20 wt.% at an interval of 5 wt.% in mortar (w/b = 0.4) and 0, 10, 20 and 30 in concrete (w/b = 0.42). The study investigates the effects of glass on the setting, workability, thermal resistance, microstructure, mineral phases and bond characteristics of silicon and hydroxyl-based compounds and C-O vibrations. It also provides the model equations for strength characteristics in terms of OPC, G and ages in mortar and concrete on one hand and investigates the residual strength and density of glass blended concrete at elevated temperature (550 °C) on the other. It is found that glass enhances the workability, reduces the setting time and density and enhances the residual strength and density of concrete. The presence of glass leads to the formation of coesite and microstructural distortion and decreases the Ca/Si ratio. Besides, the bond characteristics of the binder are significantly affected, while the thermal residual strength capacity in glass blended concrete (C80G20) is 40.4% and 75.14% lower than that in OPC concrete (C100G0) because of the low thermal conduction of glass particles. The optimum glass content in mortar and concrete to produce 33 MPa (28 days) and 47 MPa (90 days) is found to be 10 wt.% and 20 wt.%, respectively.

1. Introduction

Carbon dioxide proliferation has been a major challenge facing our environment due to its contribution to the global warming effect. Civil engineers have a responsibility to minimize the use of cement as a source of carbon dioxide (CO2) being released into the atmosphere. The reason for this is that the disintegration of limestone is essential to obtain lime as the main ingredient for cement production. In addition, the accumulation of glass wastes in landfill is ubiquitous due to auto crashes, automobile repair and the fabrication of glass windows in the building industry. These wastes constitute 7% of the world’s solid wastes, and plain glass was reported to form the majority of this waste [1]. The utilization of 6 tons of glass waste could reduce a tonnage of CO2, thereby reducing cement production by 14% [1]. In 2018, the USA generated about 12.3 million tons of glass waste, which accounts for about 4.2% of the total municipal solid waste (MSW). The Environmental Protection Agency (EPA) aggregated data from the Glass Packaging Institute (GPI), estimating recyclable glass to total 3.1 million tons at a recyclable rate of 31.3% [2], In Australia, the annual amount of recyclable glass totals 1 million tons [3,4].
Lu et al. [5] reported the advantages of using waste glass powder as a replacement of the cementitious material on the properties of the architectural cement mortars. The waste glass powder controls the workability and hydration reaction and increases the flexural strength of cement. It also performs the role of microfilling within the pores, with an improvement in the strength at curing period of 90 days. The size of glass waste has been reported to play a significant role on the glass pozzolanic reactivity [6]. Shi et al. [6] asserted that a size of 20–44 microns has better pozzolanic reactivity than 5–20 microns and 74–150 microns, while thermogravimetric and differential scanning calorimetric analysis (TGA/DSC) showed the depletion of portlandite in favor of CSH gel formation.
Shi et al. [6] reported that the optimum replacement level of glass waste in mortar is in the range between 10% and 20%, respectively. Simonova et al. [7] observed that borosilicate glass waste does not significantly contribute to the consistency of mortar and added that glass less than 10 wt.% can be incorporated without adversely affecting the strength performance of the mixture. To achieve better durability performance, finer glass at 20%wt replacement was recommended in mortar [8]. The microstructure analysis showed well distributed spherical particles within the cement matrix, with consequently less density in comparison with cement/blast furnace slag precursor (up to 26%) due to the presence of an internal bubble system that accompanies its spherical shape. Shoaei et al. [9] also studied the performance of glass powder in OPC and alkaline activated slag binder. A reduction in expansion and the prevention of shrinkage in the mortar were reported among the advantages of glass incorporation. In [10], the authors also used waste glass in partial replacement for OPC to control expansion and found that clear glass increased the expansion while green and brown decreased the expansion due to alkali silica reactivity (ASR).
Moreover, [11] asserted that using glass waste as fine aggregate reduces the flowability and density of the mortar but not the drying shrinkage and air content. Li et al. [1] identified the contribution of size of glass powder to the fluidity, strength and microstructural performances of the resultant mortars. In [12], the authors also established that a size lower than 25 microns would result in higher pozzolanic reactivity. However, this study was restricted to only mortar samples without considering equivalent concrete characteristics. Lu et al. [13] correlated prolonged setting, workability (flowability) and the early hydration process to the quantity of waste powder [13], and Sadati and Khayat maintained that the inclusion of glass powder decreases the rheology of the mixture by increasing the plastic viscosity of mortar while the rate of structural build-up decreased from 0.118 to 0.013 Pa/s [14].
In [15], the authors used glass waste as fine and coarse aggregates and asserted that sample levels lower than 25% could be used without any significant disintegration in strength, but neither microstructural analysis nor mineral phase identification were studied. In [16], the authors also used a cathode ray tube as fine aggregate, and the result showed that concrete at more than 45 MPa with a better expansion of less than 0.1% could be achieved. In [7], the authors reported a decrease in the mechanical strengths (tensile and flexural) and fracture parameters due to replacement of ordinary Portland cement (OPC) with glass waste at 3–20 wt.% of cement. The presence of glass reduces early strength development in mortar and concrete with a water–binder ratio of 0.53 [17]. The presence of glass could protect against the early formation of C-S-H gel [3]. In [18], the authors reported that glass fume (GF) nanoparticles similar in characteristics to silica fume (SF) can be developed by using radio frequency induction coupled-plasma spheroidization technology. The material underwent pozzolanic reaction with portlandite, thereby increasing early age performance and strength development that influenced long-term mortar characteristics.
Kamali and Ghahremaninezhad [19] also reported the contribution of glass waste to later time hydration reaction, microstructural refinement and non-evaporable water content. Moreover, the concrete blocks produced from the waste glass cullet enhanced the fresh properties and displayed high resistance to acidic attack, thermal exposure and drying shrinkage and possessed low water absorption mainly due to the non-absorbent nature of glass, thereby enhancing its durability advantage [16,20]. In [7], the authors found that borosilicate glass powder decreased the fracture toughness, modulus of elasticity and fracture energy except for the partial substitution of OPC, which was less than 10%.
Karen Zheng [21] reported the potency of glass reactivity and pozzolanicity in the formation of a calcium-dominated rim due to the formation of C-S-H by using pore solutions. The formation of this secondary product leads to the proliferation of aluminum and sodium, which causes the prevention of formation of dissolved silica from the aggregate. In [22], the authors also reported a reduction in thermal conductivity and sorptivity when nano-silica and brown soda-lime waste glass powder were used as fine aggregate in cement mortar [22]. Recycled cathode ray tube glass was also used as fine aggregate to improve the workability and shrinkage performance of mortar [23,24]. Crack and corrosion reduction were among the other advantages of using glass as aggregates in mortar [25]. In [26], the authors exposed glass blended mortar to temperatures of 500 °C and 800 °C. Better performance was experienced in glass blended mortar below 500 °C, but worse performance was recorded within 500–800 °C with reference to the control while the strength loss was adduced to the dehydration of portlandite [26]. The strength loss of partial Portland cement replacement in mortar by the fine glass powder cementitious materials was studied by [26]. This study showed that 20% glass powder mortar mix had the highest residual strength (15% loss) due to the reduction in portlandite in the mixture. The incorporation of glass waste into concrete containing silica fume and flyash had low density and absorption, even though compressive and tensile strength were lower than the value obtained from conventional concrete [27]. In [28], the authors conducted a review on silica fume and glass powder, while in recent times, the authors of [29] investigated ternary blended concrete containing silica fume, waste glass powder and ordinary Portland cement.
Most of these studies reported the strength performance of glass within 28 days and durability characteristics such as shrinkage, absorption and thermal properties of paste and mortars. This study focuses on both mortar and concrete in terms of fresh properties, strength characteristics with predicting models and thermal performance of concrete prepared at a lower cement ratio. Furthermore, the study also presents an understanding of the microstructural characteristics, mineral phases, and bond characteristics of Si-O-Si, -OH and C-O using scanning electron microscope/energy dispersive spectroscopy, X-ray diffraction and Fourier Transform Infrared spectroscopy, respectively. This study gives a better understanding of the behavior of concrete in terms of strength and thermal performance for infrastructural applications.

2. Materials and Methods

2.1. Raw Materials

2.1.1. Ordinary Portland Cement
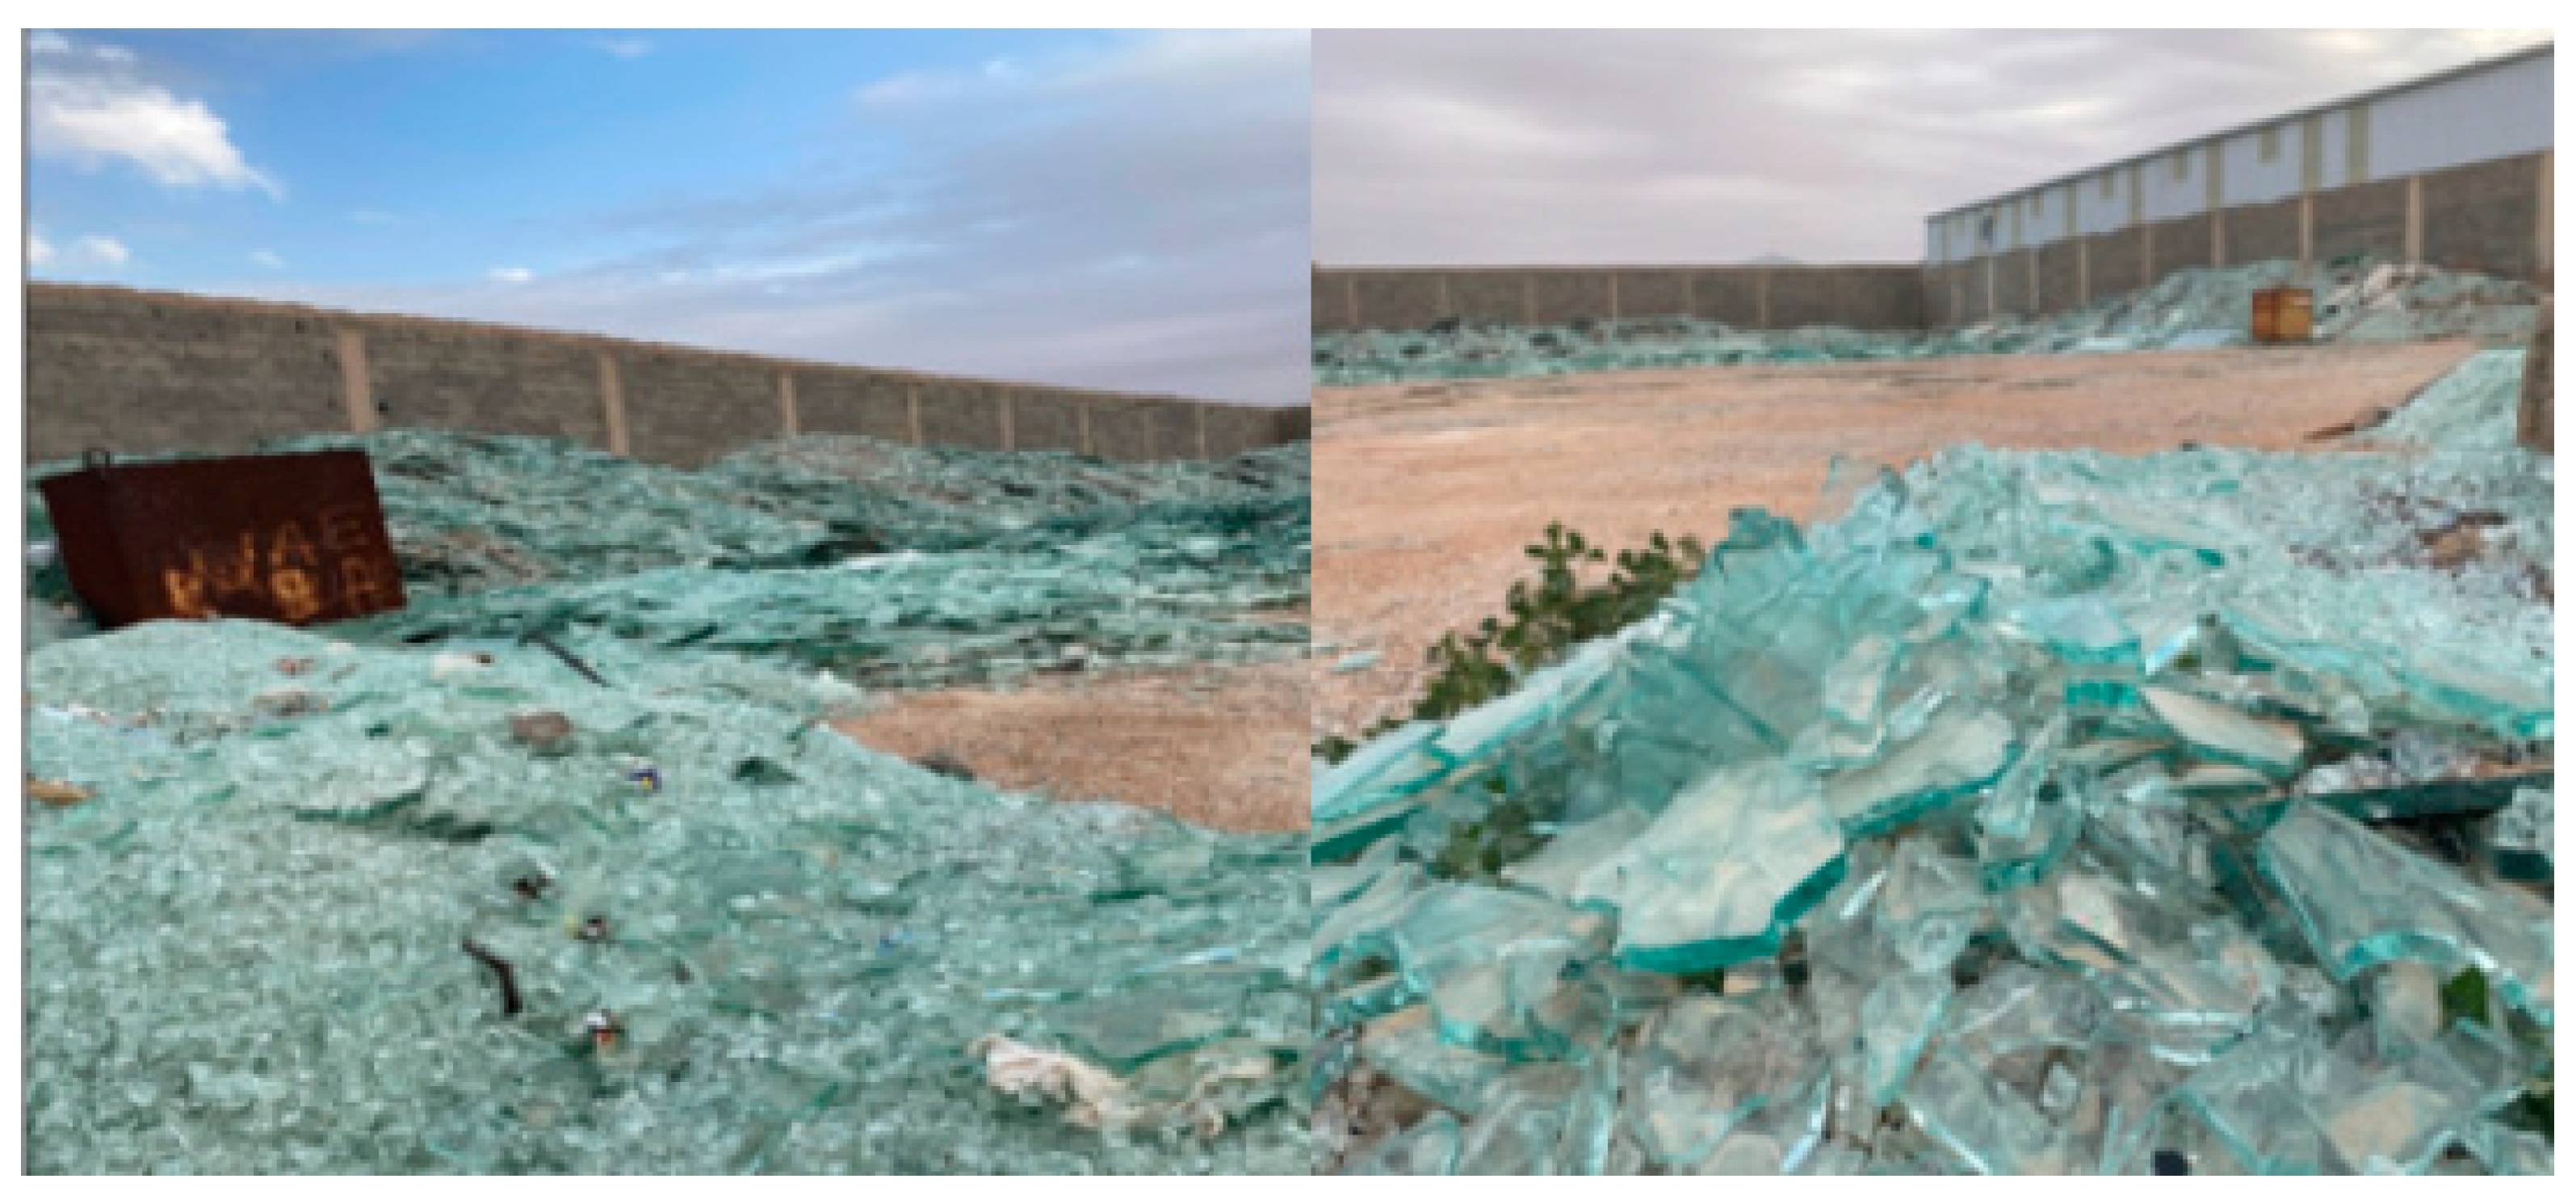
Type I cement was used in accordance with ASTM C 150 [30] with an apparent specific gravity (water) of 3.15. The oxide composition of ordinary Portland cement (OPC) is shown in Table 1.

2.1.2. Glass Waste

The glass waste used for this study was collected from the dumpsite located along Sinaya Road, Hafr Al-Batin, in the eastern province of Saudi Arabia, as shown in Figure 1.
Glass waste was first crushed by a Los Angeles grinding machine before being further ground by a grinding machine with a titanium blade with a 1400 W power rating operating at 220 V and 60 Hz. The oxide composition of cement and glass wastes as obtained from x-ray fluorescence (XRF) is presented in Table 1. The X-ray diffractions (XRD) of the glass waste and cement powder are presented in Figure 2.
The specific surface areas (BET) of WGP were determined using Micromeritics ASAP2020 via nitrogen gas adsorption. The morphologies of WGP and cement powder were evaluated using a JSM-5800LV scanning electron microscope (Figure 3).

2.1.3. Fine and Coarse Aggregates

Natural sand was used, with a passing sieve 2.36 mm (No. 8) in accordance with the condition in ASTM C 157/C 157M-08, while the ratio of fine to total aggregate was maintained at 0.4. The cement to fine aggregate ratio was 2.75, while the fine to total aggregate ratio was 0.4. Table 2 shows the fineness modulus and saturated dry density (SSD) value of the fine aggregates. The coarse aggregates had a relative density of 2.54 while absorption was 2%. The aggregates included 10 mm and 20 mm sizes in balanced proportion by weight.

2.1.4. Superplasticizer

Commercially available Glenum® superplasticizer based on polycarboxylic ether (PCE) was used in accordance with ASTM C 494 Types A and F [31]. In all of the mixture, 0.5 wt.% of the total binder was used to enhance the workability of the mortar and concrete.

2.2. Experimental Design and Methods

Mix Design

The total amount of binder was 350 kg (cement and glass) in 1 m3 of mortar. Glass partially replaced OPC such that (G/(OPC + G)) was 0.05, 0.1, 0.15 and 0.2. The water/binder ratio was 0.4 and the superplasticizer was 0.5% by the weight of the binder, while the sand/binder ratio was 2.7. The samples were designated as MG0, MG5, MG10, MG15 and MG 20, as shown in Table 3.
Similarly, the total amount of binder in concrete was also 350 kg (cement and glass) in 1 m3. Glass powder partially replaced OPC such that (G/(OPC + G)) was 0.1, 0.2 and 0.3. The water/binder ratio was 0.42 and the superplasticizer was 0.5% by the weight of the binder, while the fine aggregate to total aggregate ratio was 0.4. The samples were designated as C100G0, C90G10, C80G20 and C70G30, as shown in Table 4.

2.3. Sample Preparation

The required quantities of materials were measured and mixed with the aid of a Hobart planetary bench mixer with the capacity of 10 L. The mixing of the materials was in three stages. First, the cement and glass waste powder were mixed dry for 3 min. Secondly, the sand was added and mixed for 3 min before being cast in two layers as mortar samples in 50 mm × 50 mm × 50 mm. For concrete, the process was repeated, the coarse aggregate was added for 3 min, and the total mixture was mixed continuously and homogenously for an additional 3 min. The resulting mortar and concrete were placed in the oil-smeared mold in three layers in 100 mm × 100 mm × 100 mm steel molds, respectively. Each layer was vibrated for 30 s using a Liya mechanical vibrating table to remove any entrapped air from the mixture. Surface smoothening of the specimen was carried out with a hand trowel to obtain a level surface. The mortar and concrete samples were then covered with a plastic sheet to prevent moisture loss. Afterward, the specimens were kept in the laboratory at 20 ± 5 °C for 24 h before being demolded after 24 h. The specimens were cured in a water curing tank under a normal condition of 20 ± 5 °C until they were ready for testing at 3, 7, 14, 28 and 90 days.

2.4. Evaluation Methods

2.4.1. Setting Time and Workability

The initial and final setting times of the cement–glass blended paste were determined in accordance with ASTM C191 [32], and the workability of cement–glass blended mortar was measured in accordance with ASTM C1437 [33].

2.4.2. Compressive Strength

The compressive strength of the cement–glass blended mortar at was determined at 3, 7, 14 and 28 days, while that of concrete samples were determined at 3, 7, 14, 28, 56 and 90 days in accordance with ASTM C109 [34] and BS EN 12390-1:2000, respectively [35]. A Liya digital compression testing machine was used to determine compressive strength at a loading rate of 0.9 kN/s.

2.4.3. Density of the Sample

The density of the samples was determined after wiping the surface water to achieve saturated surface dry (SSD) density conditions by dividing the mass with the volume of the sample.

2.4.4. Thermal Treatment of Concrete

Concrete samples were exposed to an elevated temperature of 550 °C at an incremental rate of 4°/min. The concrete samples were removed after cooling, their densities were determined, and then they were crushed for residual strength measurement.

2.4.5. Microstructural Characterization of the Specimens

An X-ray diffractometer (XRD) machine manufactured by Bruker instrument, Billerica, MA, USA model d2-Phaser with Cu Ka radiation (40 kV, 40 mA) was used for the X-ray diffraction of the powder sample. Scanning electron microscopy/energy dispersive X-ray spectroscopy (SEM + EDS) SEM + EDS model 5800 LV operated at an accelerating voltage of 20 kV made by JEOL, France was used for the analysis of the morphology of the sample. A Fourier transform spectroscopy (FTIR) spectrometer made by PerkinElmer 880 Inc., Waltham, MA, USA was used to characterize the microstructure of the cement–glass blended mortar and the bond vibration of functional groups (-OH-, Si-O and O=C=O).

3. Discussion of Results

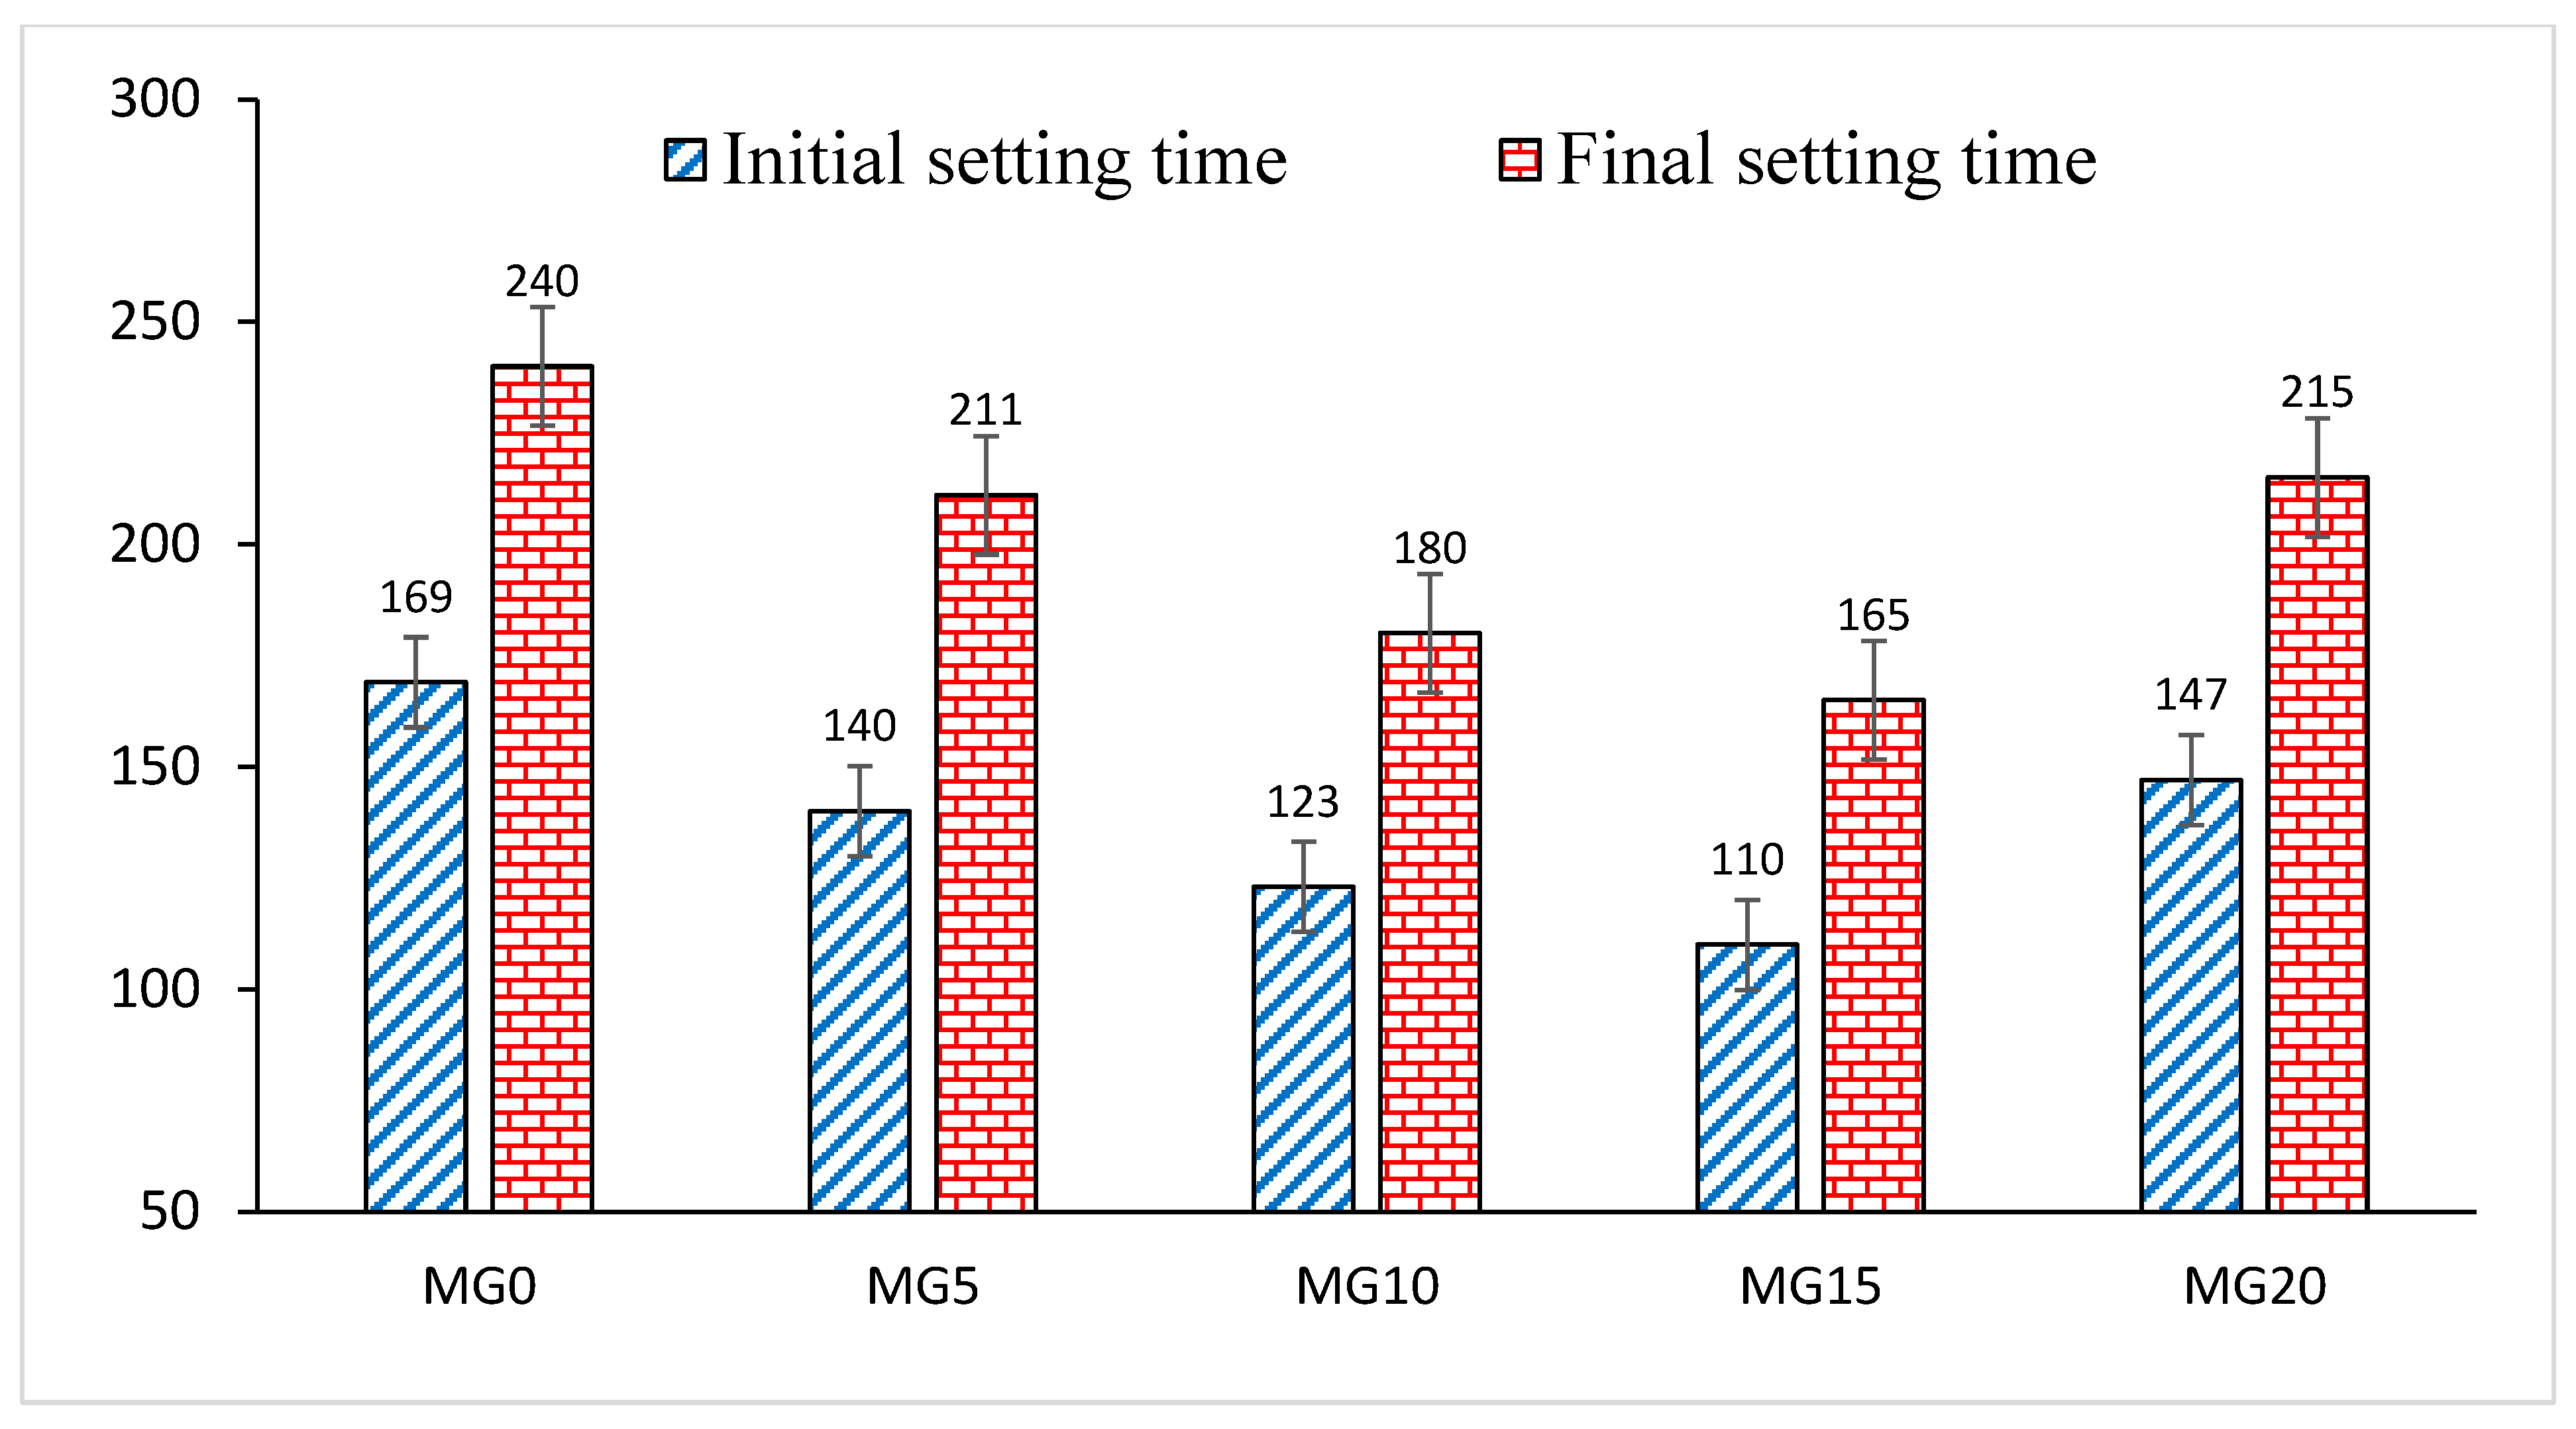
3.1. Effect of Glass on the Setting Time of Mortar

Glass powder has a high proportion of silica, thereby causing the Ca/Si ratio to be reduced. It is also noted that the presence of glass powder prompted the reduction of the initial and final setting time of the mortar due to the simultaneous reaction of tricalcium aluminate (C3A) with gypsum (CaSO4·2H2O) on one hand, and the frictional effect of glass and cement particles on the other hand [6]. The formation of calcium-silicate-hydrate in cement compounds is formed together with hydrated glass particles that occupy the capillary pores, thereby causing early hardening [1]. From Figure 4, it can be seen that the control sample has an initial setting time of 169 min, which decreased by 17.16%, 27.21% and 34.91%, while the final setting time of 240 min was reduced by 12.1%, 25% and 31.25% for the addition of glass powder at 5%, 10% and 15%, respectively. However, when the glass content increased to 20 wt.%, the initial and final setting time reduced by only 13.01% and 10.41%, respectively. This implies that excessive glass content beyond the capillary pore spaces could lead to a dilution effect that affects both setting and strength development. Therefore, early setting could not necessarily lead to early strength development in glass blended mortar.

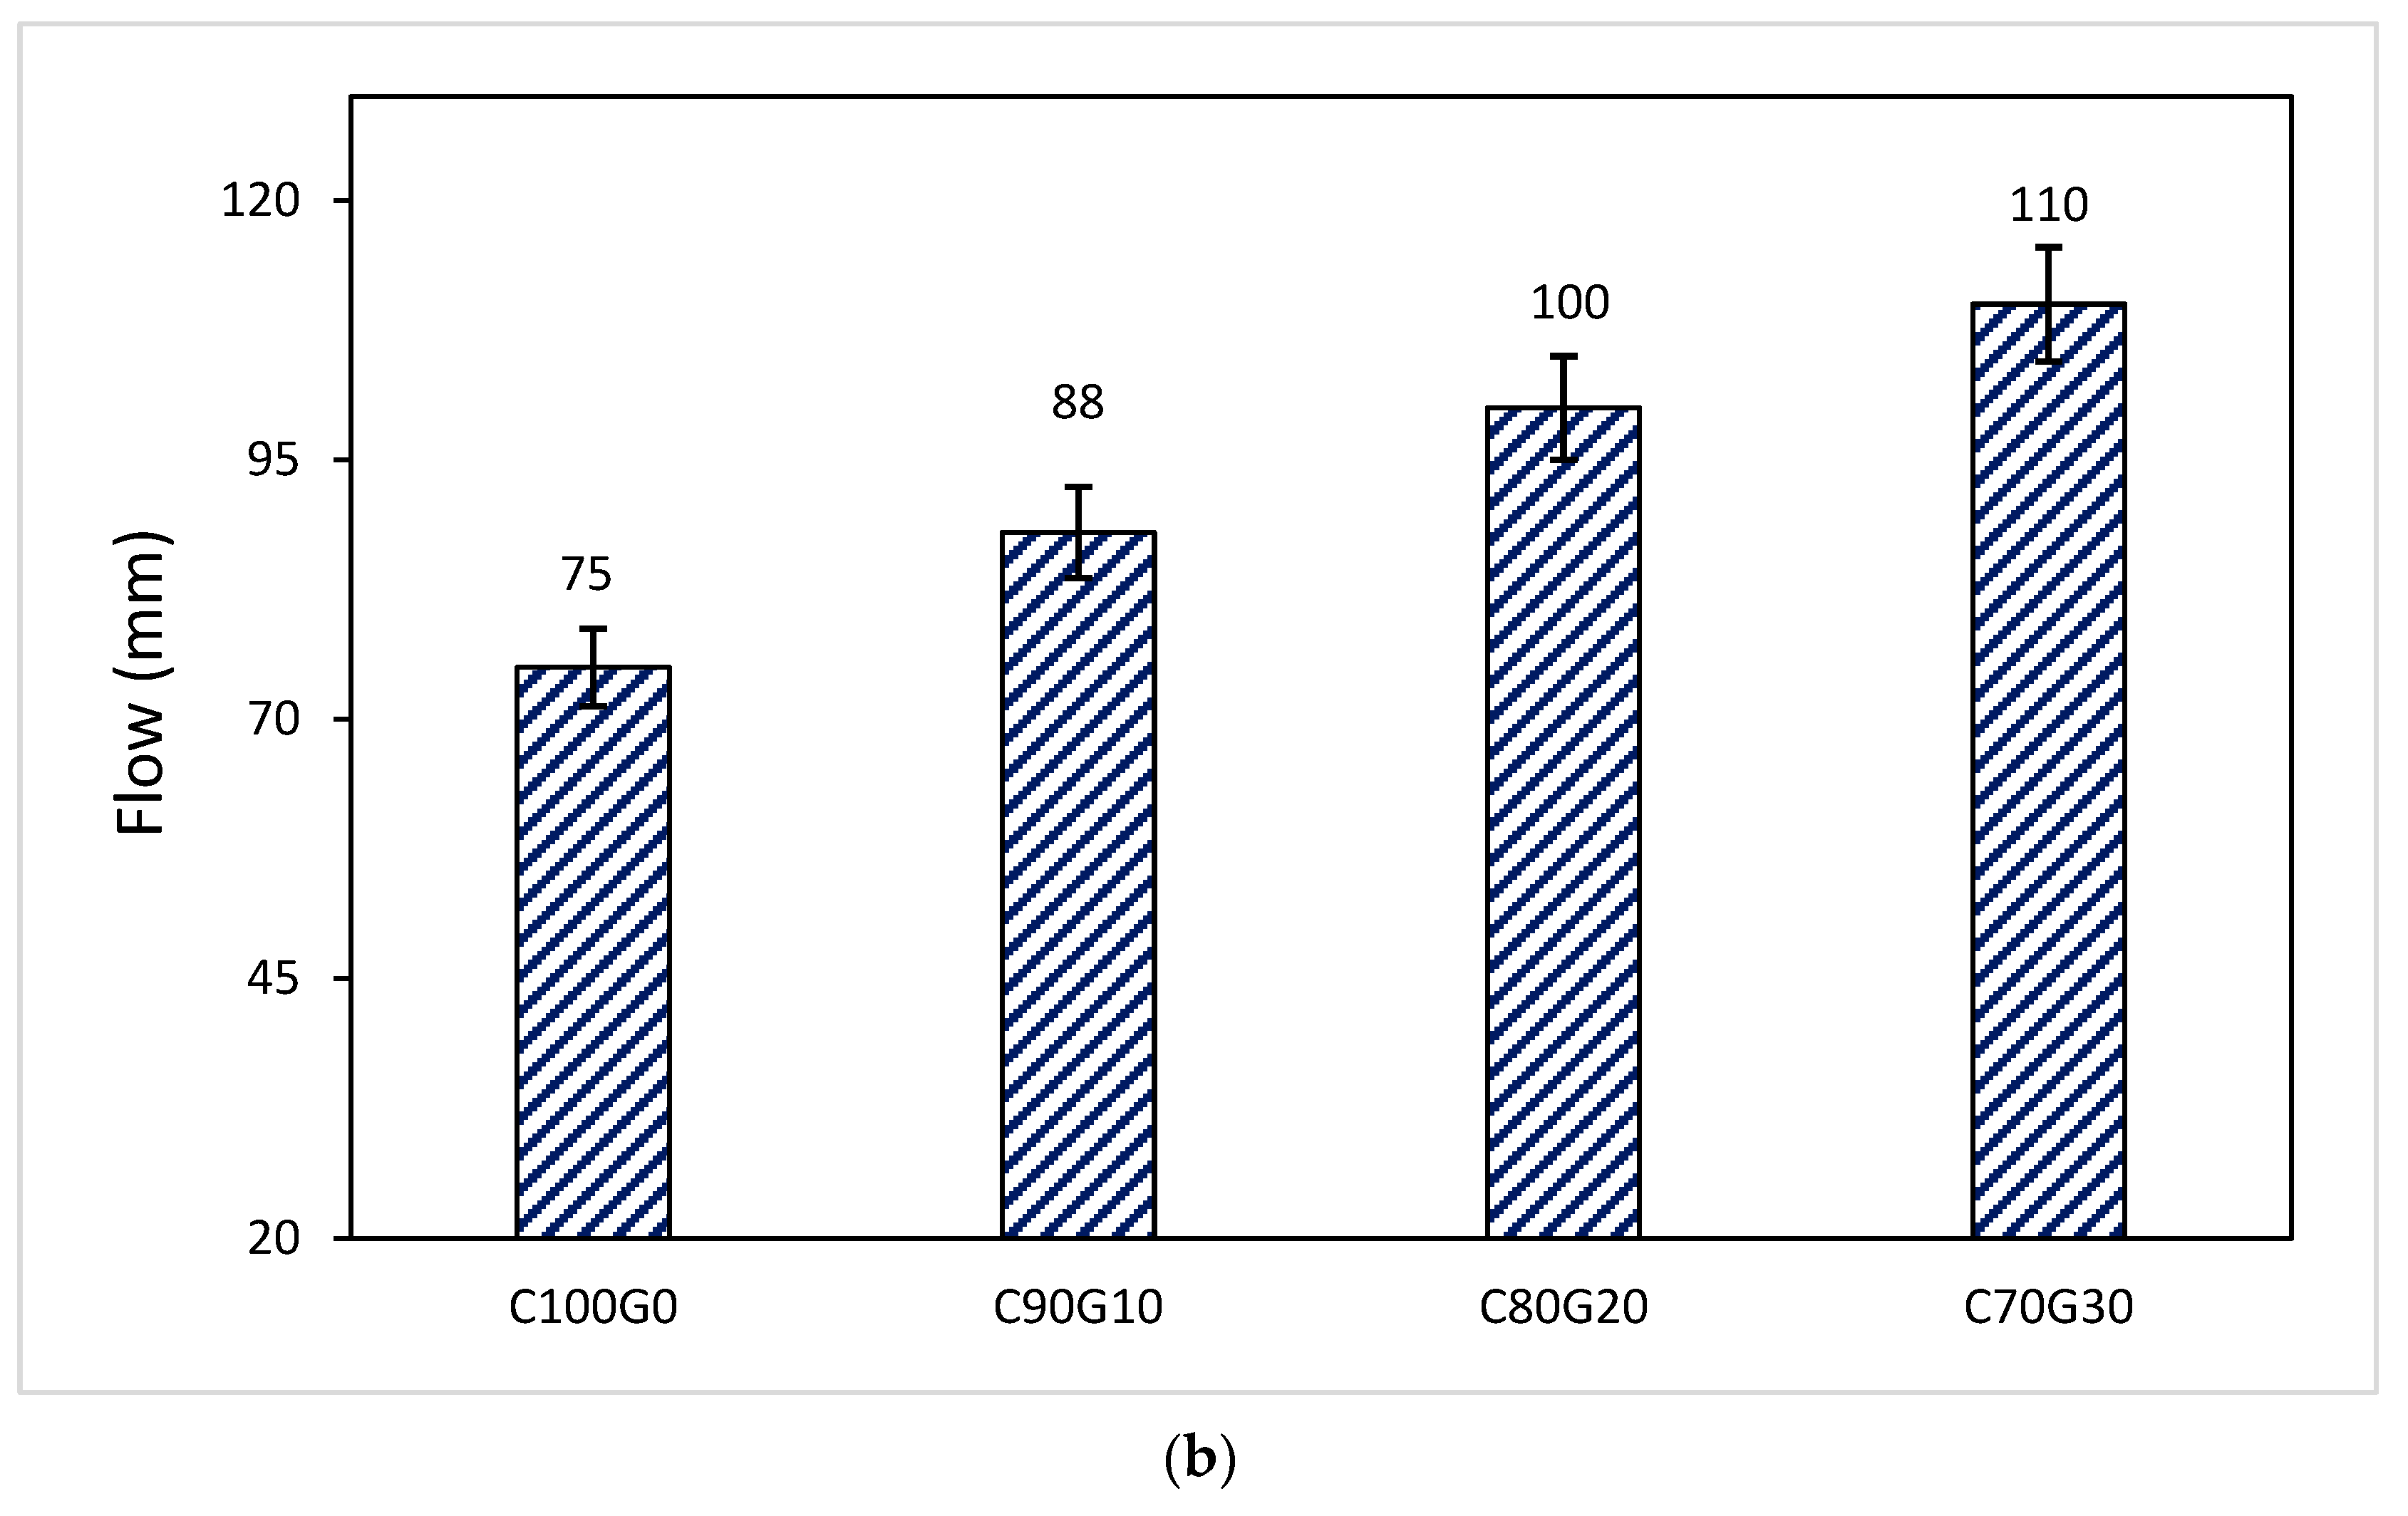
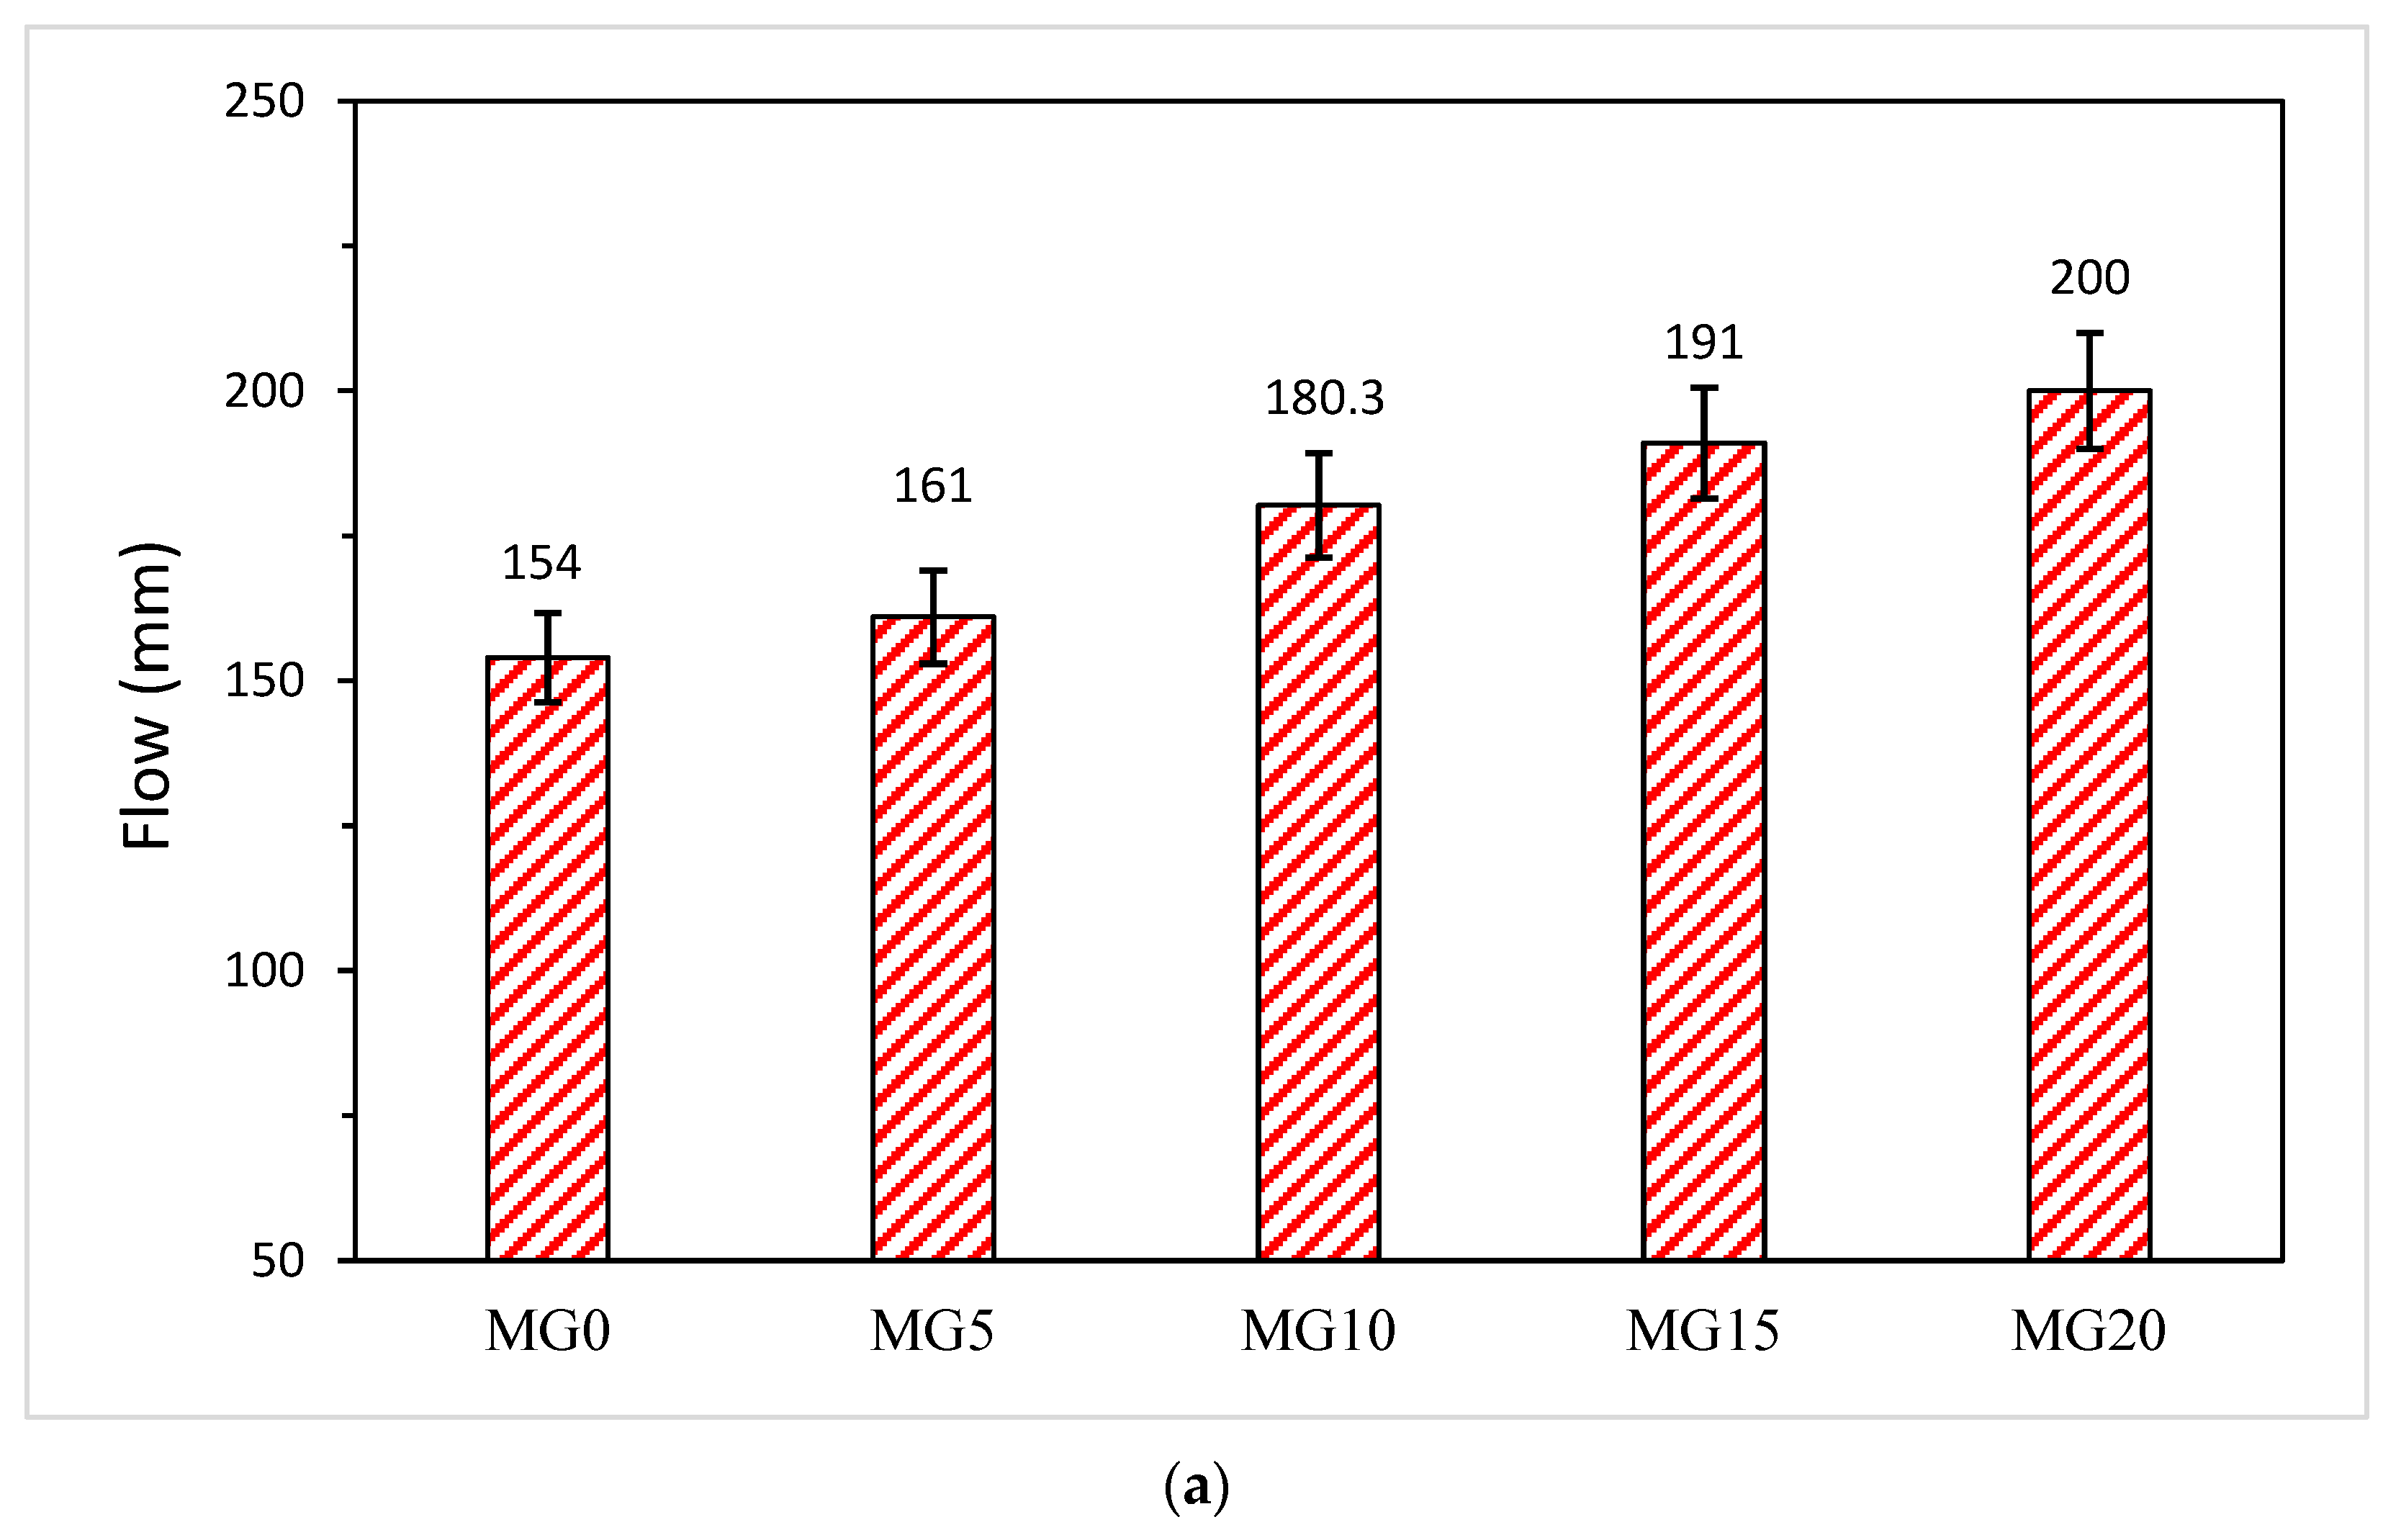
3.2. Effect of Glass on Workability of Mortar and Concrete

The consistency of mortar increases linearly with the increase in the glass–cement replacement level, as shown in Figure 5a,b. The irregular shape (Figure 3) of glass does not make a significant negative contribution to the flowability of the fresh mix due to the low intra-particle absorption of glass [13]. By replacing cement with 5, 10, 15 and 20 wt.%, the flowability of mortar increased by 4.5%, 17.1%, 24.0% and 30%, respectively. This implies that glass inclusion in mortar can facilitate the reduction of the water–cement ratio [8]. Despite the flowability or consistency of the mixture, no bleeding was observed in both mortar and concrete samples. From Figure 5b, the consistency of the fresh concrete is linearly increasing with the glass content as the slump values increase by 17.3%, 33.3% and 46.7% when the glass content was 10, 20 and 30 wt.%, respectively.

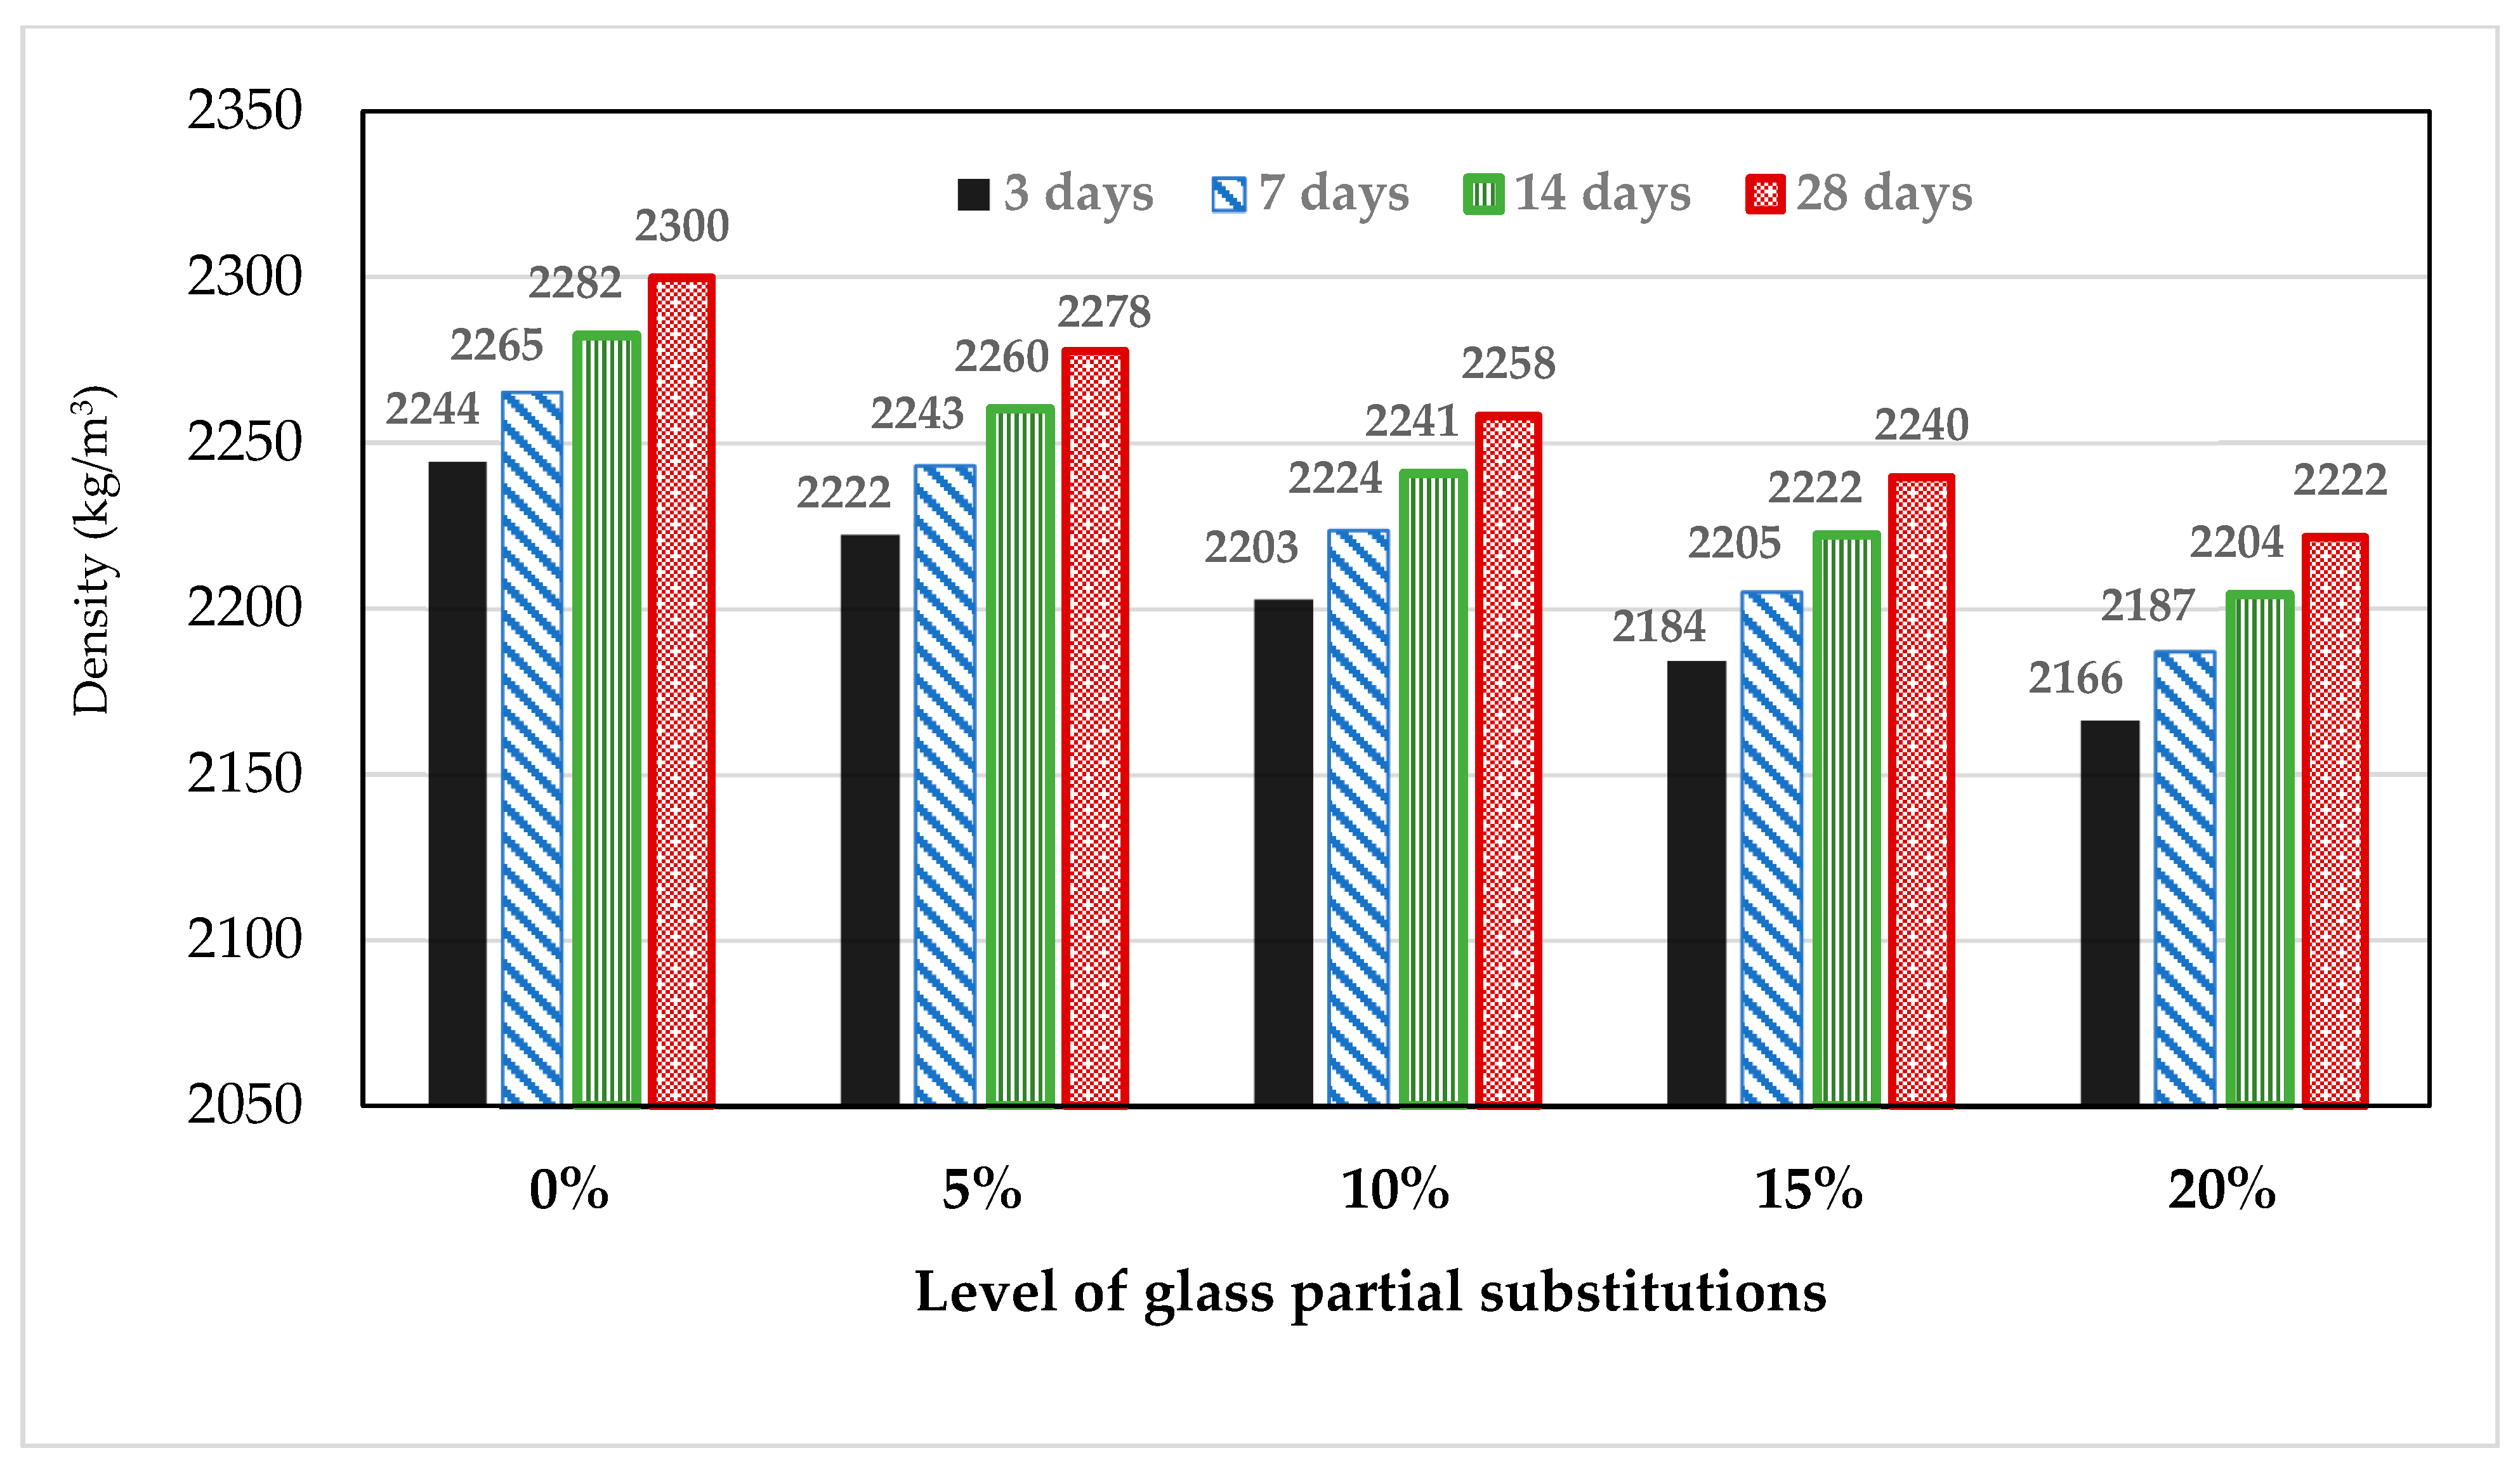
3.3. Effect of Glass on the Density of Mortar

The inclusion of glass in cement mortar causes a decrease in density with age, as shown in Figure 6. The density of mortar increases with the duration of hydration reaction. This implies that as calcium-silicate-hydrate (CSH) is being formed, it occupies some spaces within the microstructure and therefore causes a reduction in capillary pores [36]. A reduction in the capillary pore volume can lead to an increase in the internal density with time. It is also noted that the density decreased with the percentage of cement replacement by glass powder. There was 3.4% loss of density in 28 days in C80G20 (20% glass content). This value reduced to 0.95%, 1.82% and 2.6% when the glass content was 5, 10 and 15 wt.%, respectively. This is due to the higher value of specific gravity of cement (3.15) compared to that glass powder (2.48). Equation (1) was developed to express the density of the mortar in terms of cement content (C), glass content (G) and age. Figure 7 shows the relationship between the experimental and predicted densities with a correlation coefficient of 0.82 at a constant water binder ratio of 0.40.
ρ = 217.9 + 630 ( G C ) 28.1 1.274 G 0.9 + 2435.3 Age 0.01

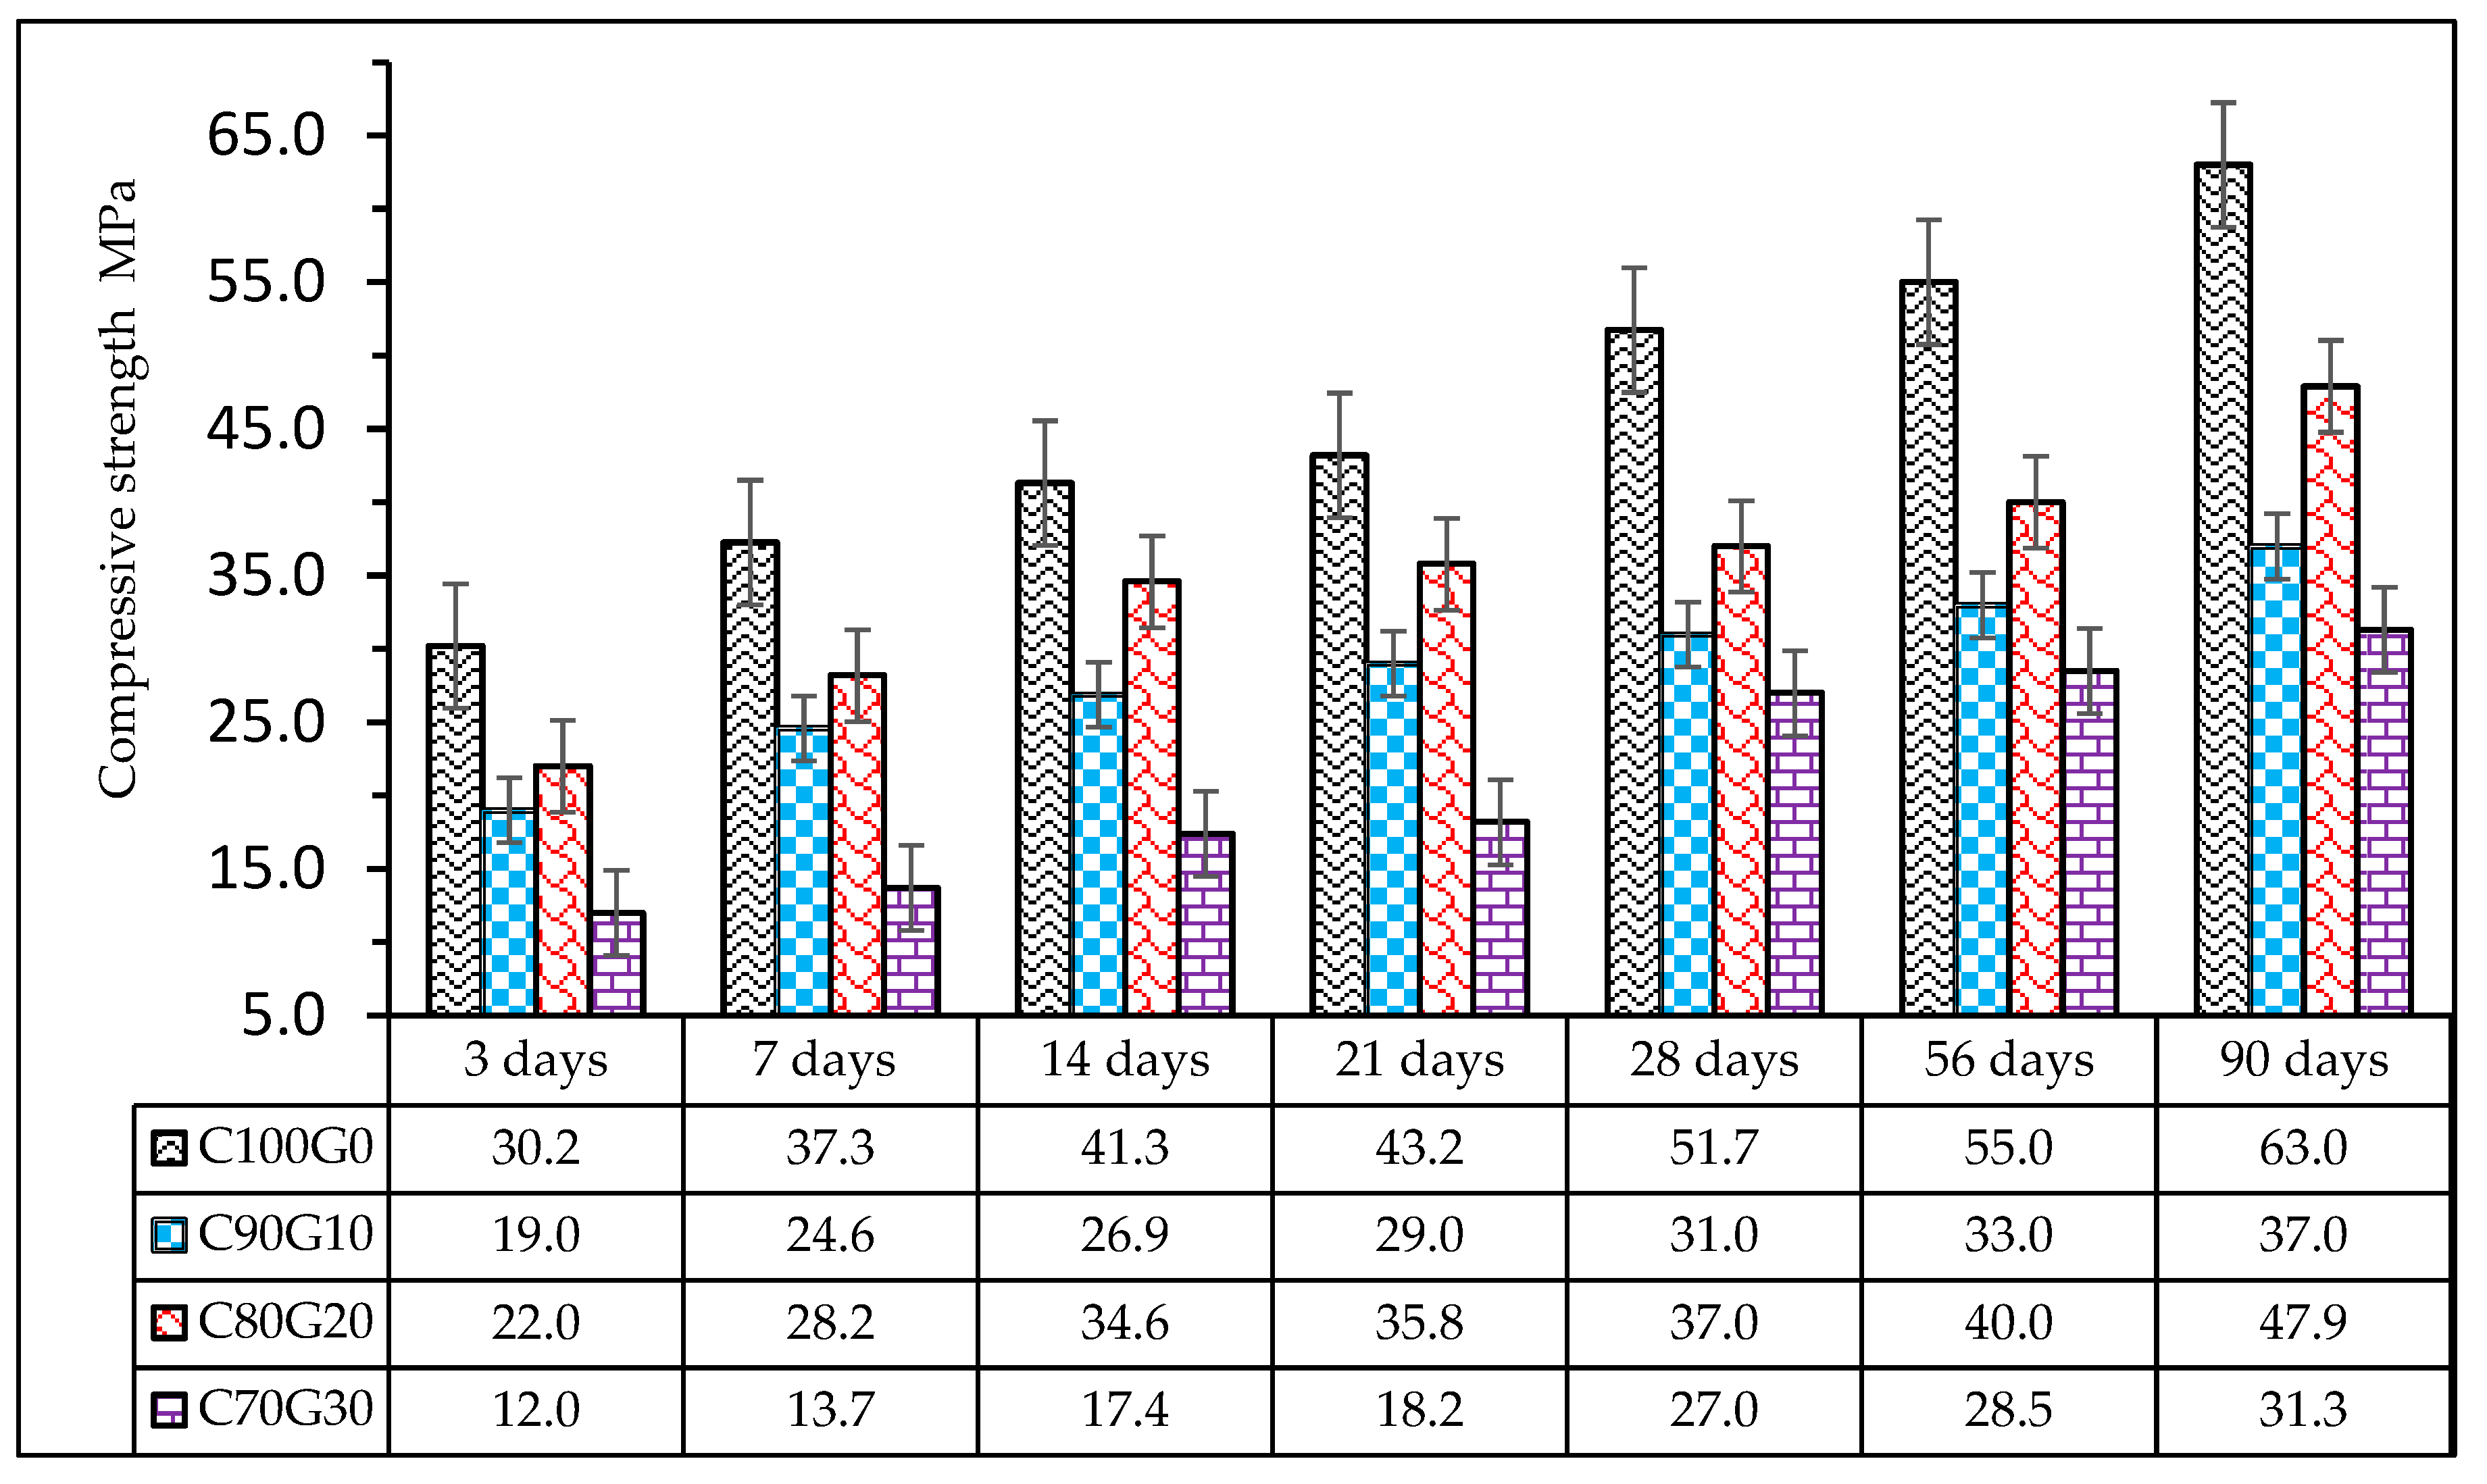
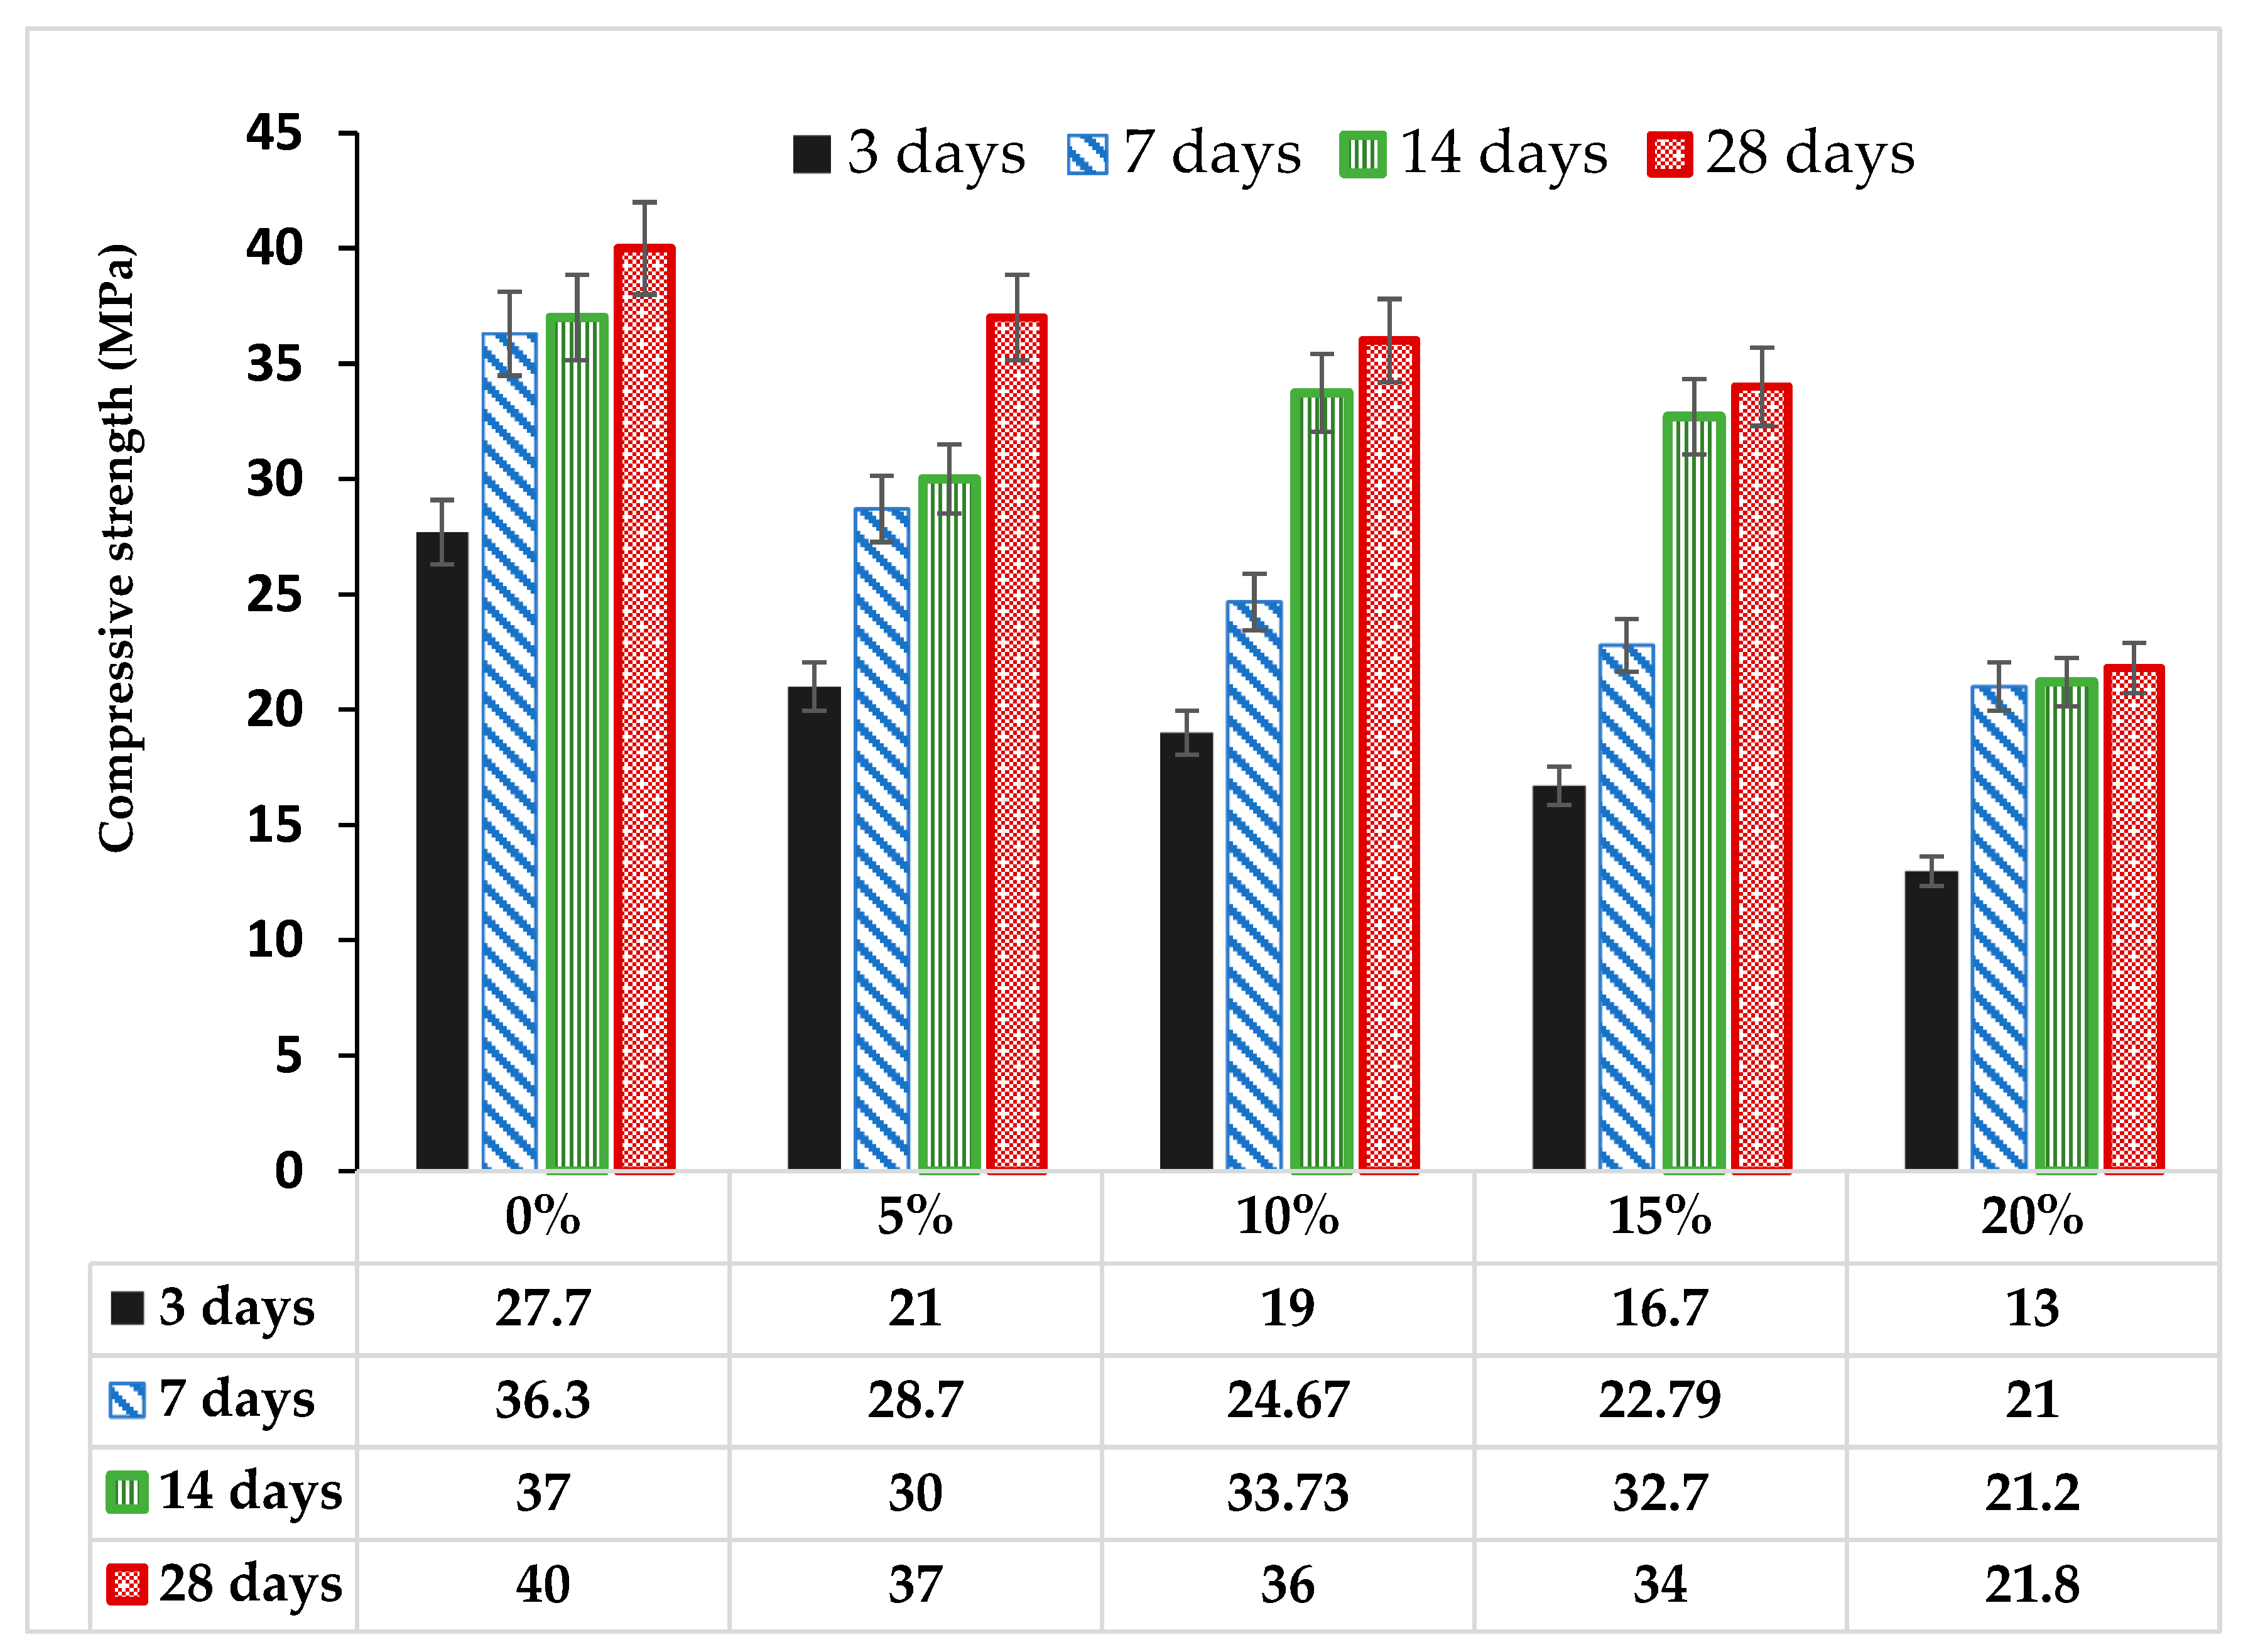
3.4. Effect of Glass on Compressive Strength of Mortar and Concrete

From Figure 8, the compressive strength of the cement–glass blended mortar can be seen to decrease with glass powder content. Glass powder affected both early and later day strength development. The 3-day strength in cement mortar decreased by 24.2%, 31.4%, 39.71% and 53.1% in the mortars MG5, MG10, MG15 and MG20, respectively. The maximum 28-day compressive strength obtained at zero inclusion of glass in mortar was 40 MPa and reduced by 7.5%, 10%, 15% and 45.5% for glass–cement replacement levels of 5%, 10%, 15% and 20%, respectively. Highest strength development (43.5%) was noticed between 7 to 14 days in MG15 and then followed by 36.7% in MG10 with just 5% in MG15. There was no significant strength development from 14 to 28 days in the glass blended mortar sample except in MG5, where the maximum development (23.3%) was achieved. The optimum glass dosage for cement replacement was between 5 to 10 wt.% (by weight of the total binder).
Compressive strength in mortar is modeled as shown in Equation (2) with a correlation coefficient of 0.88, as shown in Figure 9. The compressive strength depends on the cement content (C), glass content (G) and age of the mortar.
f c m o r t a r = 1248.3 + 790.15 C 0.0106 5.7 × 10 33 G 12.44 + 150.63 Age 0.04
From Figure 10, the compressive strength of concrete increases with days of maturity. Concrete sample C80G20 has the best strength characteristics, and its maximum 3-day early strength was 22 MPa, which was 27.2% of the achievable strength in C100G0 (glass-free). This decreased to 37.2% and 60.3% in C90G10 and C70G30, respectively. The strength development increased linearly with a 90-day strength of 63 MPa in C100G0 and 47 MPa in C80G20 (20% glass). The strength achieved in this sample could be regarded as high-strength concrete. As the glass contents of 10 wt.% (C90G10) and 30 wt.% (C70G30) were added, the strength reduced by 22.8% and 34.7%, respectively.
The rate of strength development in C70G30 is higher (48.3 wt.%) between 21–28 days in comparison with 56–90 days, where 9.2% only was achieved. Similarly, C80G20 developed 3.35% between 21–28 days, whereas the development was 19.75% between 56–90 days. This implies that there were significant pozzolanic reactions in glass blended concrete at a later time beyond 56 days. Therefore, we can conclude that glass present in OPC concrete underwent a delayed pozzolanic reaction, thereby corroborating the hydration of belite (C2S).
The model predicting the concrete strength in concrete is given in Equation (3) with a correlation coefficient of 0.85, as shown in Figure 11. The model is developed to predict compressive strength at 3, 7, 14, 28, 56 and 90 days for varying glass/cement ratios (G/C) and ages at a constant water/binder ratio of 0.42.
f c _ c o n c r e t e = 0.3 24.22 ( G / C ) 0.282 + 29 Age 0.153

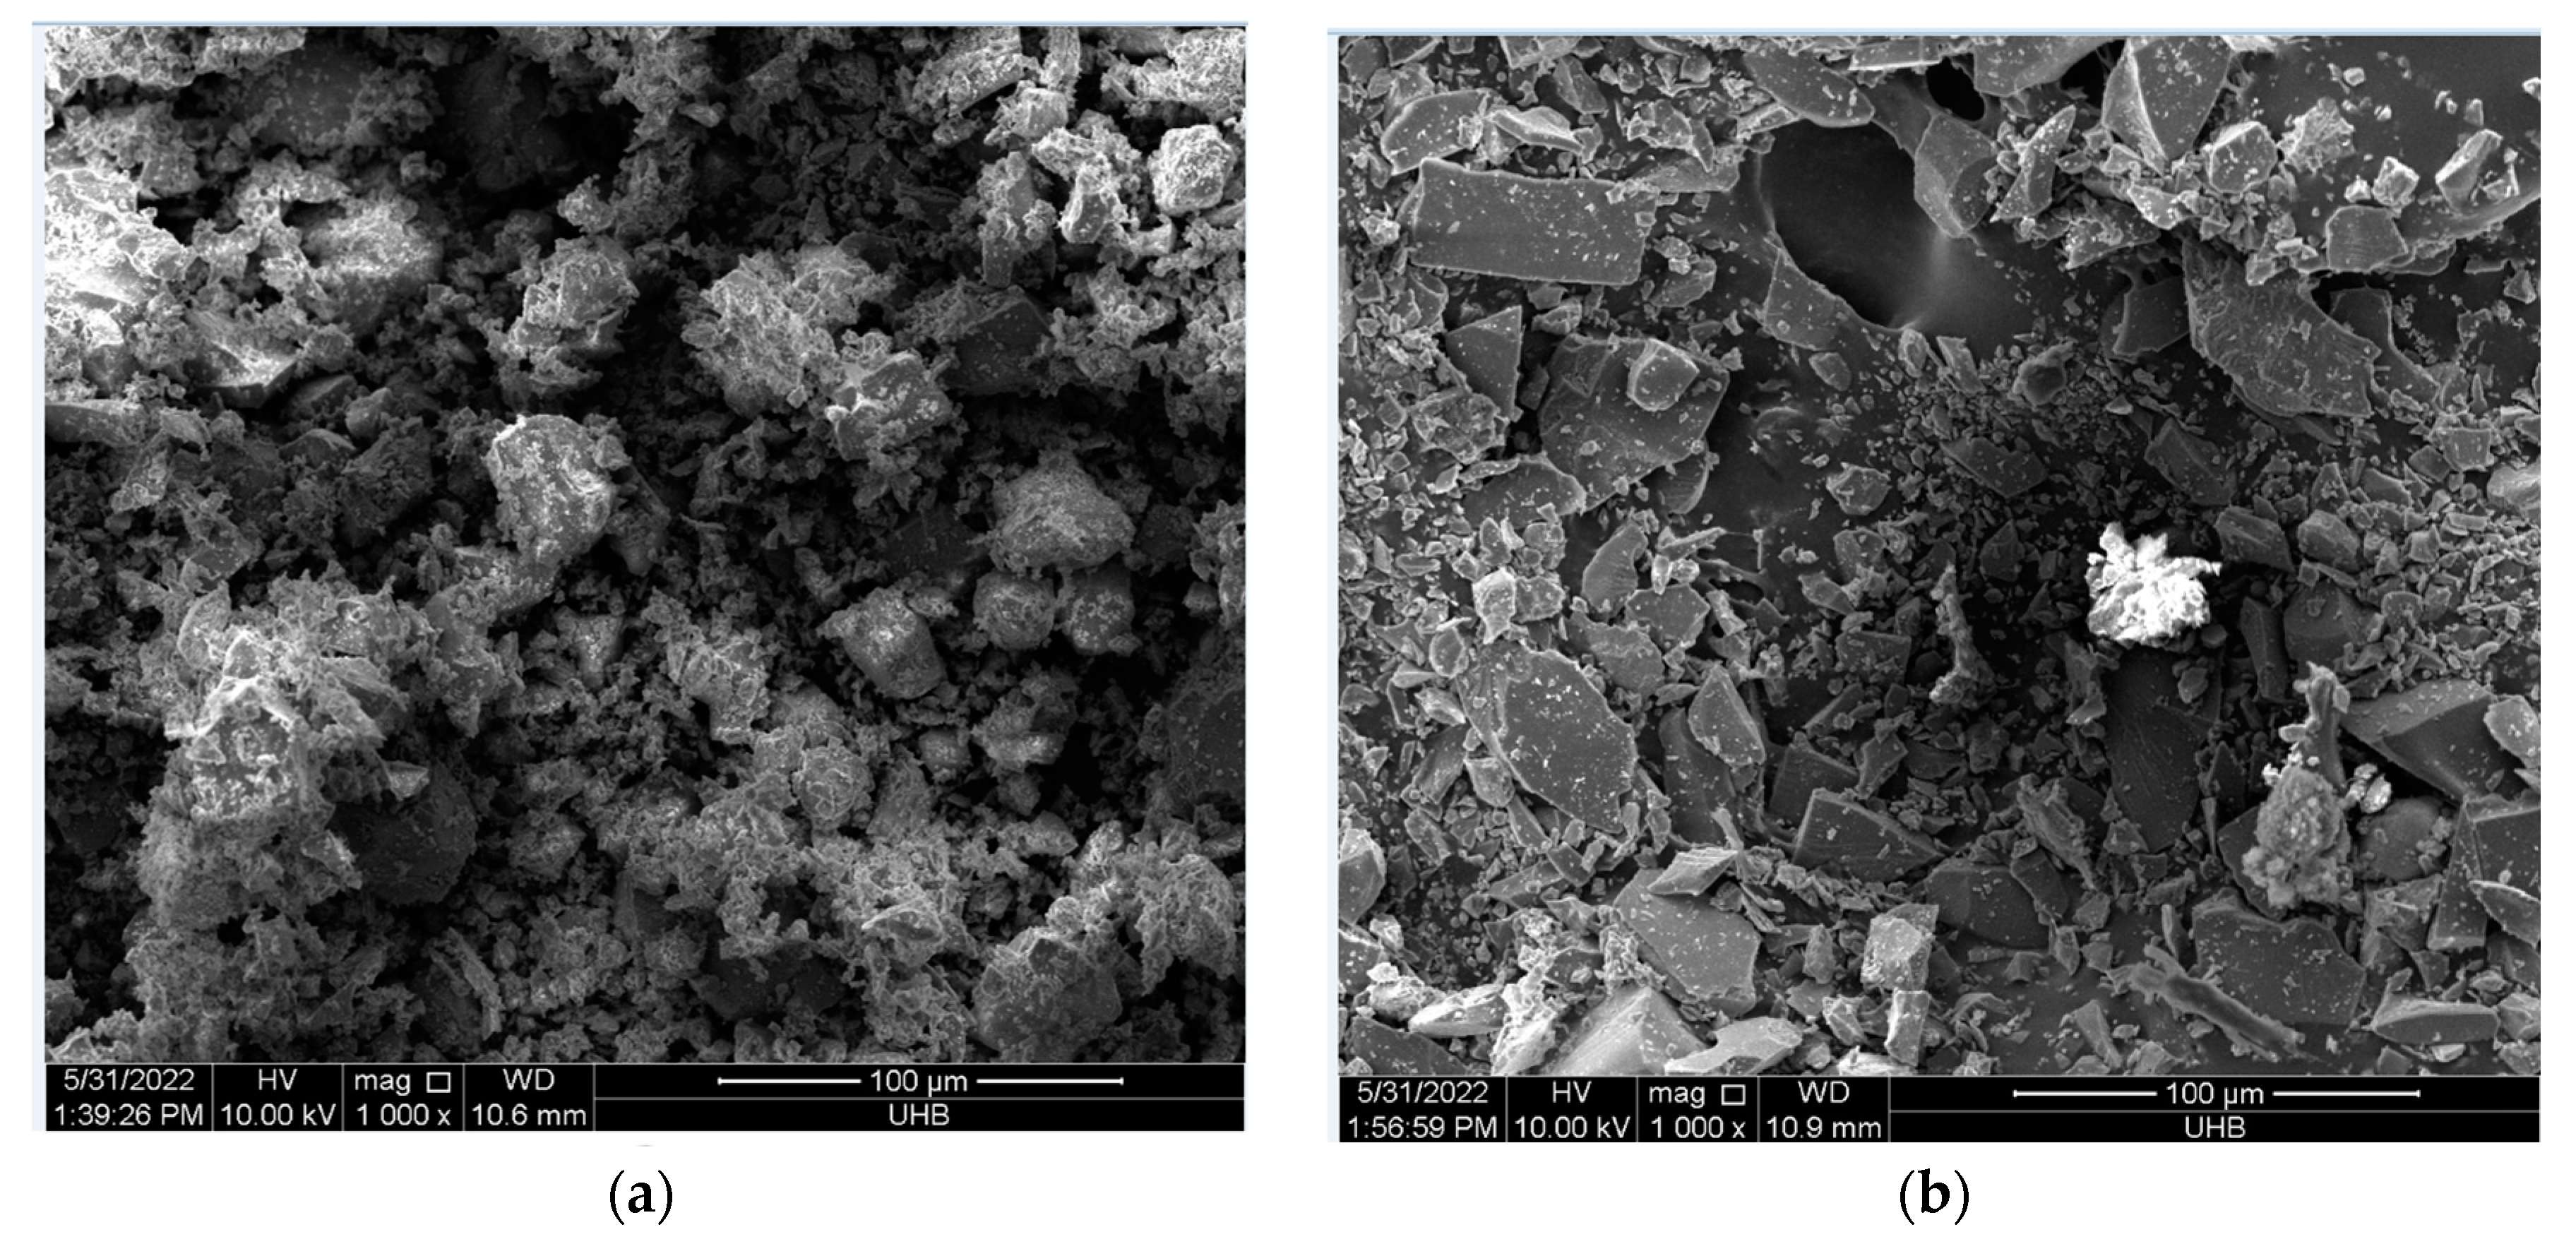
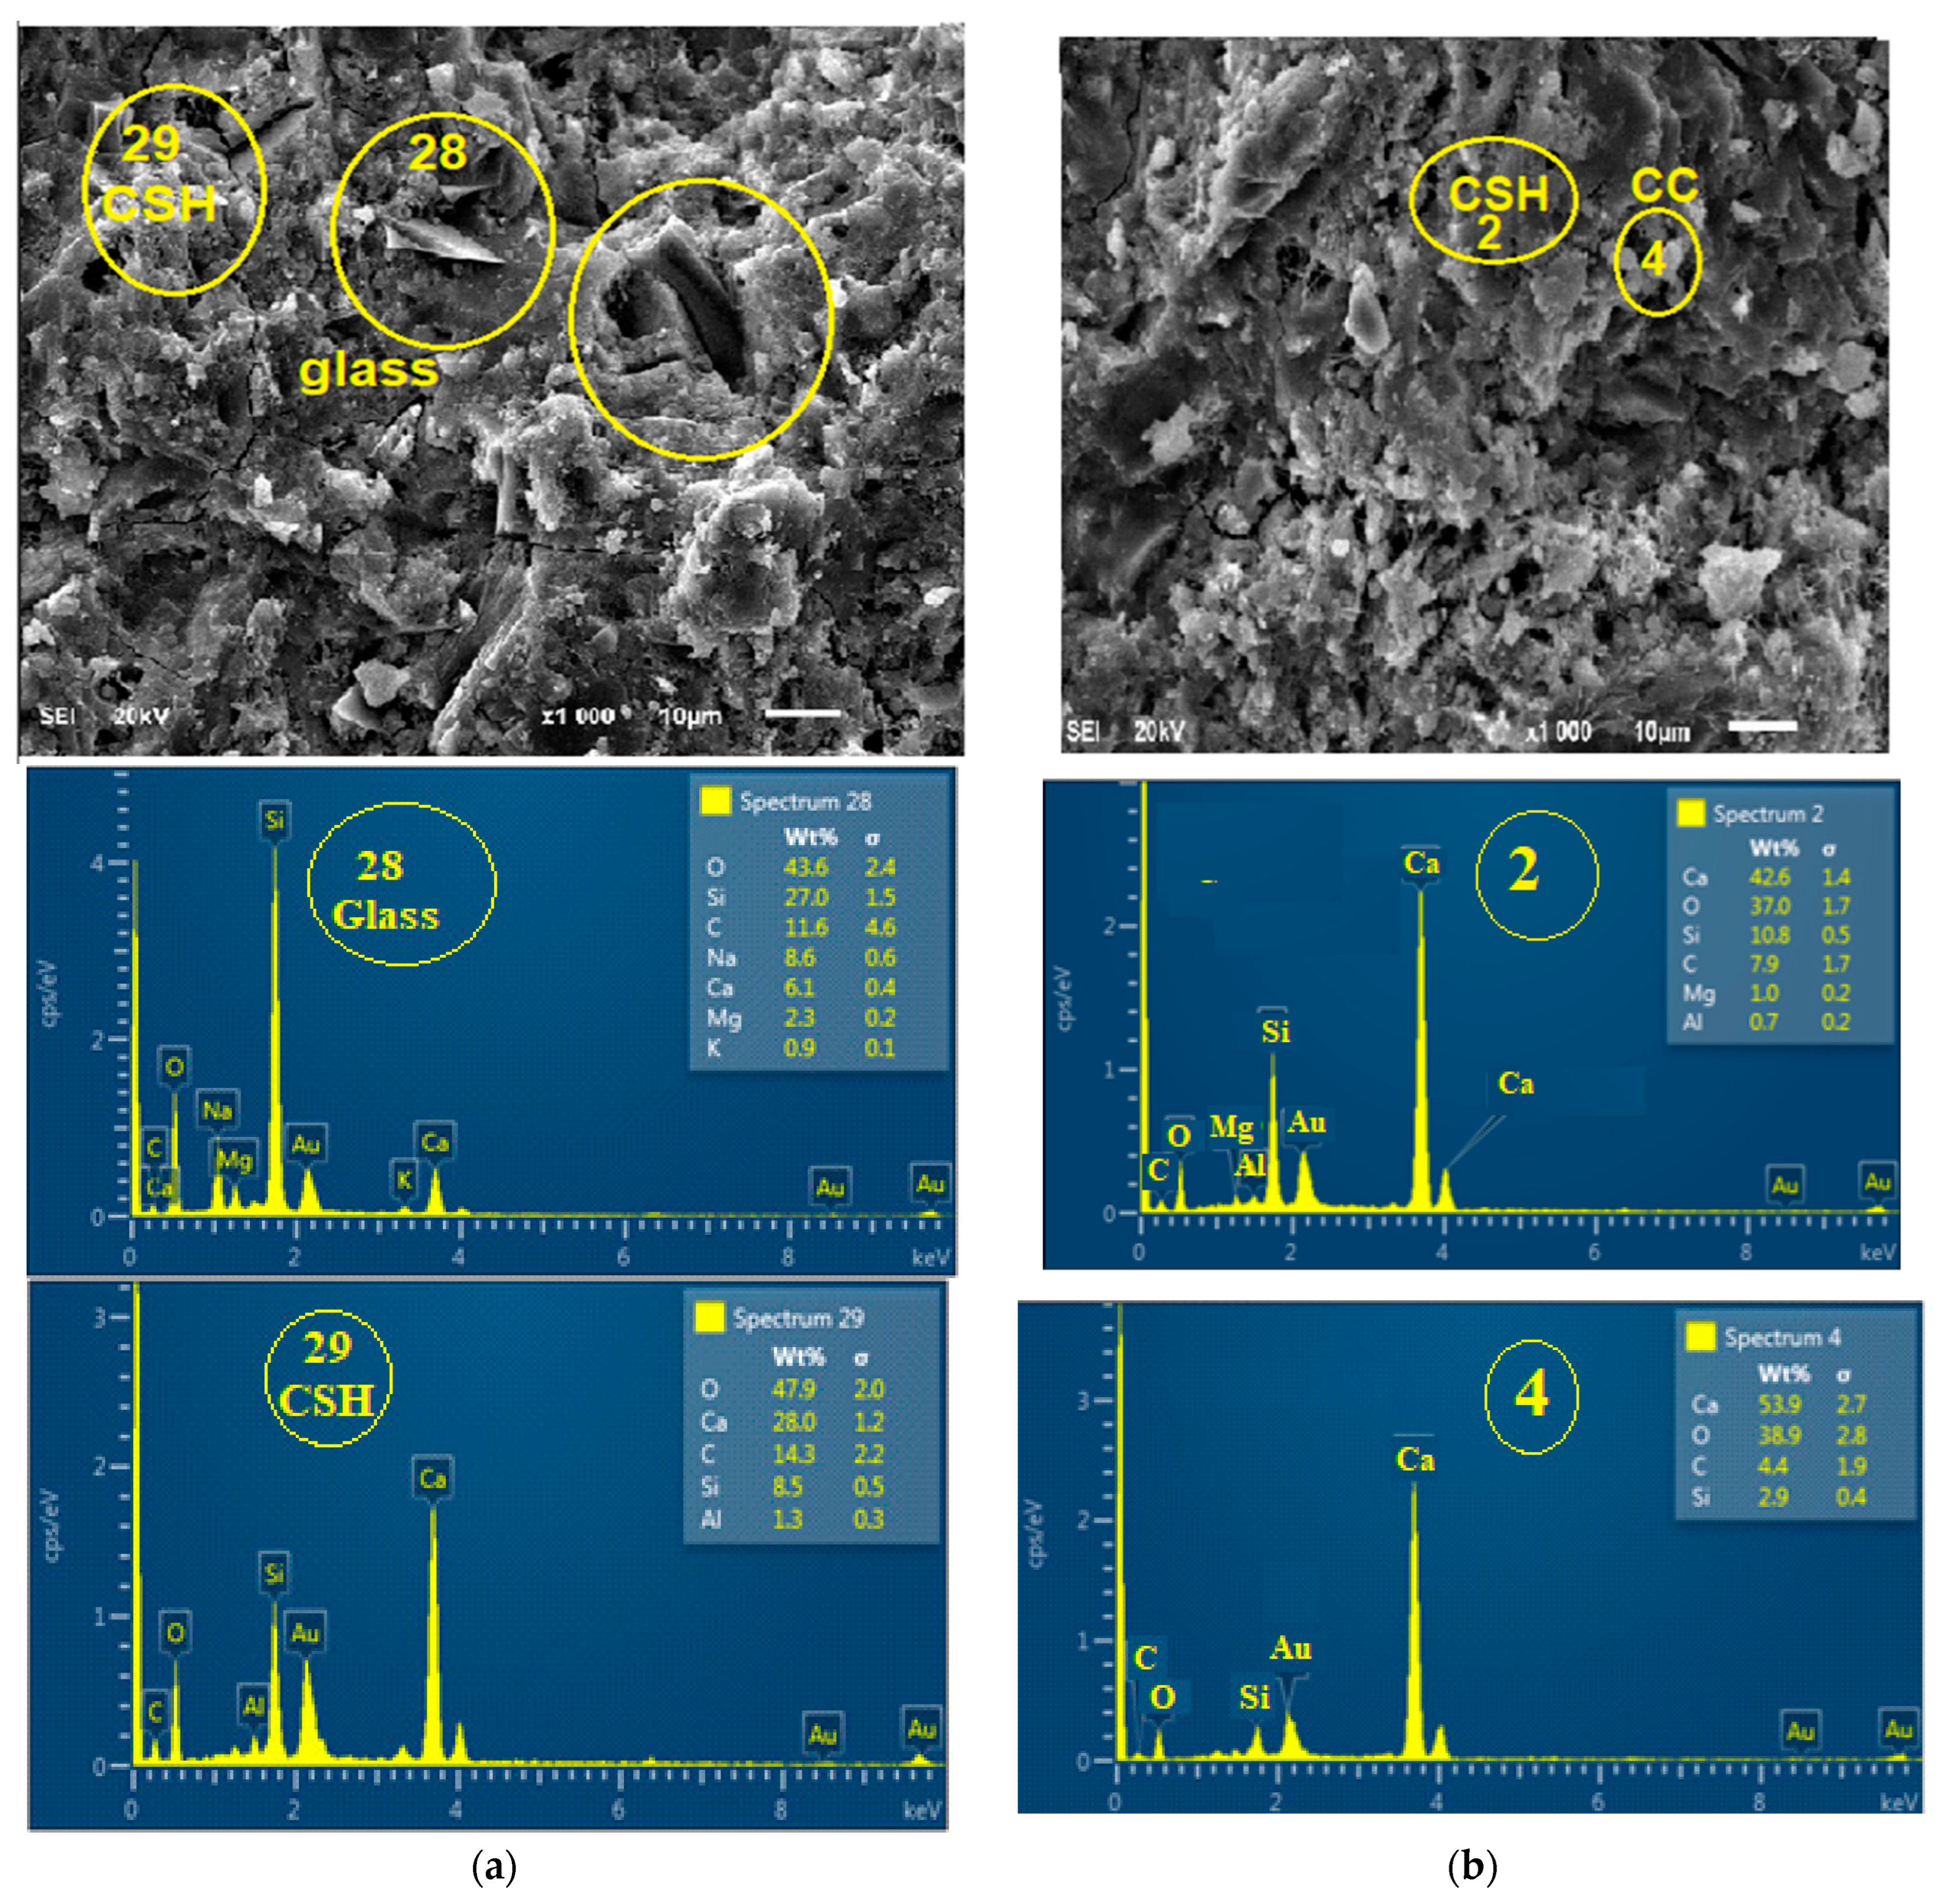
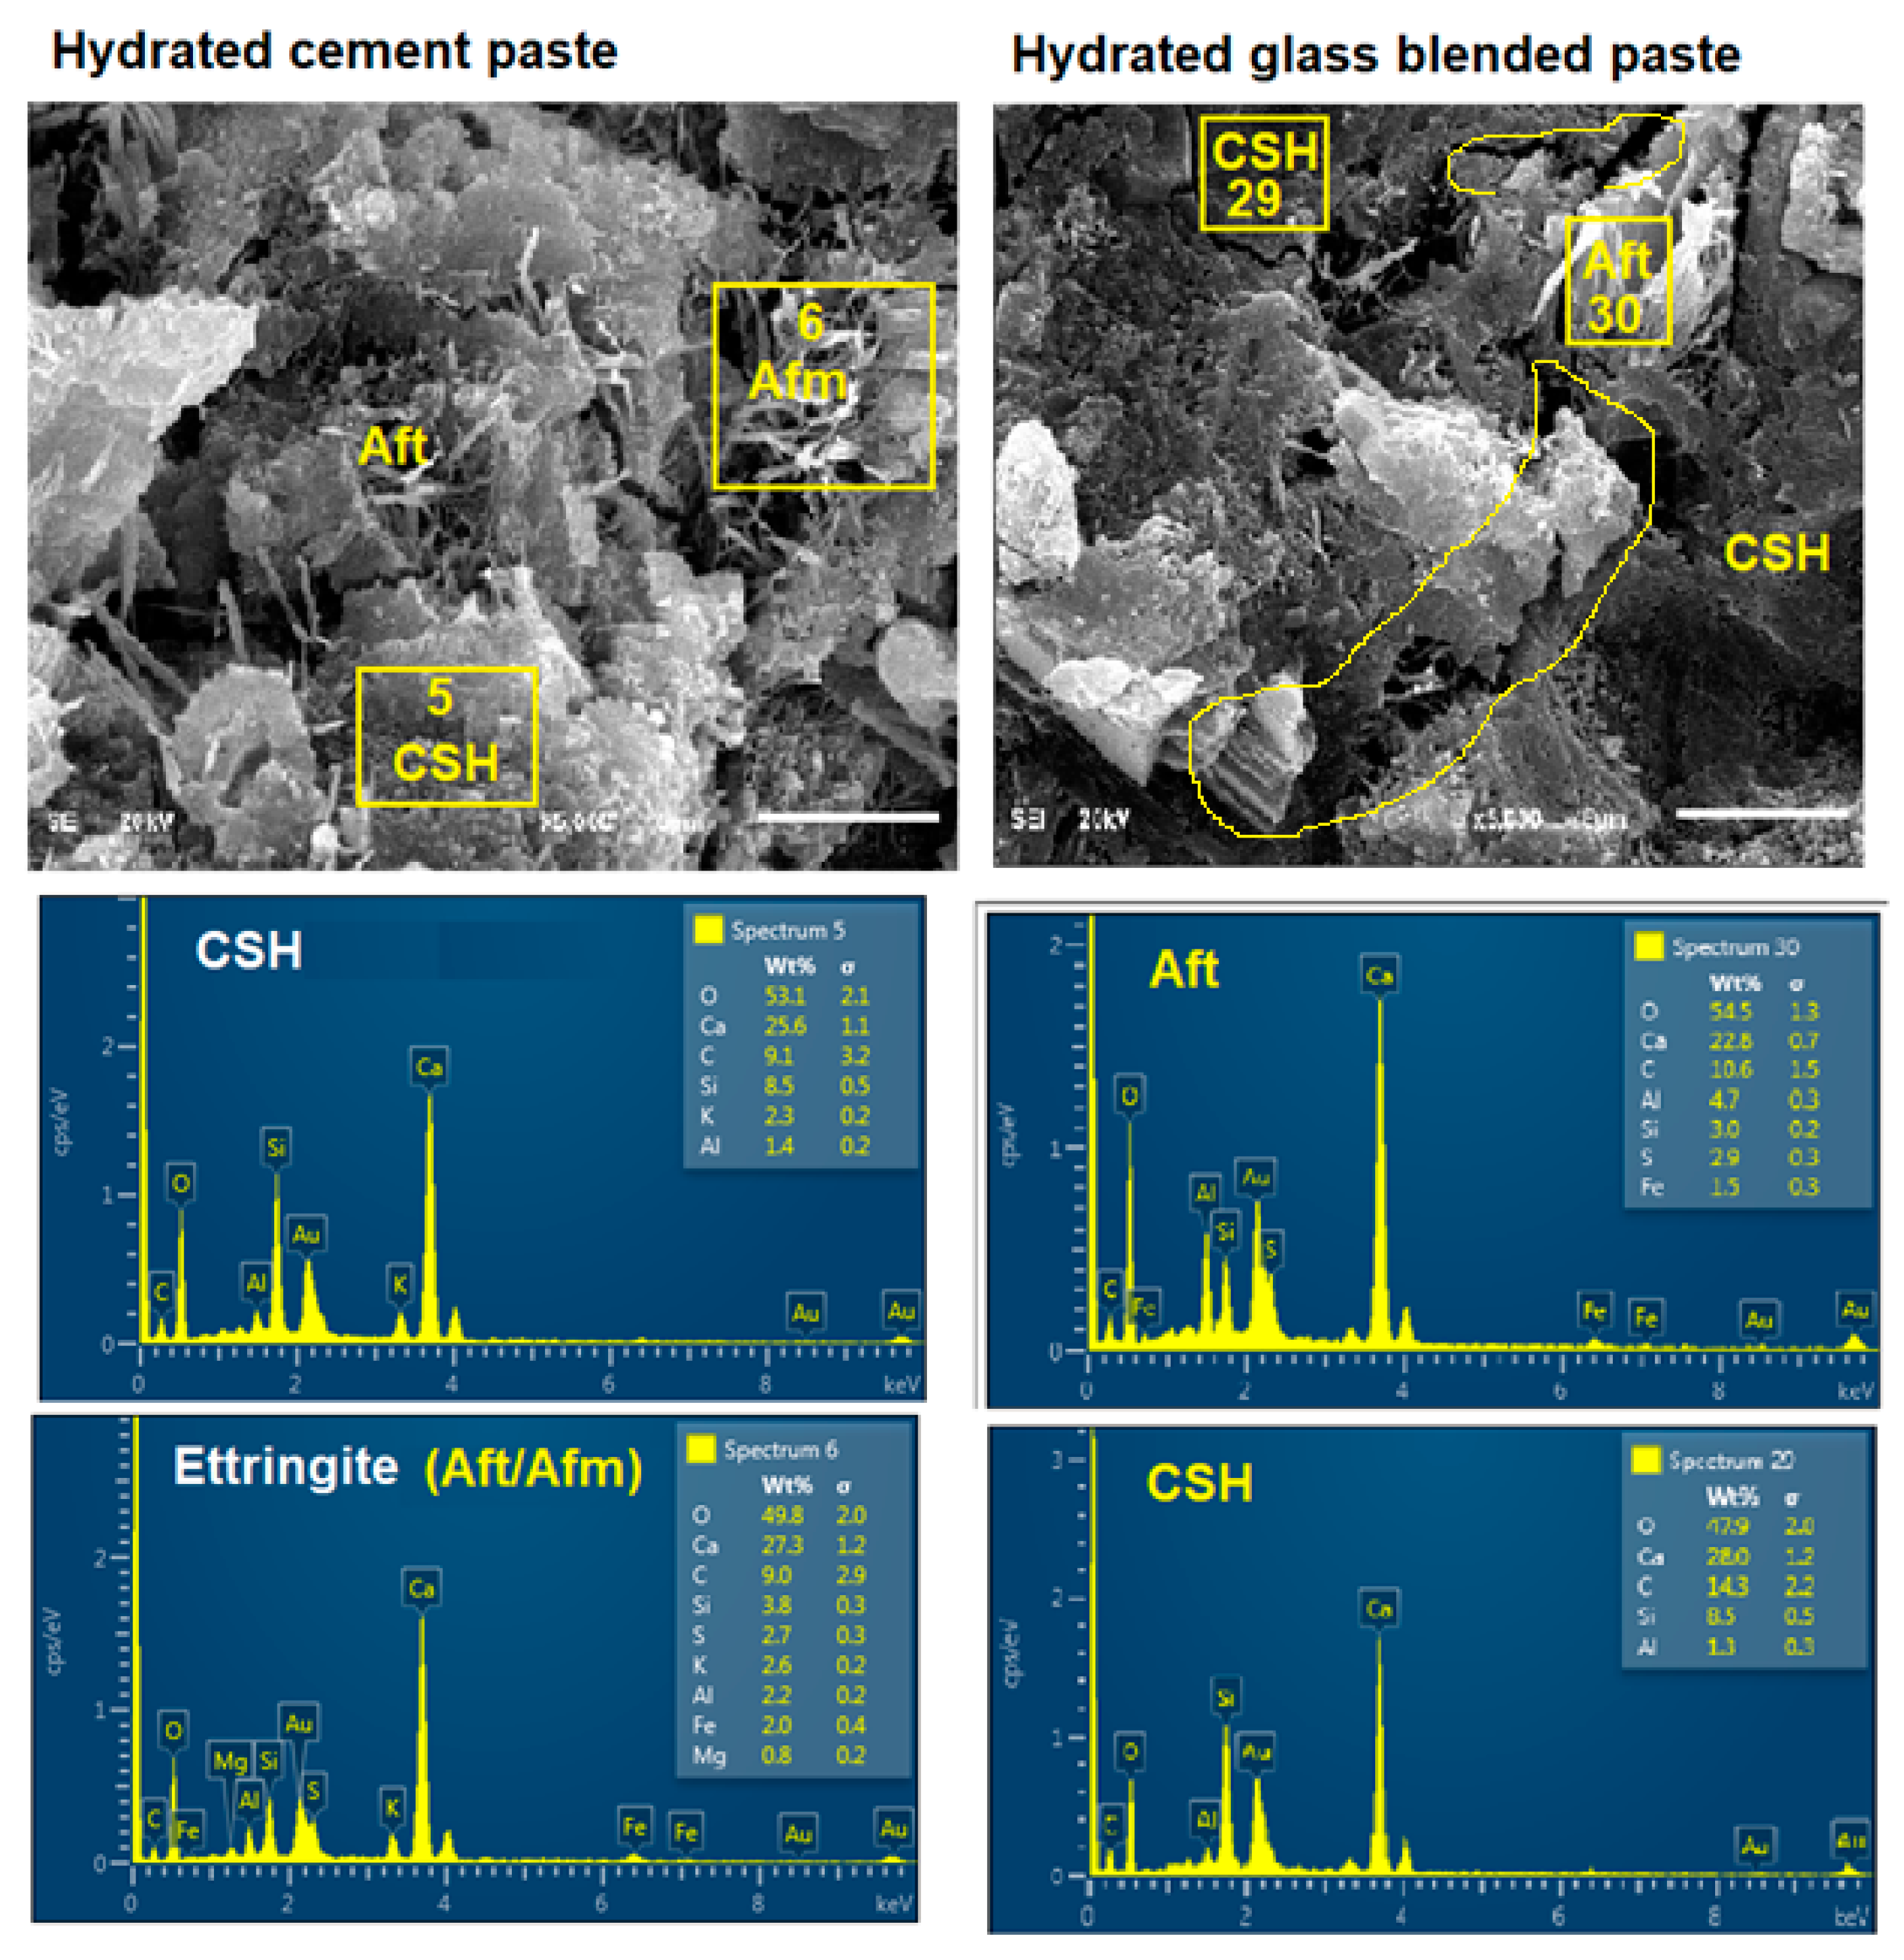
3.5. Effect of Glass on the Morphology of the Binder

The decrease in the observable strength can be understood from the morphology of the glass blended paste from the scanning electron microscope/energy dispersive electron spectroscopy (SEM/EDS) results, as shown in Figure 12a,b and Figure 13. There is a discontinuity (spectrum 28, Figure 12a) in the region of embedment of glass within the cement matrix.
This discontinuity created an interfacial transition zone (ITZ), which is the weakest point owing to its higher water/cement ratio than other areas within the matrix [37]. Therefore, there could be an initiation of microcracks from the ITZ during the application of loading during the compressive strength test. Karen Zheng [21] reported that there is a pozzolanic reaction in ITZ due to the deposition of more Ca2+ at glass boundaries. Thus, EDS shows that Ca/Si of OPC hydrated (C100G0) (Figure 12b) and glass blended pastes (C90G10) (Figure 12a). were 3.94 and 0.23, respectively. The presence of glass particles also caused dilution, which has a significant effect on the early strength development (Figure 8 and Figure 10) and also reduced the formation of Afm when compared to its absence in glass blended paste (Figure 13).
Similarly, there is non-uniformity and microstructural disintegration (cracks) of cement paste due to glass incorporation and more especially at the region of Aft formation in the SEM/EDS (Figure 12) [38]. Aft is formed by the interaction of C3A with gypsum (G) during the setting process. Therefore, the non-spherical shape of glass powder could be responsible for the microstructural discontinuity in the ITZ, thereby reducing the resultant strength. Both Aft and the proliferation of ITZ are clearly shown in Figure 13.

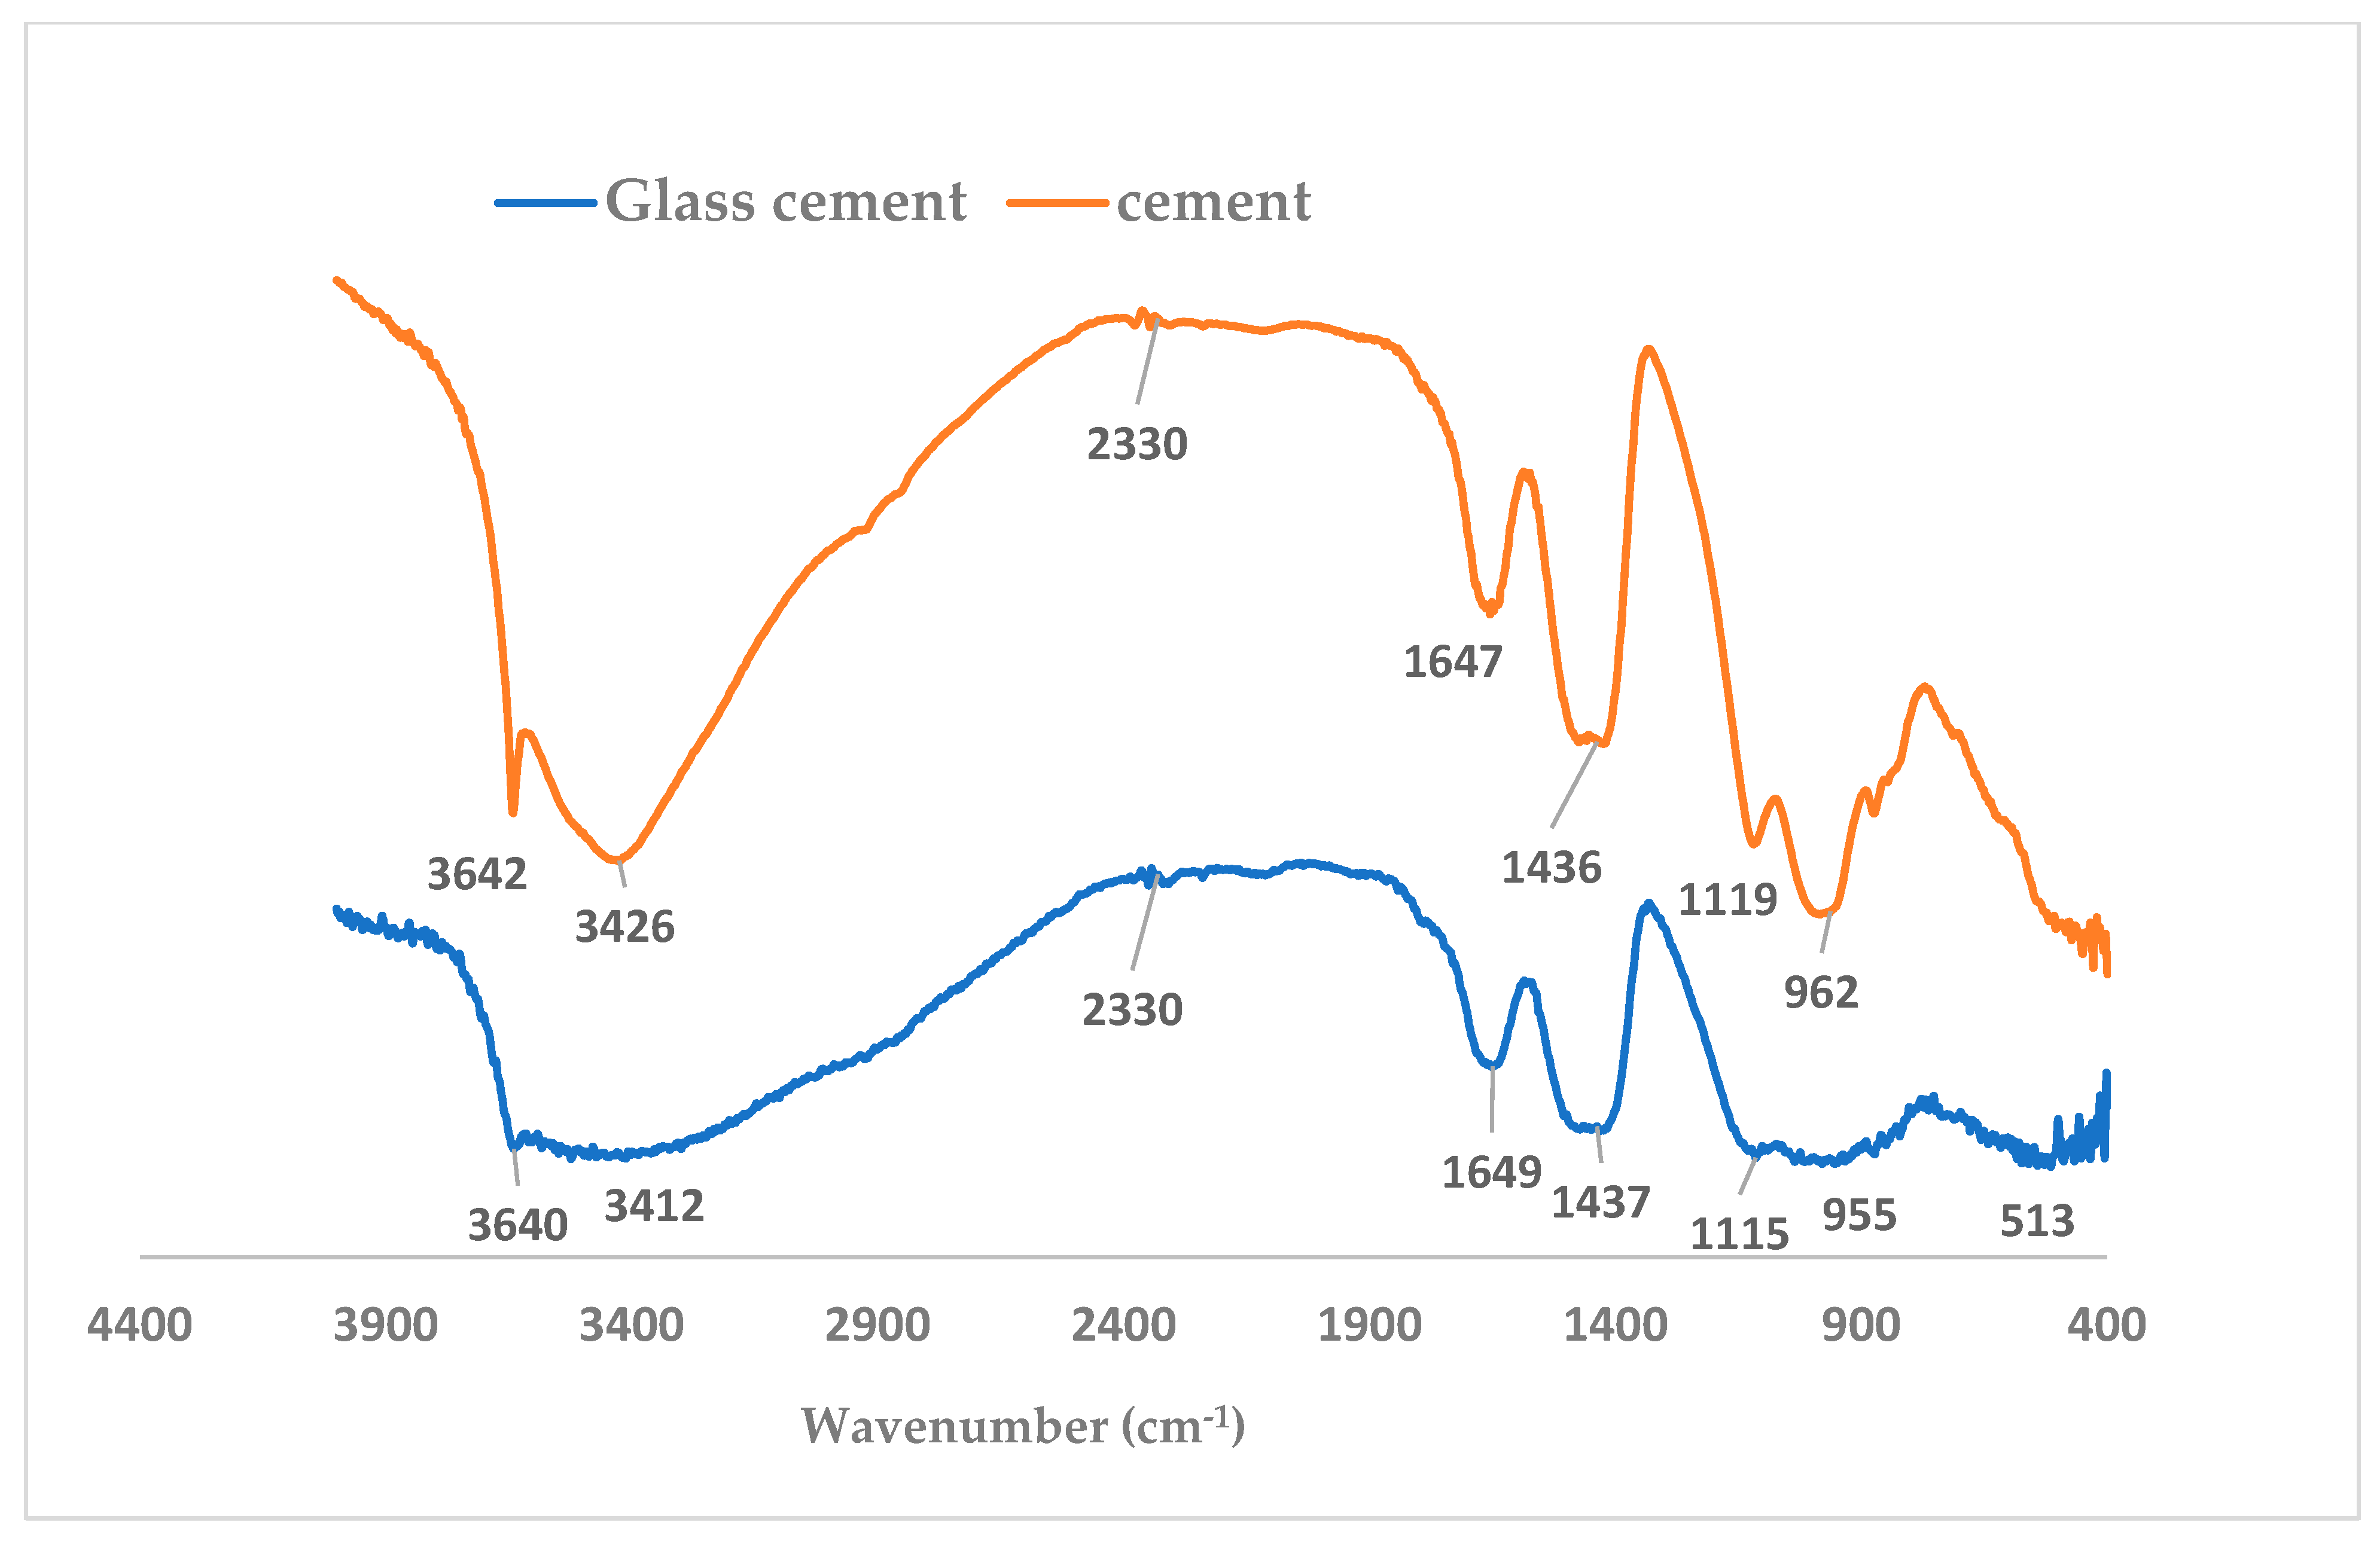
3.6. Effect of Glass on Hydroxyl Ion, C=O, Water Molecule Vibrations and Silica Reorganization of the Binder

FTIR spectra (Figure 14) show the asymmetric stretching of hydroxyl ions with strong absorption at wavenumber 3642 cm−1 in cement paste, whereas the band was weaker with the wavenumber 3640 cm−1 in the glass blended sample [39]. This also indicates that the early hydration reaction is hindered by the presence of glass particles due to the lower production of hydroxyl-based compound (portlandite).
In addition, the polymerization of the silica structure is greater in cement mortar with a wavenumber of 962 cm−1 with a strong peak in comparison with the broad peak and lower vibration frequency (955 cm−1) that was observed in glass blended paste (Figure 14). These peaks have been described to be due to Si-O stretching vibrations within the silicate structure.
The C=O vibration (CO3) is noticed to be less prominent in the glass–cement binder compared to OPC binder with a stronger peak at 2330 cm−1 [39]. The strong peaks of the asymmetric stretching C-O vibration (CO2) at 1436 cm−1 in C100G0 become broad in C80G20. Therefore, a decrease in the vibration of CO2 coupled with the reduced formation of portlandite and a lower Ca/Si ratio could be responsible for less carbonation in glass blended concrete. This stretching band of S-O (-SO42−) related compound (ettringite-Aft/Afm) at 1119 cm−1 is noted to be stronger in hydrated cement (C100G0) [40] compared to the lower frequency at wavenumber 1115 cm−1 in the glass blended binder (C80G20) [39]. In light of this, the presence of glass in cement mortar could mitigate against sulfate attack, as reported by Carsana et al. [41]. However, this could require further investigation. Even though the out-of-plane bending mode is absent in glass base mortar in FTIR spectra (Figure 11), the presence of carbon (C) in the EDS together with the presence of calcite at the same 2-theta angle suggests the possibility of Equation (4) in both systems:
Ca ( OH ) 2 + CO 2 CaCO 3 + H 2 O
There was a presence of water molecules in the capillary and gel pore as indicated at higher vibration frequency with wavenumbers of 3426 cm−1 and 1647 cm−1 in C100G0. The same vibration was noticed at 3412 cm−1 with a broader but shallow peak at 1649 cm−1 in C80G20 [42].

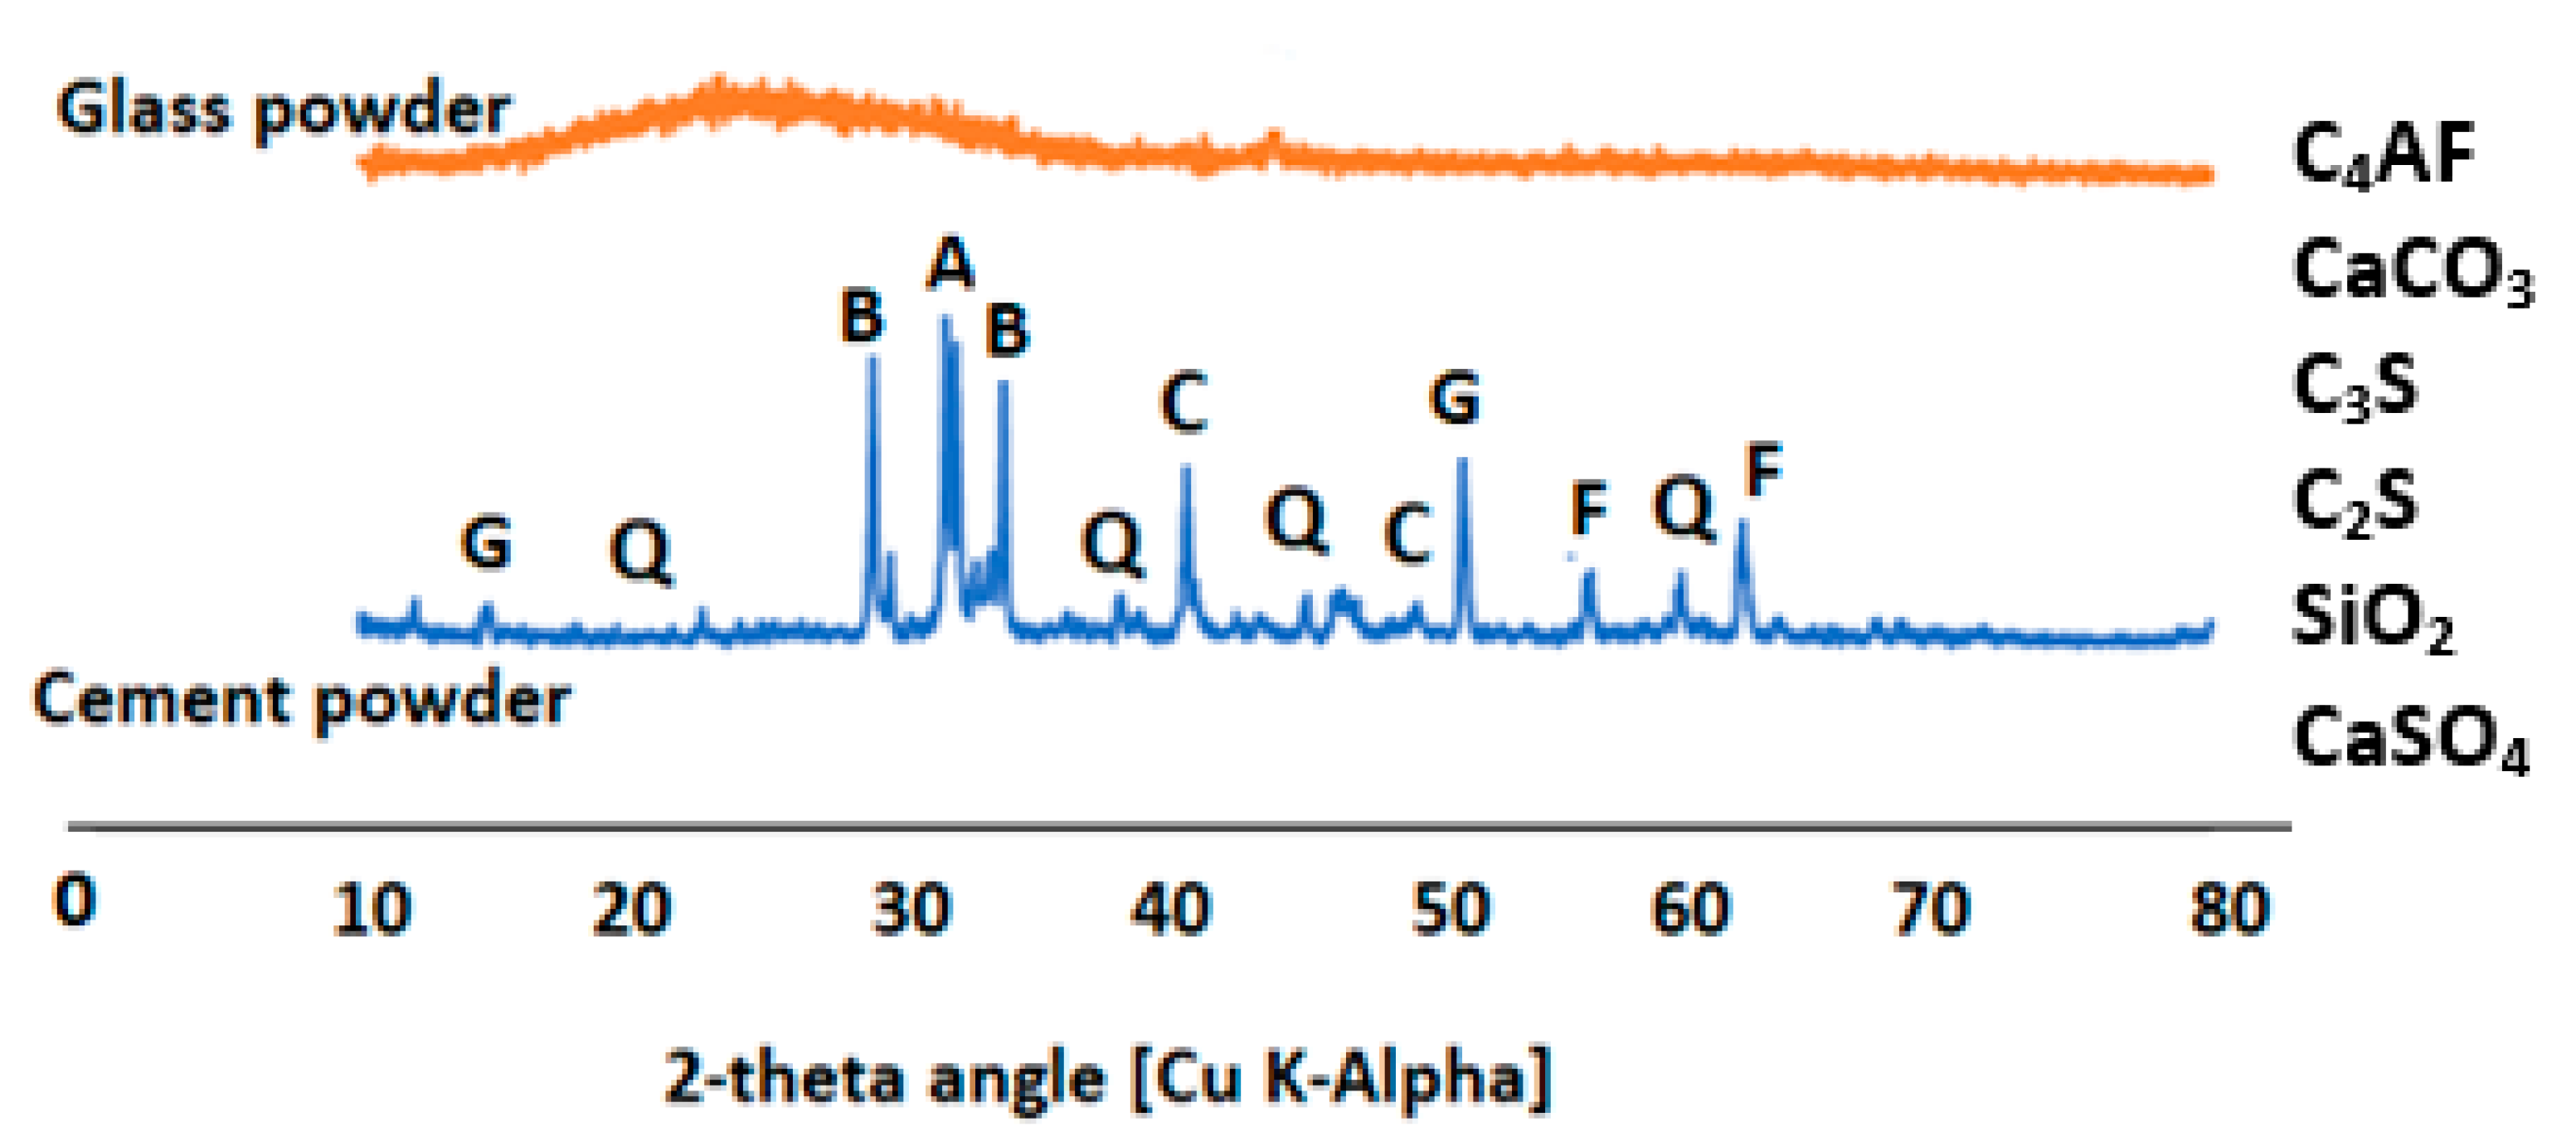
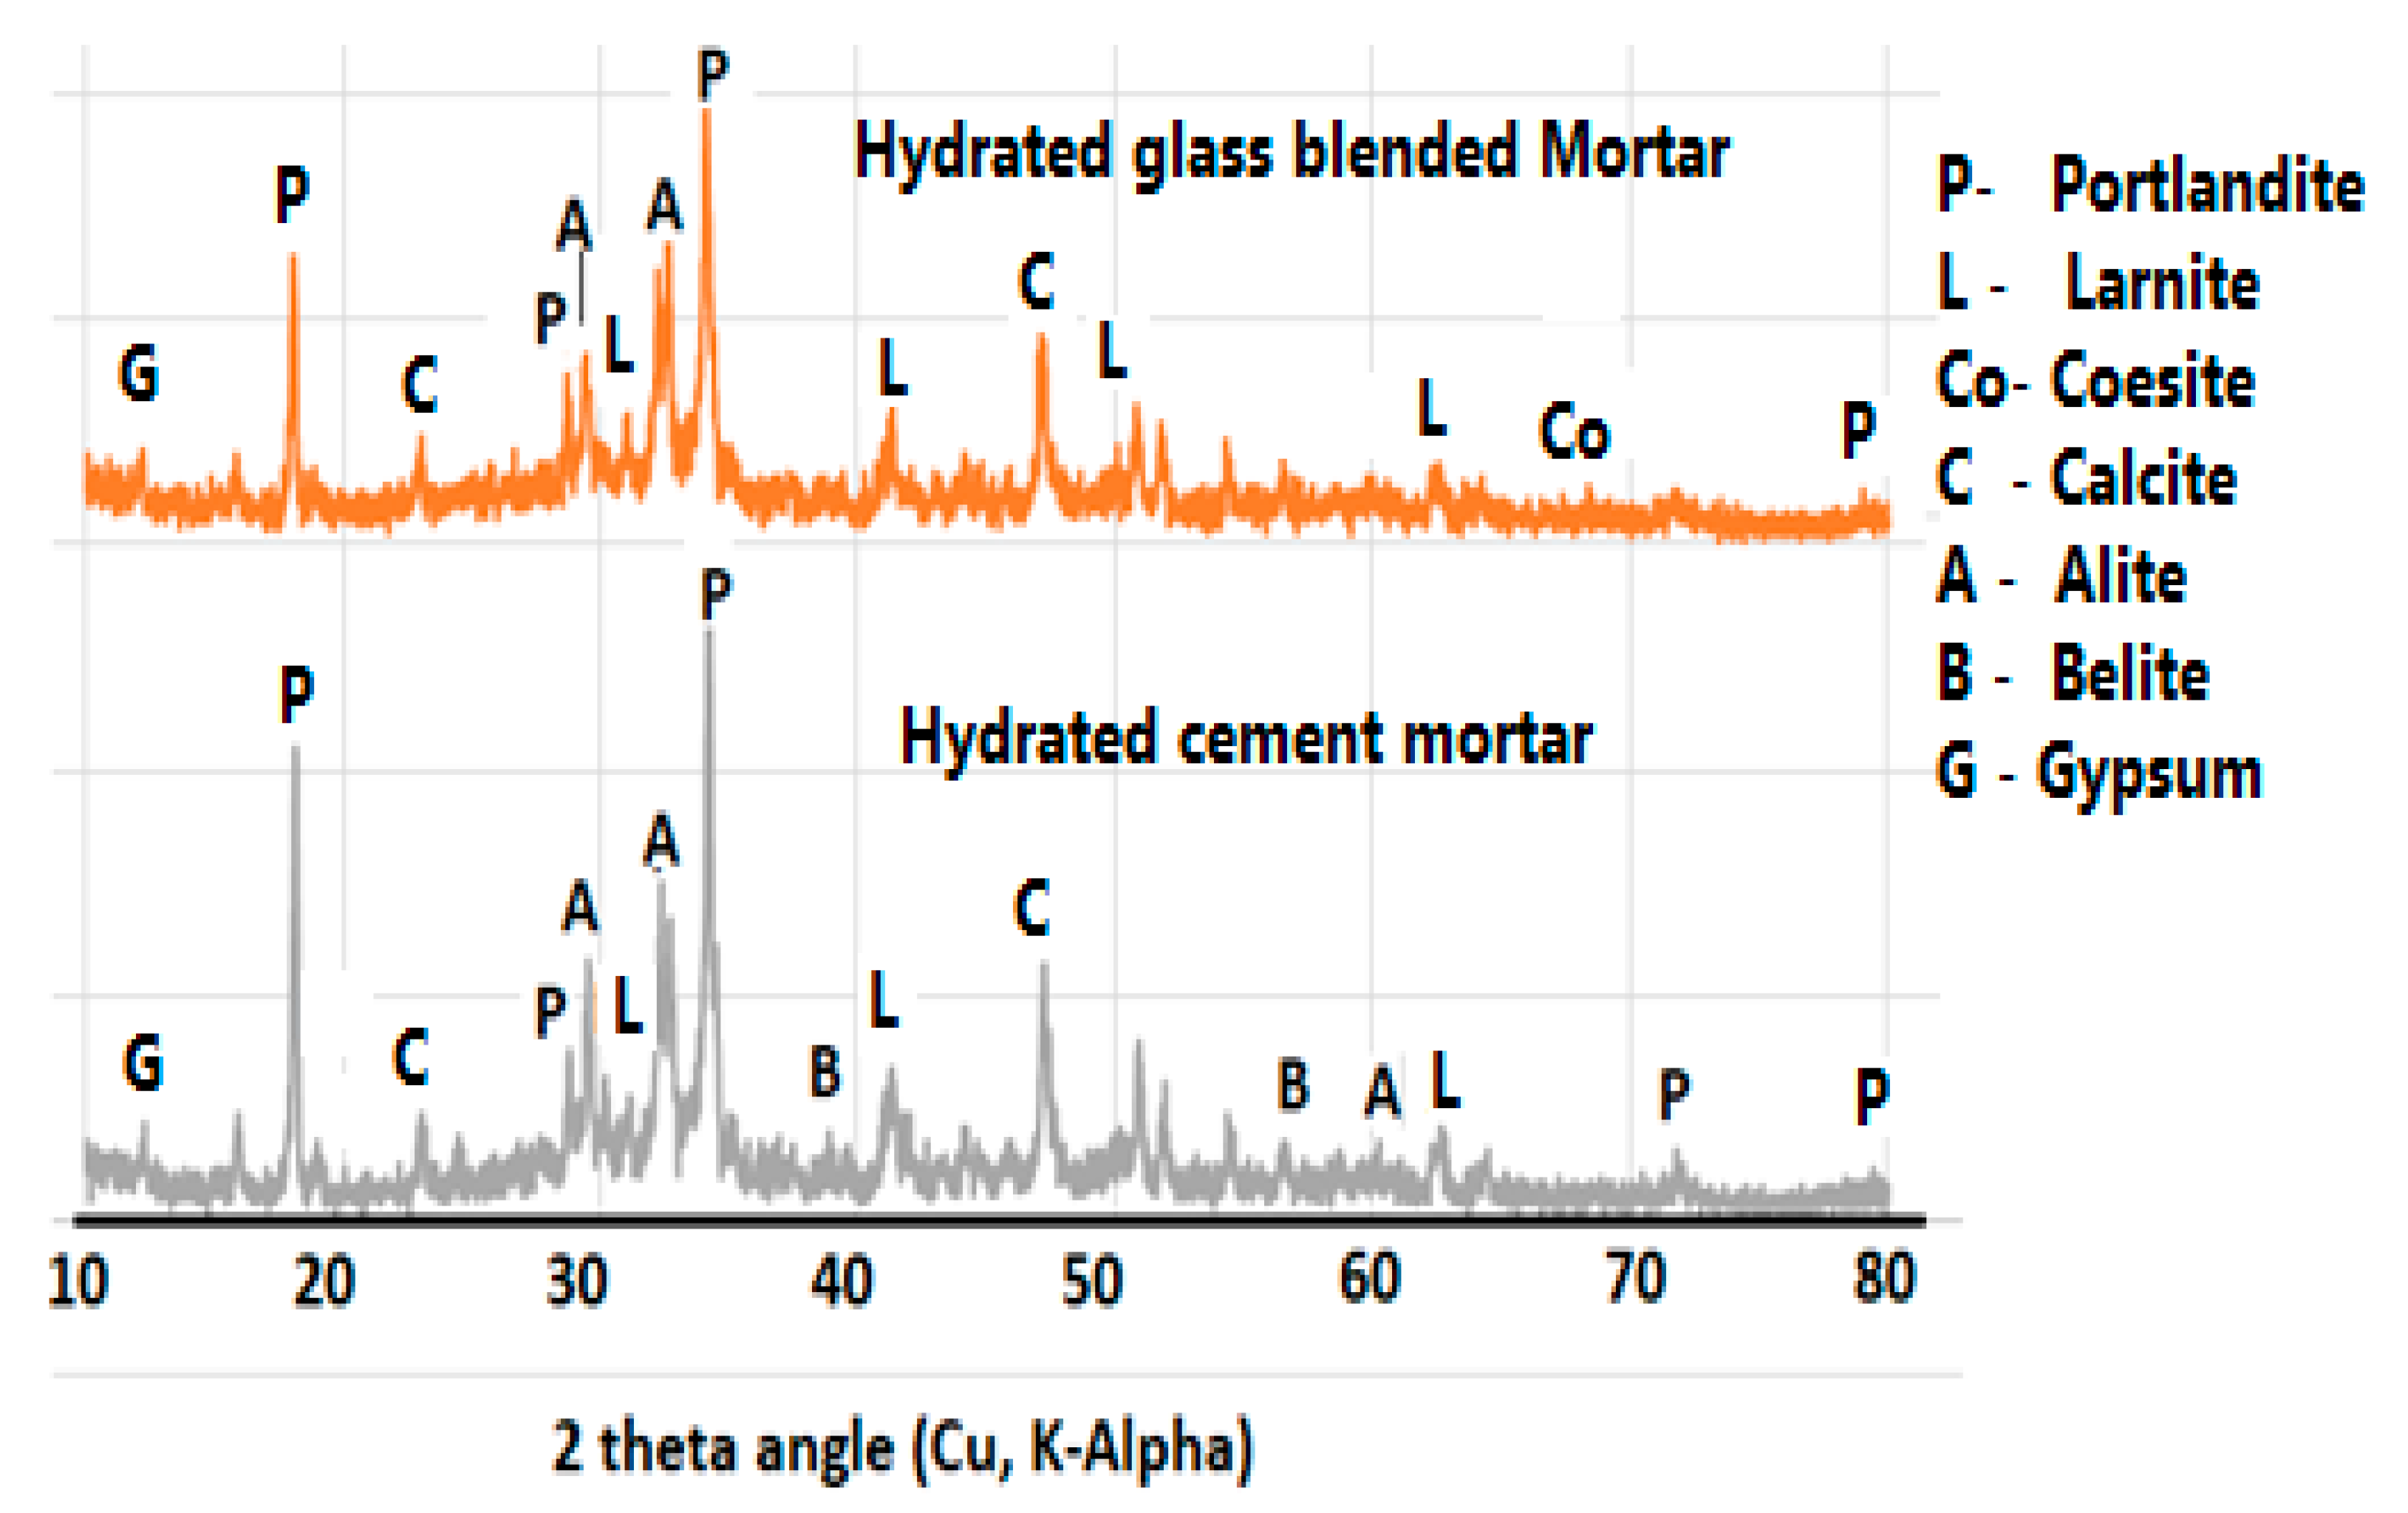
3.7. Effect of Glass on the Formation of Mineral Phases in the Product

The XRD presented in Figure 15 shows the presence of gypsum in both hydrated cement and glass blended binder. In the EDS, the presence of Ca, Si and S is very conspicuous in Aft regions, even though XRD could not detect Aft in the sample or the sulfate-based compound [41]. Feng et al. [43] also reported that Aft could easily form within the pore where portlandite is formed, thereby allowing it to grow without a stress-dependent damage. This explains why the inner microstructural cracks (Figure 13) are found in C80G20, whereas they are minimal or absent in cement glass-free mortar (C100G0). This could further explain the lower strength in glass blended mortar or concrete. Coesite (SiO2) is present in the C80G20 due to the additional silica present in the glass. Other compounds formed in the hydrated cement C100G0 are portlandite (CH), larnite (CSH gel) and calcite (CaCO3). Gypsum is found in both C80G20 and C100G0 regardless of the presence or absence of glass powder. This implies that the detected gypsum was from the unreacted OPC particles.

3.8. Effect of Glass on 28 Day Concrete Exposed to Elevated Temperatures (550 °C)

The glass blended concrete (C80G20) exposed to elevated temperature lost 22.6%, 16.8% and 7.4% of strength in C90G10. C80G20 and C70G30, respectively, whereas OPC concrete (C100G0) lost about 28.2% of strength, as shown in Figure 16. The strength retention is due to microstructural stability and thermal absorption by glass. The residual density (Figure 17) of the sample was 4.2% of pre-thermal treatment in C80G20. This further increased to 4.9% and 5.0% in C90G10 and C70G30, respectively, while OPC concrete lost 16.9 wt.% in density. This result implies that the use of glass particles in concrete in fire-resistant structures such as kitchens and incinerators can be effective because of the propensity to improve the durability of concrete structures.
Finally, it is also important to emphasize the cost efficiency of glass waste blended concrete: in 1 m3 of concrete, a cement content of 280 kg/m3 can be added to 70 kg/m3 of glass waste powder to constitute a total binder of 350 kg/m3. Therefore, the cost of cement could be reduced by 80% in addition to the environmental benefit of solid waste reduction.

4. Conclusions

This paper addresses the contribution of waste glass as a partial substitution for ordinary Portland cement (OPC) in mortar and concrete prepared with water binder ratios of 0.40 and 0.42, respectively. The characteristics of the setting time, workability and compressive strength and thermal resistance (550 °C) were observed in concrete and mortar, while model equations predicting the density and compressive strength were also developed. The following are the conclusions:
(i)
Glass reduced the setting time and enhanced the workability of both glass blended mortar and concrete.
(ii)
Presence of glass caused an interfacial transition zone within the binder matrix, and this led to weak microstructural stability that prevented early strength development.
(iii)
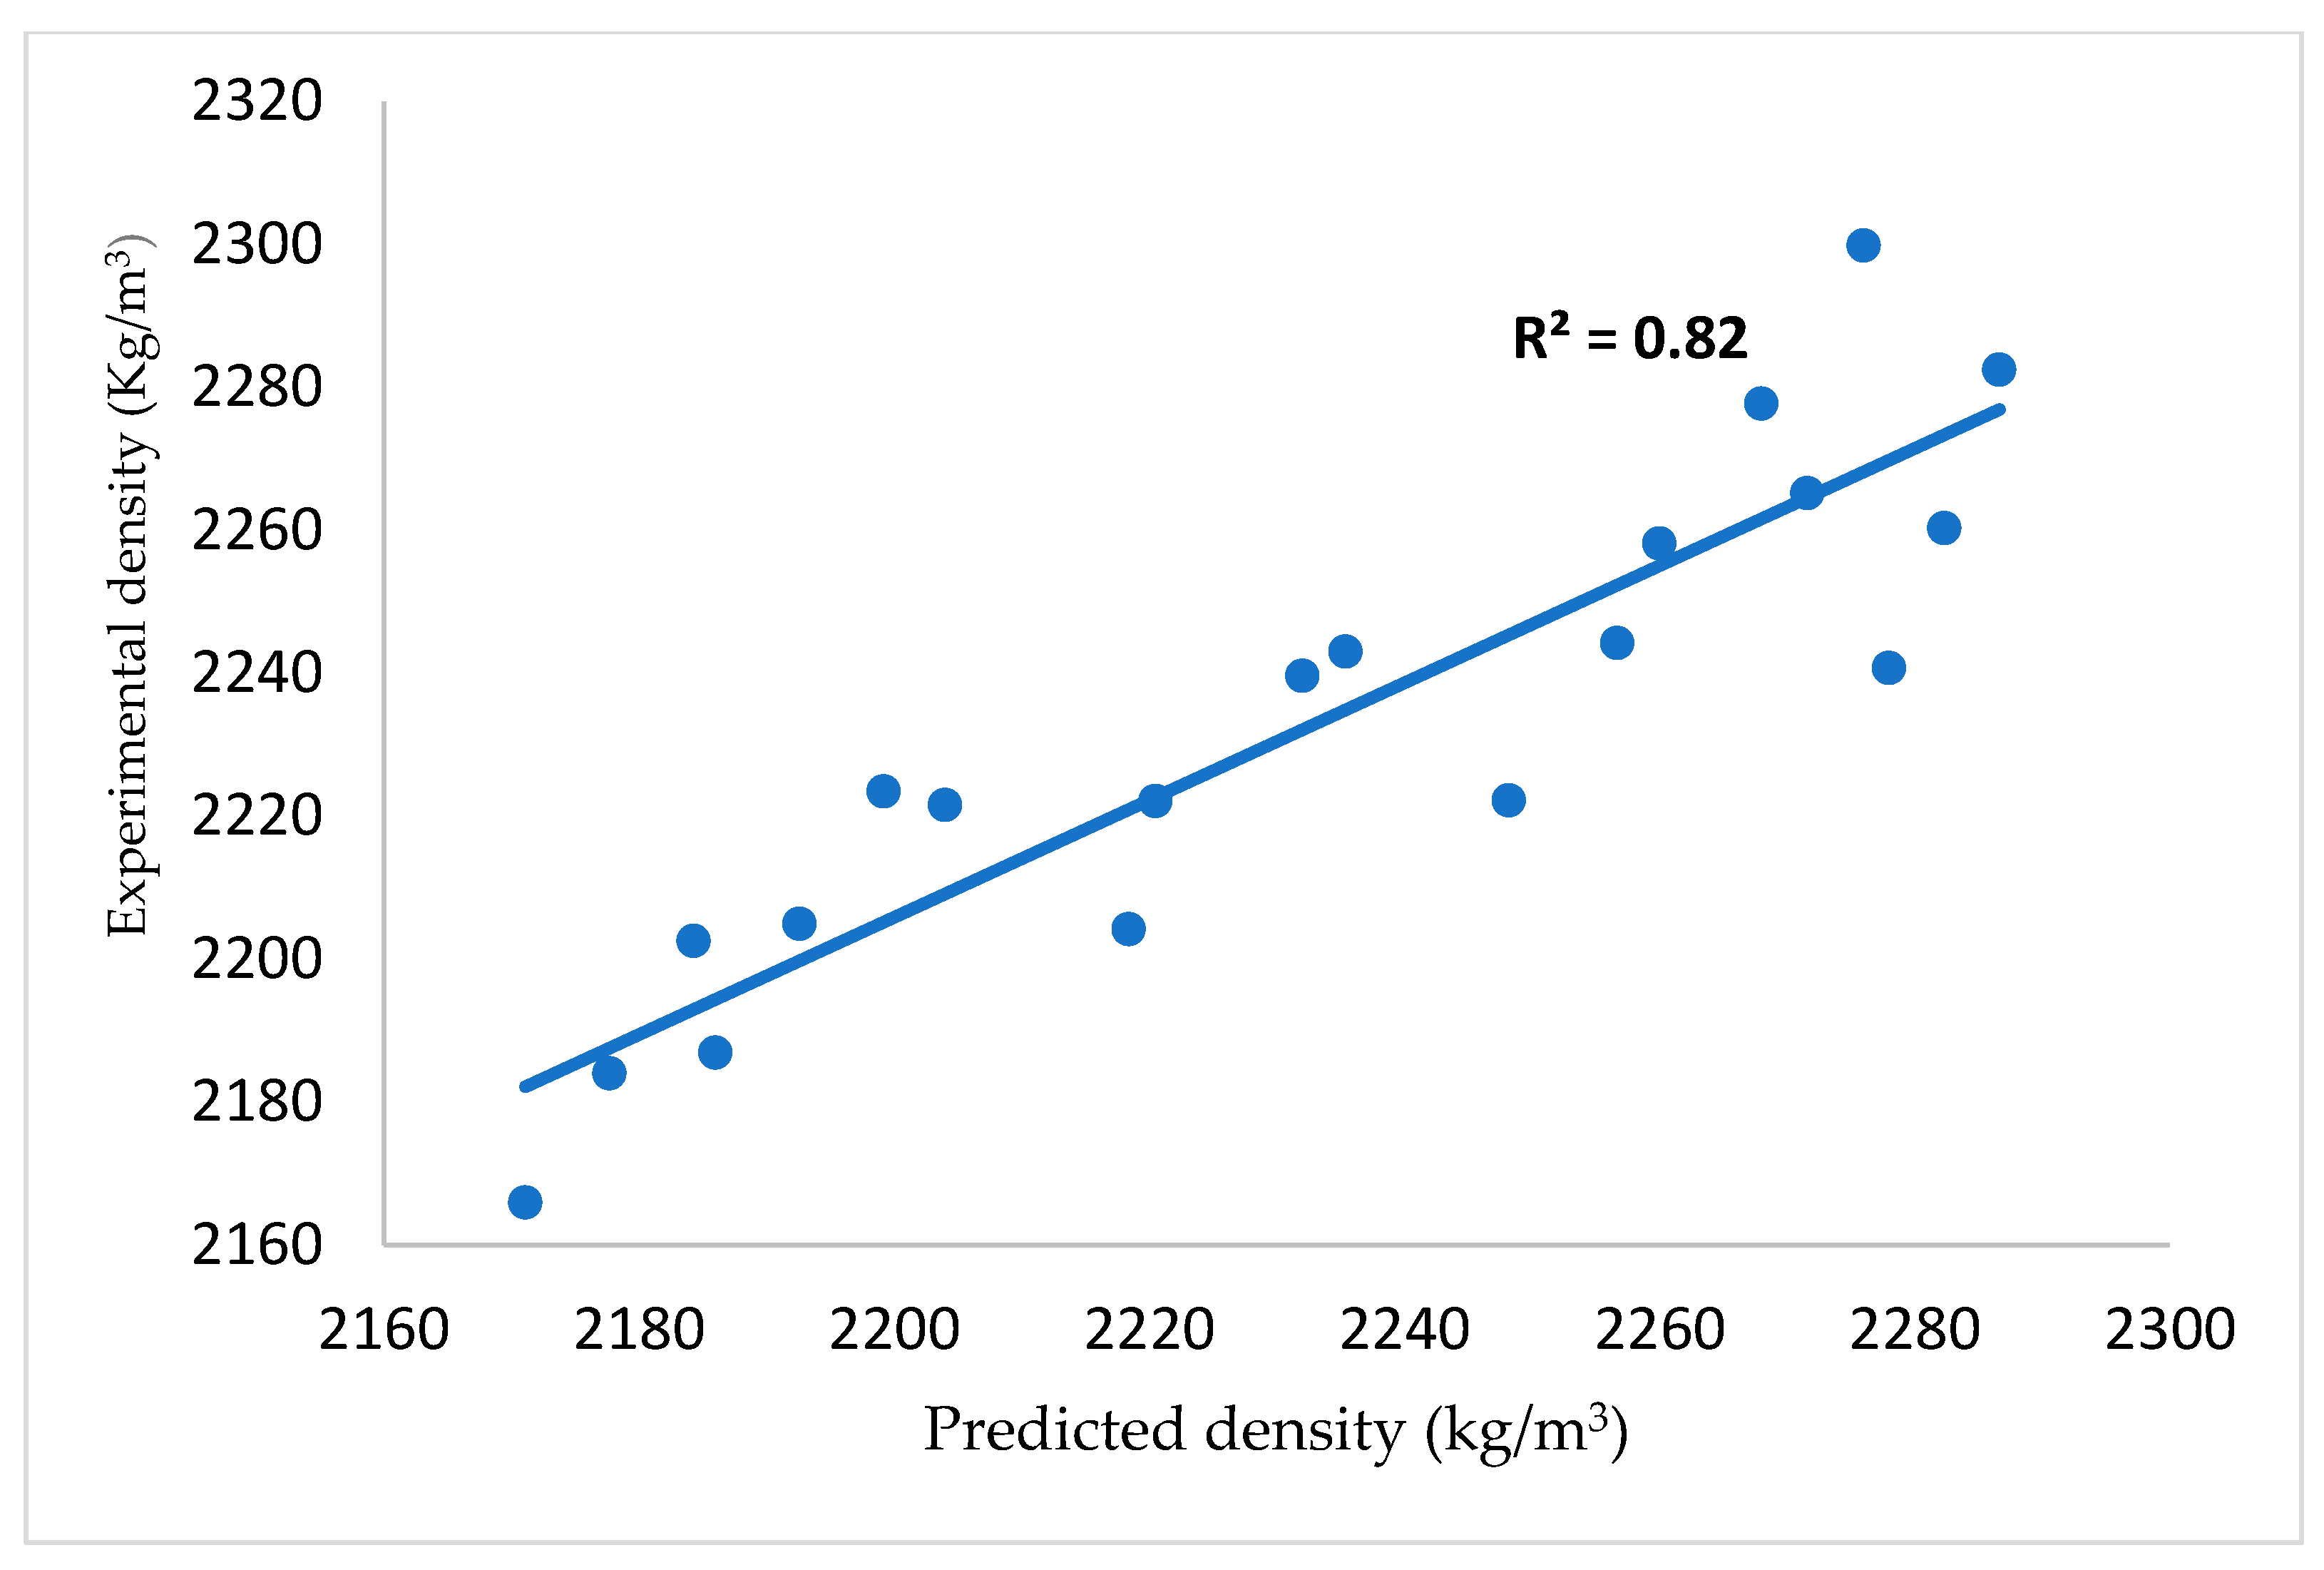
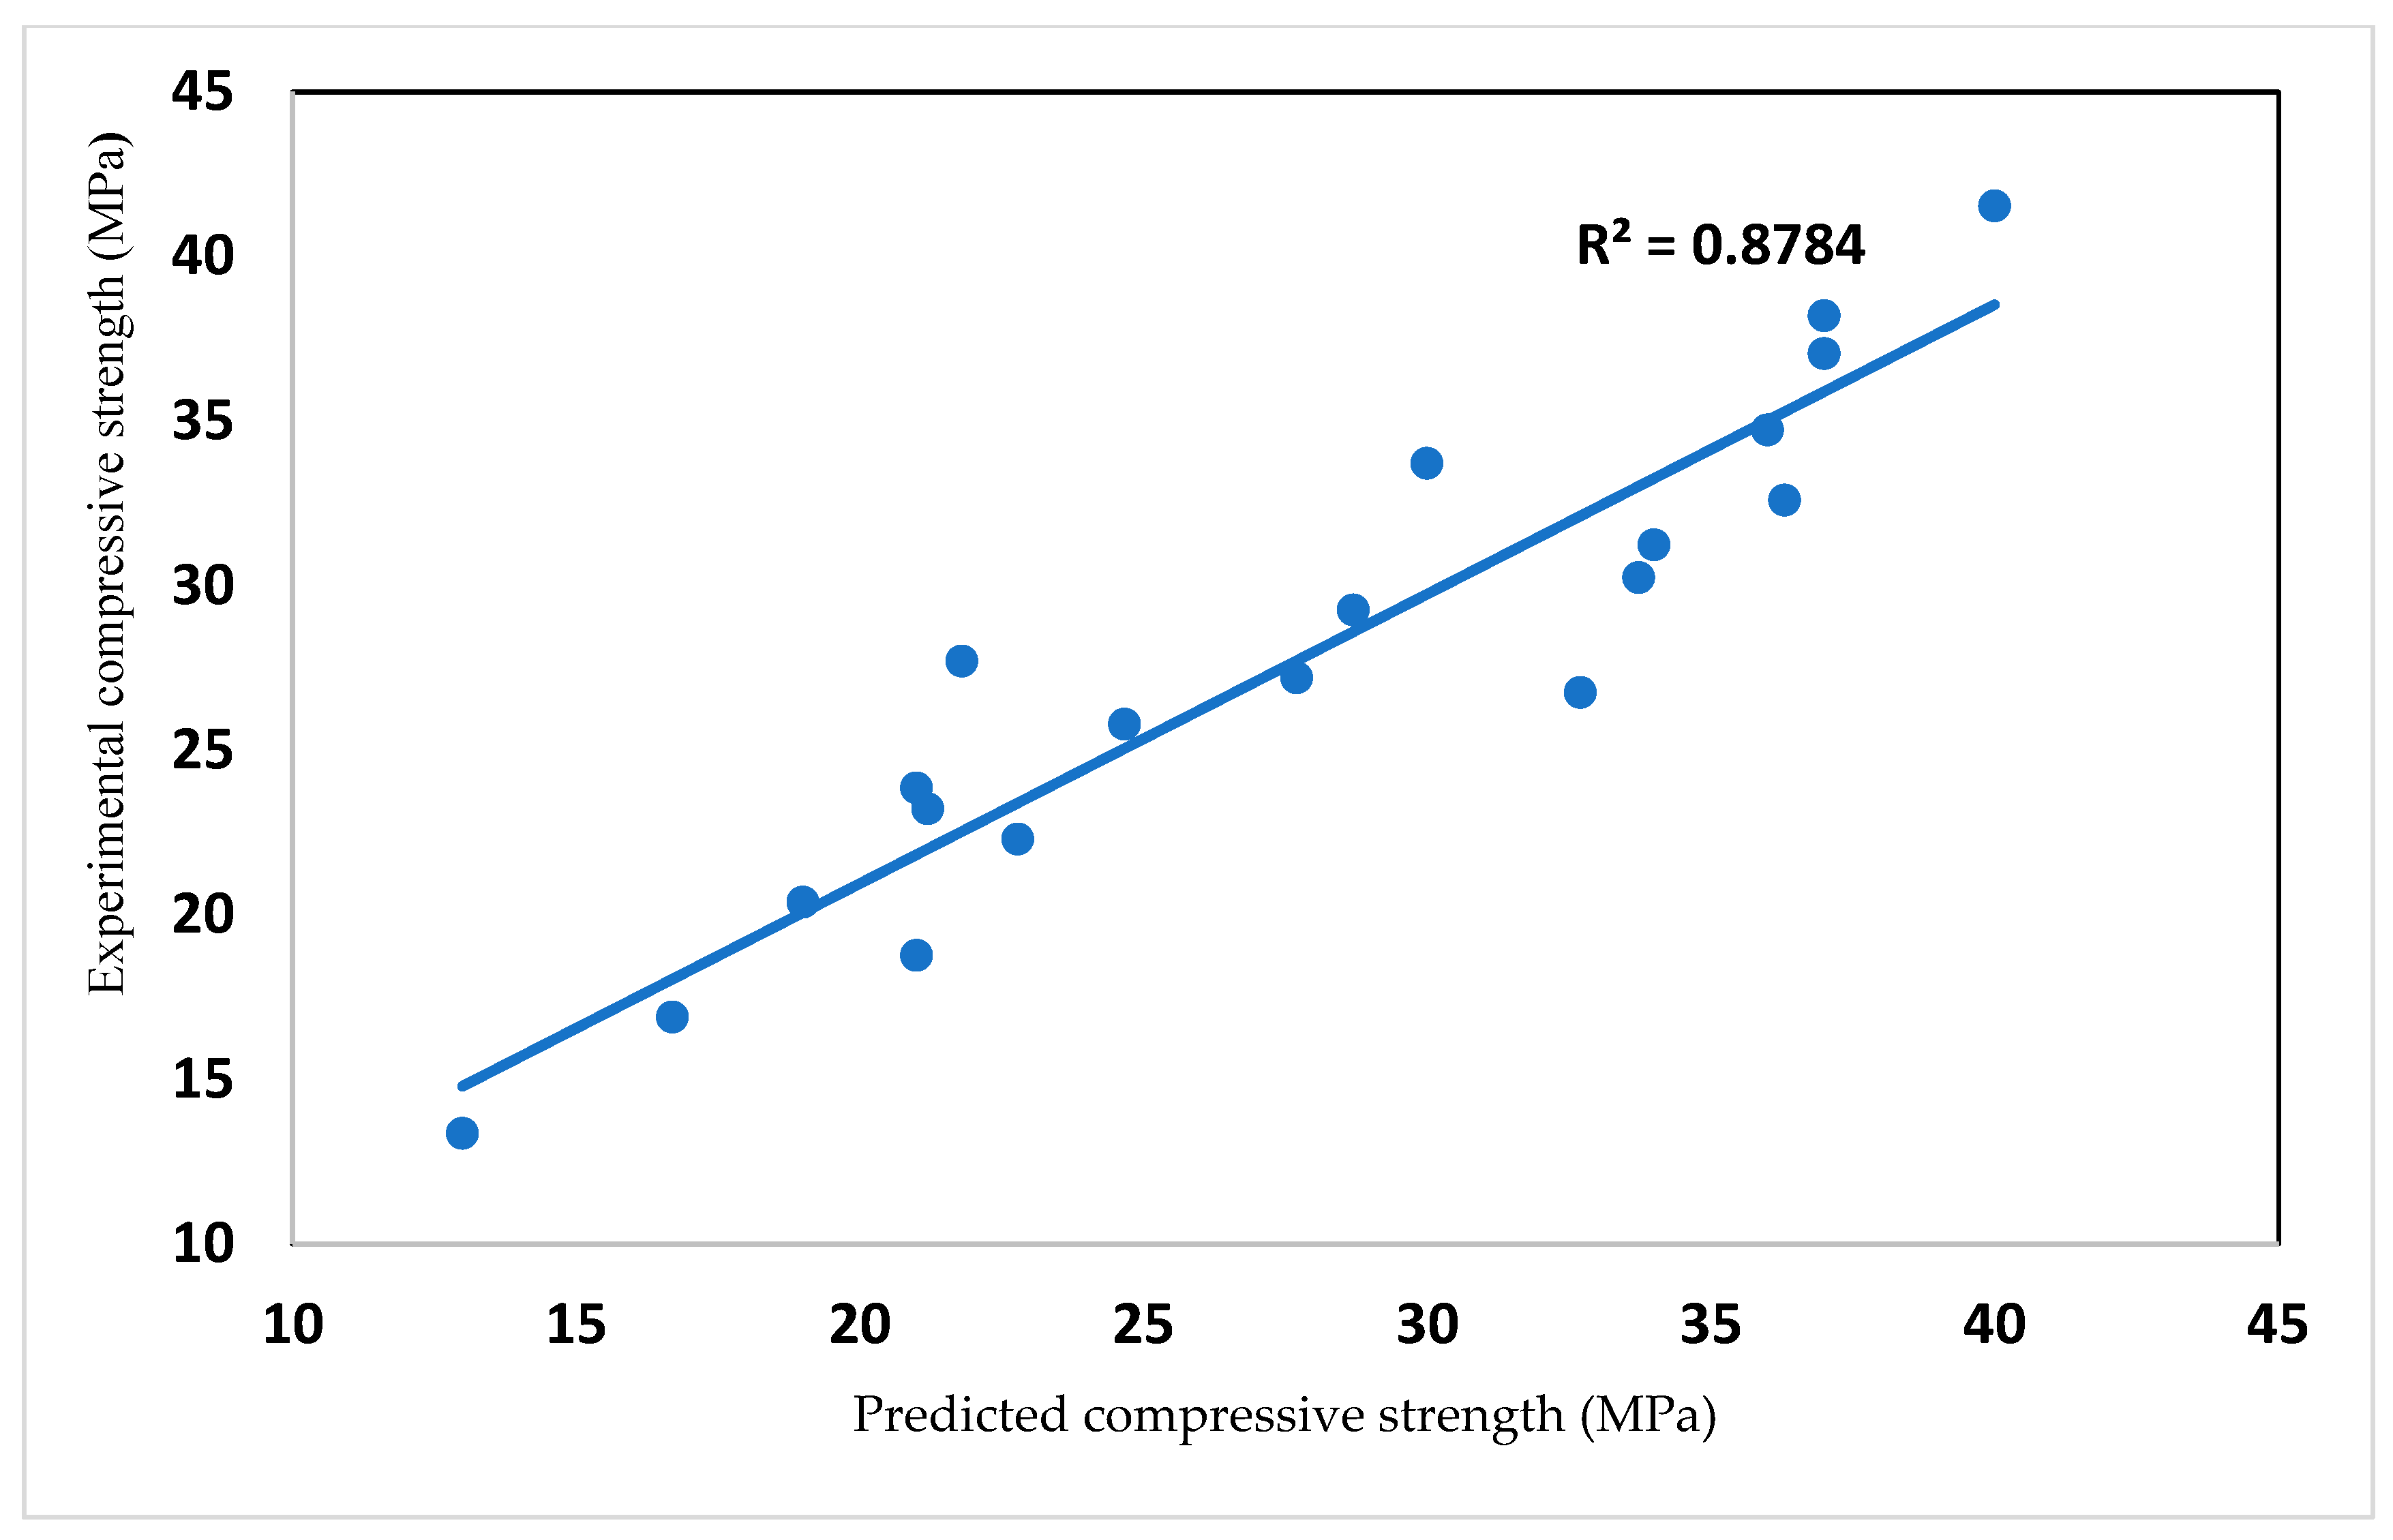
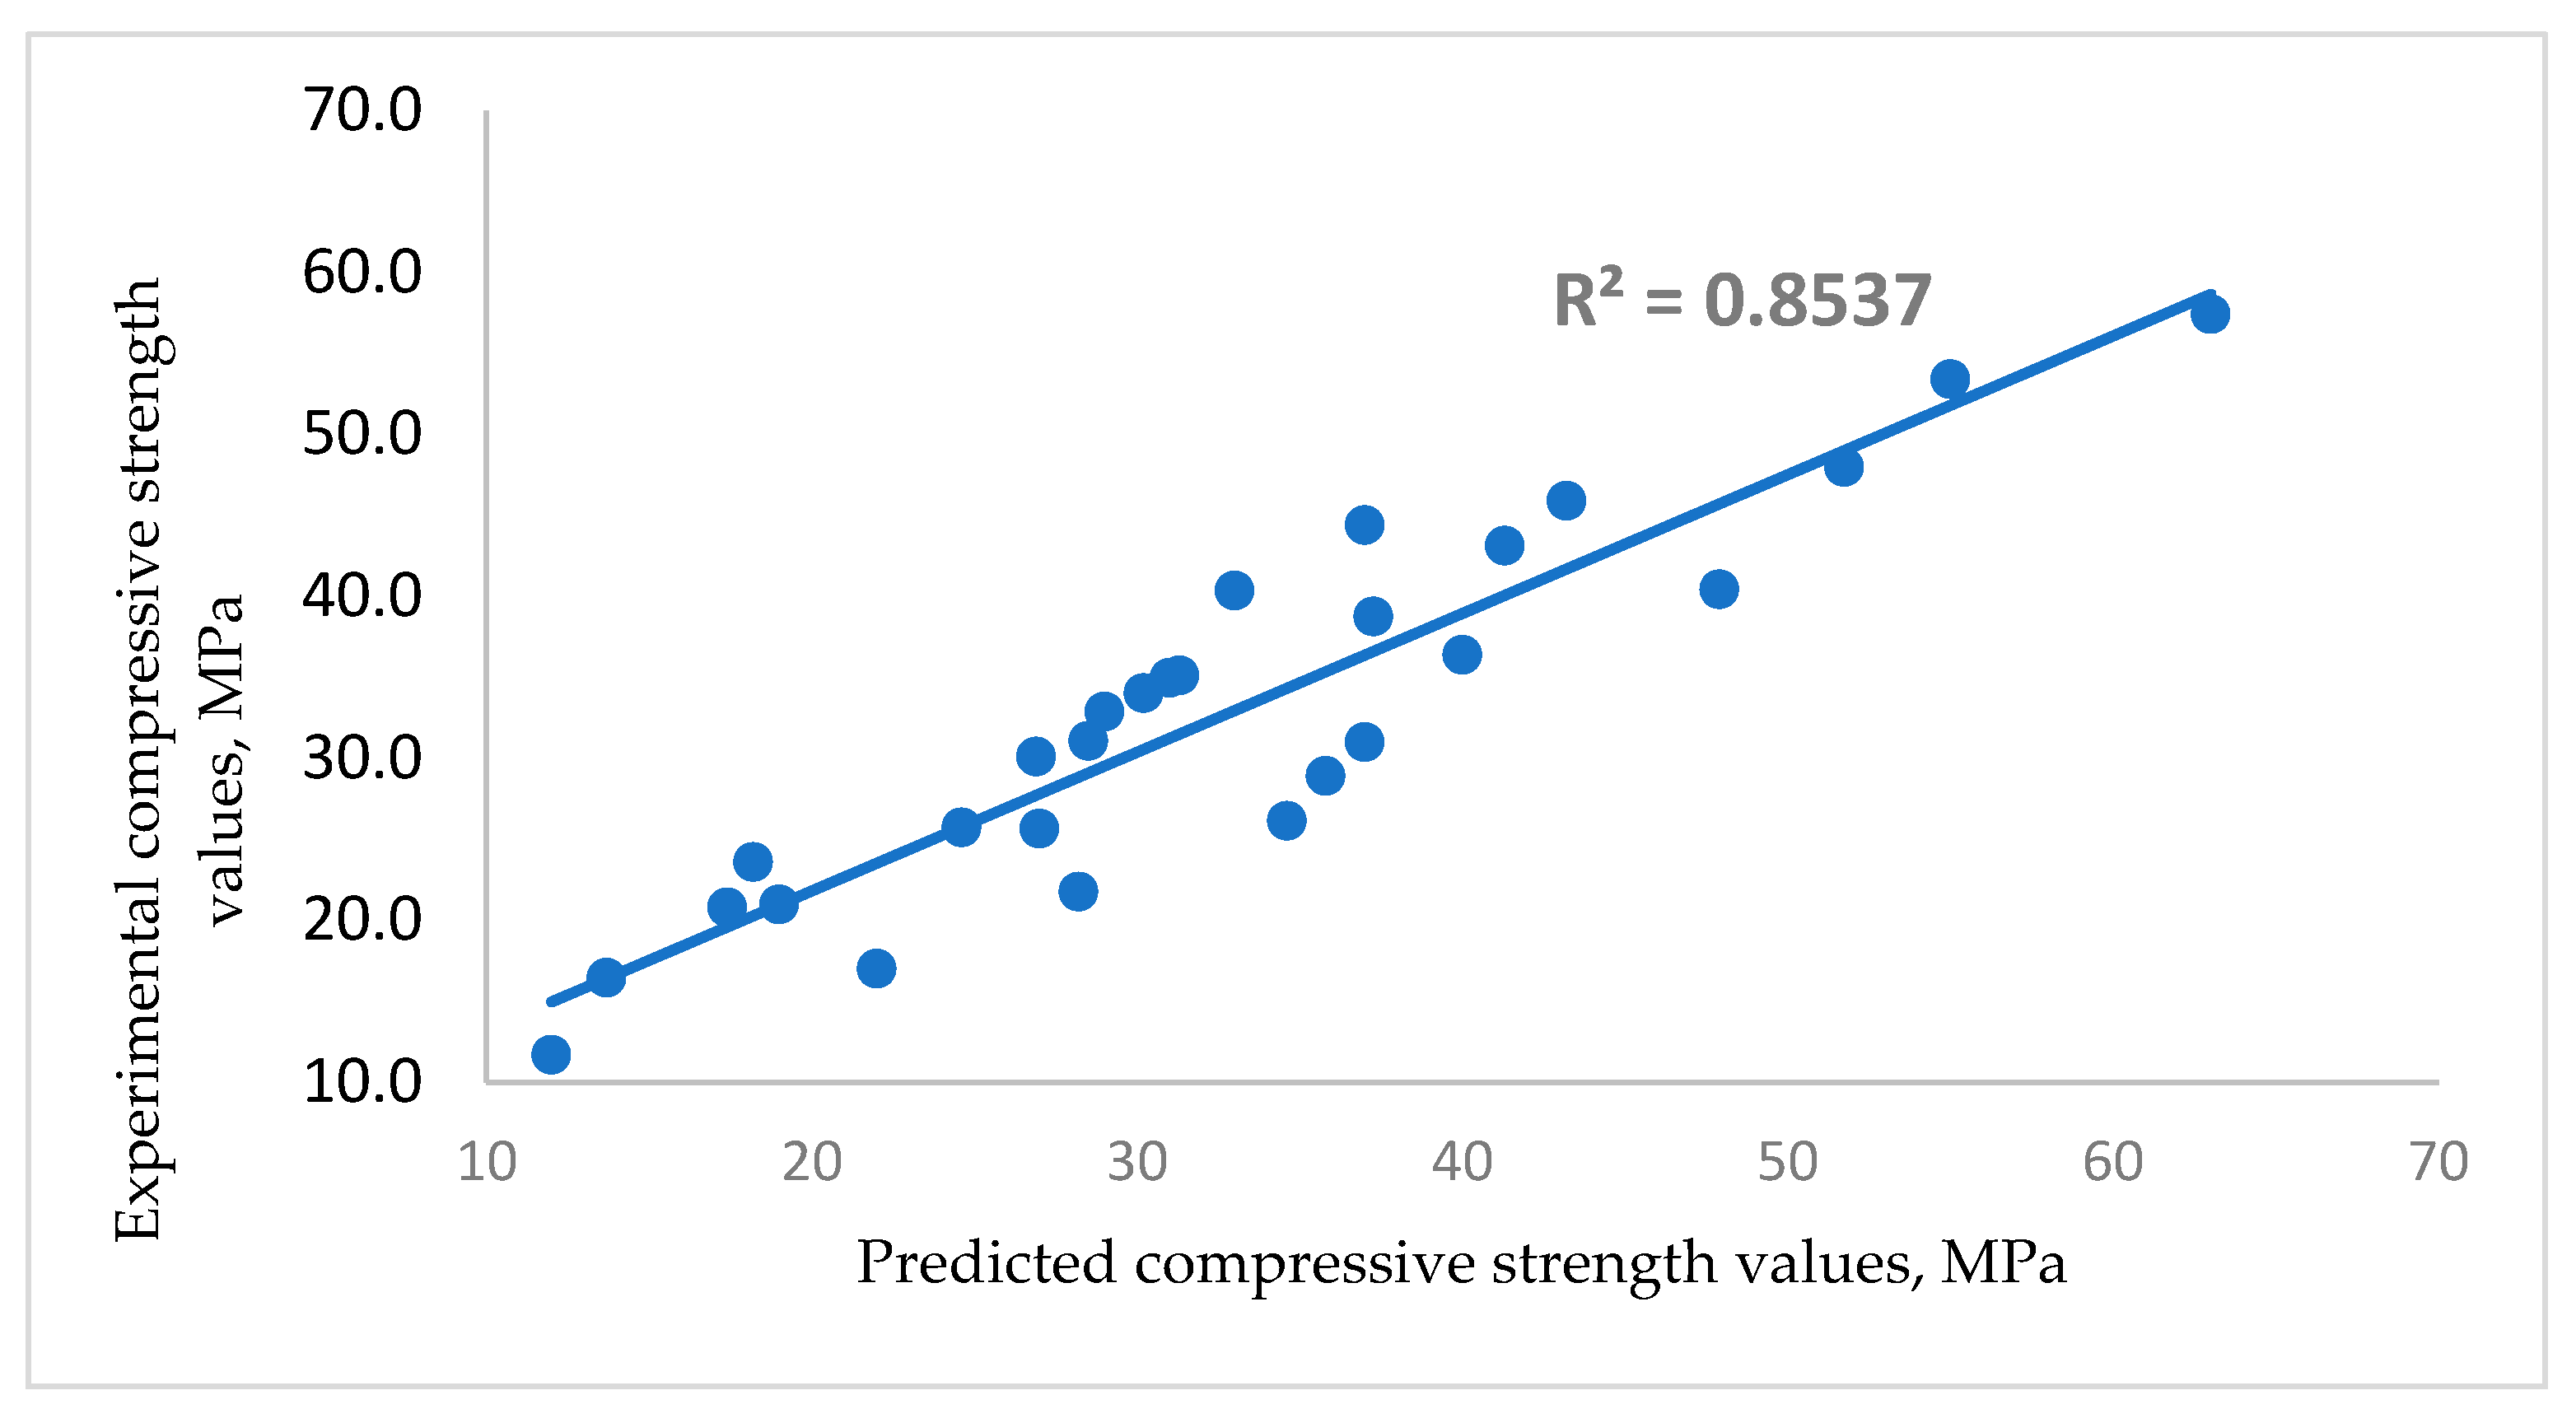
Cement content, glass content and age constituted key elements in the models predicting the strength and density of mortar/concrete.
(iv)
Presence of glass affected the vibrational frequencies of hydroxyl (-OH), C=O, water molecules, Si-O and S-O, as observed in the Fourier infrared spectroscopy results.
(v)
The maximum 28-day compressive strengths in mortar and concrete were 33 MPa and 37 MPa, prepared at water/binder ratios of 0.4 and 0.42 with the optimum OPC partially substituted glass content of 10 wt.% and 20 wt.%, respectively. In addition, the maximum 90-day strength achieved in concrete was 47 MPa.
(vi)
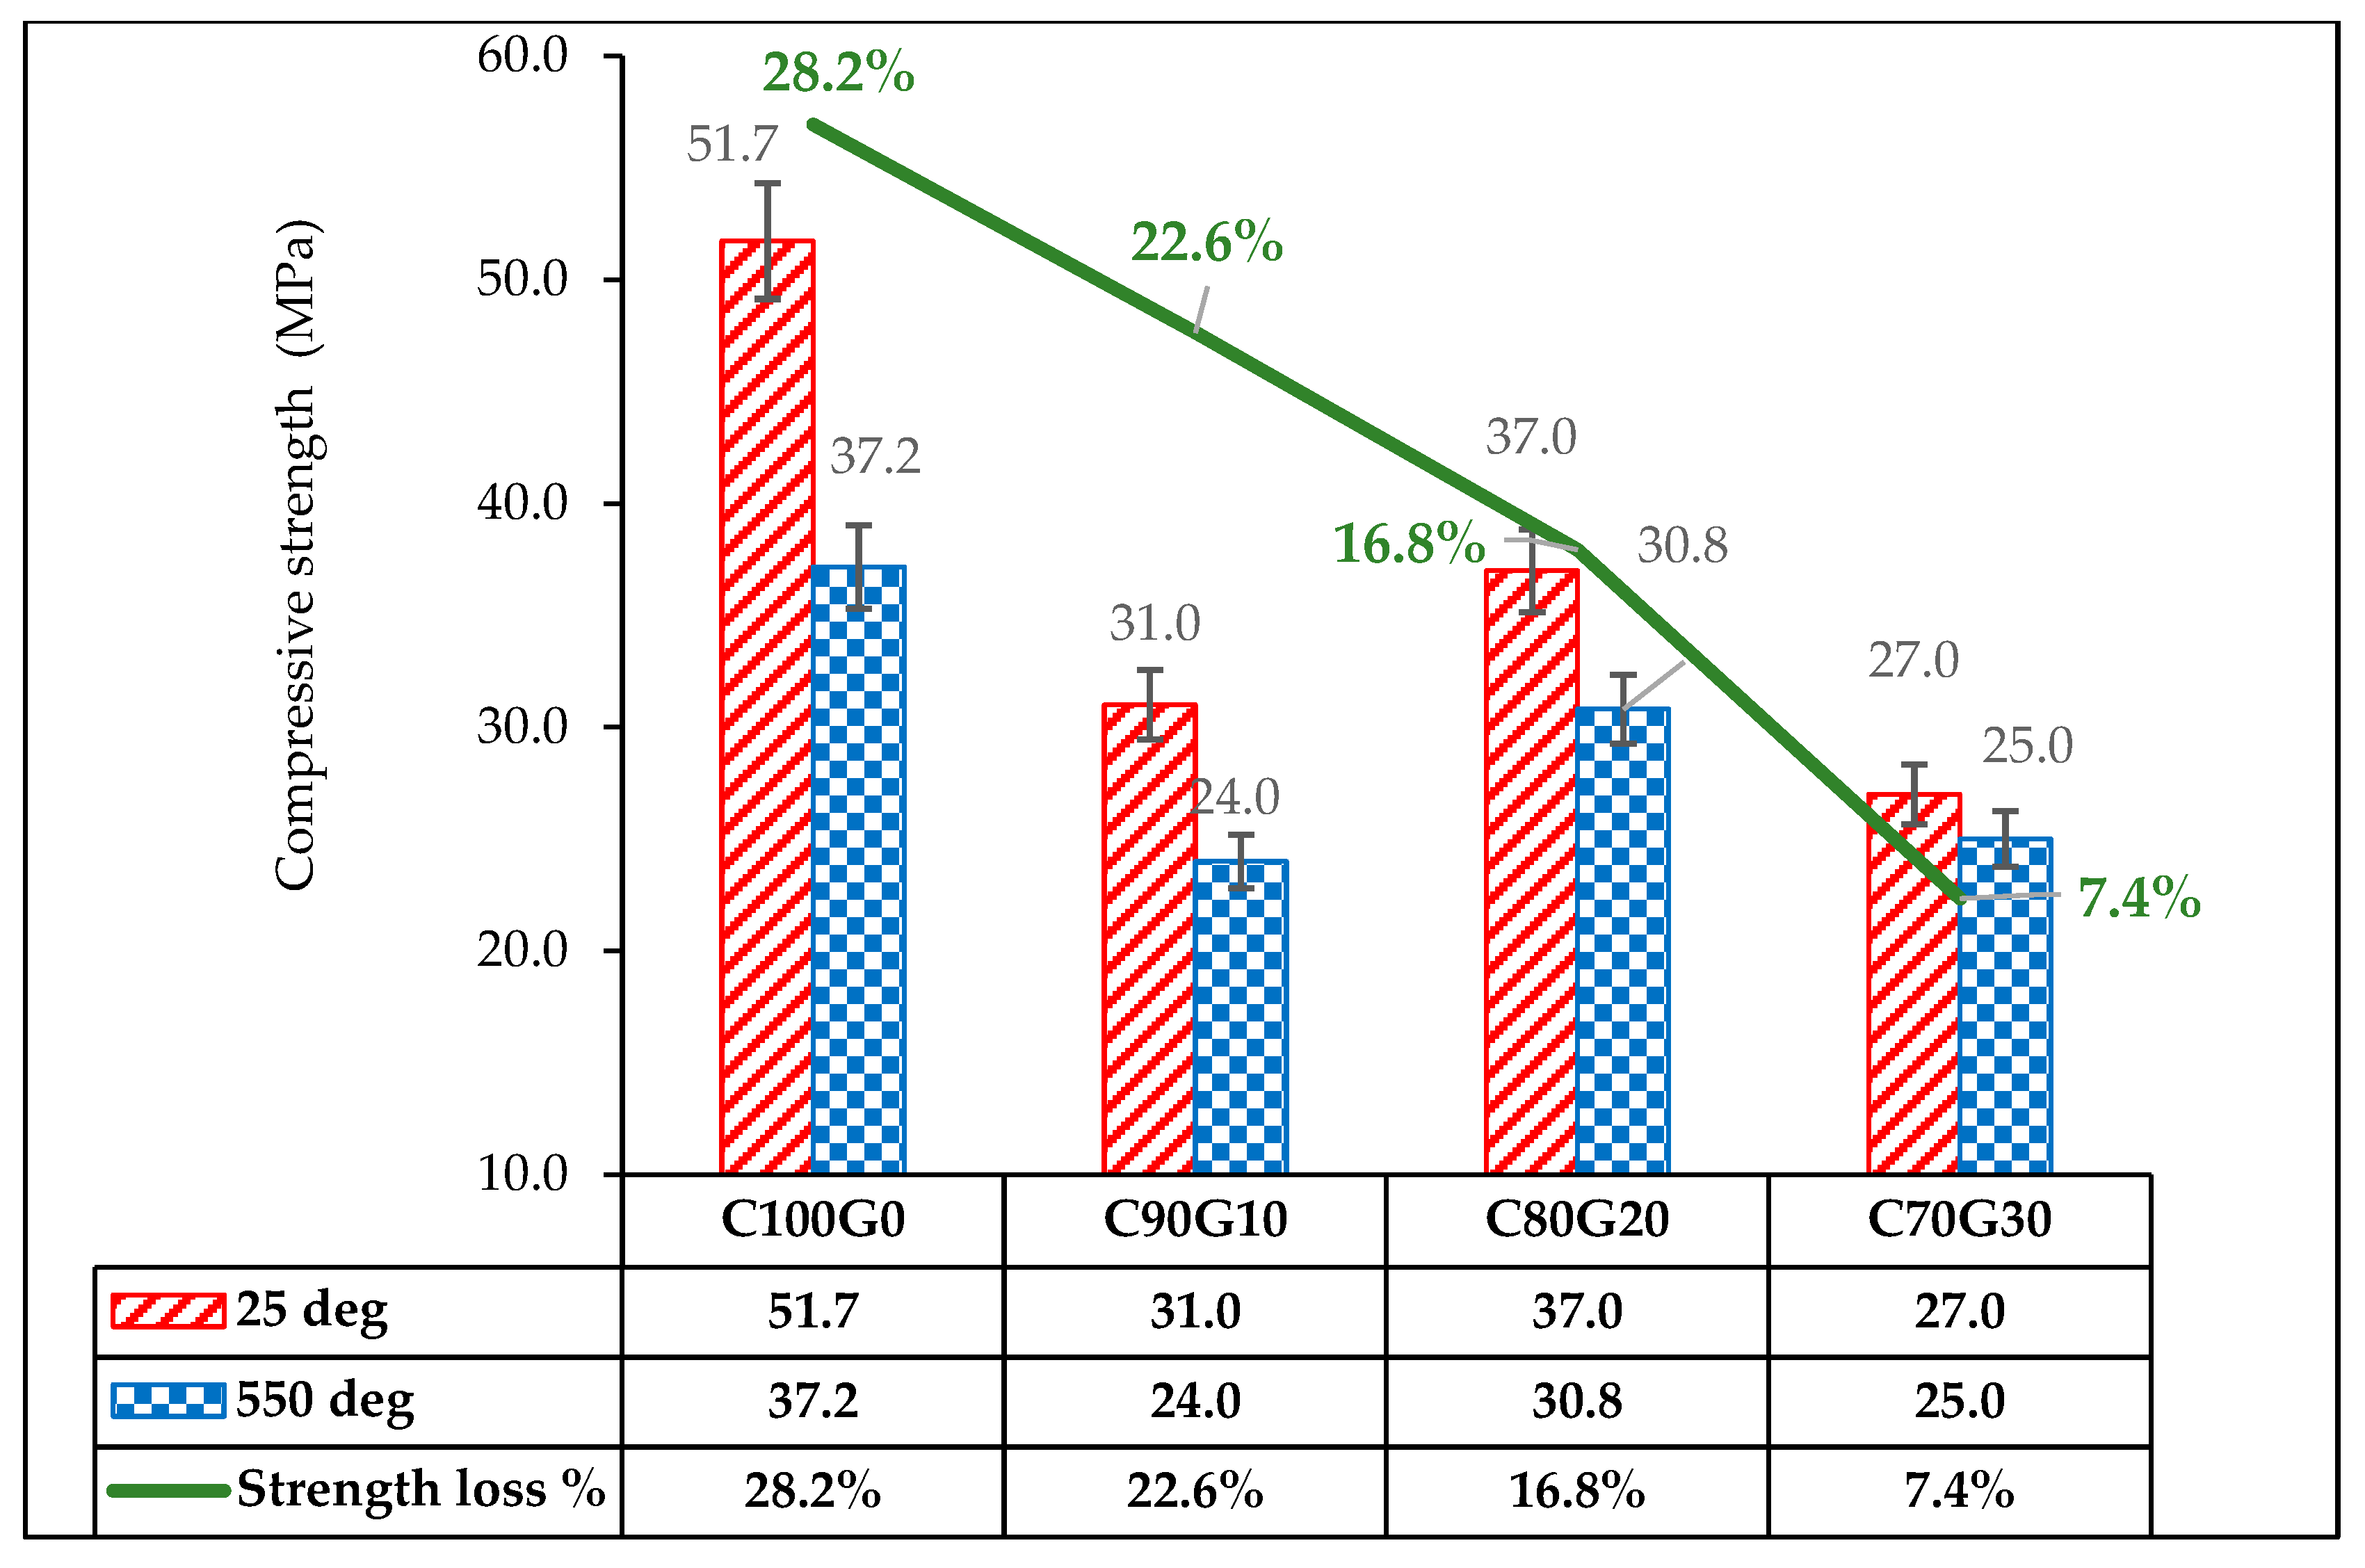
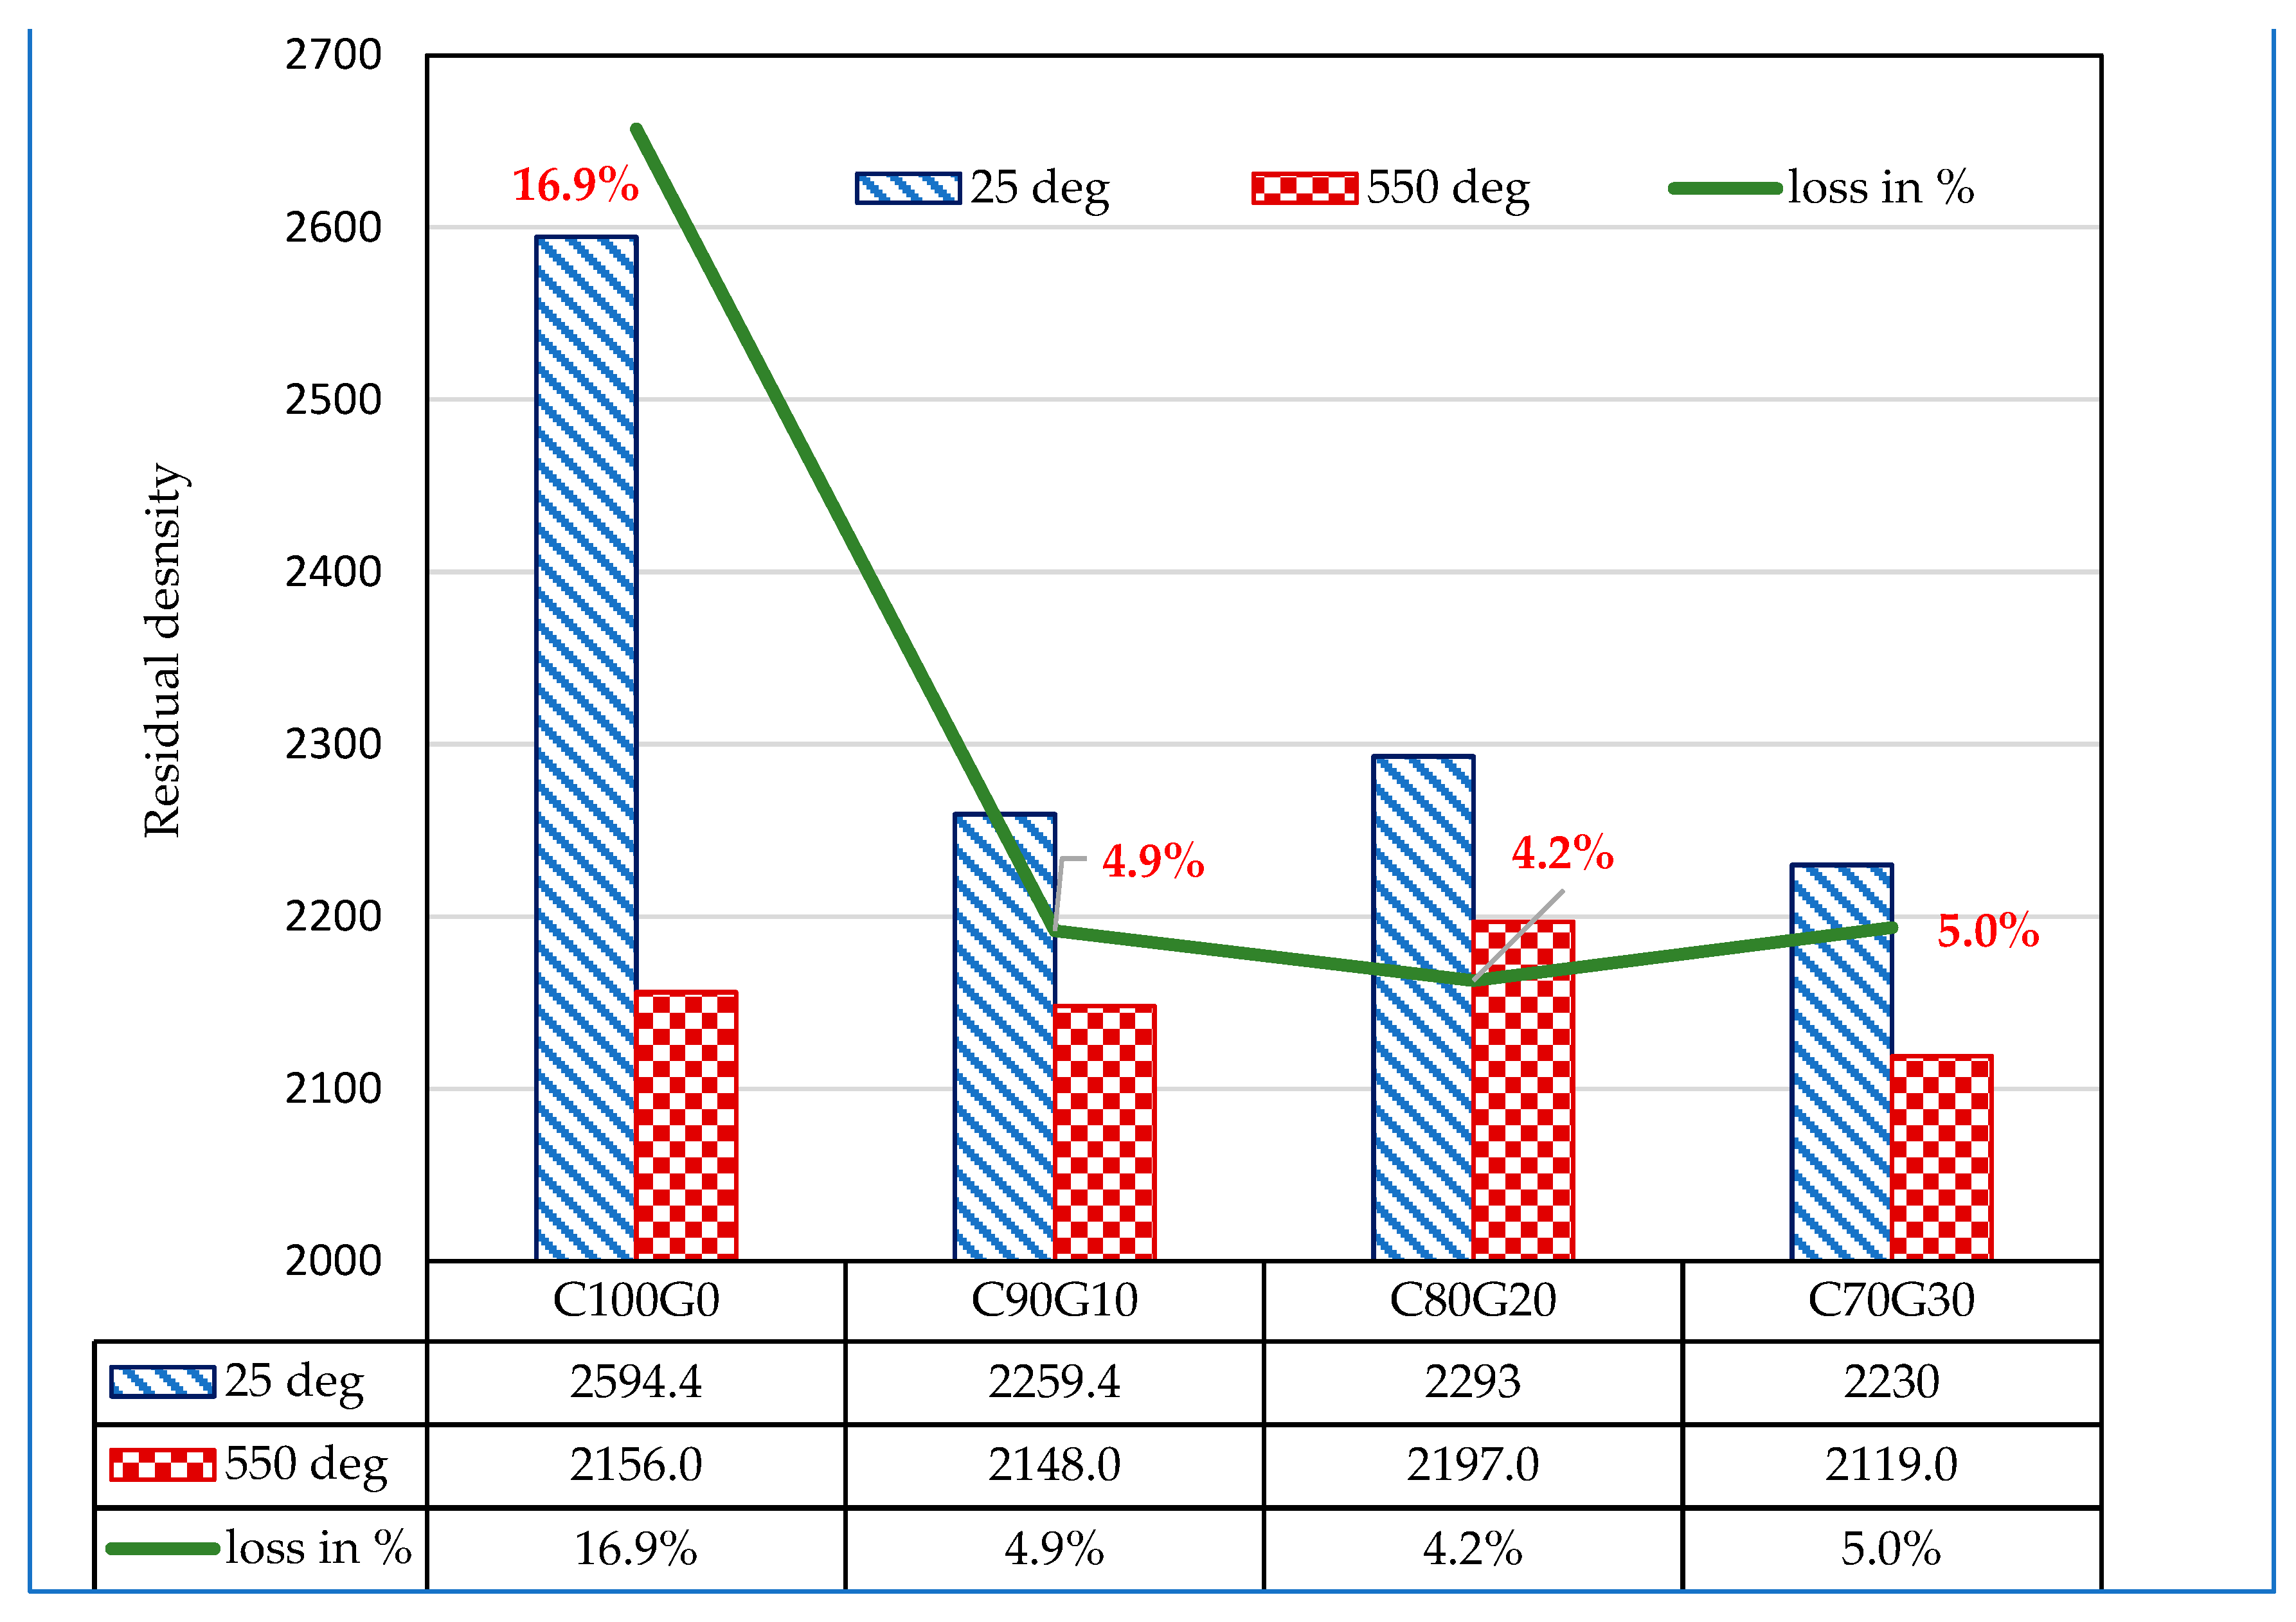
Generally, OPC (C100G0) and glass blended concrete (C80G20) subjected to thermal exposure of 550 °C had strength reductions of 28.2% and 16.8%, while the loss of density was 16.9% and 4.2%, respectively.
(vii)
Glass blended concrete could be easily used in fire-resistant structures such as kitchens and incinerators to achieve better durability.

Author Contributions

Conceptualization, M.O.Y.; Formal analysis, A.A.A.; Funding acquisition, K.A.A.A.-S.; Investigation, M.O.Y., A.A.A. and G.D.S.A.; Methodology, M.O.Y.; Project administration, K.A.A.A.-S., A.H.A., S.M.I.S. and U.Y.Q.; Resources, K.A.A.A.-S., A.H.A. and M.M.H.A.-T.; Writing—original draft, M.O.Y.; Writing—review & editing, K.A.A.A.-S. and A.A.A. All authors have read and agreed to the published version of the manuscript.

Funding

The authors extend their appreciation to the Deputyship for Research & Innovation, Ministry of Education in Saudi Arabia for funding this research work through the project No: IFP-A-2022-2-1-06.

Acknowledgments

The authors would like to appreciate the continuous support of University of Hafr Al Batin.

Conflicts of Interest

The authors declare no conflict of interest.

References

  1. Li, Q.; Qiao, H.; Li, A.; Li, G. Performance of waste glass powder as a pozzolanic material in blended cement mortar. Constr. Build. Mater. 2022, 324, 126531. [Google Scholar] [CrossRef]
  2. United State Environmental Protection Agency (EPA). Facts and Figures about Materials, Waste and Recycling. Glass: Material-Specific Data. 2021. Available online: https://www.epa.gov/facts-and-figures-about-materials-waste-and-recycling/glass-material-specific-data (accessed on 5 August 2022).
  3. Tamanna, N.; Tuladhar, R. Sustainable use of recycled glass powder as cement replacement in concrete. Open Waste Manag. J. 2020, 13, 1–13. [Google Scholar] [CrossRef]
  4. Cao, J.; Lu, J.; Jiang, L.; Wang, Z. Sinterability, microstructure and compressive strength of porous glass-ceramics from metallurgical silicon slag and waste glass. Ceram. Int. 2016, 42, 10079–10084. [Google Scholar] [CrossRef]
  5. Lu, J.; Duan, Z.; Poon, C.S. Combined use of waste glass powder and cullet in architectural mortar. Cem. Concr. Compos. 2017, 82, 34–44. [Google Scholar] [CrossRef]
  6. Shi, C.; Wu, Y.; Riefler, C.; Wang, H. Characteristics and pozzolanic reactivity of glass powders. Cem. Concr. Res. 2005, 35, 987–993. [Google Scholar] [CrossRef]
  7. Šimonová, H.; Zahálková, J.; Rovnaníková, P.; Bayer, P.; Schmid, P. Mechanical fracture parameters of cement-based mortars with waste glass powder. Procedia Eng. 2017, 190, 86–91. [Google Scholar] [CrossRef]
  8. Lu, J.; Zhan, B.; Duan, Z.; Sun, C. Using glass powder to improve the durability of architectural mortar prepared with glass aggregates. Mater. Des. 2017, 135, 102–111. [Google Scholar] [CrossRef]
  9. Shoaei, P.; Ameri, F.; Reza Musaeei, H.; Ghasemi, T.; Cheah, C.B. Glass powder as a partial precursor in Portland cement and alkali-activated slag mortar: A comprehensive comparative study. Constr. Build. Mater. 2020, 251, 118991. [Google Scholar] [CrossRef]
  10. Du, H.; Tan, K.H. Use of waste glass as sand in mortar: Part II-Alkali-silica reaction and mitigation methods. Cem. Concr. Compos. 2013, 35, 118–126. [Google Scholar] [CrossRef]
  11. Tan, K.H.; Du, H. Use of waste glass as sand in mortar: Part I-Fresh, mechanical and durability properties. Cem. Concr. Compos. 2013, 35, 109–117. [Google Scholar] [CrossRef]
  12. Mirzahosseini, M.; Riding, K.A. Influence of different particle sizes on reactivity of finely ground glass as supplementary cementitious material (SCM). Cem. Concr. Compos. 2015, 56, 95–105. [Google Scholar] [CrossRef]
  13. Lu, J.X.; Duan, Z.H.; Poon, C.S. Fresh properties of cement pastes or mortars incorporating waste glass powder and cullet. Constr. Build. Mater. 2017, 131, 793–799. [Google Scholar] [CrossRef]
  14. Sadati, S.; Khayat, K.H. Rheological and hardened properties of mortar incorporating high-volume ground glass fiber. Constr. Build. Mater. 2017, 152, 978–989. [Google Scholar] [CrossRef]
  15. Alhumoud, J.M.; Al-Mutairi, N.Z.; Terro, M.J. Recycling crushed glass in concrete mixes. Int. J. Environ. Waste Manag. 2008, 2, 111–124. [Google Scholar] [CrossRef]
  16. Ling, T.C.; Poon, C.S. Use of recycled CRT funnel glass as fine aggregate in dry-mixed concrete paving blocks. J. Clean. Prod. 2014, 68, 209–215. [Google Scholar] [CrossRef]
  17. Mirzahosseini, M.; Riding, K.A. Effect of curing temperature and glass type on the pozzolanic reactivity of glass powder. Cem. Concr. Res. 2014, 58, 103–111. [Google Scholar] [CrossRef]
  18. Harbec, D.; Tagnit-Hamou, A.; Gitzhofer, F. Waste-glass fume synthesized using plasma spheroidization technology: Reactivity in cement pastes and mortars. Constr. Build. Mater. 2016, 107, 272–286. [Google Scholar]
  19. Kamali, M.; Ghahremaninezhad, A. An investigation into the hydration and microstructure of cement pastes modified with glass powders. Constr. Build. Mater. 2016, 112, 915–924. [Google Scholar] [CrossRef]
  20. Lu, J.X.; Poon, C.S. Use of waste glass in alkali activated cement mortar. Constr. Build. Mater. 2018, 160, 399–407. [Google Scholar] [CrossRef]
  21. Zheng, K. Pozzolanic reaction of glass powder and its role in controlling alkali-silica reaction. Cem. Concr. Compos. 2016, 67, 30–38. [Google Scholar] [CrossRef]
  22. Sikora, P.; Horszczaruk, E.; Skoczylas, K.; Rucinska, T. Thermal properties of cement mortars containing waste glass aggregate and nanosilica. Procedia Eng. 2017, 196, 159–166. [Google Scholar] [CrossRef]
  23. Ling, T.C.; Poon, C.S.; Kou, S.C. Feasibility of using recycled glass in architectural cement mortars. Cem. Concr. Compos. 2011, 33, 848–854. [Google Scholar] [CrossRef]
  24. Ling, H.Z.C.S.P.C.L. Utilizing recycled cathode ray tube funnel glass sand as river sand replacement in the high-density concrete. J. Clean. Prod. 2013, 51, 184–190. [Google Scholar] [CrossRef]
  25. Gorospe, K.; Booya, E.; Ghaednia, H.; Das, S. Strength, Durability, and Thermal Properties of Glass Aggregate Mortars. J. Mater. Civ. Eng. 2019, 31, 04019231. [Google Scholar] [CrossRef]
  26. Pan, Z.; Tao, Z.; Murphy, T.; Wuhrer, R. High temperature performance of mortars containing fine glass powders. J. Clean. Prod. 2017, 162, 16–26. [Google Scholar]
  27. Ibrahim, K.I.M. Recycled waste glass powder as a partial replacement of cement in concrete containing silica fume and fly ash. Case Stud. Constr. Mater. 2021, 15, e00630. [Google Scholar] [CrossRef]
  28. Mehta, A.; Ashish, D.K. Silica fume and waste glass in cement concrete production: A review. J. Build. Eng. 2020, 29, 100888. [Google Scholar] [CrossRef]
  29. Yusuf, M.O.; Al-Sodani, K.A.A.; Alateah, A.H.; Al-Tholaia, M.M.H.; Adewumi, A.A.; Bakare, A.O.; Usman, A.K.; Momohjimoh, I. Performances of the synergy of silica fume and waste glass powder in ternary blended concrete. Appl. Sci. 2022, 12, 1–16. [Google Scholar]
  30. ASTM C150-07; Standard Specification for Portland Cement. ASTM International: West Conshohocken, PA, USA, 2007.
  31. ASTM C494/C494M-08; Standard Specification for Chemical Admixtures for Concrete. ASTM International: West Conshohocken, PA, USA, 2008.
  32. ASTM C191-21; Standard Test Methods for Time of Setting of Hydraulic Cement by Vicat Needle. ASTM International: West Conshohocken, PA, USA, 2021.
  33. ASTM C1437-20; Standard Test Method for Flow of Hydraulic Cement Mortar. ASTM International: West Conshohocken, PA, USA, 2020.
  34. ASTM C109/C109M-20; Standard Test Method for Compressive Strength of Hydraulic Cement Mortars (Using 2-in. or [50-mm] Cube Specimens). ASTM International: West Conshohocken, PA, USA, 2020.
  35. BS EN 12390-1: 2000; Testing Hardened Concrete-Part 1: Shape, Dimensions and Other Requirements for Specimens and Molds. British Standards Institution: London, UK, 2000.
  36. Aili, A.; Maruyama, I. Review of several experimental methods for characterization of micro- and nano-scale pores in cement-based material. Int. J. Concr. Struct. Mater. 2020, 14, 1–18. [Google Scholar] [CrossRef]
  37. Khan, M.N.N.; Sarker, P.K. Effect of waste glass fine aggregate on the strength, durability and high temperature resistance of alkali-activated fly ash and GGBFS blended mortar. Constr. Build. Mater. 2020, 263, 120177. [Google Scholar] [CrossRef]
  38. Bekiaris, G.; Bruun, S.; Peltre, C.; Houot, S.; Jensen, L.S. FTIR–PAS: A powerful tool for characterising the chemical composition and predicting the labile C fraction of various organic waste products. Waste Manag. 2015, 39, 45–56. [Google Scholar] [CrossRef] [PubMed]
  39. Otsuka, Y.; Takeuchi, M.; Otsuka, M.; Ben-Nissan, B.; Grossin, D. Effect of carbon dioxide on self-setting apatite cement formation from tetracalcium phosphate and dicalcium phosphate dihydrate; ATR-IR and chemoinformatic analysis. Colloid Polym. Sci. 2015, 239, 2781–2788. [Google Scholar] [CrossRef]
  40. Christensen, A.N.; Jensen, T.R.; Hanson, J.C. Formation of ettringite, Ca6Al2(SO4)3(OH)12·26H2O, AFt, and monosulfate, Ca4Al2O6(SO4)·14H2O, AFm-14, in hydrothermal and hydration of Portland cement and of calcium aluminum oxide—calcium sulfate dihydrate mixtures studied by in situ synchrotron X-ray powder diffraction. J. Solid State Chem. 2004, 177, 1944–1951. [Google Scholar] [CrossRef]
  41. Carsana, M.; Frassoni, M.; Bertolini, L. Comparison of ground waste glass with other supplementary cementitious materials. Cem. Concr. Compos. 2014, 45, 39–45. [Google Scholar] [CrossRef]
  42. Richhariya, G.; Dora, D.T.K.; Parmar, K.R.; Pant, K.K.; Singhal, N.; Lal, K.; Kundu, P.P. Development of self-healing cement slurry through the incorporation of dual-encapsulated polyacrylamide for the prevention of water ingress in oil well. Materials 2020, 13, 2921. [Google Scholar] [CrossRef]
  43. Feng, P.; Bullard, J.W. A multiscale microstructure model of cement paste sulfate attack by crystallization pressure a multiscale microstructure model of cement paste sulfate a ack by crystallization pressure. Model. Simul. Mater. Sci. Eng. 2017, 25, 065013. [Google Scholar] [CrossRef]
Figure 1. Glass waste at dumpsite in Hafr Al-Batin.
Applsci 12 08600 g001
Figure 2. XRD diffractogram of the glass waste and cement powder.
Applsci 12 08600 g002
Figure 3. SEM micrographs of raw materials: (a) cement powder and (b) glass waste powder.
Applsci 12 08600 g003
Figure 4. Effect of glass on the setting time of mortar.
Applsci 12 08600 g004
Figure 5. (a) Variation of flow with glass powder content in mortar. (b) Variation of flow with glass powder content in concrete.
Applsci 12 08600 g005aApplsci 12 08600 g005b
Figure 6. Effect of glass on the density of mortar.
Applsci 12 08600 g006
Figure 7. Experimental and predicted density value of glass blended cement mortar.
Applsci 12 08600 g007
Figure 8. Variation of strength with glass powder in mortar.
Applsci 12 08600 g008
Figure 9. Experimental and predicted value of glass blended cement mortar.
Applsci 12 08600 g009
Figure 10. Compressive strength of glass blended concrete.
Applsci 12 08600 g010
Figure 11. Correlation between experimental and predicted compressive strength values of glass blended concrete.
Applsci 12 08600 g011
Figure 12. (a) Morphology of glass powder blended paste, (b) Morphology of ordinary Portland cement paste (Calcium silicate hydrate (CSH), Calcium silicate (CC)).
Applsci 12 08600 g012
Figure 13. Microstructure of OPC and glass blended pastes (calcium-silicate-hydrate ((CSH) and Ettringite (Aft)).
Applsci 12 08600 g013
Figure 14. FTIR spectra of glass blended and hydrated cement mortar.
Applsci 12 08600 g014
Figure 15. XRD diffractogram of glass blended mortar.
Applsci 12 08600 g015
Figure 16. Residual strength of glass blended concrete exposed to elevated temperature.
Applsci 12 08600 g016
Figure 17. Residual density of glass blended concrete exposed to elevated temperature.
Applsci 12 08600 g017
Table 1. Oxide composition of raw materials.
OxidesCementGlass
SiO220.1768.1
Al2O35.580.9
Fe2O32.860.6
CaO63.5114.5
MgO3.151.8
Na2O0.1212.2
K2O0.570.8
SO32.560.4
SiO2 + Al2O3 + Fe2O326.8969.6
Specific gravity (water)3.142.48
Specific surface area (m2/kg)329.5223.0
LOI (%)2.800.80
Table 2. Property of fine aggregate.
PropertyValues
Fineness modulus2.61
Specific gravity2.57
Table 3. Mixture proportion in 1 m3 cement–glass binary blended mortar.
Sample IDWater (kg/m3)Sand (kg/m3)Cement * (kg/m3)Glass Waste * (kg/m3)Superplasticizers (kg/m3)Sand Absorption (%)w/c RatioSand/Binder Ratio
MG0140962.535004.951.750.42.75
MG5140962.5332.517.54.951.750.42.75
MG10140962.5297.5354.951.750.42.75
MG15140962.5243.5544.951.750.42.75
MG20140962.5173.5704.951.750.42.75
* Total binder = cement + glass powder.
Table 4. Mixture proportion in 1 m3 of cement–glass binary blended concrete.
MixesCement * (kg/m3)Glass * (kg/m3)Fine Aggregate
(kg/m3)
Coarse Aggregate
(kg/m3)
Water
(kg/m3)
SP
(kg/m3)
w/Binder RatioFine/Total Aggregates
C100G0350076711281471.750.420.40
C90G103153573511201471.750.420.40
C80G202807073811201471.750.420.40
C70G3024510573711201471.750.420.40
* C100G0 means 100% cement and zero percent glass.
Publisher’s Note: MDPI stays neutral with regard to jurisdictional claims in published maps and institutional affiliations.

