
Contact Fatigue State Identification of Specimen Based on Heterogeneous Data and Evidence Theory

Abstract
1. Introduction
2. Methodology
2.1. Vibration Signal Visualization Method
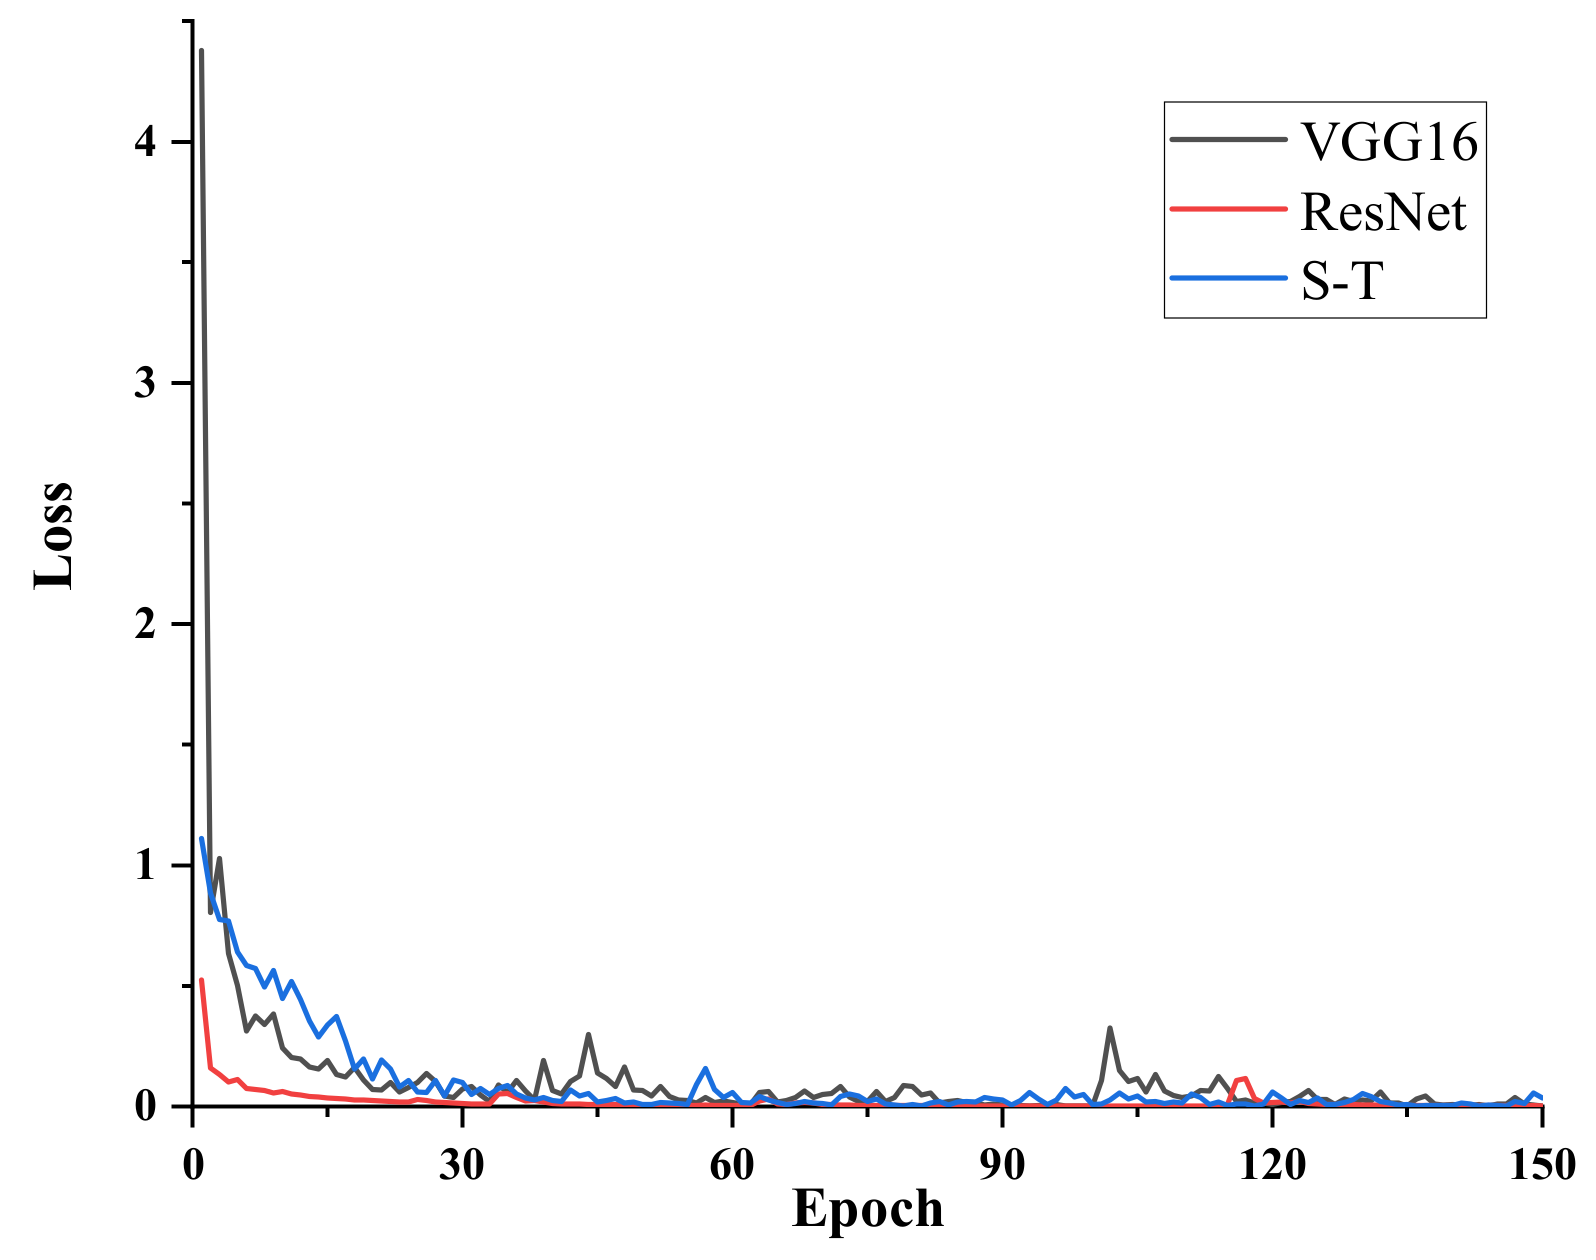
2.2. Neural Network Model
2.3. D-S Evidence Theory
3. Contact Fatigue State Identification
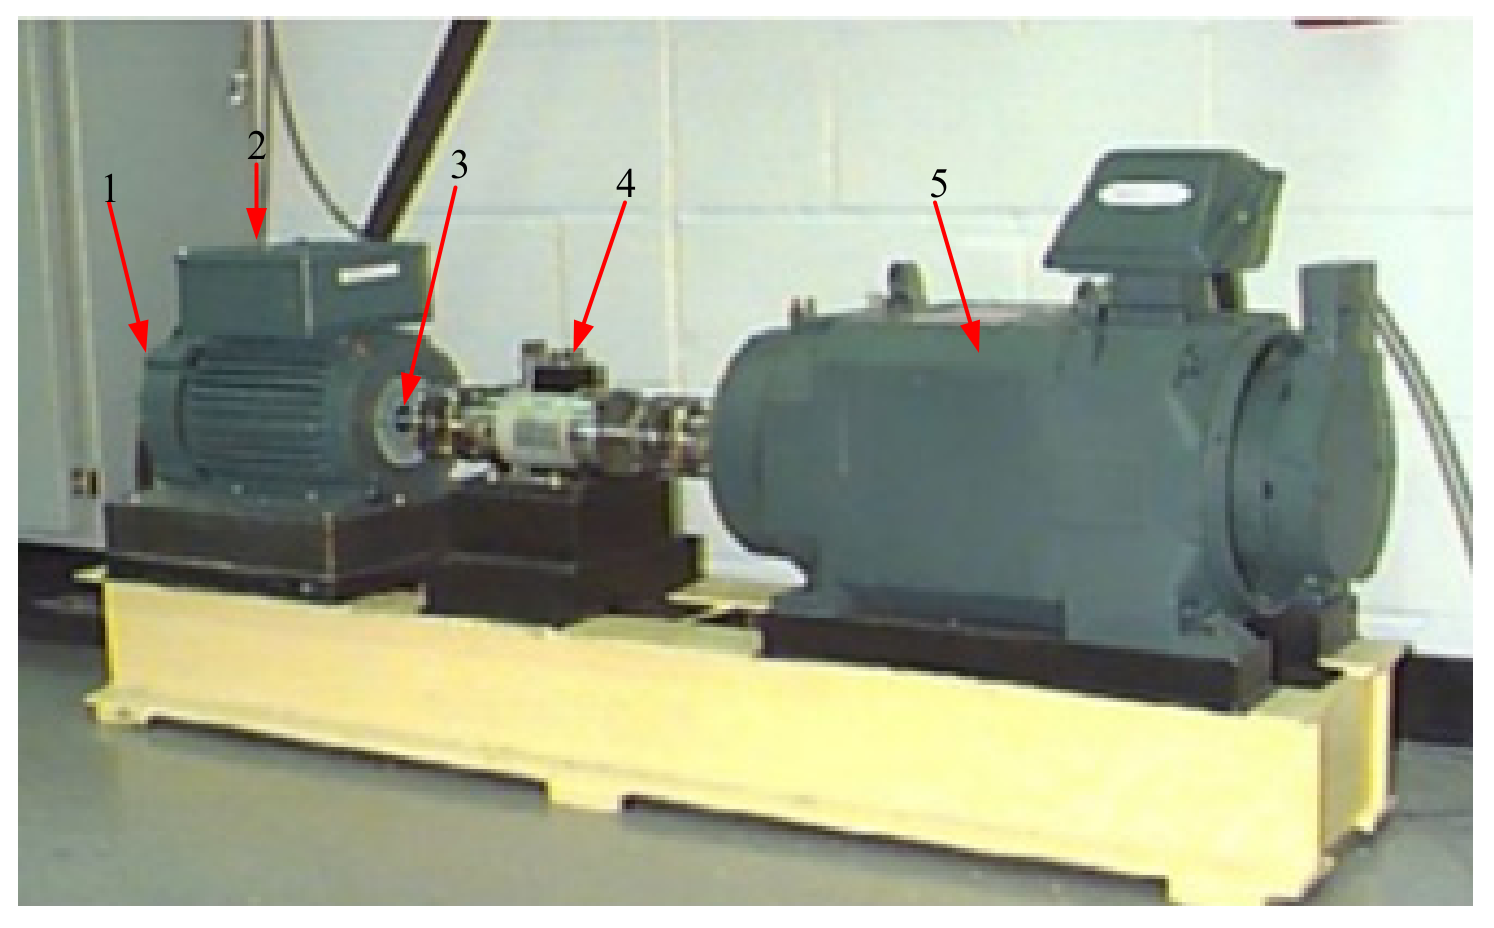
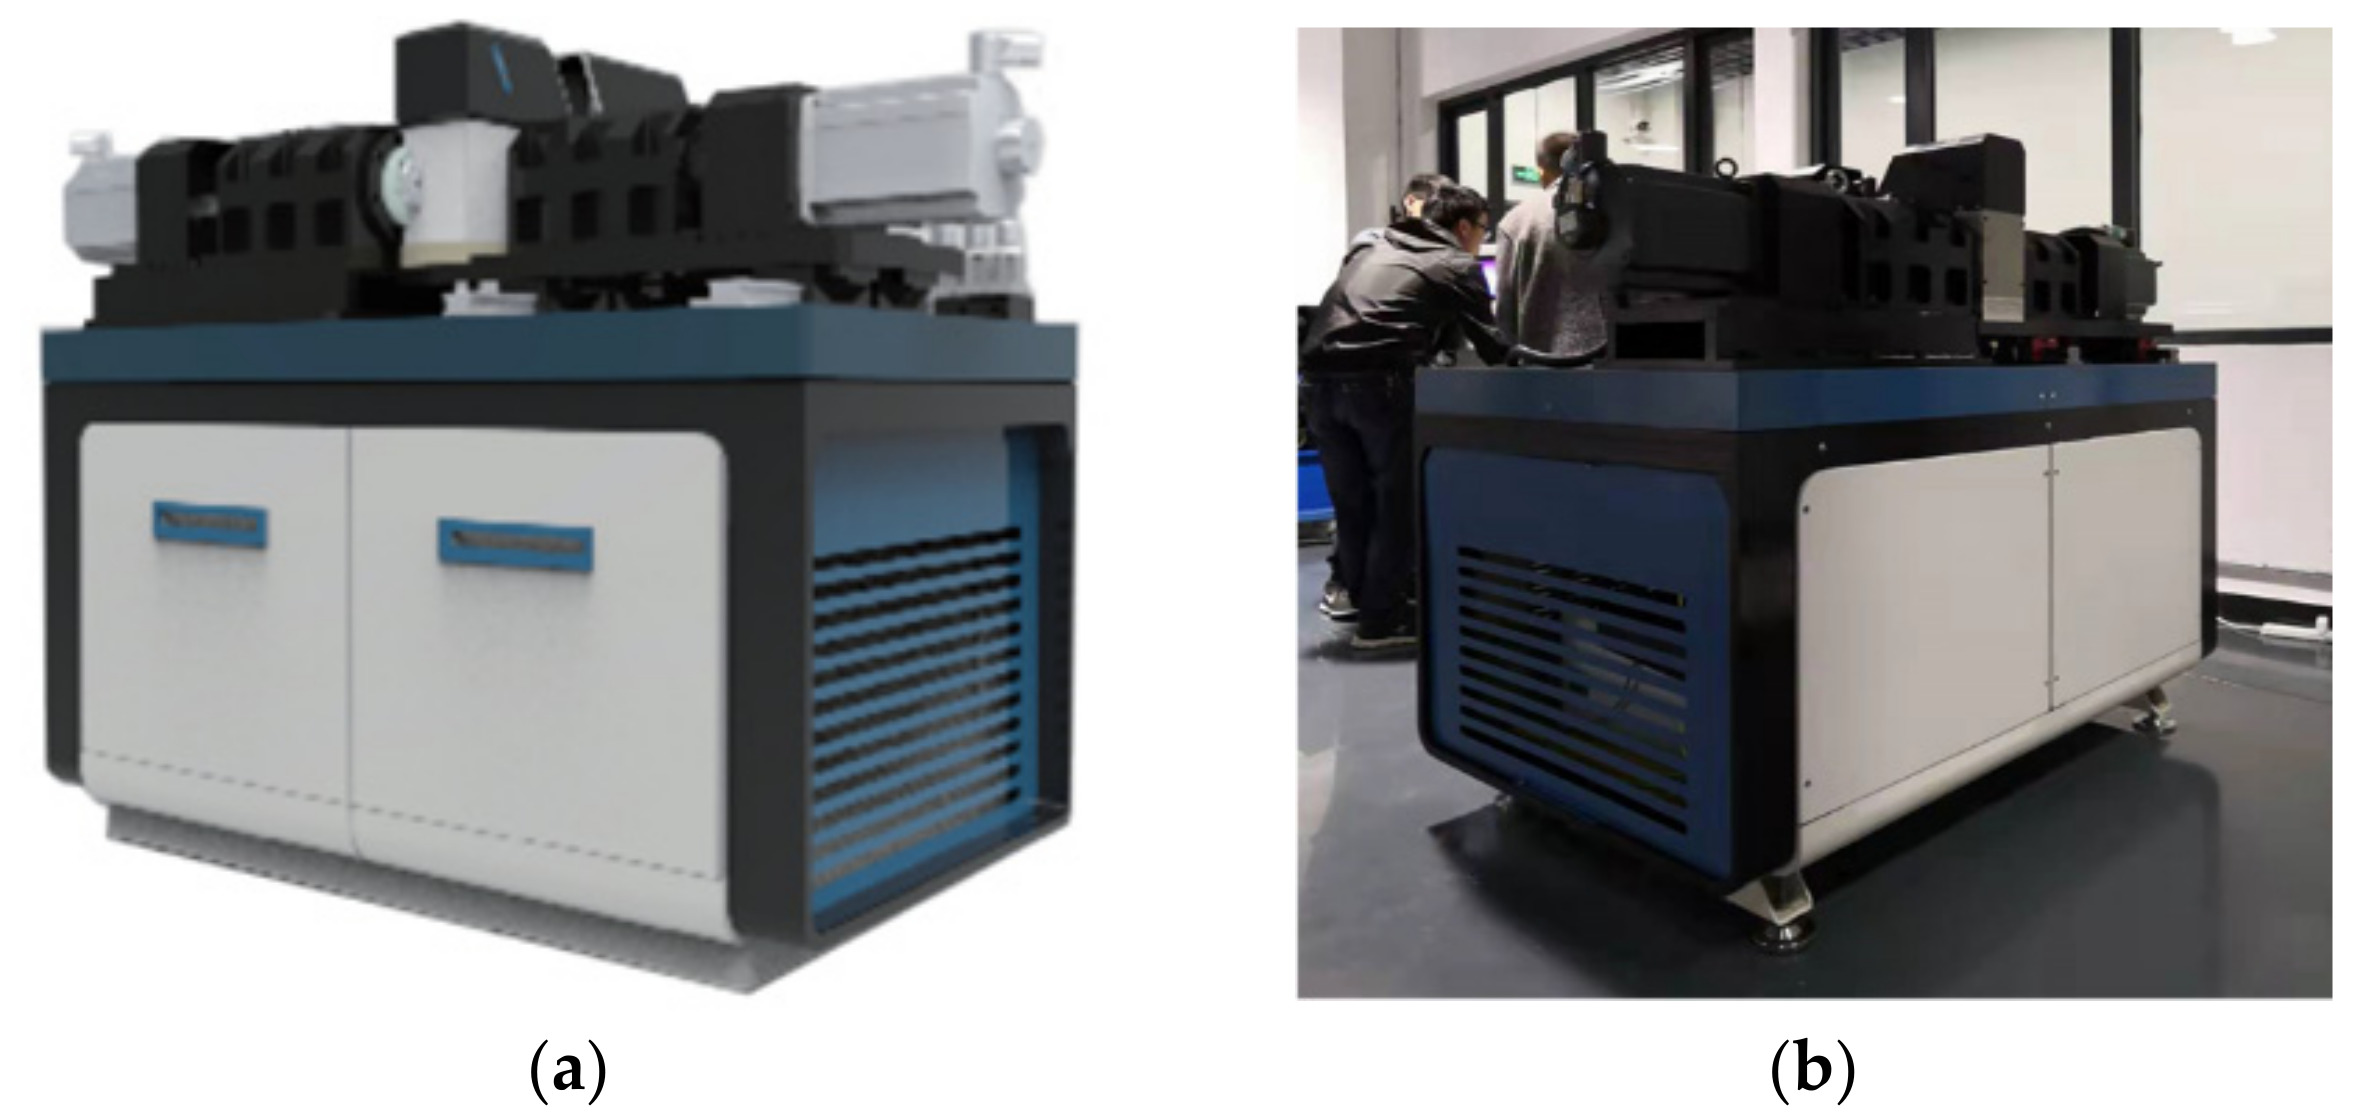
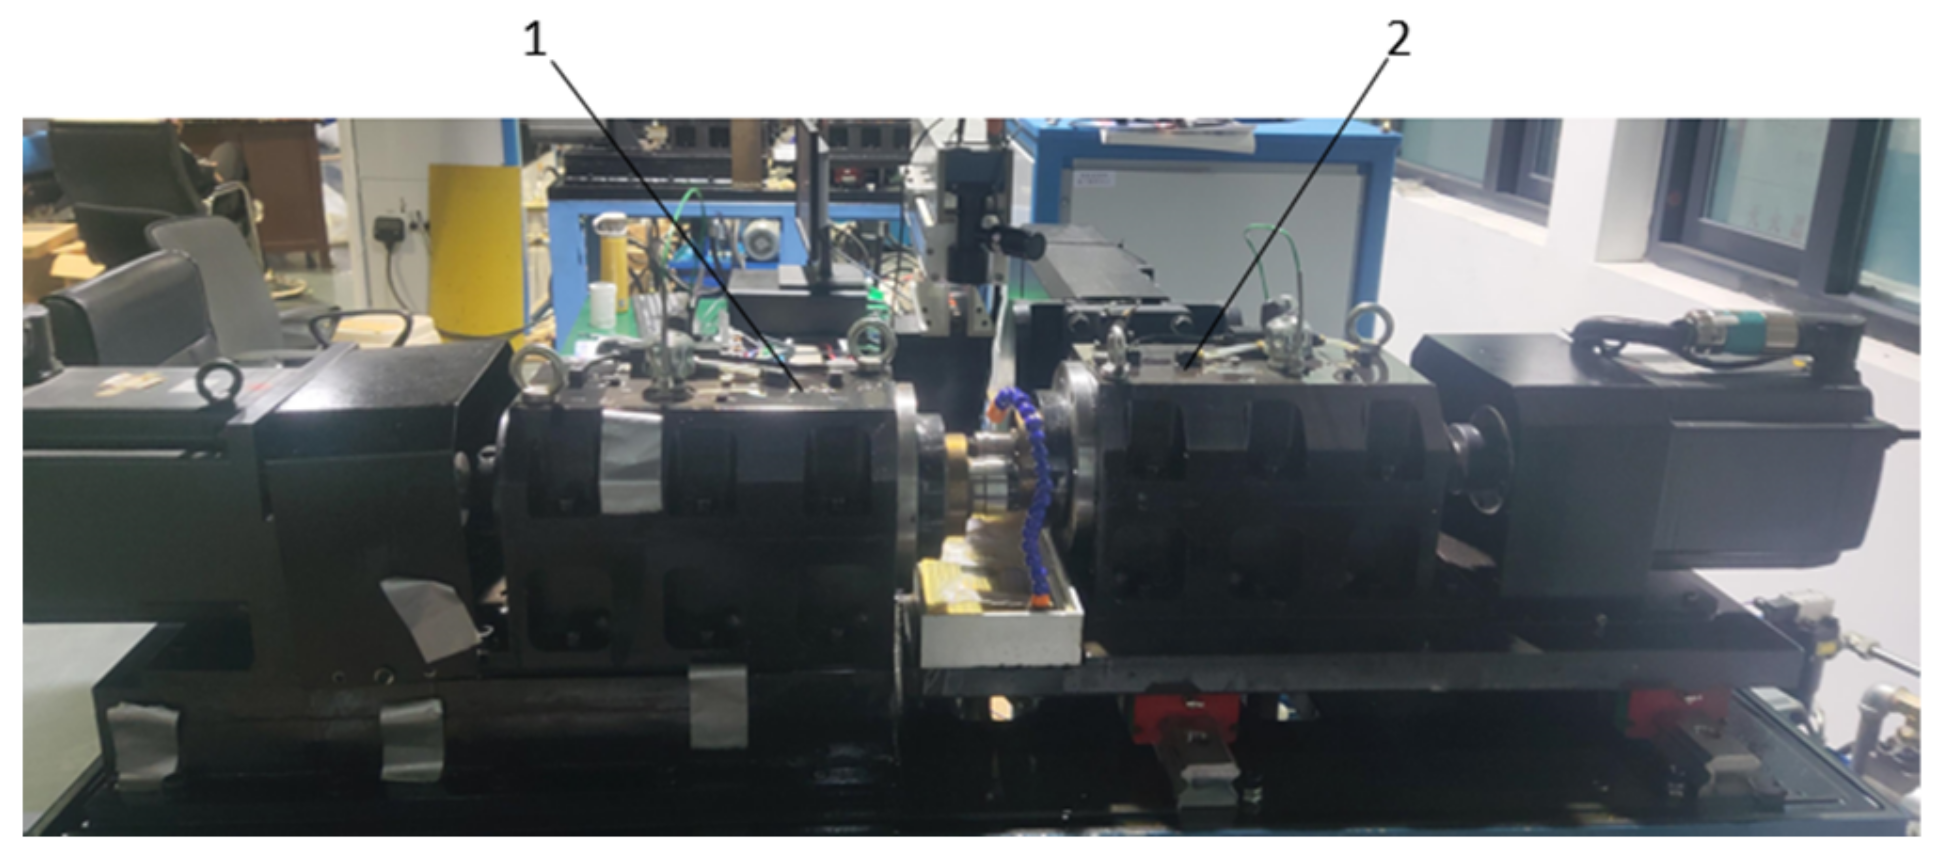
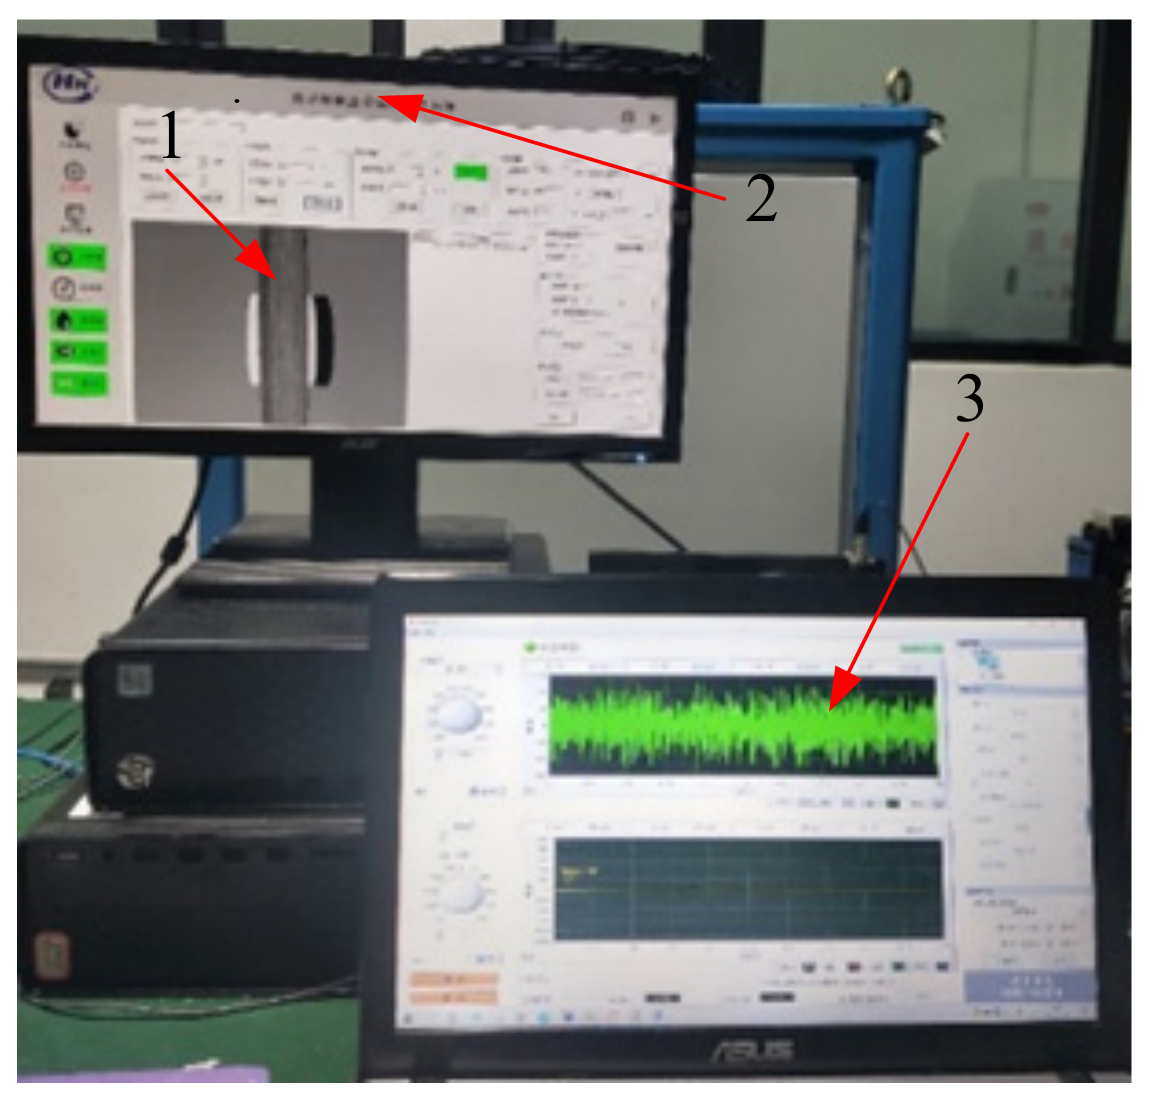
3.1. Introduction of Rolling Contact Fatigue Test Equipment
3.2. Rolling Contact Fatigue Test
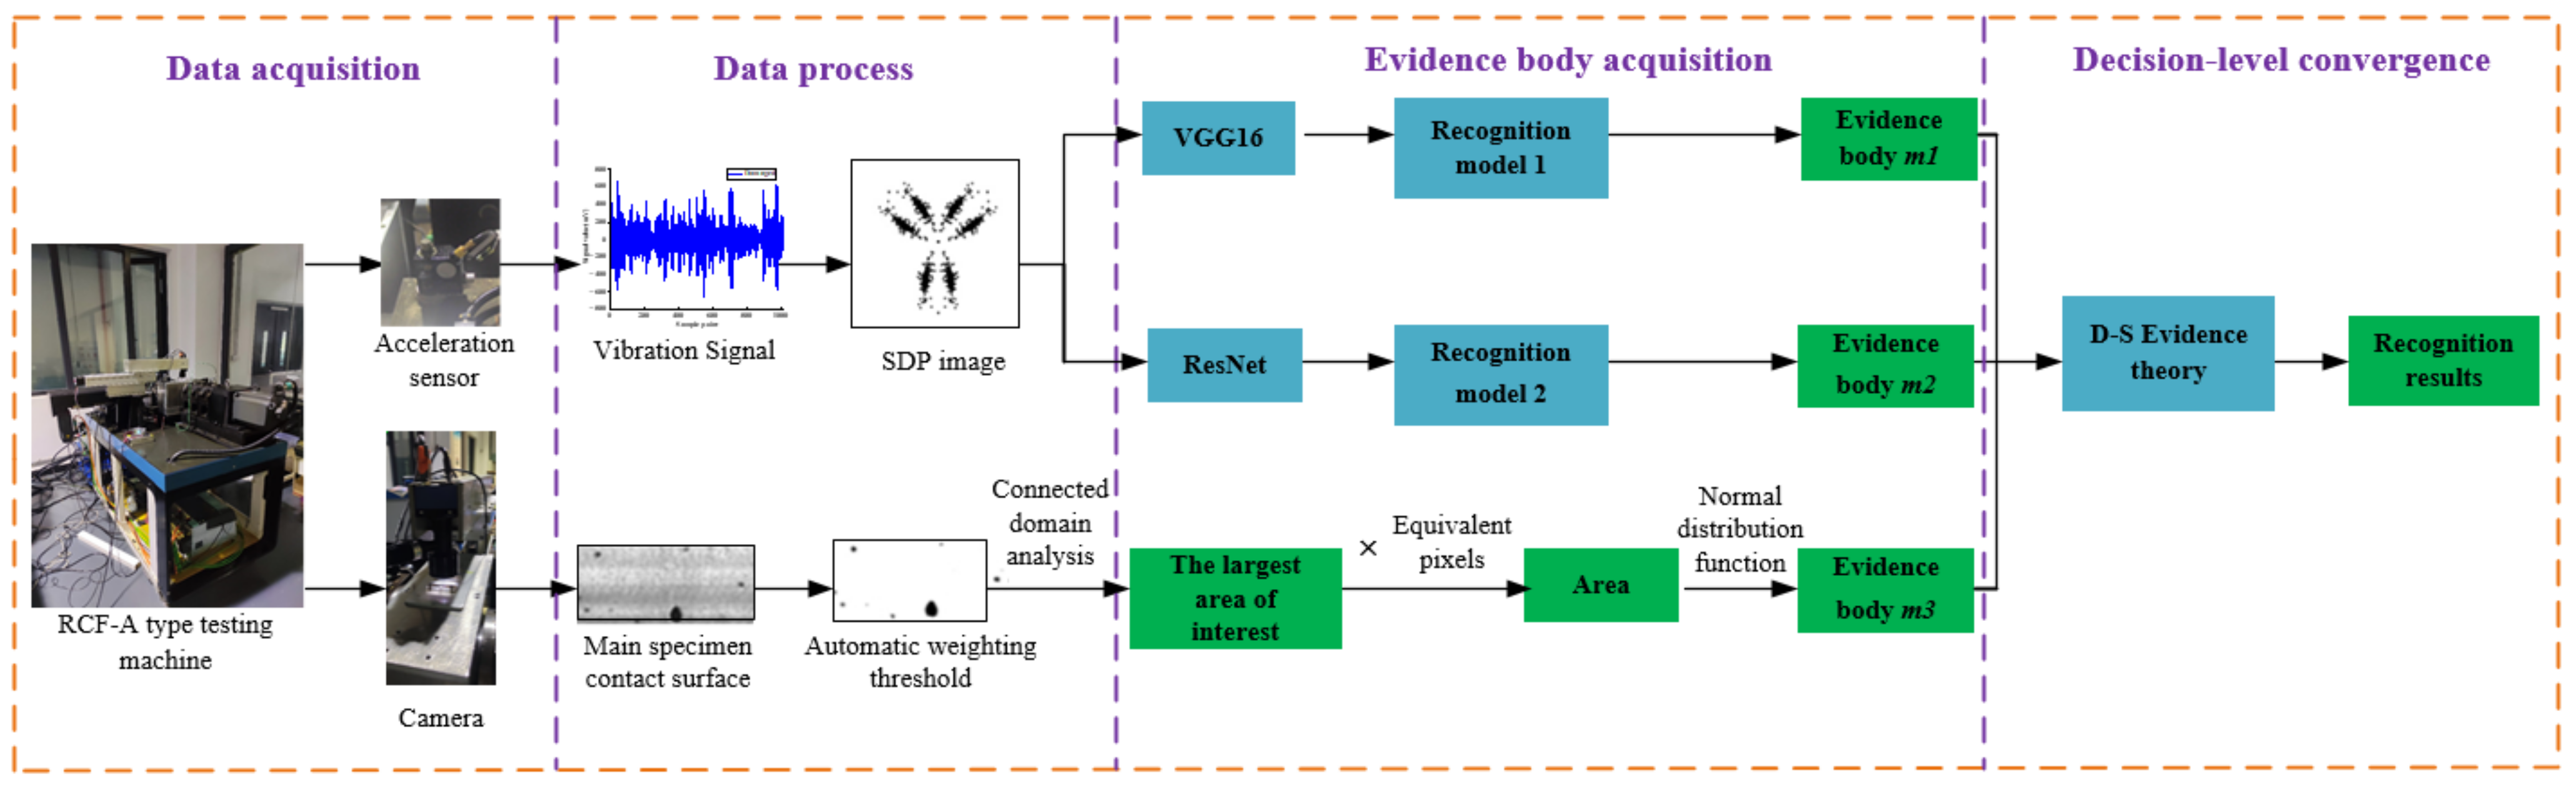
3.3. Contact Fatigue State Identification Method
- (1)
- The vibration signals collected in the test under the same working conditions are randomly divided into training set, test set and verification set according to a certain proportion.
- (2)
- The SDP method is used to convert the vibration signals into images.
- (3)
- For the transformed training set and test set SDP images, we train the VGG16 model and the ResNet model respectively.
- (4)
- For the vibration signal of the verification set, we use the trained VGG16 model and the ResNet model to identify the state, respectively, and obtain two state identification evidence bodies m1 and m2 based on the vibration information source.
- (5)
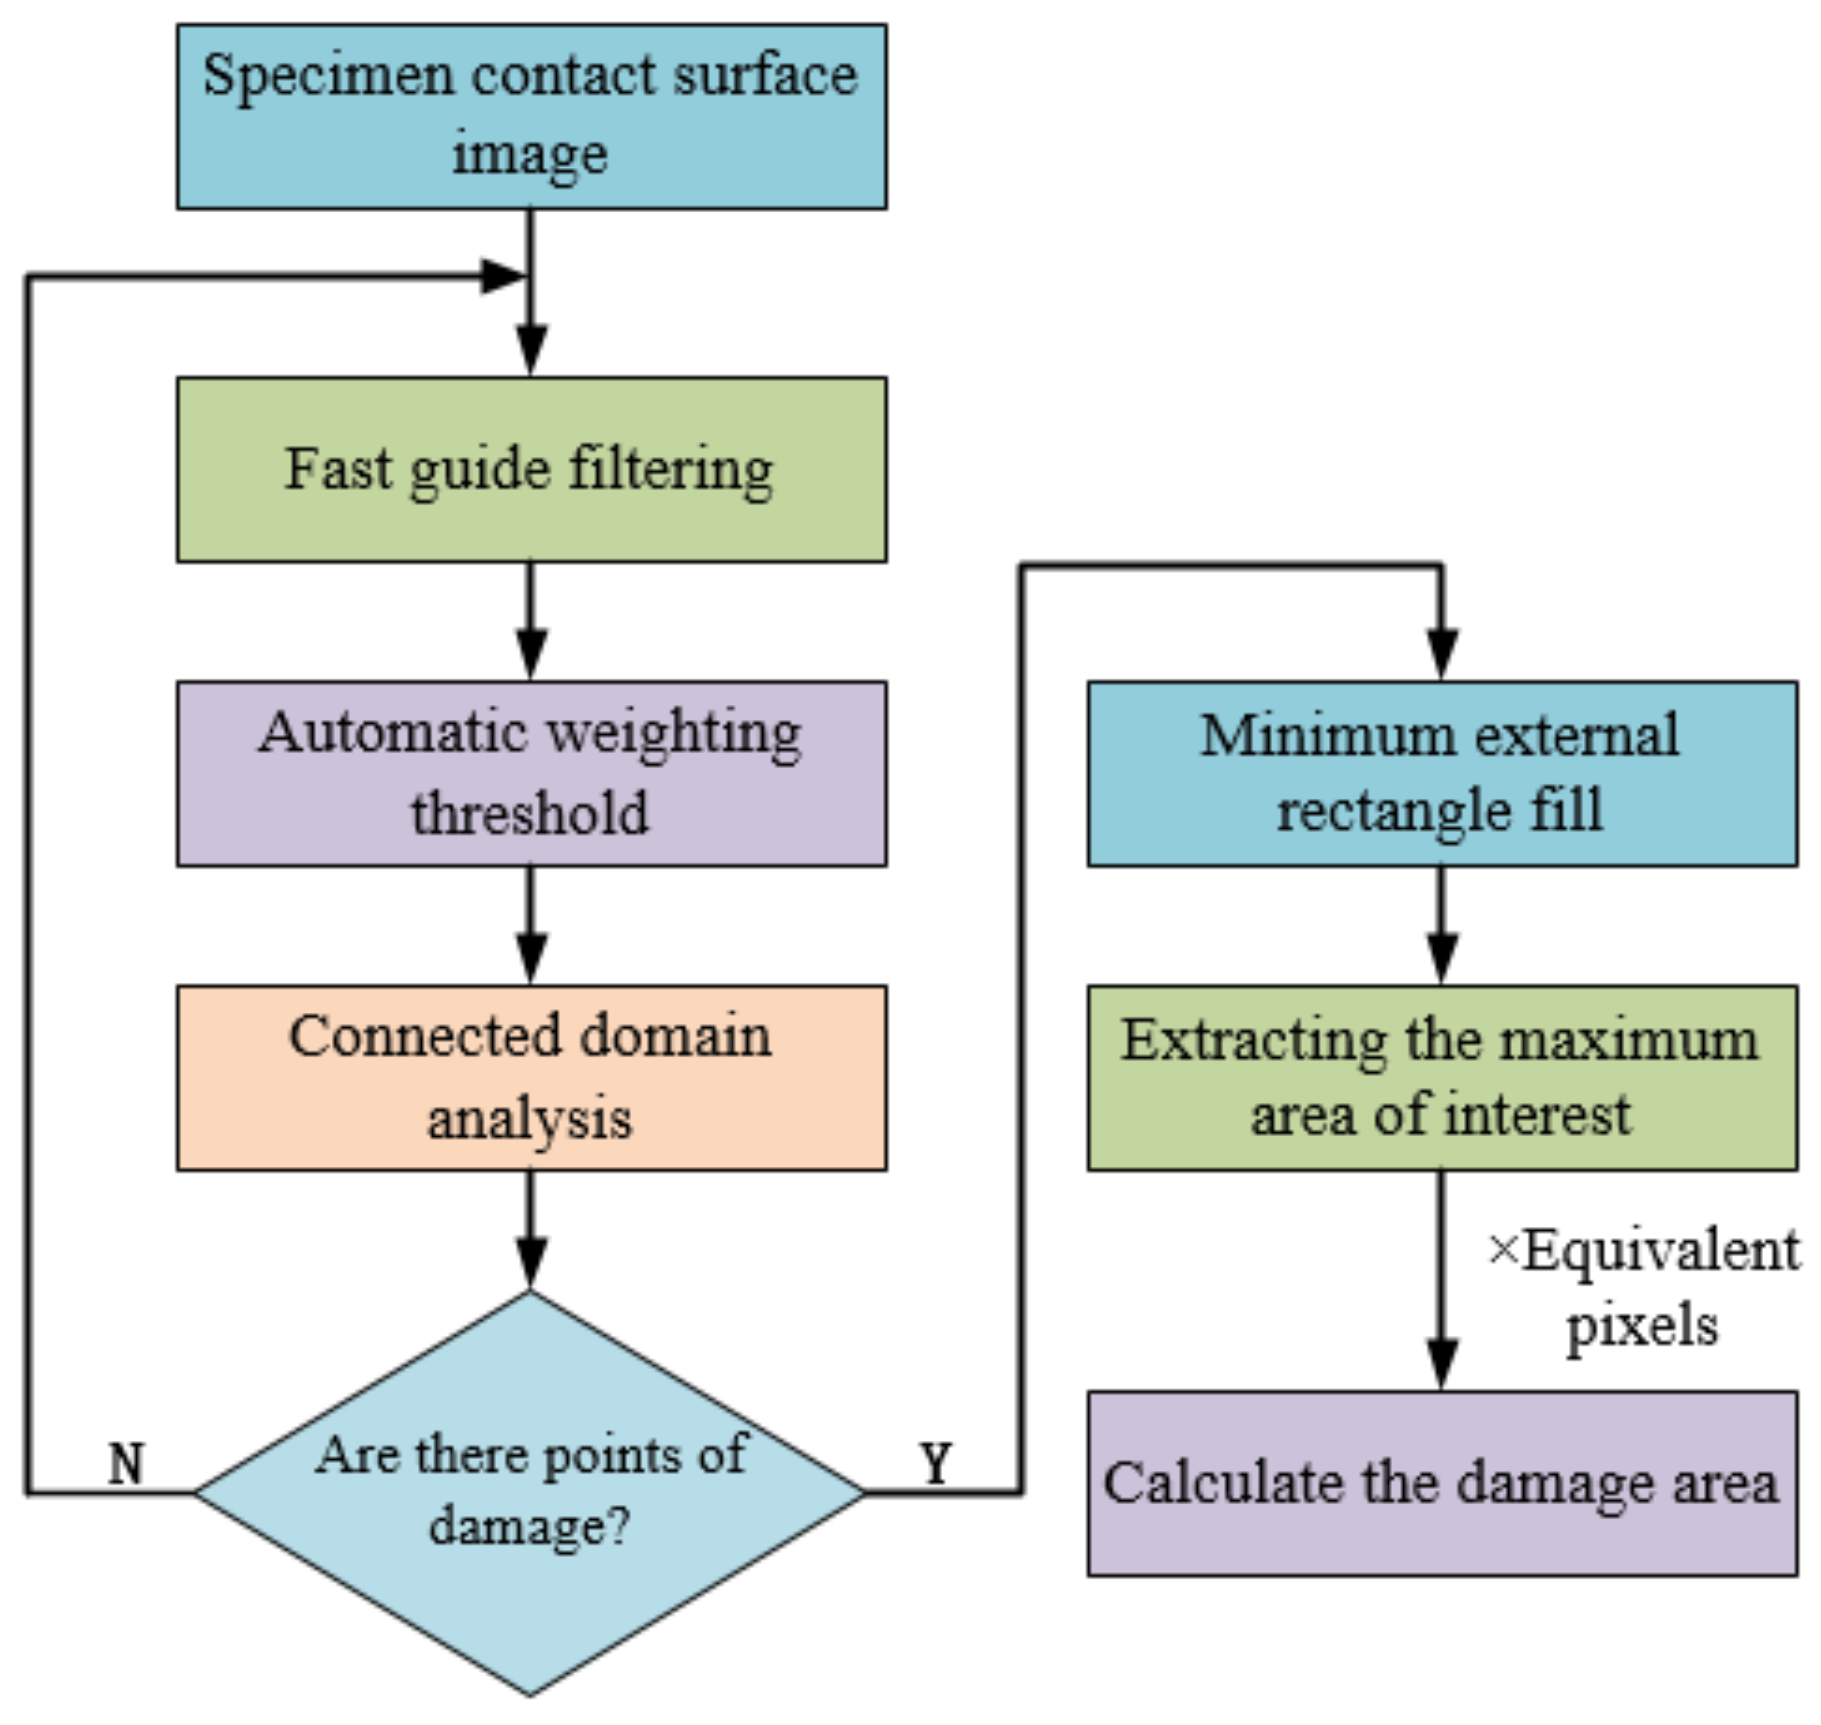
- For the image signal, we first perform the denoising processing, and then combine the fatigue defect identification method based on automatic weighted threshold and the dynamic compensation method for detection error, based on fatigue defect edge features proposed by the research group [6]. We then calculate the fatigue damage area and obtain evidence body m3 based on image information source.
- (6)
- On this basis, we fuse the evidence bodies m1, m2 and m3, and make a decision to obtain the contact fatigue state identification result of the specimen.
3.4. Contact Fatigue State Identification of Specimen
3.4.1. Vibration Signal Processing
3.4.2. Image Signal Processing
3.4.3. State Identification Results and Analysis
4. Conclusions
Author Contributions
Funding
Conflicts of Interest
References
- Jia, L.; Yang, Y.; Zhang, H. Rolling contact fatigue test of superhard coated bearings. Bearing 2010, 36–38. [Google Scholar] [CrossRef]
- Yin, Y.; Zhu, Y.; Wang, X.; Jie, T. Analysis and study of fatigue failure process of rolling bearings. Lubr. Seal. 1997, 22–23, 27. Available online: http://www.cnki.com.cn/Article/CJFDTotal-RHMF199705007.htm (accessed on 6 July 2022).
- Schneider, S.; Herrmann, R.; Marx, S. Development of a resonant fatigue testing facility for large-scale beams in bending. Int. J. Fatigue 2018, 113, 171–183. [Google Scholar] [CrossRef]
- Solazzi, L.; Petrogalli, C.; Lancini, M. Vibration based diagnostics on rolling contact fatigue test bench. Procedia Eng. 2011, 10, 3465–3470. [Google Scholar] [CrossRef][Green Version]
- Bodini, I.; Petrogalli, C.; Mazzù, A.; Faccoli, M.; Lancini, M.; Pasinetti, S.; Sansoni, G.; Docchio, F. On-Line 2D Monitoring of Rolling Contact Fatigue/Wear Phenomena in Dry Tests. J. Phys. Conf. Ser. 2017, 882, 012012. [Google Scholar] [CrossRef]
- Yang, C.; Huang, L.; Feng, K.; Liu, C. Online detection of rolling contact fatigue failure based on machine vision. Instrum. Technol. Sens. 2019, 65–69, 74. Available online: https://scfw.cqut.edu.cn/rwt/22/https/NNYHGLUDN3WXTLUPMW4A/kcms/detail/detail.aspx?dbcode=CJFD&dbname=CJFDLAST2019&filename=YBJS201904016&uniplatform=NZKPT&v=EO2oa8ynbIUT8WJVXhbFsiTLvTPLkh620RlBQaGWdv8Xhh4Nw2er0D4ezHIB38wn (accessed on 6 July 2022).
- Manoj, V.; Shenoy, K.; Gopinath, K. Developmental studies on rolling contact fatigue test rig. Wear 2008, 264, 708–718. [Google Scholar] [CrossRef]
- Shun, L.; Wen, J. A model-based fault detection and diagnostic methodology based on PCA method and wavelet transform. Energe Build. 2014, 68, 63–71. [Google Scholar] [CrossRef]
- Han, Z.; Zhu, X.; Li, W. A false component identification method of EMD based on Kullback-leibler divergence. Proc. Csee 2012, 32, 112–117. Available online: http://en.cnki.com.cn/Article_en/CJFDTOTAL-ZGDC201211017.htm (accessed on 6 July 2022).
- Su, X. Research on Non-Contact Multi-Sensor Acoustic Emission Signal Fusion and Diagnosis Technology for Rolling Bearing Failure. Doctoral Dissertation, Northeast Petroleum University, Daqin, China, 2012. [Google Scholar]
- Duan, L.; Li, T.; Tang, Y.; Yang, J.; Liu, W. Mechanical fault diagnosis method based on multi-source heterogeneous information fusion. Pet. Mach. 2021, 49, 60–67, 80. [Google Scholar] [CrossRef]
- Liu, J.; Huang, Y.; Huang, X.; Xia, X.; Chen, Y.W. Dynamic Facial Features in Positive-Emotional Speech for Identification of Depressive Tendencies. In Innovation in Medicine and Healthcare; Springer: Singapore, 2020; pp. 127–134. [Google Scholar] [CrossRef]
- Ma, W.; Lv, J.; Wu, H.; Huang, T. Application of multi-sensor information fusion in rolling bearing fault diagnosis. Sens. Microsyst. 2013, 32, 132–135. [Google Scholar] [CrossRef]
- Kächele, M.; Glodek, M.; Zharkov, D.; Meudt, S.; Schwenker, F. Fusion of Audio-Visual Features Using Hierarchical Classifier Systems for the Recognition of Affective States and the State of Depression. In Proceedings of the 3rd International Conference on Pattern Recognition Applications and Methods, ICPRAM 2014, Angers, France, 6–8 March 2014; pp. 671–678. [Google Scholar] [CrossRef]
- Yang, C. Research on Depression Recognition Technology Based on Speech and Facial Features. Southwestern University, 2019. Available online: http://cdmd.cnki.com.cn/Article/CDMD-10635-1019913548.htm (accessed on 6 July 2022).
- Xu, X.; Wang, S.; Liu, H. Real-time detection of centrifugal fan stall based on SDP and image matching. J. Power Eng. 2015, 35, 906–911. [Google Scholar] [CrossRef]
- Lu, G.; Chen, G.; Zeng, S.; Li, S.; Yan, P. Mechanical condition anomaly detection algorithm based on vibration image features. Vibration. Test. Diagn. 2022, 42, 148–153+201. Available online: http://qikan.cqvip.com/Qikan/Article/Detail?id=7106598137 (accessed on 6 July 2022).
- Zheng, W.; Lin, R.; Wang, J.; Li, Z. Power quality disturbance classification based on GAF and convolutional neural network. Power Syst. Prot. Control 2021, 49, 97–104. [Google Scholar] [CrossRef]
- Shibata, K.; Takahashi, A.; Shirai, T. Fault diagnosis of rotating machinery through visualization of sound signals. Mech. Syst. Signal Processing 2000, 14, 229–241. [Google Scholar] [CrossRef]
- Case Western Reserve University. Available online: https://engineering.case.edu/bearingdatacenter/download-data-file (accessed on 6 July 2022).
- Available online: https://www.researchgate.net/figure/The-CWRU-bearing-testing-bench_fig4_337917959 (accessed on 6 July 2022).
- Zhang, C.; Wang, W.; Li, H. Tool wear prediction method based on symmetrized dot pattern and multicovariance Gaussian process regression, 2021. Measurement 2022, 189, 110466. [Google Scholar] [CrossRef]
- Li, H.; Wang, W.; Huang, P.; Li, Q. Fault diagnosis of rolling bearing using symmetrized dot pattern and density-based clustering. Measurement 2020, 152, 107293. [Google Scholar] [CrossRef]
- Wang, W.; Jia, W.Y.; Yin, X.T.; Zhang, L.M.; Bai, Y.M. Development and Prospect of artificial neural networks. Smart City 2021, 7, 12–13. Available online: https://d.wanfangdata.com.cn/periodical/zncs202108007 (accessed on 6 July 2022).
- Zhou, N.; Ou, Y. Convolutional neural network development. J. Liaoning Univ. Sci. Technol. 2021, 44, 349–356. Available online: http://www.cnki.com.cn/Article/CJFDTotal-ASGT202105004.htm (accessed on 6 July 2022).
- Zhang, X.; Zou, J.; He, K.; Jian, S. Accelerating very deep convolutional networks for classification and detection. IEEE Trans. Pattern Anal. Mach. Intell. 2016, 38, 1943–1955. [Google Scholar] [CrossRef]
- He, K.; Zhang, X.; Ren, S.; Sun, J. Deep Residual Learning for Image Recognition. In Proceedings of the 2016 IEEE Conference on Computer Vision and Pattern Recognition, Las Vegas, NV, USA, 27–30 June 2016; pp. 770–778. Available online: https://ieeexplore.ieee.org/document/7780459 (accessed on 6 July 2022).
- Liu, Z.; Lin, Y.; Cao, Y.; Hu, H.; Wei, Y.; Zhang, Z.; Lin, S.; Guo, B. Swin Transformer: Hierarchical Vision Transformer using Shifted Windows. In Proceedings of the 2021 IEEE/CVF International Conference on Computer Vision (ICCV), Montreal, QC, Canada, 10–17 October 2021; pp. 9992–10002. [Google Scholar] [CrossRef]
- Guan, X.; Yi, X.; Hu, L.; Liu, H. Conflicting Evidence Reasoning and Fusion; Beijing Electronic Industry Press: Beijing, China, 2020. [Google Scholar]
- YB/T 5345.2006; Test Method for Rolling Contact Fatigue of Metallic Materials, 2006. Available online: https://max.book118.com/html/2019/0528/7004116131002030.shtm (accessed on 6 July 2022).
- Feng, K. Research on Visual Detection Method of Rolling Contact Fatigue Surface Features. Chongqing University of Technology, 2019. Available online: https://xueshu.baidu.com/usercenter/paper/show?paperid=10180g20ng140mh0ts1n0js063270105&site=xueshu_se&hitarticle=1 (accessed on 29 May 2020).
- Xu, H.; Feng, K.; Huang, L.; Xiong, L.; Yang, C. Improved Otsu algorithm for rolling contact fatigue defect detection. J. Comput. Aided Des. Graph. 2019, 31, 1130–1138. [Google Scholar] [CrossRef]
- Song, H. Research and Application of ROC Curve Evaluation. Second Military Medical University, 2006. Available online: https://d.wanfangdata.com.cn/thesis/ChJUaGVzaXNOZXdTMjAyMjA1MjYSB1k4OTczMjgaCGpvcXA5ZDds (accessed on 6 July 2022).


| Damage Diameter (mm) | Motor Load (w) | Motor Speed (r/min) | Bearing Number | Status Number |
|---|---|---|---|---|
| 0 | 3 | 1730 | Ball_0 | 0 |
| 0.3556 | 3 | 1730 | Ball_1 | 1 |
| 0.5334 | 3 | 1730 | Ball_2 | 2 |
| Bearing Number | Vibration Acquisition Signal | Transformation Method | ||
|---|---|---|---|---|
| SDP | GAF | GRI | ||
| Ball_0 |  |  |  |  |
 |  |  |  | |
 | | | | |
 |  |  |  | |
| Ball_1 |  |  |  |  |
 |  |  |  | |
| | | | |
 |  |  |  | |
| Ball_2 |  |  |  |  |
 |  |  |  | |
| | | | |
 |  |  |  | |
| Image Type and Size | Sample Type | Data Set Size | Epoch | Batch_Size | Learning Rate |
|---|---|---|---|---|---|
| SDP 224 × 224 | Training samples | 1200 | 150 | 32 | 0.001 |
| Test samples | 300 | ||||
| GAF 64 × 64 | Training samples | 1200 | 150 | 32 | 0.001 |
| Test samples | 300 | ||||
| GRI 32 × 32 | Training samples | 1200 | 150 | 32 | 0.001 |
| Test samples | 300 |
| Test Sample Number | Transformation Method | Type of Damage | ||
|---|---|---|---|---|
| SDP | GAF | GRI | ||
| 1 | 0 | 0 | 0 | 0 |
| 2 | 0 | 0 | 0 | |
| 3 | 0 | 0 | 0 | |
 | | | | |
| 98 | 0 | 0 | 0 | |
| 99 | 0 | 0 | 0 | |
| 100 | 0 | 0 | 0 | |
| 1 | 1 | 1 | 1 | 1 |
| 2 | 1 | 1 | 1 | |
| 3 | 1 | 1 | 1 | |
| | | | |
| 98 | 1 | 1 | 1 | |
| 99 | 1 | 1 | 1 | |
| 100 | 1 | 2(×) | 1 | |
| 1 | 2 | 2 | 2 | 2 |
| 2 | 2 | 2 | 2 | |
| 3 | 2 | 2 | 2 | |
| | | | |
| 98 | 2 | 2 | 2 | |
| 99 | 2 | 2 | 2 | |
| 100 | 2 | 1(×) | 2 | |
| Number of identification errors | 0 | 2 | 0 | / |
| Accuracy | 100% | 99.33% | 100% | / |
| Model | Sample Type | Data Set Size | Epoch | Batch Size | Learning Rate |
|---|---|---|---|---|---|
| VGG16 | Training samples | 1200 | 150 | 32 | 0.001 |
| Test samples | 300 | ||||
| ResNet | Training samples | 1200 | 150 | 32 | 0.001 |
| Test samples | 300 | ||||
| S-T | Training samples | 1200 | 150 | 32 | 0.0003 |
| Test samples | 300 |
| Test Sample Number | Recognition Model | Type of Damage | ||
|---|---|---|---|---|
| VGG16 | ResNet | S-T | ||
| 1 | 0 | 0 | 0 | 0 |
| 2 | 0 | 0 | 0 | |
| 3 | 0 | 0 | 0 | |
| | | | |
| 98 | 0 | 0 | 0 | |
| 99 | 0 | 0 | 0 | |
| 100 | 0 | 0 | 0 | |
| 1 | 1 | 1 | 1 | 1 |
| 2 | 1 | 1 | 1 | |
| 3 | 1 | 1 | 1 | |
| | | | |
| 98 | 1 | 1 | 1 | |
| 99 | 1 | 1 | 1 | |
| 100 | 1 | 1 | 1 | |
| 1 | 2 | 2 | 2 | 2 |
| 2 | 2 | 2 | 2 | |
| 3 | 2 | 2 | 2 | |
| | | | |
| 98 | 2 | 2 | 2 | |
| 99 | 2 | 2 | 2 | |
| 100 | 2 | 2 | 2 | |
| Number of identification errors | 0 | 0 | 0 | / |
| Accuracy | 100% | 100% | 100% | / |
| Signal | Sample Frequency/Hz | Sample Interval/min | Time per Sampling/s |
|---|---|---|---|
| Vibration | 10k | 2 | 1 |
| Image | 1 | 10 | 1 |
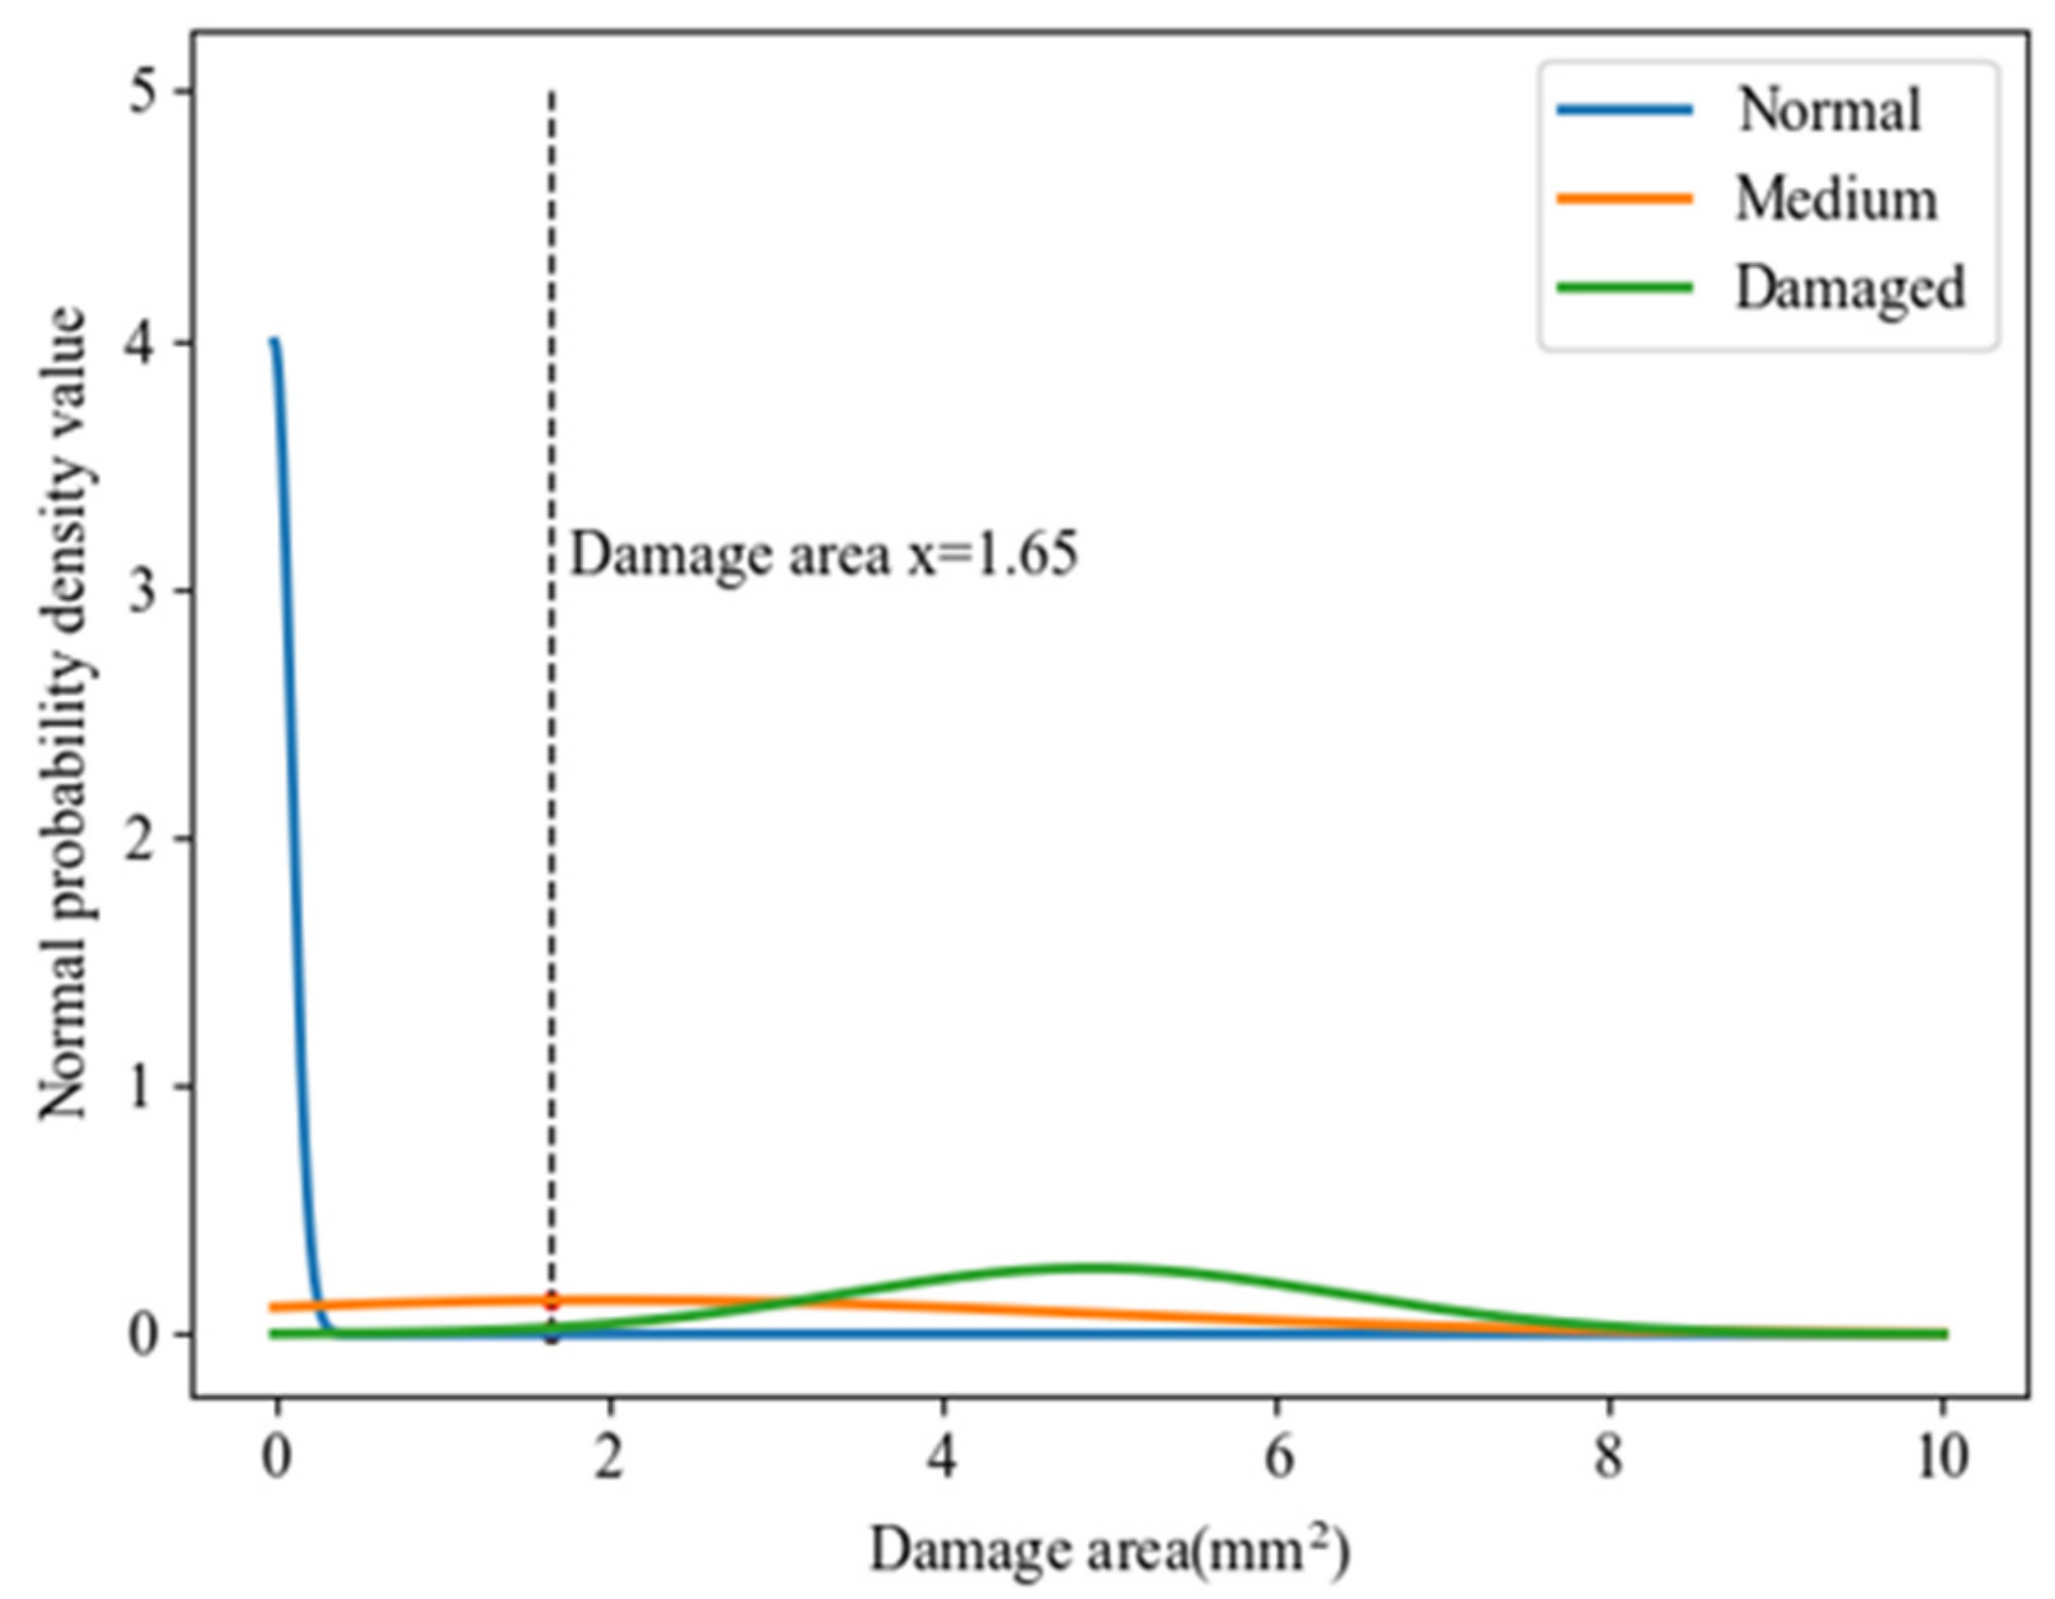
| Status Number | Specimen Status | Damage Area S/mm2 |
|---|---|---|
| 0 | Normal | S ≤ 0.01 |
| 1 | Medium | 0.01 < S < 3 |
| 2 | Failure | S ≥ 3 |
| Sample Type | Number of SDP Images | ||
|---|---|---|---|
| Normal | Medium | Failure | |
| Training Samples | 900 | 900 | 900 |
| Test samples | 200 | 200 | 200 |
| Validation samples | 100 | 100 | 100 |
| Specimen Status | Vibration Signal | Image Signal | ||
|---|---|---|---|---|
| Original Vibration Signal | SDP Image | Visual Recognition of Maximum Damage Region | Quantification of Area Values/mm2 | |
| Normal |  |  |  | 0.0273 |
| Medium |  |  |  | 0.7754 |
| Damaged |  |  |  | 4.6991 |
| Signal types | Vibration Signal | Image Signal | ||
|---|---|---|---|---|
| Original Vibration Signal | SDP Image | Visual Recognition of Maximum Damage Region | Quantification of Area Values/mm2 | |
 |  |  | 1.649 | |
| Recognition status | Damaged | Damaged | Damaged | Medium |
| Specimen Status | Image Number | Damage Area/mm2 | Median |
|---|---|---|---|
| Normal | 1 | 0 (min) | 0 |
| 2 | 0 | ||
| 3 | 0.1511 (max) | ||
| | ||
| 148 | 0.0894 | ||
| 149 | 0.0560 | ||
| 150 | 0.0273 | ||
| Medium | 1 | 1.58652 | 1.21317 |
| 2 | 0.361148 (min) | ||
| 3 | 2.1244 | ||
| | ||
| 148 | 2.38746 (max) | ||
| 149 | 0.334932 | ||
| 150 | 1.57748 | ||
| Failure | 1 | 8.29375 (max) | 4.10303 |
| 2 | 3.59476 (min) | ||
| 3 | 3.96178 | ||
| | ||
| 6 | 4.327 | ||
| 7 | 3.71363 | ||
| 8 | 4.24428 |
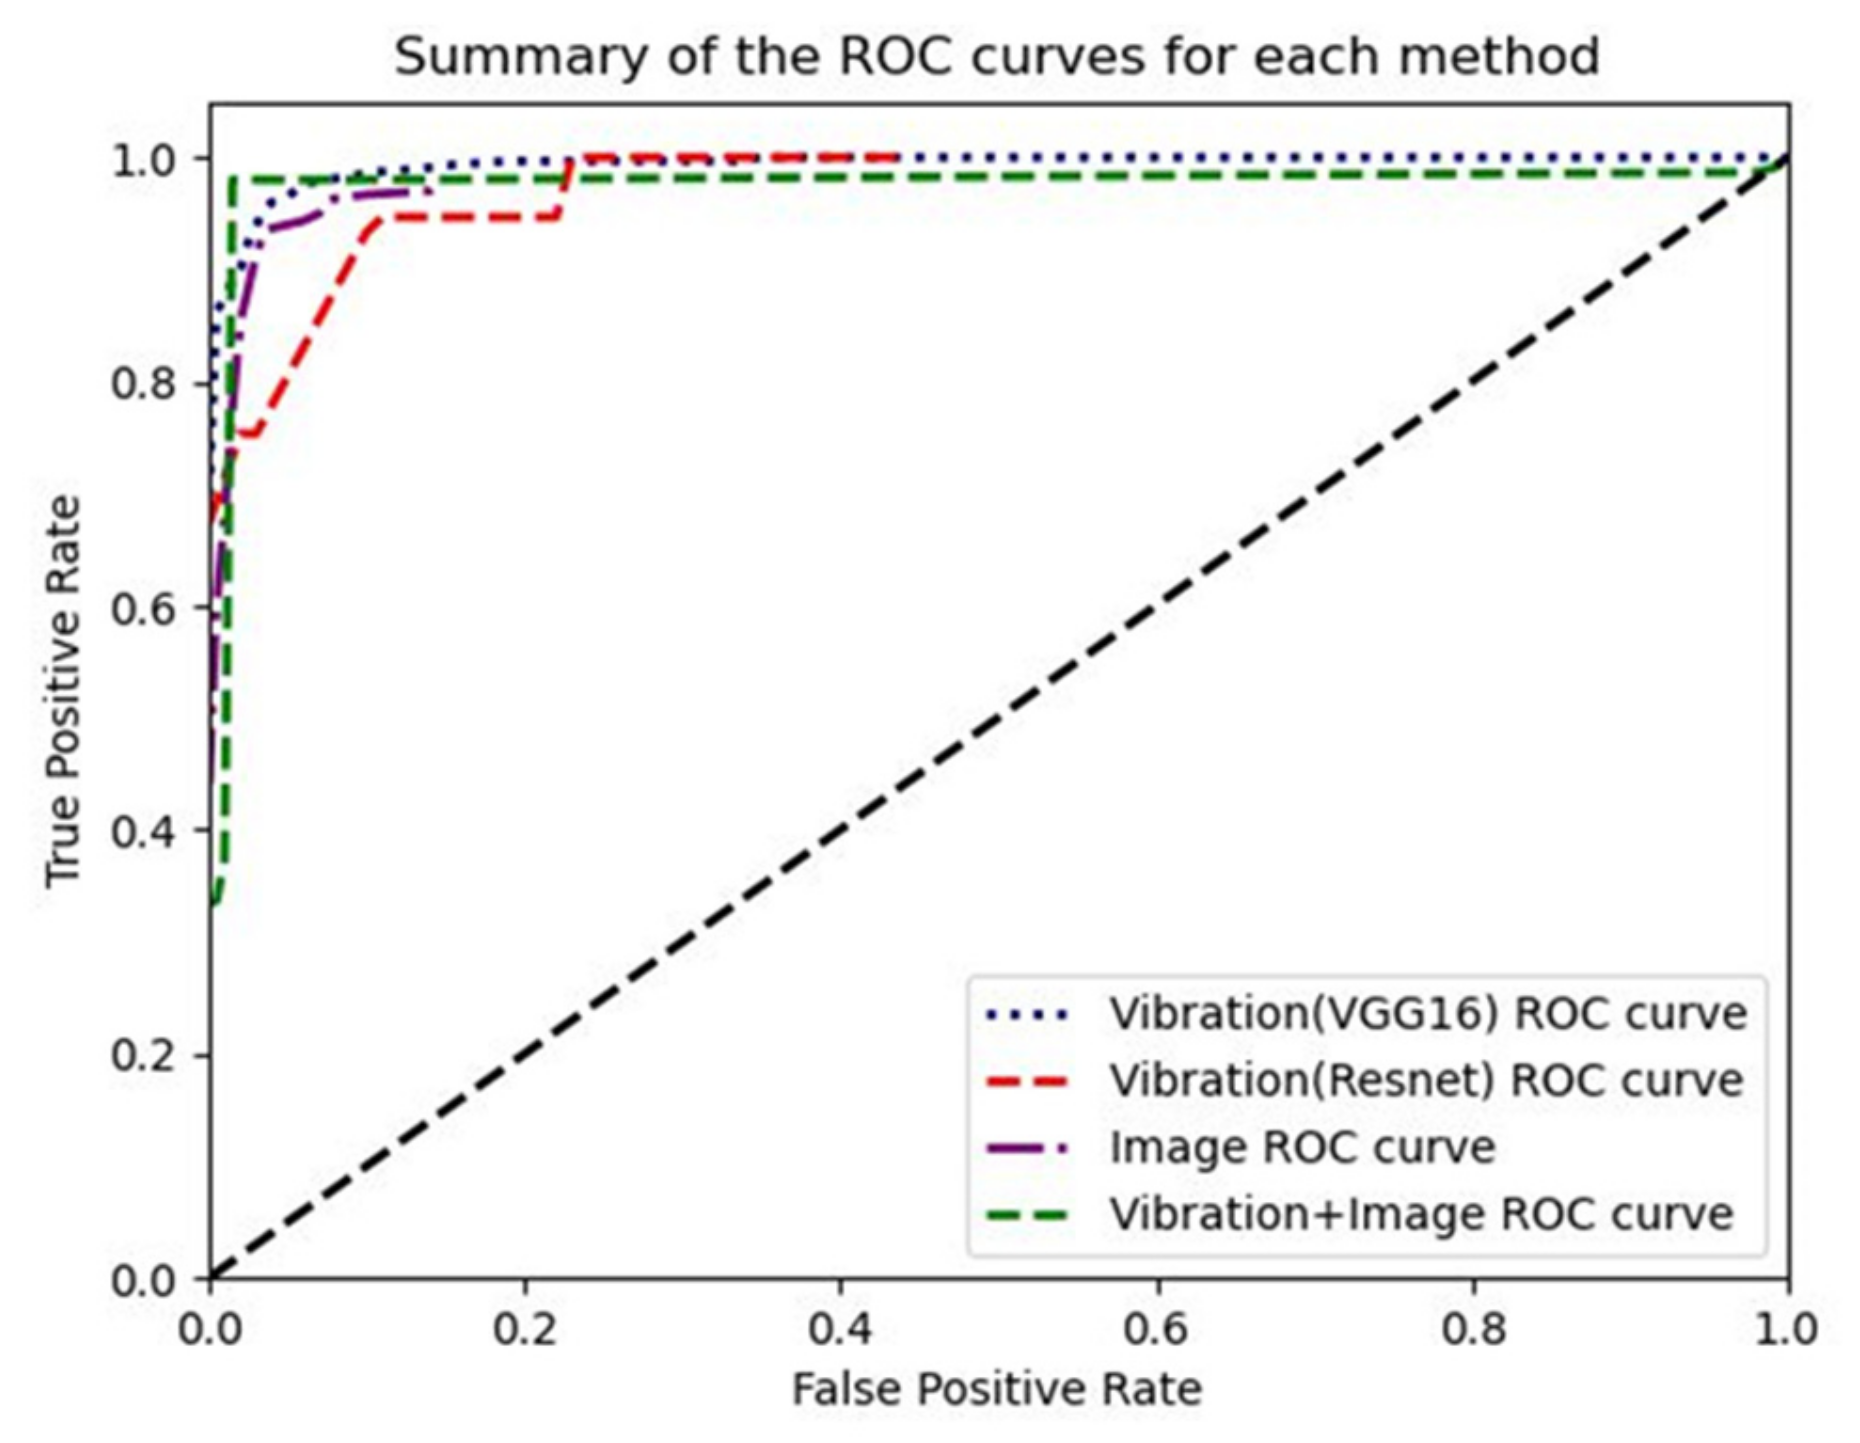
| Sample Number | Based on Vibration Signal | Based on Image Signal | Vibration + IMAGE | Real State | |
|---|---|---|---|---|---|
| VGG16 | ResNet | ||||
| 1 | 0 | 0 | 0 | 0 | 0 |
| 2 | 0 | 0 | 0 | 0 | |
| 3 | 0 | 0 | 0 | 0 | |
| | | | | |
| 98 | 0 | 0 | 1(×) | 0 | |
| 99 | 0 | 0 | 1(×) | 0 | |
| 100 | 0 | 0 | 1(×) | 0 | |
| 1 | 1 | 1 | 1 | 1 | 1 |
| 2 | 0(×) | 0(×) | 1 | 0(×) | |
| 3 | 0(×) | 0(×) | 1 | 1 | |
| | | | | |
| 98 | 0(×) | 1 | 1 | 1 | |
| 99 | 0(×) | 0(×) | 1 | 0(×) | |
| 100 | 2(×) | 2(×) | 1 | 2(×) | |
| 1 | 2 | 2 | 2 | 2 | 2 |
| 2 | 2 | 2 | 2 | 2 | |
| 3 | 2 | 2 | 2 | 2 | |
| | | | | |
| 98 | 2 | 2 | 2 | 2 | |
| 99 | 2 | 1(×) | 2 | 2 | |
| 100 | 1(×) | 1(×) | 2 | 1(×) | |
| Number of identification errors | 14 | 27 | 20 | 4 | / |
| Accuracy | 95.33% | 91.00% | 93.33% | 98.67% | / |
Publisher’s Note: MDPI stays neutral with regard to jurisdictional claims in published maps and institutional affiliations. |
© 2022 by the authors. Licensee MDPI, Basel, Switzerland. This article is an open access article distributed under the terms and conditions of the Creative Commons Attribution (CC BY) license (https://creativecommons.org/licenses/by/4.0/).
Share and Cite
Chen, X.; Liu, Y.; Fu, Y.; Gu, Q.; Yang, Y. Contact Fatigue State Identification of Specimen Based on Heterogeneous Data and Evidence Theory. Appl. Sci. 2022, 12, 8509. https://doi.org/10.3390/app12178509
Chen X, Liu Y, Fu Y, Gu Q, Yang Y. Contact Fatigue State Identification of Specimen Based on Heterogeneous Data and Evidence Theory. Applied Sciences. 2022; 12(17):8509. https://doi.org/10.3390/app12178509
Chicago/Turabian StyleChen, Xiang, Yu Liu, Yuan Fu, Qiancheng Gu, and Yan Yang. 2022. "Contact Fatigue State Identification of Specimen Based on Heterogeneous Data and Evidence Theory" Applied Sciences 12, no. 17: 8509. https://doi.org/10.3390/app12178509
APA StyleChen, X., Liu, Y., Fu, Y., Gu, Q., & Yang, Y. (2022). Contact Fatigue State Identification of Specimen Based on Heterogeneous Data and Evidence Theory. Applied Sciences, 12(17), 8509. https://doi.org/10.3390/app12178509