Abstract
When buildings are exposed to earthquake sequence, damage aggravation is expected to occur. Although several studies report seismic vulnerability of reinforced concrete (RC) buildings under the mainshock–aftershock sequence, indicating damage aggravation due to aftershock, none, to the best of our knowledge, quantifies seismic vulnerability of buildings under foreshock–mainshock–aftershock sequences. Since foreshock–mainshock–aftershock sequences are also expected in many active seismic regions, we aim to quantify the level of vulnerability under seismic sequences considering the seismically highly active Himalayan region as the case study location. Fragility functions are derived considering foreshock, foreshock–mainshock sequence, and foreshock–mainshock–aftershock sequence for a low-rise special moment-resisting frame (SMRF) building that represents a typical low-rise owner-built construction system in Nepal, one of the most active seismic regions in the world. The results highlight that the foreshock significantly increases seismic vulnerability of the structures with respect to the often-considered case of a mainshock–aftershock sequence.
1. Introduction
Many seismic regions worldwide observe a sequence of earthquakes and result in aggravation in terms of damage and fatality, because it is almost impossible to restore structural capacity when seismic events are ongoing. For example, the 2015 Gorkha earthquake in Nepal started on 25 April 2015 (MW 7.8), and more than 300 aftershocks of local magnitude greater than 4 were recorded until 2019. The mainshock was followed by a magnitude 6.9 event within an hour, by a magnitude 6.7 event on 26 April, and the strongest aftershock occurred on 12 May 2015 (MW 7.3). Between 25 April and 12 May, the seismic events were so intense that hardly any occupants could enter their houses. Figure 1 shows an example of damage due to the mainshock and the first major aftershock, as well as after the 12 May aftershock of the 2015 Gorkha earthquake in Nepal. Figure 1a shows that the damage grade is D3, whereas, after the 12 May event, the damage grade is D5 per the EMS-98 damage scale [1]. Similar cases of damage caused by the mainshock–aftershock sequence were reported during the 1934 Nepal–Bihar earthquake and the 1833 Nepal earthquake [2]. Foreshocks were not reported during either of the events; however, the 1988 earthquake in eastern Nepal was preceded by a strong foreshock [3]. So far, all the notable earthquakes that originated in the Main Central Thrust (MCT) have shown mainshock–aftershock sequencing; whereas the 1988 Udaypur earthquake that originated from the Main Frontal Thrust (MFT) depicted foreshock–mainshock–aftershock sequence. Similar tectonic activities were reported during the 2016 Central Italy earthquake sequence. On 24 August 2016, a magnitude 6.1 foreshock was followed by a magnitude 6.5 event on 30 October 2016 during the central Italy earthquake sequence. Further details regarding damage and vulnerability due to the Central Italy earthquake sequence can be found elsewhere (see, e.g., [4]).
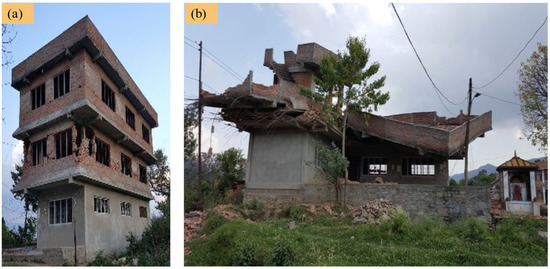
Figure 1.
Damage to a residential building in Kathmandu by the 2015 Gorkha earthquake sequence: (a) after the 25 April mainshock; (b) after the 12 May aftershock (image courtesy of Krishna Devkota).
Quantification of seismic vulnerability of structures and infrastructures is either confined to a single event or mainshock–aftershock regimes only. Fragility functions are widely used to quantify seismic vulnerability [5]. Similarly, index-based vulnerability analysis is also gaining momentum because this system is faster than analytical approaches [6]. Seismic strengthening in the time window between the mainshock and aftershock or foreshock and mainshock events is almost impossible, thus damage incurred to structures and infrastructures persists until the next event(s), leading to damage aggravation to collapse. Thus, the studies that report a single event or mainshock–aftershock regimes could only underestimate seismic vulnerability, especially in the regions where seismic sequences are expected. Di Sarno and Wu [7] analyzed seismic fragility of low-rise steel moment-resisting frame buildings under single and multiple earthquakes. They concluded that the post-mainshock damage has no significant role in the aftershock resistance capacity. Di Sarno and Pugliese [8] performed fragility assessment of aging reinforced concrete (RC) buildings under the mainshock–aftershock sequence. They concluded that conventional building codes are highly conservative in assuring seismic safety of RC buildings under earthquake sequence. For ordinary moment-resisting frame RC buildings, a gradual reduction in aftershock collapse capacity was reported under increased mainshock damage level [9]. Furtado et al. [10] found an increase in seismic vulnerability of RC buildings when subject to aftershocks. They considered the in-plane and out-of-plane behavior of infill walls [11] and found that the bare frame model results in conservatively higher vulnerability than the infill frame. Iervolino et al. [12] estimated the damage accumulation of nearly 53% and 134% for mainshock and mainshock–aftershock sequences for 100 years probability for Naples, Italy. Thus, computational efforts devoted to identifying the effects of the mainshock–aftershock sequence unanimously conclude that aftershocks would undoubtedly aggravate the damage scenario. Papadopoulos and Bazzurro [13] presented the framework and application of seismicity clustering and damage accumulation for the mainshock–aftershock sequence. They concluded that spatiotemporal clustering plays an instrumental role in seismic risk estimation. Many other fragility functions reported in the existing literature are also seismic sequence fragility functions because the damage grade assigned to each structure would be the final damage grade once major events of a sequence occur. For example, fragility functions created by Gautam et al. [3], Gautam et al. [5], Bessasson and Bjarnason [14], Bessasson et al. [15], Gautam and Rupakhety [16], Gautam [17], and Gautam et al. [18], among others, are the fragility functions derived from the damage data collected after earthquake sequences. Additionally, mainshock–aftershock vulnerability and resilience of bridges are studied by several researchers (see, e.g., [19,20]). Although notable attention is paid in terms of seismic vulnerability of buildings under the mainshock–aftershock sequence, foreshock–mainshock–aftershock sequences have seldom been considered so far. Since earthquake sequences similar to the 2016 Central Italy event are likely to occur in the future too, there exists a gap in the existing literature in terms of quantification of vulnerability under the foreshock–mainshock–aftershock sequence, as strong foreshocks may cause significant damage to a structure. To address the gap, we present seismic fragility analysis of a representative RC building from Nepal. To replicate the realistic scenario, infill walls with solid bricks are modeled.
2. Materials and Methods
2.1. Case Study Building
We considered one of the most representative construction systems that is in practice after the endorsement of building codes in Nepal in 2003 [21]. After the legal enforcement of building code, most of the residential constructions comply with the mandatory rules of thumb (MRT), especially in urban and semi-urban neighborhoods. We considered a three-storied special moment-resisting frame building to assess the behavior under earthquake sequence. The selected structure is the representative low-rise building designed per the Nepal Building Code (NBC)-201 [22] and NBC-205 [23]. The exterior walls of such buildings have 230 mm thick (double wythe) solid brick infill walls, and the interior walls are 115 mm thick header bond, indicating single brick wythe. The structural and material details of the case study building are shown in Table 1.

Table 1.
Structural and material characteristics of a representative MRT building in Nepal.
Figure 2 shows the layout of the building along two directions. Similarly, Figure 3 shows geometrical and reinforcement details of structural members (beams and columns). The MRT constructions use the same size of beams and columns in all stories. Ductile detailing provisions are also provided through mandatory regulations to assure adequate ductility of owner-built constructions.
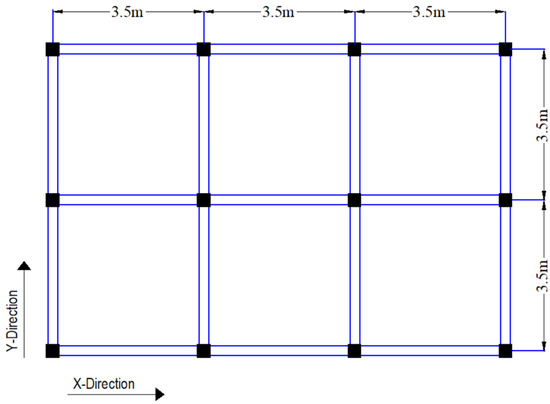
Figure 2.
Typical floor plan of the case study building.
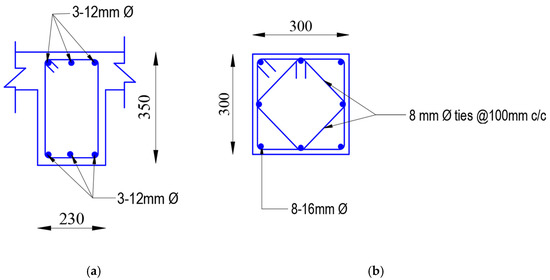
Figure 3.
Geometrical and reinforcement detailing of (a) beam and (b) column sections (units in mm).
2.2. Infill Modeling
Performance of buildings is significantly governed by the presence of infill walls (see, e.g., [24,25,26,27]). Many researchers have focused on the characterization of masonry infills using analytical and experimental approaches (see, e.g., [28,29,30,31]). Thus, the advancements in computational capacities and experimental facilities have enriched the understanding, and replication of infill behavior in analytical models have been simplified. Infill panels are nonstructural components, and the infill materials are used per the choice and the purpose of the structure. We selected a residential building as a case study comprising brick and cement mortar joints. The unit weight of the brick unit is taken as 18 KN/m3 and compressive strength is adopted to be 7.5 MPa in 1:6 cement sand mortar. We created a finite element model of the building in SAP2000 v.20 [32], considering infill contribution (see Figure 4) for 230 mm thick brick walls. To replicate the behavior of infills, we adopted a macro-modeling approach. The strength and stiffness of the masonry infill beyond the elastic range were determined following the constitutive relation proposed by Panagiotakos and Fardis [33]. The stress-strain relation of the infill wall is represented in terms of multilinear curves, as shown in Figure 5. The first stretch shows the initial shear behavior of the uncracked panel. The second part depends upon the diagonal strut itself when it starts to separate from the panel. The third part defines the infill wall’s softening behavior after the critical displacement Sm characterized by the slope K3. The fourth part shows the final behavior of the panel that represents zero residual strength Su.
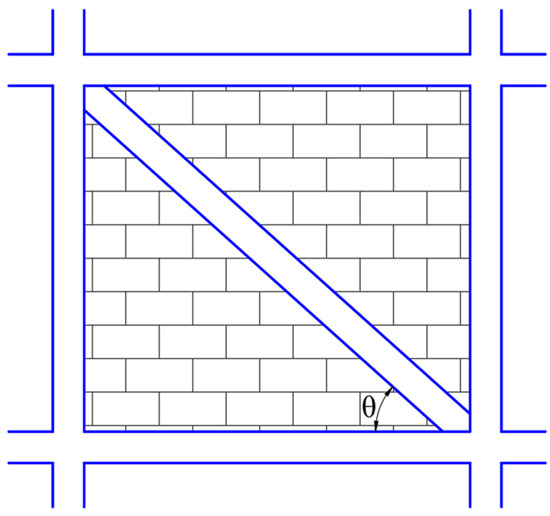
Figure 4.
Infill masonry model for double wythe brick walls.
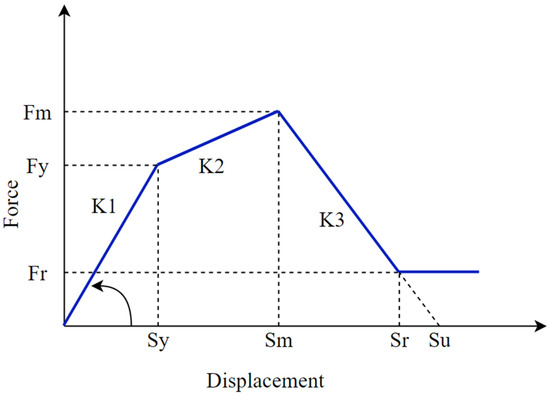
Figure 5.
Force–displacement relation proposed by Panagiotakos and Fardis [33] for infill walls.
2.3. Finite Element Modeling
Beams and columns were modeled as frame elements and slabs as area sections. The foundation was considered rigid, i.e., the interaction between the soil and structure was not considered, as Adhikari et al. [25] concluded no significant contribution of soil–structure interaction even in the case of alluvial deposits for low-rise SMRF buildings. Each floor was assigned a rigid diaphragm. Lateral earthquake load was applied in both x-direction and y-direction, as per the IS: 1893-2016 guidelines [34], for seismic zone-V and medium to stiff soil conditions. The 3D rendered view of the model is shown in Figure 6. Plastic hinges were assigned to the frame elements to carry out nonlinear static analysis Hinges were assigned at 10% of the member length from each joint of beam and column. The properties were assigned as described in ASCE-41-17 [35]. For the infill model, link properties were assigned for inelastic behavior. Pushover analysis was performed to obtain the capacity curve of the structure. To capture the linked axial and biaxial bending behavior, P-M-M hinges were defined at both ends of columns and M3 hinges were defined for both ends of beams. Displacement controlled nonlinear analysis was performed considering only P-Δ effects. The preloading of the structure was taken as dead load plus 25% of the live load.
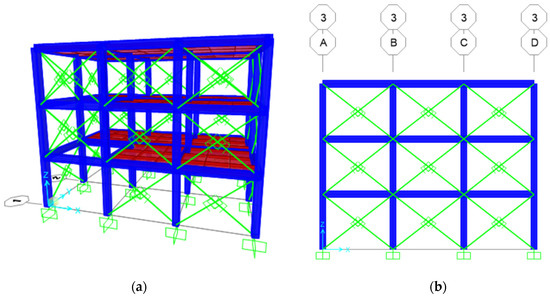
Figure 6.
Finite element model of the building: (a) 3D model with infill; (b) 2D elevation of infill.
Nonlinear time history analysis is performed to estimate seismic fragility. Ground motions for time history analysis are selected to represent seven earthquake sequences as shown in Table 2. Since ground motion data from earthquake sequences in the study region are not available, data recorded from elsewhere are used. An example of ground motion of a seismic sequence is shown in Figure 7. Load cases are defined for earthquake sequences initializing from the preloading condition. Direct integration, nonlinear time history analysis was carried out considering P-Δ and large displacements to estimate the peak structural demands. After the completion of each time history analysis, the constitutive models for the infills was calibrated depending on its uncracked, separation, or softening mechanism before applying subsequent ground motion time history.
Table 2.
Earthquake sequence used for time history analysis (retrieved from https://www.strongmotioncenter.org/, accessed on 15 March 2022).
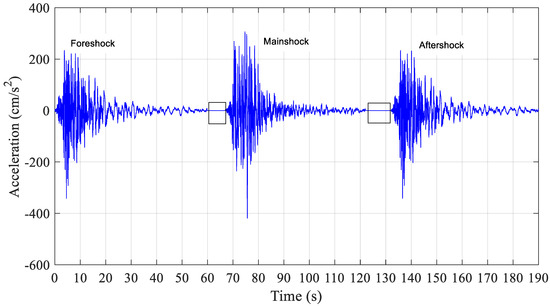
Figure 7.
Seismic sequence history for the Northridge earthquake.
2.4. Fragility Analysis
Fragility functions correlate structural capacity with demand and are considered one of the most significant tools in assessing vulnerability of structures before and after an extreme event such as an earthquake [36]. We obtained capacity parameters from the pushover curve using the approach formulated by Lagomarsino and Giovinazzi [37]. The ultimate and yield displacements were estimated from the pushover curve using the approach suggested by Elnashai and Di Sarno [36]. Based on yield () and ultimate displacement () demands, four damage states, slight (D1), moderate (D2), extensive (D3), and collapse (D4), were characterized. The characterization scheme for the four damage states is presented in Equation (1) as follows:
Fragility functions for the four damage states were constructed using the formulation presented by Jalayer et al. [38]. The cloud-analysis-based fragility derivation approach is a regression-based probability model that estimates the DCRLS (demand-to-capacity ratio for a damage state) for the given value of the IM, e.g., Sa (T1, ξ).
The three-parameter fragility function is represented by the probability that DCRLS exceeds 1 for the IM value as follows:
where indicates the standard Gaussian cumulative distribution function, depicts the model parameters, and . The regression model is represented as follows:
where DCRLS = {DCRLS,i; i = 1:N} is the set of critical demand to capacity ratio for limit state (LS) estimated from nonlinear time history analysis performed for a suite of N ground motions, and Sa = {Sa,i, i = 1:N} is the set of corresponding Sa values. DCRLS,i and Sa,i are calculated for the ith ground motion record. In Equation (3), E [] represents the expected value for the natural logarithm of DCRLS given Sa, is the median for DCRLS given Sa, and is the logarithmic standard deviation for DCRLS given Sa.
3. Results and Discussion
Based on the spectral displacement demands obtained from nonlinear time history analysis using the seven foreshocks, foreshock fragility functions for low-rise SMRF buildings were created, as shown in Figure 8. As can be seen in Figure 8, the slight damage (D1) tendency rapidly increased after 0.4 g. For example, at 1 g, the exceedance probability of D1 is 60%. Since the foreshock did not induce higher damage states, foreshock fragility function is created only for D1 damage state.
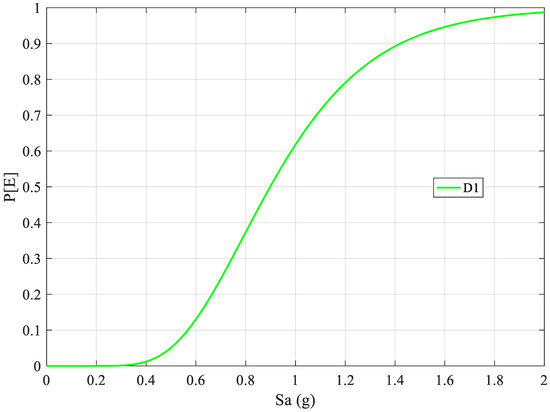
Figure 8.
Foreshock fragility functions for low-rise SMRF buildings.
After completing foreshock time history analysis, we deployed mainshock time history continuing the analysis, and obtained displacements for respective mainshock time histories. Thus, the spectral displacements were achieved as the combined displacements due to foreshock and mainshock time histories. We constructed fragility functions for combined displacement demands for the four damage states, as shown in Figure 9. When mainshock time history is deployed, vulnerability of low-rise SMRF buildings is found to be significantly increased. For instance, D1 is initiated at ~0.18 g, D2 at ~0.25 g, D3 at ~0.35 g, and D4 is initiated at 0.4 g. Figure 9 highlights that at 1 g, exceedance probabilities of D1, D2, D3, and D4 are, respectively, 95%, 70%, 45%, and 20%. This indicates that if the foreshock–mainshock sequence is considered, the exceedance probability of D4 is 18% higher than that for the foreshock-only scenario. On the contrary, the discrepancy in D1 is ~35%. Similarly, D2 and D3 are the most fluctuated damage states when foreshock–mainshock sequence is considered. Hinge formation will be rapid when post-foreshock analysis is deployed; thus, D2 and D3 should have experienced more fluctuation. When foreshock–mainshock sequence is considered, low-rise SMRF buildings have 100% exceedance probability to D1 after 1.4 g. At the same spectral acceleration, D4 has 50% exceedance probability.
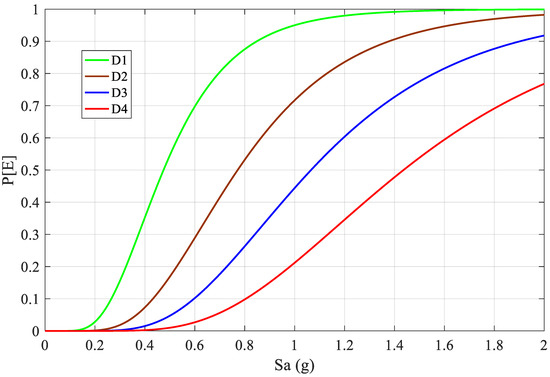
Figure 9.
Foreshock and mainshock fragility functions for low-rise SMRF buildings.
We also performed post-aftershock–mainshock sequence time history analysis, deploying respective aftershocks to obtain displacement demand due to foreshock–mainshock–aftershock sequence. The fragility functions for the four damage states due to foreshock–mainshock–aftershock sequence are plotted in Figure 10. Figure 10 highlights that vulnerability of a low-rise SMRF building is increased after the introduction of aftershock time history. However, the increase in vulnerability is lower in the post-mainshock compared to the increase in the post-foreshock scenario. When aftershock is included, exceedance probabilities of D1, D2, D3, and D4 are, respectively, 98%, 80%, 55%, and 30% at 1 g spectral acceleration. Additionally, initiation of each damage state occurred at lower spectral acceleration value when compared to foreshock–mainshock sequence. As existing seismic codes do not comply with the seismotectonics that usually result in earthquake sequence, the comparison between fragility functions due to foreshock only, foreshock–mainshock sequence, and foreshock–mainshock–aftershock sequence, as plotted in Figure 11, clearly depict that vulnerability will be undeniably increased while adding one more strong motion. Post-aftershock sequence or post-mainshock sequence analysis are found to be further critical as highlighted by a notable increase in the probability of exceedance in each damage state. Figure 11 quantifies the variation in exceedance probabilities for each damage state in the case of foreshock, foreshock–mainshock, and foreshock–mainshock–aftershock scenarios, which is rare, if not absent, in the existing literature. The mainshock may govern the majority of hinge mechanisms so that the increase in vulnerability due to aftershocks is found to be somehow steady. To present a clearer picture of variation in seismic vulnerability of low-rise SMRF buildings, we selected 25%, 50%, and 75% exceedance probabilities and plotted the corresponding spectral acceleration values, as shown in Figure 12. The variation of corresponding spectral acceleration values also outlines that the foreshock alone underestimates seismic vulnerability of structures. Similarly, severity of sequence is well reflected from the variation observed for foreshock–mainshock–aftershock and foreshock–mainshock sequence. Sensitivity of seismic sequence is more pronounced in the case of foreshock–mainshock sequence rather than foreshock–mainshock–aftershock sequence. Thus, rapid increase in seismic vulnerability is the characteristic of foreshock–mainshock sequence rather than any other sequence-based combination or single event occurrence.
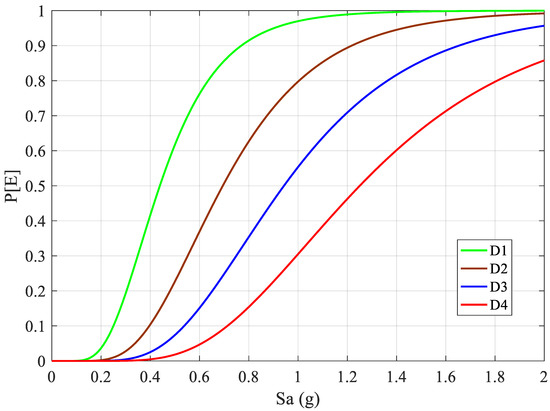
Figure 10.
Foreshock–mainshock–aftershock fragility functions for low-rise SMRF buildings.
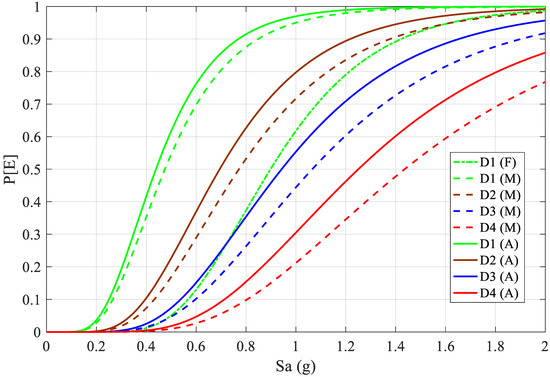
Figure 11.
Comparative plot of fragility functions for foreshock, foreshock–mainshock, and foreshock–mainshock–aftershock scenarios. F, M, and A within the parentheses indicate foreshock, foreshock–mainshock, and foreshock–mainshock–aftershock events.
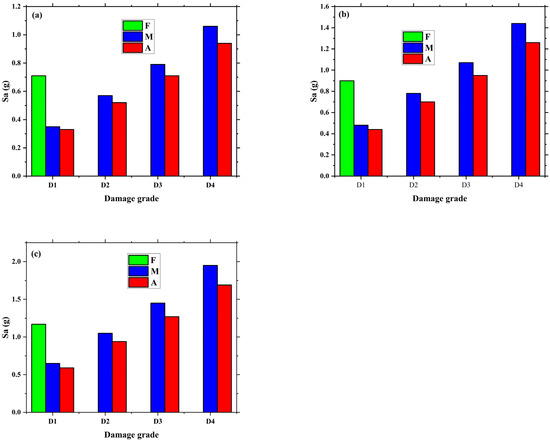
Figure 12.
Corresponding spectral accelerations for four damage states for (a) 25% probability of exceedance, (b) 50% probability of exceedance, and (c) 75% probability of exceedance. F, M, and A within the parentheses indicate foreshock, foreshock–mainshock, and foreshock–mainshock–aftershock time history.
4. Conclusions
Seismic sequences are likely to hit buildings and infrastructures in several active seismic regions in the world. Particularly, damage aggravation is a notable mechanism that could result in deficient behavior of both engineered and nonengineered buildings. Although considerable attention is paid to the mainshock–aftershock sequence vulnerability analysis of buildings and other structures, the foreshock–mainshock–aftershock sequence is barely considered so far. Thus, to replicate the likely scenario of earthquake sequence, we conducted fragility analysis of a representative low-rise SMRF building from a very active seismic active region, Nepal. We estimated capacity from the pushover analysis and demand for foreshock, foreshock–mainshock, and foreshock–mainshock–aftershock scenarios from nonlinear time history analysis. Fragility functions for all scenarios were created and compared. We conclude that the increase in vulnerability is more sensitive for post-foreshock exposure to mainshock than post-mainshock exposure to aftershock. This indicates that the foreshocks can initiate D1 damage state, and aggravation will take place rapidly due to the occurrence of mainshock. The occurrence of aftershocks is found to moderately increase seismic vulnerability of low-rise SMRF buildings. The duration of the occurrence of seismic sequence cannot be estimated; thus, the existing buildings are likely to be exposed to the sequence without strengthening immediately after a seismic event. To this end, damage aggravation is certain to occur. Therefore, the existing seismic codes should incorporate the effects of seismic sequence to ensure target performance level in buildings, especially in the regions where some of the active faults are proven to result in seismic sequences that last a long time. We considered engineered construction to assess the performance of low-rise SMRF buildings, which possess adequate stiffness; however, damage accumulation can be severe in the case of ordinary moment-resisting frame buildings as well as non-engineered constructions. Thus, there lies an opportunity to quantify seismic vulnerability of both construction types. The time histories selected for nonlinear dynamic analysis are taken only up to 0.47 g PGA; meanwhile, higher values of PGA can result in damage saturation even during the foreshock–mainshock sequence. Thus, considering seismic sequences having high to very high PGA can improve the understanding of damage aggravation and saturation. The sensitivity due to foreshock, mainshock, and aftershock ground motion can be considered in future research to assess the variation in displacement demand. This could provide insights regarding the variation in seismic vulnerability due to variation in strong motion characteristics between foreshock, mainshock, and aftershock. Apart from this, micro-modeling can capture more local mechanisms that could help define damage extent and aggravation extent. Future research can consider the impact of the foreshock–mainshock–aftershock sequence in high-rise RC buildings and other structures and the benefit of implementing mitigation measures to reduce seismic vulnerability.
Author Contributions
Conceptualization, D.G. and R.A.; methodology, D.G., P.P., A.F. and R.R.; software, P.M.; validation, R.A. and D.G.; formal analysis, P.M.; resources, D.G. and R.A.; writing—original draft preparation, P.M. and D.G.; writing—review and editing, P.P., R.A., A.F. and R.R.; visualization, D.G., A.F. and R.R.; supervision, D.G., R.A. and P.P. All authors have read and agreed to the published version of the manuscript.
Funding
This research received no external funding.
Institutional Review Board Statement
Not applicable.
Informed Consent Statement
Not applicable.
Data Availability Statement
Not applicable.
Acknowledgments
The authors sincerely thank Krishna Devkota for sharing an image showing progressive damage. Andre Furtado acknowledges the financial support provided by the Base Funding—UIDB/04708/2020 and Programmatic Funding—UIDP/04708/2020 of the CONSTRUCT—Instituto de I&D em Estruturas e Construções—funded by national funds through the FCT/MCTES (PIDDAC) that partly supported his role in this research. Rajesh Rupakhety acknowledges the support from the University of Iceland Research Fund that partially financed his role in this study.
Conflicts of Interest
The authors declare no conflict of interest.
References
- Grunthal, C. European Macroseismic Scale; European Seimological Commission: Luxembourg, 1998. [Google Scholar]
- Rana, B.S. The Great Earthquake of Nepal 1934; Jorganesh Press: Kathmandu, Nepal, 1935. [Google Scholar]
- Gautam, D.; Fabbrocino, G.; de Magistris, F.S. Derive empirical fragility functions for Nepali residential buildings. Eng. Struct. 2018, 171, 617–628. [Google Scholar] [CrossRef]
- Miano, A.; Jalayer, F.; Forte, G.; Santo, A. Empirical fragility assessment using conditional GMPE-based ground shaking fields: Application to damage data for 2016 Amatrice Earthquake. Bull. Earthq. Eng. 2020, 18, 15. [Google Scholar] [CrossRef]
- Gautam, D.; Adhikari, R.; Rupakhety, R. Seismic fragility of structural and non-structural elements of Nepali RC buildings. Eng. Struct. 2021, 232, 111879. [Google Scholar] [CrossRef]
- Gautam, D.; Adhikari, R.; Rupakhety, R.; Koirala, P. An empirical method for seismic vulnerability assessment of Nepali school buildings. Bull. Earthq. Eng. 2020, 18, 5965–5982. [Google Scholar] [CrossRef]
- Di Sarno, L.; Wu, J.-R. Fragility assessment of existing low-rise steel moment-resisting frames with masonry infills under mainshock-aftershock earthquake sequences. Bull. Earthq. Eng. 2021, 19, 6. [Google Scholar] [CrossRef]
- Di Sarno, L.; Pugliese, F. Effects of mainshock-aftershock sequences on fragility analysis of RC buildings with ageing. Eng. Struct. 2021, 232, 111837. [Google Scholar] [CrossRef]
- Shafaei, H.; Naderpour, H. Collapse Capacity of Ordinary RC Moment Frames Considering Mainshock-Aftershock Effects. J. Earthq. Eng. 2021. [Google Scholar] [CrossRef]
- Furtado, A.; Rodrigues, H.; Varum, H.; Arêde, A. Mainshock-aftershock damage assessment of infilled RC structures. Eng. Struct. 2018, 175, 645–660. [Google Scholar] [CrossRef]
- Furtado, A.; Rodrigues, H.; Arêde, A.; Varum, H. Assessment of the mainshock-aftershock collapse vulnerability of RC structures considering the infills in-plane and out-of-plane behaviour. Procedia Eng. 2017, 199, 619–624. [Google Scholar] [CrossRef]
- Iervolino, I.; Chioccarelli, E.; Suzuki, A. Seismic damage accumulation in multiple mainshock–aftershock sequences. Earthq. Eng. Struct. Dyn. 2020, 49, 10. [Google Scholar] [CrossRef]
- Papadopoulos, A.N.; Bazzurro, P. Exploring probabilistic seismic risk assessment accounting for seismicity clustering and damage accumulation: Part II. Risk analysis. Earthq. Spectra 2021, 37, 386–408. [Google Scholar] [CrossRef]
- Bessason, B.; Bjarnason, J. Seismic vulnerability of low-rise residential buildings based on damage data from three earthquakes (Mw6.5, 6.5 and 6.3). Eng. Struct. 2016, 111, 64–79. [Google Scholar] [CrossRef]
- Bessason, B.; Bjarnason, J.; Rupakhety, R. Statistical modelling of seismic vulnerability of RC, timber and masonry buildings from complete empirical loss data. Eng. Struct. 2020, 209, 109969. [Google Scholar] [CrossRef]
- Gautam, D.; Rupakhety, R. Empirical seismic vulnerability analysis of infrastructure systems in Nepal. Bull. Earthq. Eng. 2021, 19, 6113–6127. [Google Scholar] [CrossRef]
- Gautam, D. Observational fragility functions for residential stone masonry buildings in Nepal. Bull. Earthq. Eng. 2018, 16, 4661–4673. [Google Scholar] [CrossRef]
- Gautam, D.; Rupakhety, R.; Adhikari, R. Empirical fragility functions for Nepali highway bridges affected by the 2015 Gorkha Earthquake. Soil Dyn. Earthq. Eng. 2019, 126, 105778. [Google Scholar] [CrossRef]
- Guo, X.; Zhang, Z.; Chen, Z. Mainshock-Integrated Aftershock Vulnerability Assessment of Bridge Structures. Appl. Sci. 2020, 10, 6843. [Google Scholar] [CrossRef]
- Dong, Y.; Frangopol, D.M. Risk and resilience assessment of bridges under mainshock and aftershocks incorporating uncertainties. Eng. Struct. 2015, 83, 198–208. [Google Scholar] [CrossRef]
- Gautam, D.; Chaulagain, H. Structural performance and associated lessons to be learned from world earthquakes in Nepal after 25 April 2015 (MW 7.8) Gorkha earthquake. Eng. Fail. Anal. 2016, 68, 222–243. [Google Scholar] [CrossRef]
- Nepal Building Code (NBC) 201. Mandatory Rules of Thumb Reinforced Concrete Buildings with Infills; Department of Urban Development and Building Construction, Government of Nepal: Kathmandu, Nepal, 1994. [Google Scholar]
- Nepal Building Code (NBC) 205. Mandatory Rules of Thumb Reinforced Concrete Buildings without Infills; Department of Urban Development and Building Construction, Government of Nepal: Kathmandu, Nepal, 1994. [Google Scholar]
- Gautam, D.; Rodrigues, H.; Bhetwal, K.K.; Neupane, P.; Sanada, Y. Common structural and construction deficiencies of Nepalese buildings. Innov. Infrastruct. Solutions 2016, 1, 1. [Google Scholar] [CrossRef]
- Adhikari, R.; Rupakhety, R.; Giri, P.; Baruwal, R.; Subedi, R.; Gautam, R.; Gautam, D. Seismic Fragility Analysis of Low-Rise RC Buildings with Brick Infills in High Seismic Region with Alluvial Deposits. Buildings 2022, 12, 72. [Google Scholar] [CrossRef]
- Barbosa, A.R.; Fahnestock, L.A.; Fick, D.R.; Gautam, D.; Soti, R.; Wood, R.; Moaveni, B.; Stavridis, A.; Olsen, M.; Rodrigues, H. Performance of Medium-to-High Rise Reinforced Concrete Frame Buildings with Masonry Infill in the 2015 Gorkha, Nepal, Earthquake. Earthq. Spectra 2017, 33, 197–218. [Google Scholar] [CrossRef]
- Varum, H.; Dumaru, R.; Furtado, A.; Barbosa, A.R.; Gautam, D.; Rodrigues, H. Seismic Performance of Buildings in Nepal After the Gorkha Earthquake. In Impacts and Insights of the Gorkha Earthquake; Gautam, D., Rodrigues, H., Eds.; Elsevier: Amsterdam, The Netherlands, 2018; Chapter 3; pp. 47–63. [Google Scholar] [CrossRef]
- Furtado, A.; Rodrigues, H.; Arede, A.; Varum, H. Mechanical properties characterization of different types of masonry infill walls. Front. Struct. Civ. Eng. 2020, 14, 411–434. [Google Scholar] [CrossRef]
- De Risi, M.T.; Furtado, A.; Rodrigues, H.; Melo, J.; Verderame, G.M.; António, A.; Varum, H.; Manfredi, G. Experimental analysis of strengthening solutions for the out-of-plane collapse of masonry infills in RC structures through textile reinforced mortars. Eng. Struct. 2020, 207, 110203. [Google Scholar] [CrossRef]
- Furtado, A.; Rodrigues, H.; Arêde, A.; Varum, H. Out-of-plane behavior of masonry infilled RC frames based on the experimental tests available: A systematic review. Constr. Build. Mater. 2018, 168, 831–848. [Google Scholar] [CrossRef]
- Furtado, A.; Vila-Pouca, N.; Varum, H.; Arêde, A. Study of the Seismic Response on the Infill Masonry Walls of a 15-Storey Reinforced Concrete Structure in Nepal. Buildings 2019, 9, 39. [Google Scholar] [CrossRef]
- Computers and Structures Inc. SAP2000; Computers and Structures Inc.: Berkeley, CA, USA, 2018. [Google Scholar]
- Panagiotakos, T.B.; Fardis, M.N. Seismic Response of Infilled RC Frame Structures. In Proceedings of the 11th World Conference on Earthquake Engineering, Acapulco, Mexico, 23–28 June 1996. [Google Scholar]
- IS 1893 (Part 1); Criteria for Earthquake Resistant Design of Structures, Part 1: General Provisions and Buildings). Bureau of Indian Standards: New Delhi, India, 2016.
- Maffei, J.; Comartin, C.D.; Kehoe, B.; Kingsley, G.R.; Lizundia, B. Evaluation of Earthquake-Damaged Concrete and Masonry Wall Buildings. Earthq. Spectra 2000, 16, 263–283. [Google Scholar] [CrossRef]
- Elnashai, A.S.; Di Sarno, L. Fundamentals of Earthquake Engineering; John Wiley & Sons: Hoboken, NJ, USA, 2008. [Google Scholar] [CrossRef]
- Lagomarsino, S.; Giovinazzi, S. Macroseismic and mechanical models for the vulnerability and damage assessment of current buildings. Bull. Earthq. Eng. 2006, 4, 415–443. [Google Scholar] [CrossRef]
- Jalayer, F.; Ebrahimian, H.; Miano, A.; Manfredi, G.; Sezen, H. Analytical fragility assessment using unscaled ground motion records. Earthq. Eng. Struct. Dyn. 2017, 46, 2639–2663. [Google Scholar] [CrossRef]
Publisher’s Note: MDPI stays neutral with regard to jurisdictional claims in published maps and institutional affiliations. |
© 2022 by the authors. Licensee MDPI, Basel, Switzerland. This article is an open access article distributed under the terms and conditions of the Creative Commons Attribution (CC BY) license (https://creativecommons.org/licenses/by/4.0/).