Abstract
A method to estimate modal frequency based on empirical mode decomposition (EMD) and ensemble empirical mode decomposition (EEMD) is proposed. This method can decrease the difficulties in identifying modal frequency of combine harvesters. First, we used 16 acceleration sensors installed at different test points to collect vibration signals of a corn combine harvester under operating conditions (mass time-varying conditions). Second, we calculated mean value, variance and root mean square (RMS) value of the vibration signals, and analyzed its stationarity of vibration signals. Third, the main frequencies of the 16 points were extracted using the EMD and EEMD methods. Finally, we considered modal frequencies identified by the SSI algorithm as standard, and calculated the fitting degrees of the EMD and EEMD methods. The results show that in different time periods (0~60 s and 60~120 s), the maximum differences of the mean value, variance and RMS value of signals were 0.8633, 171.1629 and 11.3767, and the vibration signal under the operating condition of field harvesting can be regarded as a typical non-stationary random vibration signal. The EMD method had more modal aliasing than EEMD, and when we obtained the fitting equations of EMD, EEMD and SSI methods, the value of the Euler distance between the EMD fitting equation and the SSI fitting equation was 446.7883, while that for EEMD and SSI was 417.2845. The vibration frequencies calculated by the EEMD method is closer to the modal frequencies identified by SSI algorithm. The proposed method provides a reference for modal frequency identification and vibration control in a complex working environment.
1. Introduction
The vibrations of combine harvesters under operating conditions are violent, which leads to the brittle fracture of key parts [], affects harvesting performance, and reduces the life cycle of the machine []. In addition, these violent vibrations also reduce the efficiency of machinery, and cause damage to the driver′s health. Therefore, reducing vibration is essential to improving the reliability and comfort of harvesters []. There are many factors that cause the vibration of harvesting machinery, such as the soil, engine, header, etc. A harvester is a typical mass time-varying system, and in the field test, the corn harvester continuously harvested corn and transferred maize to the tank for storage, throwing chopped stalks into the field. In addition, when the tank is full, the harvester needs to unload the corn into a transport vehicle. Therefore, the corn harvester is a time-varying system with mass changes occurring mainly in the tank. Its modal frequency is difficult to identify under the working condition of a field harvest, therefore, it is necessary to study the method of quickly identifying harvest modal frequency under the condition of field harvest operation.
The research on the modal frequency identification of agricultural machinery has concentrated on the finite element method (FEM) [,], experimental modal analysis (EMA) [,,] and operational modal analysis (OMA) [,]. The FEM is widely used to identify the modal frequency of agricultural machinery. Relevant experts and scholars established finite element models for machinery such as harvesters [,], cleaning sieve [], seeder [], etc. In the OMA method, authors normally use the frequency response function (FRF) of the structure to calculate modal frequency [,,]. In order to rebuild the real operating environment of machinery, OMA method is proposed based on EMA, which only uses output vibration response function to calculate modal frequency. The mathematical methods include enhanced frequency domain decomposition (EFDD) [,], stochastic subspace identification (SSI) [,,], PolyMax [], etc. In relevant research, two or more methods are usually combined to verify the modal frequency of a structure, such as FRF combined with FEM [,,], or time-frequency transformation (fast Fourier transform, continuous wavelet transform, short-time Fourier transform) combined with FEM [,].
Furthermore, with the development of modal parameter identification theory, other methods are used to obtain the modal frequency of the mechanical system. Adam et al. used the transmissibility method to calculate the modal frequency of a tractor seat []. Harmann et al. used the method of dynamic energy analysis to process FEM and obtain modal frequency of a tractor []. Yan et al. used a convolutional neural network combined with OMA to obtain modal frequency []. Ji et al. used a sequential quadratic program to identify the modal parameters of a support arm []. Zhou et al. used the random decrement technique (RDT) and an enhanced Ibrahim time method (EITM) to calculate modal frequency []. Bucolo et al. used sensor measured vibration displacement of the structure, calculated the frequency response, and obtained the frequency parameters of the structure [].
Researchers have already carried out a great deal of basic research, but there are still problems. The FEM method struggles to simulate the boundary conditions under operating conditions accurately. The EMA method uses a hammer to excite the structure, which cannot replicate the real excitation of agricultural machinery in the field, and the excitation of OMA method is unknown; EFDD and SSI algorithms are used to calculate the modal frequency, white noise signal is used to simulate environmental excitation, decreasing the accuracy of result. The PolyMax method estimates the number of poles and participation factors to obtain modal frequency, and deviations generated from the above step will cause the modal missing phenomenon. Using a time-frequency transform to estimate modal frequency also has problems. For example, the window function of short-time Fourier transform needs to be selected in advance. Frequency accuracy decreases as the window function narrows, while time accuracy decreases as the window function widens. Wavelet analysis requires a large number of basis functions, causing leakage of the signal’s energy. Due to the limitation of the wavelet basis functions, when the frequency increases, the resolution ratio of frequency decreases.
The above methods have certain limitations in specific environments. To solve these problems, this paper used EMD and EEMD analysis methods to decompose the vibration signal, and obtained its main frequency. Comparing the results of EMD, EEMD and SSI, we propose a practical method for estimating modal frequency. Firstly, based on OMA, we collected the vibration time domain signals of the harvester under operation conditions and analyzed their stationarity. Then, the main frequencies of 16 test points were extracted from the EMD and EEMD results. Finally, we calculated the fitting degrees of EMD, EEMD and SSI to estimate the modal frequency of the harvester. The results of the research can provide a new idea for modal frequency identification and structural optimization of non-stationary random vibration under mass time-varying conditions.
2. Theory of EMD and EEMD
2.1. EMD Method
EMD can decompose the original signal into a finite number of Intrinsic Mode Function (IMF) components and a residual component. The key to this method is that IMFs contain local characteristics belonging to different time scales of the original signal [].
IMF need to satisfy the following conditions: the difference between the extreme points number and zero points number being less than one; and at any part of the signal, the mean of upper envelope and lower envelope being equal to zero.
The steps of the EMD method are as follows:
Find the upper and lower envelope functions and the mean envelope function of original signal;
Take the mean envelope function from the original signal function, produce a new signal, and determine whether the new signal satisfies IMF condition;
If the new signal fits the IMF conditions, it can be identified as an IMF component; if not, repeat the above steps until the IMF component fits the conditions;
Repeat the above steps several times to calculate the IMF components of various orders and the residual component of the original signal;
Combine the IMF components with the residual component to obtain the original signal:
The EMD method is shown in Figure 1.
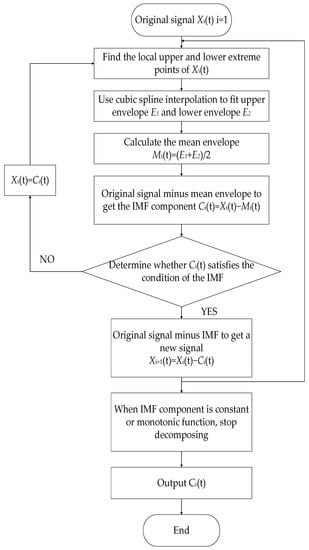
Figure 1.
Vibration signal analysis process of EMD.
2.2. EEMD Method
The results obtained by the EMD method have modal aliasing. In these results, different time scales are decomposed into one IMF component, or the same time scales component appears in different IMFs. In order to decrease the modal aliasing of EMD, we added white noise to the original signal, and then modal aliasing decreased effectively. This is called Ensemble Empirical Mode Decomposition.
By adding white noise to the original signal, the signals of the different time scales are automatically separated into appropriate reference scales. Combining all IMFs together and calculating their mean value can eliminate the white noise that was added. This method can effectively decrease modal aliasing, improve decomposition accuracy, and retain the characteristics of the original signal.
The steps of the EEMD method are as follows:
Add white noise to the original signal and produce a new signal;
Use the EMD method to decompose new signal to obtain IMF components;
Repeat the above steps, adding new white noise each time;
Add these IMFs belonging to the same orders together and calculate their mean value, then obtain the desired IMF.
The EEMD method is shown in Figure 2:
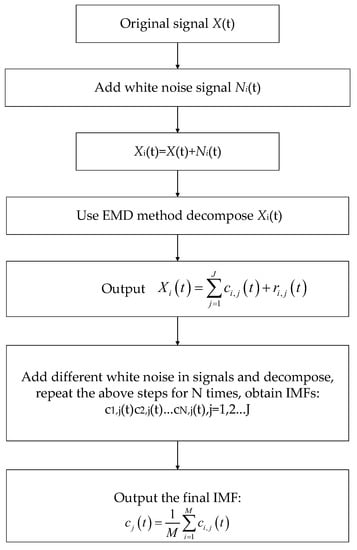
Figure 2.
Vibration signal analysis process of EEMD.
3. Operating Modal Analysis Experiment
A vibration test based on a 4YZP-4HA 4-row self-propelled corn combine harvester produced by Shandong Wuzheng Group Ltd. was performed. In order to ensure the synchronization and consistency of the test data, it was necessary to collect the vibration response data of all the test points at one time. We selected accelerometers of the same batch and model to ensure that the test response data had the same initial phase value. In the test, we used 16-channel INV3062V dynamic signal acquisition equipment and 16 ICP-type accelerometers. The data acquisition program was the DASPV11 software version 11.0, created by China Orient Institute of Noise & Vibration in Beijing, and the acquisition terminal device was a ThinkPad laptop.
According to the vibration feature of harvesters, accelerometers were not installed on the nodes of the structure. The test points of the accelerometers are shown in Figure 3.
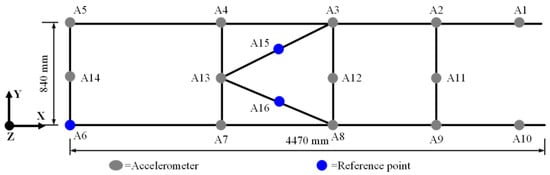
Figure 3.
Distribution of test points A1–A16 on the harvester frame (test points were not installed on the nodes of the frame).
The single direction accelerometers were selected to measure the vibration of the harvester. The sensors’ coding and sensitivity values are shown in Table 1.

Table 1.
The parameters of sensors used in the operating modal test.
The operating modal test of the harvester is shown in Figure 4 [].
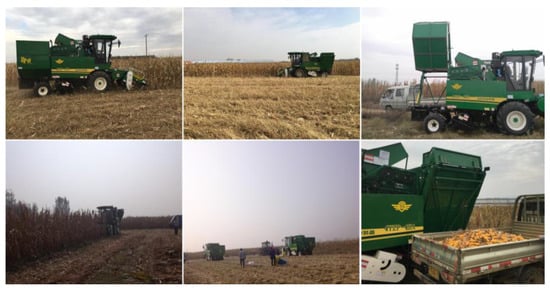
Figure 4.
Operating modal test in the field (mass time-varying conditions of harvester in harvesting and unloading conditions).
4. Vibration Signal Analysis
4.1. The Stationarity Analysis of Vibration Signals
The vibration of corn harvesters under operating conditions is random vibration. Random signals can be divided into stationary random signals and non-stationary random signals. The statistical characteristics of stationary random signals do not change with time, while the statistical characteristics of non-stationary random signals change with time. Therefore, statistical eigenvalues can be used to determine the stationarity of the signals.
We measured the vibration data in the time domain of 16 test points under operating conditions and calculated the statistical characteristics of the mean, variance and root mean square (RMS); the results are shown in Figure 5. In the two different time periods, the mean, variance and RMS of vibration signals have large differences. In the two different time periods (0–60 s and 60–120 s), the maximum difference in the signal mean is 0.8633, while the maximum difference in variance is 171.1629, and the maximum difference in RMS is 11.3767. Therefore, it can be considered that the vibration signal in operating conditions satisfies the non-stationary random signal condition, and other characteristic analyses are based on this conclusion.
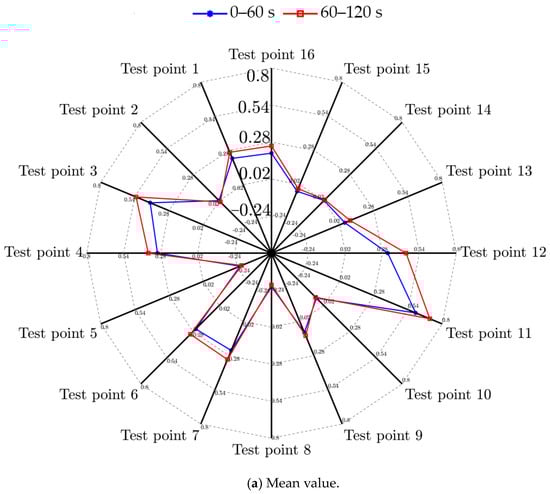
Figure 5.
Time domain statistical characteristics of different test points: (a) mean of 16 test points, (b) variance of 16 test points, and (c) RMS of 16 test points.
4.2. EMD Frequency Analysis Result
The EMD method is used to analyze the vibration of 16 test points, but due to the large amount of data, this paper only shows the analysis result of test point 1. As shown in Figure 6, IMF1~IMF15 and the signal residual components are obtained by decomposition. Column a is the time-domain waveform of the IMF obtained by EMD method, column b is the FFT spectrum of column a, and column c is the local enlarged view of column b.
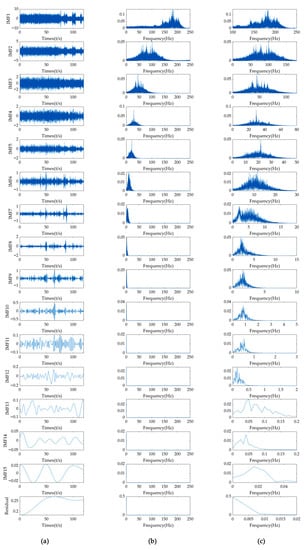
Figure 6.
EMD analysis results of test point 1: (a) IMFs of test point 1, (b) FFT spectrum of IMFs, and (c) enlarged view of the FFT spectrum.
It can be seen from Figure 6 that IMF1 of the EMD analysis results has frequency components of 181.8 Hz, 184.0 Hz, 176.4 Hz, 187.3 Hz, 168.1 Hz, 197.7 Hz, 203.9 Hz and 141.6 Hz (The frequency components are sorted by descending order of amplitude.). In IMF2, the frequency components are 101.2 Hz, 78.9 Hz, 65.3 Hz, 94.9 Hz and 59.3 Hz. In IMF3, the frequency components are 45.2 Hz, 37.0 Hz, 48.1 Hz, 59.3 Hz, 54.5 Hz and 65.8 Hz. Both IMF2 and IMF3 have a frequency component of 59.3 Hz. From the above results, it can be found that IMFs decomposed by the EMD method have modal aliasing problem, which affects the accuracy of the signal’s decomposition. The other 15 test points also have the same modal aliasing as test point 1.
4.3. EEMD Frequency Analysis Result
The EEMD method is used to analyze the vibrations of 16 test points, but due to the data being too large, this paper only shows the result of test point 1. As shown in Figure 7, IMF1 of the EEMD analysis has frequency components of 181.8 Hz, 184.0 Hz, 176.4 Hz, 187.3 Hz, 168.1 Hz, 197.7 Hz, 141.6 Hz and 203.9 Hz (The frequency components are sorted by descending order of amplitude.). Frequency components of 65.3 Hz, 59.3 Hz, 78.8 Hz, and 101.2 Hz exist in IMF2. The frequency components of 29.4 Hz, 45.2 Hz, 37.0 Hz, 32.6 Hz, and 21.9 Hz exist in IMF3. The above analysis shows that modal aliasing still exists in the decomposition result of EEMD, but EEMD analysis can decrease modal aliasing partly and improves analysis accuracy. The other 15 test points have the same conclusions.
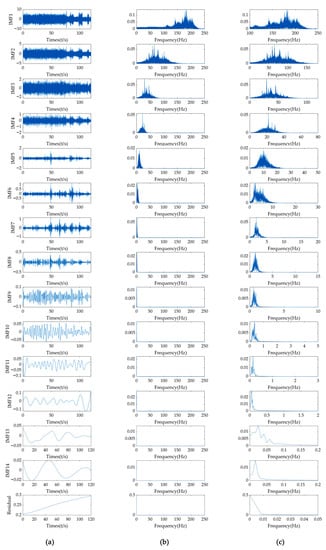
Figure 7.
EEMD analysis results of test point 1: (a) IMFs of test point 1, (b) FFT spectrum of IMFs, and (c) enlarged view of FFT spectrum.
4.4. Frequency Distribution under Different Mass
The time domain signals from three different time periods (0–120 s, 120–240 s, and 240–360 s) were decomposed by the EMD method, and we used fast Fourier transform to obtain the frequency spectrum of the IMFs. We analyzed 15 main frequencies (those corresponding to the highest 15 peaks) of different time periods to explore the relationship between the main frequencies and mass, as the weight of the whole machine keeps increasing. The main frequencies extracted in different time periods are shown in Table 2.
Table 2.
The 15 main frequencies of different time periods.
It can be seen that the difference between the frequency peaks extracted from different time periods is small, and that the relationship with mass variation is not obvious.
During the harvesting operation, the feed amount of the harvester was 3.67 kg/s, which is a small change in mass compared to the whole vehicle mass, and thus mass time varying had a small effect on frequencies. Within a certain time period of 0–120 s, there are some frequency peaks that did not appear in other time periods (such as 26.0 Hz corresponding to peak 15 in 0–120 s), or some frequency peaks that are lost (such as 21.9 Hz did not appear in 0–120 s). Because the largest 15 peaks were extracted in the analysis, some frequencies with smaller peaks are not extracted, which does not mean that these peaks are wrong, or that these frequency peaks are not present in these time periods. The reason for extracting 15 peaks is that the 15th order modal frequency is finally obtained by the SSI algorithm calculation.
Considering jump resonance phenomenon existed in mechanical systems [], we analyzed the change of vibration frequency, and the connection of frequency and mass is shown in Figure 8.
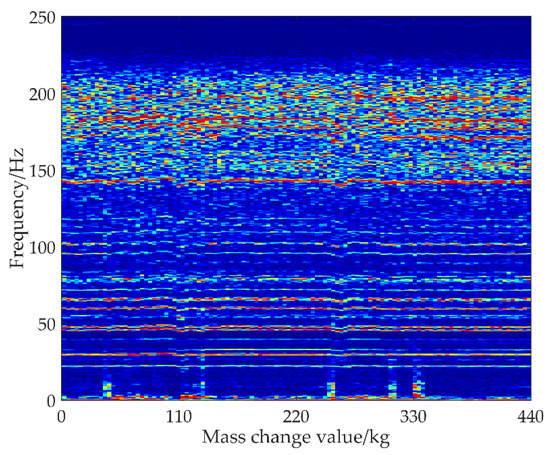
Figure 8.
The frequency of harvester under different mass values.
It shows that the peaks of the frequencies appeared as straight lines, and the change of frequencies is small. At the same time, it was found that the relationship between the frequency of the harvester and the mass is not obvious, and it can be considered that when the feeding amount situation is small, the influence of weight change on frequency is relatively small.
4.5. Comparison of EMD and EEMD Method
The modal frequencies of the harvester under operating conditions identified by the SSI algorithm are shown in Table 3. The modal frequencies of the corn harvester are mainly distributed between 21 and 158 Hz.
Table 3.
Modal values identified by the SSI method.
The 15 main frequencies of the 16 test points extracted from the EMD and EEMD results are compared with the modal frequencies calculated by SSI, as shown in Figure 9. The EMD and EEMD lost some frequencies between 100 and 140 Hz (order 9–13 of modal frequencies). Frequency components such as 24 Hz, 26 Hz, 37 Hz, 75 Hz, 82 Hz, and 94 Hz exist in the EMD and EEMD results, but do not exist in modal frequencies. These errors may be caused by the coupling system.
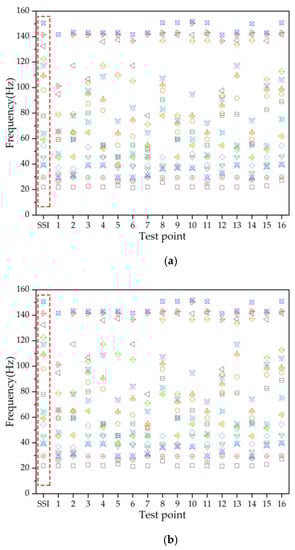
Figure 9.
Comparison of the main frequencies extracted from the EMD and EEMD results and modal frequencies identified by SSI: (a) Comparison of EMD and SSI. (b) Comparison of EEMD and SSI.
Using the method of least squares to fit the modal frequencies identified by the SSI algorithm, the main frequencies were extracted from the EMD result and the EEMD result for six times, respectively. Finally, the frequency fitting curves of the three methods are obtained, as shown in Figure 10.
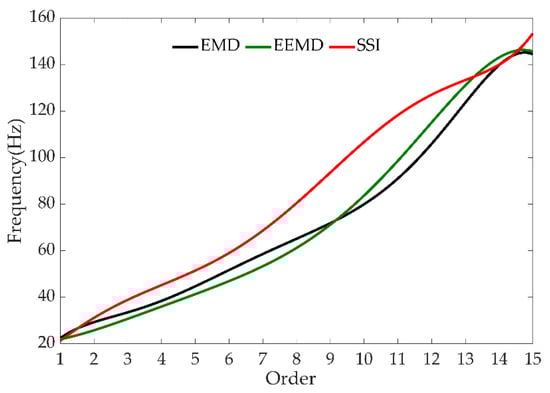
Figure 10.
Frequency fitting curves of the EMD, EEMD and SSI results.
The fitting equation of modal frequencies identified by the SSI algorithm is:
y1 = 3.22 × 10⁻⁴ × x6 − 1.28 × 10⁻² × x5 + 1.77 × x4 − 0.93 × x3 + 1.19 × x2 + 10.54 × x + 10.33
The fitting equation of main frequency extracted by EMD is:
y2 = − 5.38 × 10⁻⁴ × x6 + 2.35 × 10⁻² × x5 − 0.39 × x4 + 3.13 × x3 − 12.29 × x2 + 27.04 × x + 4.87
The fitting equation of main frequency extracted by EEMD is:
y3 = − 4.68 × 10⁻⁵ × x6 + 2.42 × 10⁻⁴ × x5 + 2.51 × 10⁻² × x4 − 0.38 × x3 + 2.20 × x2 − 0.49 × x + 20.61
Using the Euler distance, we evaluated the fitting degrees of the three curves. The value of the Euler distance between the EMD fitting equation and the SSI algorithm fitting equation is 446.7883, and the value of the Euler distance between the EEMD fitting equation and the SSI algorithm fitting equation is 417.2845. According to the principle that the smaller Euler distance, the better the correlation between two curves, the comparison shows that the EEMD fitting equation fits the SSI algorithm fitting equation better. Therefore, EEMD is more suitable for estimating the modal frequency of harvesters. This method can be used to estimate the modal frequency of mass time-varying conditions, such as harvesters, seeders and fertilizer applicators.
5. Conclusions
By analyzing time domain vibration signals of a harvester under operating conditions, it is found that their mean, variance and RMS changed greatly with time, and the vibration signals satisfied non-stationary random features.
The analysis results of EMD showed that modal aliasing existed in the IMFs of 16 test points. The number of IMF components obtained by EEMD is less than for EMD. EEMD analysis decreased modal aliasing and increased accuracy.
It was found that the relationship between frequency and the mass of the harvester is not obvious, and it can be considered that the frequency does not change with the mass when the feeding amount situation is small, the influence of weight change on frequency is relatively small.
The value of the Euler distance between the EMD fitting equation and the SSI algorithm fitting equation is 446.7883, and the value of the Euler distance between the EEMD fitting equation and the SSI algorithm fitting equation is 417.2845. The main frequencies of EEMD have a higher fitting degree with modal frequencies identified by the SSI algorithm, and EEMD is more suitable for estimating the modal frequency of a harvester.
Author Contributions
Conceived of the proposed idea, Y.Y., X.L. and L.G.; designed experiment, Y.Y.; analyzed the data of experiment, L.G., Y.W., X.Y. and X.Z.; writing—original draft preparation, X.L., Y.L. and L.L.; writing—review and editing, Y.Y. and D.G. All authors have read and agreed to the published version of the manuscript.
Funding
All of the authors would like to acknowledge the financial support from the National Key R&D Program of China (2021YFD2000502) and China Postdoctoral Science Foundation (2022M711982).
Institutional Review Board Statement
Not applicable.
Informed Consent Statement
Not applicable.
Data Availability Statement
Not applicable.
Conflicts of Interest
The authors declare that they have no known competing financial interests or personal relationships that could have appeared to influence the work reported in this paper.
References
- Guan, Z.H.; Wu, C.Y. Research Progress on Working Vibration problems of Grain Combine. J. Chin. Agric. Mech. 2017, 38, 21–25. [Google Scholar]
- Temmerman, D.J.; Deprez, K.; Anthonis, J.; Ramon, H. Conceptual Cab Suspension System for a Self-propelled Agricultural Machine, Part 1: Development of a Linear Mathematical Model. Biosyst. Eng. 2004, 89, 409–416. [Google Scholar] [CrossRef]
- Zhou, L.; Zhang, X.C.; Chen, Z.; Liang, X.X. The NVH Phenomena Analysis in Corn Harvester-Based on Vibration Dose and A -meter-weight Noise. J. Agric. Mech. Res. 2015, 37, 245–250. [Google Scholar]
- Zhou, M.G.; Zhang, L.; Chen, Y.; Liu, M.Y.; Huang, Y.P. Structural optimization for rack of boat-type tractor based on sensitivity analysis. Trans. Chin. Soc. Agric. Eng. 2016, 32, 54–60. [Google Scholar]
- Li, Y.M.; Sun, P.P.; Pang, J.; Xun, L.Z. Finite element mode analysis and experiment of combine harvester chassis. Trans. Chin. Soc. Agric. Eng. 2013, 29, 38–46. [Google Scholar]
- Quan, L.Z.; Tong, J.; Zeng, B.G.; Chen, D.H. Finite element mode analysis and experiment of corn stubble harvester. Trans. Chin. Soc. Agric. Eng. 2011, 27, 15–20. [Google Scholar]
- Jin, X.; Chen, K.K.; Ji, J.T.; Zhao, K.X.; Du, X.W.; Ma, H. Intelligent vibration detection and control system of agricultural machinery engine. Measurement 2019, 145, 503–510. [Google Scholar] [CrossRef]
- Xie, X.P.; Jiang, B.; Lei, F. Fast calculation method experimental modal analysis and its application. J. Vib. Shock 2015, 34, 46–52. [Google Scholar]
- Mugnaini, V.; Fragonara, L.Z.; Civera, M. A machine learning approach for automatic operational modal analysis. Mech. Syst. Signal Process. 2022, 170, 1–34. [Google Scholar] [CrossRef]
- Fang, D.X.; Wang, X.M. Modal analysis and experimental optimization of the header of rape combine harvester. J. Gansu Agric. Univ. 2019, 54, 232–240. [Google Scholar]
- Chen, S.; Zhou, Y.; Thong, Z.; Lu, S. Modal vibration response of rice combine harvester frame under multi-source excitation. Biosyst. Eng. 2020, 194, 177–195. [Google Scholar] [CrossRef]
- Guo, X.F.; Wang, W.B.; Guo, S.L.; Chen, S.J. Modal Analysis and Experimental Study on the Frame of the Potato Harvester. Mach. Des. Manuf. 2018, 54, 154–157. [Google Scholar]
- Tang, Z.; Zhang, B.; Wang, M.L.; Zhang, H.T. Damping behaviour of a prestressed composite beam designed for the thresher of a combine harvester. Biosyst. Eng. 2021, 204, 130–146. [Google Scholar] [CrossRef]
- Yu, Y.C.; Zhang, S.J.; Li, H.; Wang, X.F.; Tang, Y.D. Modal and Harmonic Response Analysis of Key Components of Ditch Device Based on ANSYS. Procedia Eng. 2017, 174, 956–964. [Google Scholar] [CrossRef]
- Zhang, L.; Chen, Y.; Zhou, M.G.; Liu, M.Y. Modal testing study on boat-type paddy tractor hull. J. Mech. Strength 2017, 39, 1036–1041. [Google Scholar]
- Guan, Z.H.; Wu, C.Y.; Tang, Q.; Wang, G. Finite Element Mode Analysis and Experiment of Combine Harvester Threshing Cylinder. J. Agric. Mech. Res. 2016, 38, 136–140. [Google Scholar]
- Ryu, S.; Kim, D.; Lee, B.; Han, D.; Jung, I.; Chung, J. Idle Vibration Reduction of a Diesel Sport Utility Vehicle. Appl. Sci. 2022, 12, 5448. [Google Scholar] [CrossRef]
- Silva, R.; Ribeiro, D.; Bragança, C.; Costa, C.; Arêde, A.; Calçada, R. Model Updating of a Freight Wagon Based on Dynamic Tests under Different Loading Scenarios. Appl. Sci. 2021, 11, 10691. [Google Scholar] [CrossRef]
- Yao, Y.C.; Zhao, X.Y.; Du, Y.F.; Song, Z.H.; Yin, Y.Y.; MAO, E.R.; Liu, F. Operating modal analysis and test of harvester induced by mass-varying process. Trans. Chin. Soc. Agric. Eng. 2018, 34, 83–94. [Google Scholar]
- Brewick, P.T.; Smyth, A.W. An investigation of the effects of traffic induced local dynamics on global damping estimates using operational modal analysis. Mech. Syst. Signal Process. 2013, 41, 433–453. [Google Scholar] [CrossRef]
- Lin, C.S.; Wu, Y.X. Response-Only Parametric Estimation of Structural Systems Using a Modified Stochastic Subspace Identification Technique. Appl. Sci. 2021, 11, 11751. [Google Scholar] [CrossRef]
- Ebrahimi, R.; Mirdamadi, H.R.; Ziaei-Rad, S. Operational modal analysis and fatigue life estimation of a chisel plow arm under soil-induced random excitations. Measurement 2018, 116, 451–457. [Google Scholar] [CrossRef]
- Jiao, B.Q.; Cao, J.H.; Lu, B.J.; Zhang, H.Q.; Song, Y.C.; Chen, D.F. Modal test of shaft-mounted brake disc based on polymax modal parameter identification method. China Railw. Sci. 2020, 5, 102–107. [Google Scholar]
- Cong, S.; Hu, S.L.J.; Li, H.J. FRF-based pole-zero method for finite element model updating. Mech. Syst. Signal Process. 2022, 177, 109206. [Google Scholar] [CrossRef]
- Huang, Y.L.; Li, Q.L.; Yao, C.J. Modal analysis and structural parameter optimization of threshing cylinder of combine harvester. J. Agric. Mech. Res. 2019, 12, 30–36. [Google Scholar]
- Geng, J.; Zhang, X.W.; Chen, X.F. High-frequency dynamic response of thin plate with uncertain parameter based on average wavelet finite element method (AWFEM). Mech. Syst. Signal Process. 2018, 110, 180–192. [Google Scholar] [CrossRef]
- Yu, K.P.; Zou, J.X.; Yang, B.Y. Wavelet transform method for mode parameter identification. J. Astronaut. 1999, 4, 72–76. [Google Scholar]
- Harish, C.N.; Sekhar, A.S. Wavelet transform based estimation of modal parameters of rotors during operation. Measurement 2018, 130, 264–278. [Google Scholar]
- Adam, S.A.; Jalil, N.; Rezali, K.; Ng, Y.G. The effect of posture and vibration magnitude on the vertical vibration transmissibility of tractor suspension system. Int. J. Ind. Ergon. 2020, 80, 103014. [Google Scholar] [CrossRef]
- Harmann, T.; Morita, S.; Tanner, G.; Chappell, D.J. High-frequency structure- and air-borne sound transmission for a tractor model using dynamical energy analysis. Wave Motion 2019, 87, 132–150. [Google Scholar] [CrossRef]
- Yan, Z.C.; Jin, Z.H.; Teng, S.; Chen, G.F.; Bassir, D. Measurement of Bridge Vibration by UAVs Combined with CNN and KLT Optical-Flow Method. Appl. Sci. 2022, 12, 5181. [Google Scholar] [CrossRef]
- Ji, J.T.; Xu, L.J.; Pang, J.; Geng, L.X.; Wang, S.S. Minimum amplitude point analysis and optimization of hanging point of miniature grain combine. Trans. Chin. Soc. Agric. Eng. 2017, 12, 28–33. [Google Scholar]
- Zhou, S.D.; Ma, Y.C.; Liu, L.; Kang, J.; Ma, Z.S.; Yu, L. Output-only modal parameter estimator of linear time-varying structural systems based on vector tar model and least squares support vector machine. Mech. Syst. Signal Process. 2018, 98, 722–755. [Google Scholar] [CrossRef]
- Bucolo, M.; Buscarino, A.; Famoso, C.; Fortuna, L.; Mattia, F. Control of imperfect dynamical systems. Nonlinear Dyn. 2019, 98, 2989–2999. [Google Scholar] [CrossRef]
- Wang, Y.J.; Kang, S.Q.; Zhang, Y.; Liu, X.; Jiang, Y.C.; Mikulovich, V.I. Condition Recognition Method of Rolling Bearing Based on Ensemble Empirical Mode Decomposition Sensitive Intrinsic Mode Function Selection Algorithm. J. Electron. Inf. Technol. 2014, 36, 595–600. [Google Scholar]
- Bucolo, M.; Buscarino, A.; Fortuna, L.; Mattia, F. Multiple Hysteresis Jump Resonance in a Class of Forced Nonlinear Circuits and Systems. Int. J. Bifurc. Chaos 2020, 30, 13. [Google Scholar] [CrossRef]
Publisher’s Note: MDPI stays neutral with regard to jurisdictional claims in published maps and institutional affiliations. |
© 2022 by the authors. Licensee MDPI, Basel, Switzerland. This article is an open access article distributed under the terms and conditions of the Creative Commons Attribution (CC BY) license (https://creativecommons.org/licenses/by/4.0/).