Article

Neuromarketing in the Digital Age: The Direct Relation between Facial Expressions and Website Design

by
Guillermo González-Mena
1,†,
Carolina Del-Valle-Soto
1,*,†,
Violeta Corona
2,3,† and
Jafet Rodríguez
1
1
Facultad de Ingeniería, Universidad Panamericana, Álvaro del Portillo 49, Zapopan 45010, Jalisco, Mexico
2
Escuela de Ciencias Económicas y Empresariales, Universidad Panamericana, Álvaro del Portillo 49, Zapopan 45010, Jalisco, Mexico
3
Business Management Department, Universitat Politècnica de València, Camino de Vera s/n, 46022 Valencia, Spain
*
Author to whom correspondence should be addressed.
These authors contributed equally to this work.
Appl. Sci. 2022, 12(16), 8186; https://doi.org/10.3390/app12168186
Submission received: 6 July 2022 / Revised: 2 August 2022 / Accepted: 12 August 2022 / Published: 16 August 2022
(This article belongs to the Section Applied Neuroscience and Neural Engineering)

Abstract

:
User experience (UX) is key in the immediate and future relationship between the client and business. Achieving a satisfying UX can only be achieved by understanding the wishes and user needs. The following study is carried out as an improvement tool for a Mexican coffee company. The objective is to achieve greater efficiency, attraction, and engagement on the part of the user. The main question is whether the new dynamic website design can directly increase the valence of user emotions compared to the static website design. To answer this question, 39 participants were exposed to the two different web page designs and elicited the following emotions using eye tracking and facial expression analysis (FEA) techniques: joy, anger, surprise, fear, contempt, disgust, sadness, neutral, positive, and negative. Through a Wilcoxon signed-rank test, the results showed a significant increase for the new dynamic design in the following emotions; joy, anger, surprise, disgust, fear and neutral. Thus, five of the seven basic emotions had a significant change that could lead to greater attraction and commitment on the part of the user and also influence, either consciously or unconsciously, their decision when interacting with the company.

1. Introduction

Throughout human history, we have tried to answer every question we have encountered, but key questions that are so ingrained in human nature such as why we are here, what drives our actions, and how to interpret human behavior are too complex to be answered in a lifetime of study. The complexity of these questions lies in the axiom that each human being is a different world and in the interaction of the human spectrum: actions, cognition, and emotions. Despite substantial recent progress, our understanding of the principles and mechanisms underlying complex brain function and cognition remains incomplete. That is where neuroscience comes in with a very direct focus on answering these complex questions through the stimulation and observation of the human brain [1].
To fully understand the field of neuroscience, we must first know the aspects on which it is based and that are the object of study. The fundamental object of study of neuroscience is the one that has an intrinsic relationship with the human being: the brain. The brain, which is a physical organ, is made up of blood vessels and nerve cells, and its functionality is based on a complex neural network. The brain controls thought, memory, emotion, touch, motor skills, vision, breathing, temperature, hunger, and every process that regulates our body. By understanding the brain, we can have a better understanding of the human body and its physiological implications [2]. Now, there is an abstract aspect often directly related to the brain: the mind. The debate about the difference between brain and mind has been going on since the time of Aristotle. The mind is a hypothetical thing and defined by Sigmund Freud as a model of three different levels: conscious, subconscious, and unconscious, the first that includes all the thoughts and actions within our awareness, the second that defines all the automatic reactions and actions that we can become aware of if we think about them, and the last with all the past events and memories, although sometimes inaccessible to us no matter how hard we try to remember [3]. Research on the first level of the mind can be obtained through surveys and questionnaires, but the second and third levels need a different approach to obtain the information correctly.
It is here where neuroscience tries to respond with an objective approach that has not been biased by the subject because of some social situation or context, but rather, captures the reaction and the complete behavior. Basically, this means that neuroscience focuses on the unconscious mind rather than the conscious mind and often relies on fields such as electroencephalography (EEG), facial expression analysis (FEA), and electrocardiography, which read physiological reactions directly from the subject to answer on behavior and cognitive questions from a more objective perspective. These techniques recover metrics such as attention levels, cognitive load, memory, and emotions, which can then be interpreted given the context and the objective sought.
There are several branches in neuroscience, each with a different approach, some trying to obtain a structure of the brain, others how it works, and some others with a closer approach to human behavior. Three major branches try to tackle the human behavior approach: Affective Neuroscience, Behavioral Neuroscience, and Cognitive Neuroscience. In the case of Affective Neuroscience, the objective is to understand how the brain and its components are related to emotions, giving an important role to emotions in the modulation of cognitive and behavioral processes [4]. Another branch is Behavioral Neuroscience, which focuses on investigating the brain’s neurons and their implications for behavior and psychological events, which may eventually lead to answering how the brain directly affects the physiology of the human body. The last branch is Cognitive Neuroscience, which researches the direct link between brain processes and the conception of thought, learning, and memory [5]. The brain and, especially, the mind having a very complex spectrum, it is mandatory to try to understand their behavior from a perspective that considers a combination of fields that can potentially lead to a response.
One field that benefits directly from knowing the needs and wants of humans is marketing, which focuses primarily on delivering value to goods and services for later sale. This implies that the better the understanding of the client, the better the product can be adapted to what they are looking for. Traditional marketing has focused on learning what drives people to buy one product over another by studying their feedback and direct responses, which eventually turns into a solution for a given situation. It is based on aspects such as attention, familiarity, and attractiveness for a consumer to choose the target product over others, and the common techniques to investigate it are focus groups, observation, and field trials; this implies a high variation of answers, and most of the time, it is based on qualitative, rather than quantitative studies. What this type of approach does not consider are unconscious consumer factors, which can eventually lead to personalized solutions completely biased by what the subject wants us to know, rather than what they really want and need. This bias can come from different factors, such as cultural, political, or religious, to name a few, and directly affect self-reported responses, which can completely mislead the search for truth.
That perspective of unconscious factors has been trying to be filled with neuromarketing, which combines neuroscience and marketing to understand what is behind consumer behavior. This approach uses the techniques of neuroscience to retrieve quantitative data from a consumer to be analyzed from a marketing perspective, which could eventually lead to better resource management and sales rates [6]. This is performed through stimuli—marketing object—applied directly to the consumer, which elicit metrics such as levels of emotions, attention, and memory, which can then be interpreted in consumer behavior. Neuromarketing suggests that both emotional and rational thinking co-exist and are interdependent [7]. Through emotions, it is possible to obtain a subject’s attention to later focus the rational brain onto the situation presented. Even when neuromarketing tries to obtain better solutions, success is always accompanied by possible failure due to the same complexity of the human being, which presents cases where satisfied customers can leave the brand, or the opposite case, where dissatisfied customers can reach the brand [8]. Finding the hidden reactions and responses of the consumer could eventually lead to a more objective solution that can meet and satisfy the needs of the consumer. As shown in [9], affective neuroscience applied with a marketing approach has proven accurate when it comes to customer reaction to the product. As noted in the study, there is a need to unite neuroscience with another field, such as marketing, to provide more useful insights into consumer behavior leading to ultimate understanding of the cognitive mechanisms underlying human behavior. This correct elicitation of quantitative metrics can be interpreted with machine learning techniques, which can eventually predict and classify the quantitative data in pursuit of the target, as seen in [10].
Another aspect that fully benefits from understanding the human spectrum is the user experience (UX) [11], that is all those experiences created and shaped through technology. These experiences are memorized stories of use and consumption and distinct from the immediate moment-by-moment experience. To achieve the objective, it takes a different angle when it seeks to reach the user: it is about transcending the material [12]. Thus, the human being is once again the objective, and experience is the way to reach it; by correctly stimulating cognition and emotions, a better UX can be achieved. To achieve an experience, it is first necessary to generate interaction between the subjects from which said experience will come. However, to achieve the interaction of both subjects, it is necessary to achieve a relationship, regardless of its conscious or unconscious nature, which is achieved when one subject captures the attention of the other, and this can be achieved with salience. In UX, the goal of salience will be to capture the subject’s attention, but it will be the task of design to retain and generate the experience. The better the design, the better it can stimulate user feedback, which can react in a more positive way and create a better UX that encourages the user to continue to engage with the product.
The current study builds on the theories put forth by presenting stimuli to a consumer for observation and further analysis. More specifically, we present the design of a website to a consumer, and we measure the emotions provoked by this stimulus to analyze these consumer reactions to try to model a stimulus–reaction relationship. We consider emotions as a key factor in the modulation of behavioral processes, which can potentially lead to a consumer behavior model that can satisfy their needs with the correct use of UX. This work’s primary motivation is applying technological techniques such as virtual reality and augmented reality (AR) to advertising and improving customer perception. With the proposed methodology, we observe the client’s behavior toward a brand of Mexican coffee. We analyze their main emotions regarding the brand’s website and significantly alter the interface so that the customer interacts more experientially with the brand’s products and branches. We analyze the perception, attention levels, and emotions about the coffee brand through two approaches: an eye tracking technique, which directly reports what the user is seeing, and a post-survey, which reports what the user perceives and how it is perceived. With this study, we intend to highlight the use of technology applied to neuromarketing and its positive appreciation in potential clients.

Related Work

Today, companies seek to connect the product with consumers through the presentation of stories in which they can identify themselves, establish solid links, and at the same time, remain engraved in their memory. The application of marketing in neuroscience has given rise to neuromarketing, which is responsible for understanding customers’ impulses, feelings, and emotions during this process [13]. It thus favors the purchase decision, allowing interaction between consumer and company. The perception mechanism is an abstraction. In the nervous system, there is a reconstruction in which an internal representation of the object is elaborated. Its shape, movement, color, and properties are analyzed [14]. The meeting of all these characteristics is performed as a whole, but according to the rules and language of the neural circuits. It is an act of interpretive reconstruction. In [15], the authors study perception, which has a significant influence on the purchase decision process. This perception will be shaped by a process that will begin with observation (activation of the five senses), the influence of internal and external factors, and the consumer’s interpretation and, finally, will trigger a behavior (purchase or rejection of the product/brand). The response obtained will be guided by the motivations, feelings, and emotions that the brand/product triggers in the consumer.
One of the main activities of living beings is to eat and drink, and this is where the most significant sensations are captured in the brain. Language is a decisive element in perception since it allows analyzing various components of the object, enriching the range of sensorial nuances, making conscious aspects that would go unnoticed, and unifying and synthesizing the stimuli of an object with a word [16]. Here, the question is whether we can put a quantitative amount to the contribution that each of the senses in front of a stimulus makes.
Capturing the consumer’s visual attention should be regarded as a primary objective in marketing communications, given the information overload in today’s marketplace [17]. Previous research in advertising has shown that viewers pay more attention to the text than pictures [18], which is still debatable and, in fact, was one of the motivations for this research since we compared two web pages: one with text about the brand and the second with images that refer to the brand. The work of Wall et al. shows that online platforms and e-commerce sites guiding the customer in their purchase help close the sale. The authors study how people form first impressions online; furthermore, this perspective matches the interest of our paper on examining the factors that influence online platforms. Here, a question arises: Are platform users correctly receiving the message that the system is trying to convey? In other words, there are theoretical implications of how we behave online and how others use this behavior to form judgments of perception, attention, and information gathering, which can boost or reduce sales [19].
In [20], the authors present a study of the sensations of people before the stimuli of food and drink. The theory of symbols and sensory languages arises from the idea that the human visual system has evolved as an instrument to perceive the real physical environment in human life. This facilitates the perception of this environment and hinders another type of perception. The sensory aspects of visualization are related to the stimulation of the visual sensory system. Its study and interpretation are performed through the experimental techniques developed by sensory neuroscience. In [21], they describe the importance of UX and how to optimize their perception against what they observe. One of the main stimulus detectors is eye tracking, which is our study’s object. In this work, the authors establish a method to fix the center of attention, considering factors such as density and distance. They propose clusters to differentiate the main centers of attention of the viewer. The detection of the central point of interest is based on an algorithm. This is very useful for a product or a brand to check if this visual center coincides with what you want to project to the client or viewer. One of the main functions of color in advertising is to attract the public’s attention to arouse their interest. Colors provide an instant method to communicate messages and meanings in logo design. They are probably the most powerful form of non-verbal communication we can use. Through eye tracking technology, advertisers can gain a closer picture of how consumers perceive their campaigns. Lohse et al. in [22] study color in visual impact. Some factors that influence the customer experience are size, color, page position, location, and the amount of information. The authors find that color is the second-most important item in the care of an advertisement. They obtain results of the percentage of attention to factors such as density of fixations, color, graphics, and position.
As consumers’ lifestyles change, this is evolving the way they buy, work, and have fun, in short: the way they live their lives. In response, technology is refined to address the new demand, maximizing the use of big and predictive data to process user consumption data and anticipate their needs and future desires. The presented advertising should contain aspects of demographic information, brand history, habits, and information about individuals. These aspects are captured thanks to the perception of sensations in the individuals who observes a web page or a product [23]. In our work, we measure the attention and emotions a website causes in a customer and compare their reaction when this website has multimedia tools such as visual effects. When we visually explore a scene, the eyes do not move smoothly, but rather by jumps or rapid movements (30–120 ms) called “saccades”. During these movements, vision is practically suppressed; we stop seeing even if we are not aware of it. One of the metrics of analysis to understand the attention of a customer is eye tracking. In computational terms, these algorithms are identified spatially and temporally. In the work of Salvucci et al. in [24], the criteria for dividing spatial algorithms are: velocity, dispersion, and area-of-interest information. The criteria for separating temporal algorithms are the use of duration information and local adaptivity. In the authors’ work, they perform a quantitative and qualitative comparison of these algorithms and their efficiency, which are more restrictive, and what implications they have on a set of information. Eye tracking and information provided by eye features have the potential to become an exciting way to communicate with a computer in a person–computer interaction system. Cognitive understanding and visual processing play an essential role in the statistical analysis and description of an observed model. The problem of identification is a subjective process, so it is critical to have a reliable algorithm to compare the results of fixations with subjective impressions. That is why, in our work, we corroborate the metrics obtained by the software with a post-survey, which collects the user’s opinion regarding the website, thus allowing a more complete analysis of the interaction considering both factors: objective and subjective. A case study is exemplified in Turkish e-government services in the work cited in [25]. This case is analyzed based on quantitative tests by an eye tracker and supported by a questionnaire. Qualitative measurements were made based on interviews and observation. This is a significant example because government websites provide welfare to citizens and are widely requested for all types of services. This is where different platforms based on technology and multimedia resources can be implemented. Eye tracking research yields good commercial and academic results regarding computer interaction, and this work shows specific times of consumer response from the beginning of a session to the logout.
In another case, the authors try to study the areas in which AR could be implemented in advertising. They found the following: enhancing sportive events and inserting or replacing advertisements in a scene in terms of commercial applications. For mobile applications, they propose new applications in navigation, situational awareness, and geolocated information retrieval [26]. Finally, they study innovative applications such as integrating mobile warfighters collaborating with units in a virtual reality military simulation.

2. Materials and Methods

This study is a cross-sectional experiment conducted in a laboratory, which allowed strategic alteration of the only independent variable: stimulus state. The stimuli analyzed in this study were the following: dynamic website design (Figure 1) and static website design (Figure 2) and were presented in an ideal time of 6s and at a rate of 30 frames per second (fps). Subjects volunteered with a total of 15 women and 24 men and, at the time of the study, were between the ages of 18 and 22, were pursuing a Bachelor’s degree, and had an affinity for coffee. The experiment followed the structure of an A/B test with a random stimulus sequence, that is the subject could be exposed first to the dynamic website design and then to the static website design or vice versa, in order to have a more accurate representation of the behavior of the population.
Data were collected in 2019 through a Tobii X2-30 video-based eye tracking screen with a collection rate of 30 Hz and processed by iMotions Attention Tool 5.2 software—the underlying using Affectiva—with the following inputs in Table A1 and the outputs seen in Table A2. The data preprocess consisted of the following steps: suppression of subjects’ names for anonymity purposes, suppression for uniquely valued attributes, and those dependent—which can be calculated by other attributes—discretization—categorical attributes were converted into quantitative—and scalar transformation—values ranged between 0 and 1. Data analysis was carried out in 2022 with Python 3.7.13 and the following libraries: pandas 1.3.5, scipy 1.4.1, and sklearn.
To accompany the objective approach of the study—data collected through software—we conducted a survey on the users at the end of the interaction with each scenario of the web page with the questions listed in Table 1. This means, first, one web page was presented, and when it was finished, the post-survey was answered; then, the second web page was presented, and when it was finished, the post-survey was answered. All the questions were presented on a single page on the scree, n and each one had a slider with the range listed in Table 1. There was no time limit or fixed order to answer them; all the answers were sent at once when the user clicked the Continue button. This survey reflects the main usability metrics for the web page, giving insight into how the user perceives the design and interacts with it. It is a qualitative measure of the UX that can be used as feedback of how good or bad the perception of the user was. With this activity, we obtained advantages such as describing if a design helps or hinders the UX, checking if the designs improve over time, objectively comparing the UX concerning the competition, comparing the UX to industry standards, and having an idea about what could happen if we implement the new design. Then, after interacting with both designs and answering both post-surveys, a similar final survey was presented with the questions listed in Table 2. The direct intention of said survey was to obtain the opinion of the users after comparing both website designs and reporting if there was any improvement between designs.

2.1. Study

UX is a key basis for achieving products that satisfy the wishes and needs of the user, which is why fields of study such as neuromarketing have developed more and more with better solutions that are specifically aimed at meeting these wishes and needs through analyzing the actions, reactions, and behavior of the user [27]. The latter is the main objective of the Mexican coffee company, which wanted to answer the question of whether a website design composed mainly of images and a dynamic image—defined in this study as on-stimulus—can evoke a greater reaction and attraction from the user than the design of a website oriented toward text and without dynamic images—defined in this study as off-stimulus—mainly focused on college students to understand better how to improve the website for that market. That is why the study took a neuroscientific approach along with a marketing aim to provide the rationale and clarification of the cause and effect on user behavior by looking at on-stimulus versus off-stimulus interaction [28]. Eye tracking [29] biosensors and facial expression analysis (FEA) [30] were used to quantify the observable reactions, and the following basic emotions were obtained: joy, anger, surprise, fear, contempt, disgust, sadness, as well as the final valence of these emotions as follows: neutral, positive, and negative. The choice of quantifiable dependent variables allowed the study to have a clear statistical path to objectively compare whether there was a real change in on-stimulus versus off-stimulus interaction by comparing the difference between the emotions evoked by these two states. The software used for the website interface modifications was Unity Pro.
Based on this, the experiment was designed with 3 main steps: The first one was to develop some marketing material that could be shown to a panel of participants. The second step was to recruit people ready to be part of the experiment. Finally, the third step was to acquire a device that helped to measure the emotions of the participants for different instances of the experiment. It is important to mention that the following materials developed were based on a Mexican coffee brand called “La Borra del Café®”, so this project specifically is about a coffee brand menu.
The sample consisted of 39 young Mexican university students who volunteered to be a part of the experiment. These subjects were exposed to various stimuli consisting of both website designs and various questionnaires, but within the scope of this study, only stimuli related to website design were analyzed. The experimentation was carried out inside a laboratory and measured in a cross-sectional manner. The main results demonstrated—through a Wilcoxon signed-rank test—a significant increase in the on-stimulus effect in the percentage of observable time of the following emotions: joy, anger, surprise, disgust, fear, and neutral. The latter is essential to demonstrate that there is a higher reaction and engagement on the part of the user with the dynamic design of the website.
Taking into account that familiarity with the product can influence the intensity of facial microexpressions, it was considered pertinent to study the generation of young coffee consumers, who have shown an increase in the consumption of the category. According to a survey published in January 2022 by the National Coffee Association (NCA), consumption among 18–24 years has risen 14% in the last year (National Coffee Association of USA, 2022) [31].
Six different materials were developed:
1.
Two menus: (a) one with AR, (b) one without AR;
2.
One survey for the menus (used twice);
3.
Two websites: (a) one with AR, (b) one without AR;
4.
One overall survey.
Table 3 comprises several elements that are part of the appreciation of an interface [32]. We describe the main elements that directly impact the emotions of the users. Color parameters, shapes, intensities, contrasts, movements, and repetitions influence us. These elements make up (some to a greater extent than others) the virtual and AR interfaces, which we wanted to implement in this study.

2.2. Hypotheses’ Development and Motivation

In previous times, marketers could understand consumers through the everyday experience of selling to them, but currently, industries have had to resort to consumer research to find answers to crucial questions. The perception of the situation influences the behavior of a motivated person. We all perceive an object or stimulus through sensations, that is stimuli that are received by the five senses. However, each person attends to, organizes, and interprets this sensory information individually. Perception is defined as the process by which an individual selects, organizes, and interprets the information he or she receives, to create an image of the world with meaning.
The UX covers all aspects of the interaction of the end user with the company, its service, and its products.
Hypothesis 1 (H1).
The positive appreciation of a user or potential client depends on the interactivity of the web page’s interface using different methods of observation and collection of comments.
Hypothesis 2 (H2).
There are specific facial expressions when a user manipulates websites, impacting his/her emotions.

2.3. Web Design

Web design is a cornerstone of the digital presence for a company. Depending on how the site is planned and executed, the user can benefit from responsive items and easy-to-use solutions. Therefore, the quality of a company’s website is important to attract customers and improve the perceived quality of the company itself, as well as to boost the trust in the brand [33]. Unfortunately, web design is cumbersome, and the lack of a unified standard can create different interactions and experiences. One possible challenge comes from the diversity of devices that can browse the Internet with different aspect ratios and visualization performance. Therefore, the design has to carefully take into account and prioritize which aspect ratios are most likely to amount to the majority of the access to the site. Then, the consideration of different strategies can be used based on the contents that a website allows, for instance the combination of text, pictures, graphics, animations, and interactive elements. The right combination of the before-mentioned tools can boost the attractiveness and retain the attention of users for more time [34]. In the last decade, there has been an enormous interest in allowing more kinds of content to be available online and to improve the general experience of a user. Among the additions are video codecs such as h.264 and hevc, which allow high-quality videos to be streamed directly to the browser so the customer can enjoy the content as intended [35]. Furthermore, the improving of stitching algorithms [36] has allowed the creation of panorama images, which are based on taking a series of photos and, then, putting them together to form a spherical image. Ultimately, a website or app can apply all the technologies mentioned before and still not capture the attention of the user, but if all stimuli are correctly set and placed, then the user could have an improved experience, like TikTok [37].

2.4. Eye Tracking

Eye tracking technology uses high-speed cameras to track the movement of eyeballs, pupil dilation (pupillometry), and subject flicker, among other factors. It is a technique by which eye movements of an individual are measured. By using eye tracking technology, a researcher can know what a person is looking at each moment and the sequence in which his/her eyes move from one place to another one. Tracking users’ eye movements can help to understand the processing of visual information and factors that may have repercussions on the usability of an interface. Therefore, eye movement recordings can provide an objective data source for the evaluation of interfaces, which provide information to improve the design. Eye tracking has taken tremendous steps to overcome many of the original issues it had. Eye tracking is based on recognizing the orientation of the head and finding the position of the eyes to determine the direction of the vision. This algorithm has to be performed in milliseconds to obtain enough information about how the eyes rapidly change focus and to understand the reactions of the customer. This kind of tool allows the user to avoid touching a device, which can be helpful when the user does not have a limb. Eye tracking has been used to help in many areas from from medicine [38] to marketing [39]. Regrettably, every technology has advantages and disadvantages: Reference [40] found that when a user is unrestrained and not trained on how to use an eye tracker, then it is highly possible to obtain inaccurate data, specifically when only one eye is visible, but the system still believes that it is correctly tracking two eyes. In other words, researchers have to give extra attention to how they explained the correct posture during a session to analyze data that are more likely to be accurate. One important thing to mention is this kind of device’s purpose is to gather information. Afterwards, the researcher can use other software to analyze the data and reach conclusions.

2.5. Facial Expression Analysis

FEA is the process in which the human face is observed, parameterized, and analyzed for various purposes such as elucidating emotion, alertness, cognitive processes, and physical effort, among others [41]. FEA is based on the Facial Action Coding System (FACS), which derived from an anatomical analysis of the human face and its movements [42], where the basic unit for analysis is an action unit (AU), which is a configuration caused by the contraction of one or several facial muscles [43]. The combination of AUs can be interpreted given the context; in the case of emotions, the combination can result in the observation of a specific emotion with precision and a duration. These last two attributes can lead to different classifications for facial expression: macroexpressions, microexpressions, and subtle expressions. Depending on the objective sought and the point of view of the investigation, a threshold can be established for the correct elicitation of emotions. Different techniques can be used in order to collect and analyze facial expressions: facial electromyography, live observation, and manual coding or computer vision algorithms. Computer vision algorithms have become more popular than human coding because of their objective component, which tries to avoid any error-prone human factors, and is easier to set than facial electromyography. For this technique, there are two basic key tools for the correct detection and use of FEA: a camera and a database, where the first will serve as an input retriever and the second as a basis for comparison, which means that the higher the quality of the component, the better the accuracy is. The camera captures the subject for further analysis, which, in a broad definition, will have 3 steps: face detection, feature detection, and feature classification. The first will narrow down the input to the subject’s face, where, in the second step, the algorithm will detect key points on the face, which will be measured and calculated in the third step for further classification. The classification algorithm will use the quantitative representation from the last step to statistically compare with the database to retrieve a classification accuracy. As stated above in the emotional context, an FEA process will retrieve an emotion for later interpretation, thus serving as a tool for input retrieval.

3. Results

The participants were undergraduate students. The recruitment message was disseminated through emails to students on campus. In addition to the requirements regarding age and language, a qualified participant needed to have normal or corrected-to-normal vision.
During recruitment, respondents were informed that their eye movements would be recorded during the experiment, although information about the specific purpose was not revealed until after the survey was completed, because knowing the purpose of the experiment could possibly induce bias.
Respondents were informed about the procedure of the experiment and the topics of the surveys and given general instructions regarding eye tracking. The eye tracker was calibrated using a nine-point calibration method ensuring that the mean difference between the measured gaze data and the target point was under or equal to 40 pixels (equaling a visual angle of about one degree viewed at 60 cm).
In total, 60 participants were recruited. Each participant scheduled a time slot of twenty minutes in the research lab for the eye tracking experiment and questionnaire survey, which would be described. Due to the inability of some subjects to be precisely calibrated, complete eye movement data were recorded for 39 of the subjects. The mean age of the users was 20, with 24 males and 15 females.
When participants arrived at the lab, they were seated in front of an external 12-inch monitor with a resolution of 1280 × 1024 pixels and were required to adjust their sitting position in order to guarantee the calibration of the eye tracker. The monitor was approximately 60 cm from the participant’s eyes. For optimal eye tracking, the distance from the participant’s eyes to the eye tracker should be approximately 60–65 cm (23–26") for most screen-based eye trackers from Tobii Pro. The survey was presented on a Tobii X2-30 video-based eye tracking screen with a collection rate of 30 Hz using the iMotions Attention Tool 5.2 software. The eye tracker desktop ran at 30 Hz. This allowed evaluating different types of stimuli such as graphic pieces, the usability of the web sites, and commercial and other applications. The computer used was a laptop Dell Latitude 3550 with a Core i3 processor at 1.7 GHz and 4 GB of DDR3 RAM.

Scenario Design

The stimuli consisted of two website home page layouts, as seen in Figure 1 and Figure 2. For the old website, the color scheme was strictly composed by the company colors: red, black, and white. As Gelasca et al. [44] states, the color red has a high index of prominence, and this, together with the size/quantity, aims to capture the user’s attention. The placement of the text on the left side was in keeping with the Western trend of reading from left to right. The slogan and the advertising phrase tried to appeal to the cognitive spectrum of the human being to provoke the commitment with the brand. For the new website, the color scheme remained the same for the layout. The size/amount of the color red was replaced by the coffee cup image animation, which served as salience through motion appeal and a dynamic preview of a company branch location (Figure 3). The animation of the coffee consisted of an elevation of the liquid to the left and then towards the brand name until they become one; finally, the liquid falls into the cup and explodes throughout the image. Figure 4a–c are frames captured from the new website’s coffee animation happening in the same order as shown in this document.
Two homepage designs were evaluated. The participants could view each homepage for 2 min and surf through said page by scrolling up and down. In the case of the preview location element inside the new design, the user could click and drag the interactive image to visualize different points of view for said location of the company branch. Other homepage elements in both designs were not interactive; all buttons that redirect to any other page were disable, preventing from leaving the homepage for complete interaction with the design. This means that users could only interact within the presented homepage—old or new homepage design. In order to align the starting point of visual attention for both websites, respondents were asked to fixate on a fixation-cross, which was presented for two seconds before the start of each homepage. At the end of the interaction with the homepages, the users answered the survey using an ordinary computer mouse. Each experiment took about 15 min on average to complete. The data collected included the eye gaze data in specific areas of interest (AOIs) of the homepages and their responses in the post-survey. The eye gaze measures that were used in this paper were the number of fixations and the percentage of time spent on each AOI. Both of them are measures of attraction. The number of fixations indicates how easy something is noticed; in contrast, the percentage of time on an AOI shows how much interest an object received once it was seen [45]. To calculate the percentage of time spent on an AOI, we divided the total dwell time on an AOI between the total dwell time on each homepage (2 min). A larger percentage fixation time within an AOI means that the participants spent more visual attention in that area. Along with the AOI metrics, a heat map of the gaze of the subjects was elicited to have a more visual representation of the attention intensity in the designs.
Table 4 shows the data collection process, from the user’s arrival until he takes the web page assessment surveys.
The resulting heat map of the off-stimulus (Figure 5) indicates key fixation points in the design:
1.
Brand slogan in white font.
2.
Brand name in white font.
3.
Brand name in white font in company sign.
4.
Brand advertising phrase in black font.
5.
Menu button.
These hotspots were ordered by the ratio metric—count of users who fixed on that area over the total number of users—of the corresponding AOI in Figure 2 to give an importance index based on user attention levels. Note that the Menu button was not an AOI set within the studio; however, it is a hotspot within the heat map, so to diminish its importance, it was decided to place it in the last position. For all other hotspots, the AOI description was listed for better reference. The most fixated item was the brand’s slogan in white font, which is placed on the left side of the design, which, considering that the users are from the Western Hemisphere, can be directly linked to the reading direction from left to right; another important factor to consider is the area covered by the slogan as it is the highest of the AOIs, which can directly influence the ratio. The next hotspot is the brand’s name in white font, which is placed right next to the brand’s slogan; these two hotspots are directly linked by the green path that connects them both, which could be interpreted as the proximity between them had an impact on the ratio. Following in the list is the brand’s name in white font in the company sign, which is placed in the top-right corner of the design, which is far from any other hotspot and does not apply in left–right reading implications. This makes the brand name on the company sign the dominant salience on the right side, which could be related to the fact that it is the most recognizable font in the image; it is a part of or the salience of the black color in the image with a distinctly red load or could be due to a familiarity factor. The fourth hotspot is the brand’s advertising phrase in black font, which is placed in the left side just right below the brand’s slogan, which is completely overlapped by the heat map colors, making it unreadable, which must indicate that it indeed is read by the subjects. Unlike the brand name located on the right side of the brand slogan, this hotspot does not have a clear connection with the former even though it has a larger area; this could be interpreted once again with the way of reading from top to bottom and from left to right. Lastly, the menu button found in the top middle of the layout—which has enough fixations to be considered a hotspot—could be interpreted as subjects’ familiarity with website layouts and user interfaces (UIs). An interesting thing about the menu button is its white color, which appears on most hotspots, which could indicate a prominence factor in this kind of red-loaded design. In general, the heat map is left-loaded and does not contain any significant hotspots in the lower right and upper left corners; this is related to the fact that no salience is found within those areas. This may be directly related to the type of reading from left to right and the fact that the left part is mostly covered in letters. Interestingly, the bottom right corner buttons have no fixations.
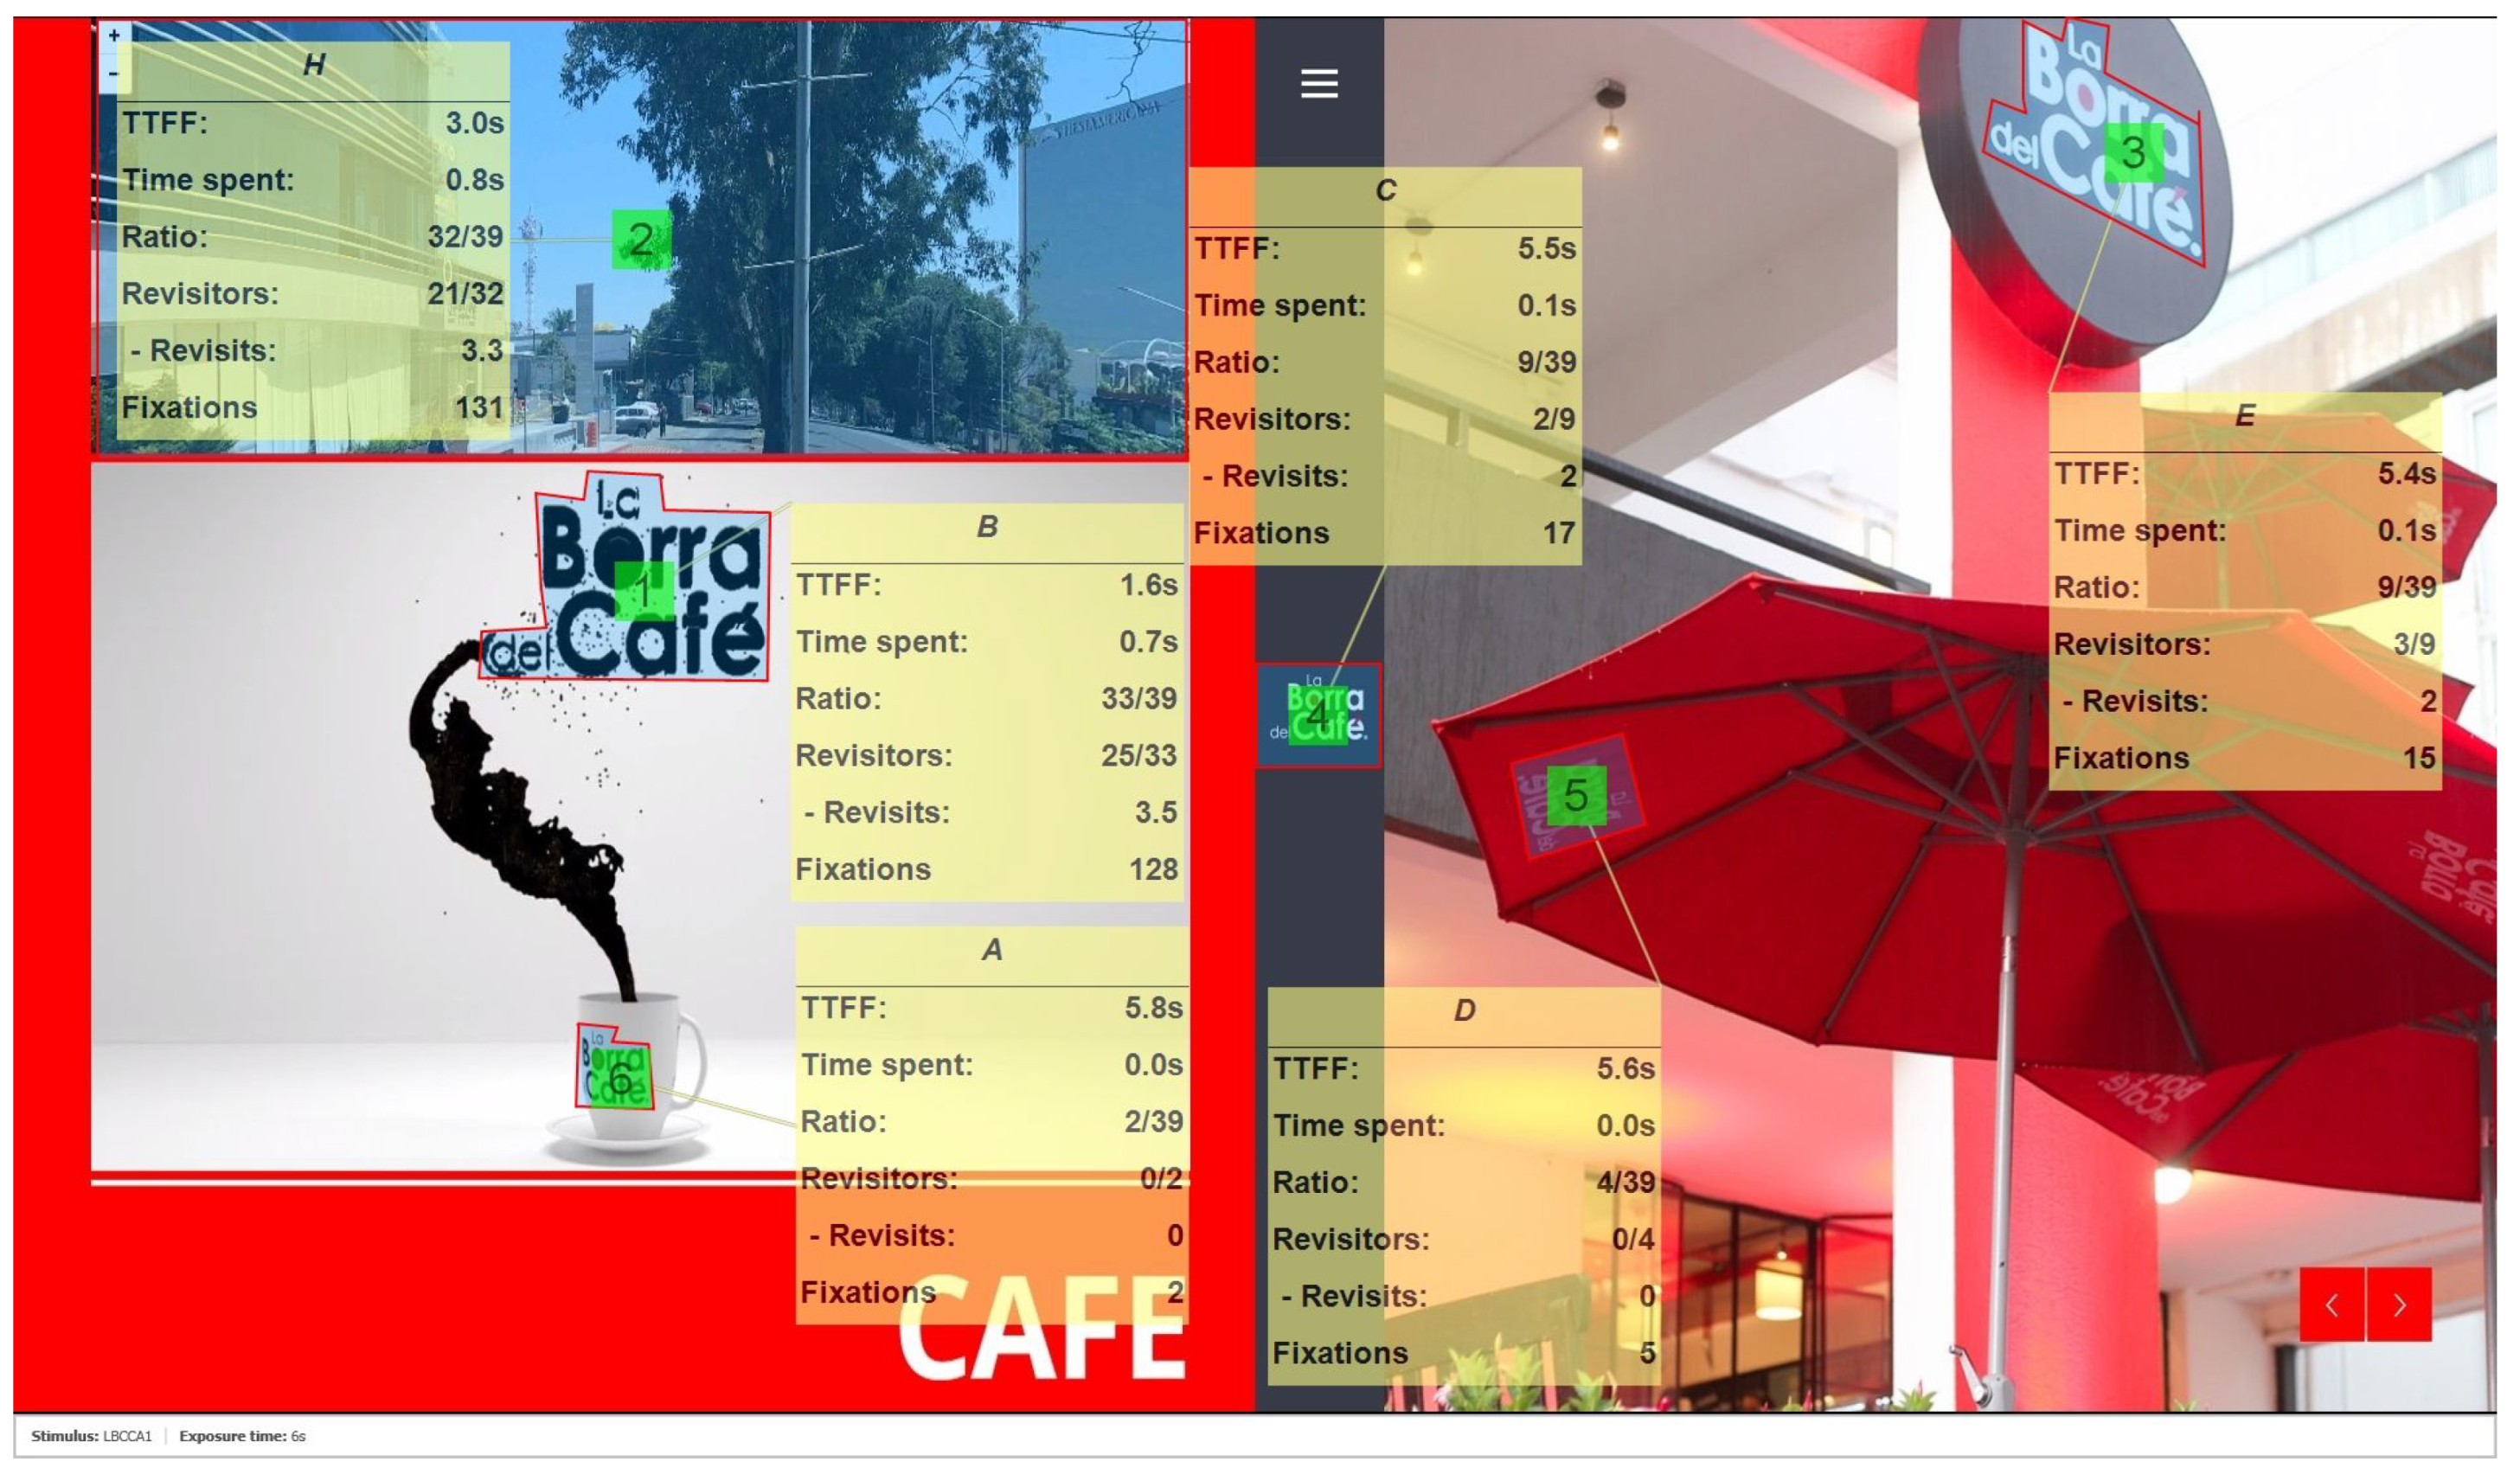
The resulting heat map of the on-stimulus (Figure 6) indicates key fixation points in the design:
1.
Brand name in black font within animation.
2.
Company branch location preview.
3.
Brand name in white font in company sign.
4.
Brand name in white font.
5.
Brand name in black font in cup within animation.
6.
Liquid coffee within animation.
These hotspots were ordered in the same way as their off-stimulus analysis counterpart, but according to their own corresponding AOI in Figure 1. Note that the liquid coffee within the animation was not an AOI set within the studio; however, it is a hotspot within the heat map, so to diminish its importance, it was decided to place it in the last position. For all other hotspots, the AOI description is listed for better reference. The most important hotspot, which is more than clear, is the brand name in black font within the animation in the left side of the design, which is due to the fact that it is almost completely covered by the only hotspot with a high intensity of attention. This indicates the salience of the animation and the whole design itself, in terms of attention, which could be interpreted as future familiarity with the brand. The reason behind this salience could be due to the fact that it is the most recognizable font within the animation. The second-most important hotspot is the company’s branch location preview, and it has a direct connection with the first one as it is right above it, and it can be seen in the shape of the main hotspot that has a yellowish tail on top. Even though the area of this AOI is larger than the previous one, it does not have a higher ratio since, along with the main hotspot, it only contains two other minor hotspots. The next hotspot is the brand name in white font in the company sign located in the upper right corner. This hotspot is the same as the one in Figure 5, but in this case, the area covered by the hotspot is significantly less along with the attention intensity; this can be clearly interpreted as the salience of the AOI among the others became less effective, which is an expected result of the study since most of the attention should be either on the animation or the company branch location preview. As in the last one, the brand name in white font hotspot in the center became less salient, indicating that it also lost relevance compared to the other AOIs. In Figure 5, there is a clear connection between the left side components and the centered brand name that was lost in this design, which may be due to the animation, as it focuses mainly on the center of the image and does not provide the same closeness. The loss of relevance for the centered brand name and brand name in sign hotspots, compared to Figure 5, allowed us to assume that the salience of the left side of the design—animation and location preview—was made greater than any other component in the website design, just as expected. The last hotspot just reaffirmed our expectations for a higher intensity of attention towards the animated image as it completely covers the liquid coffee animation, and considering the animated image as an AOI, one can see that most of the hotspots are inside it; even more the highest attention intensity was in the same area. This shows that the animation of the liquid coffee did attract the attention of the users and places it as the most salient component between both designs.
The latest analysis is a more visual and intuitive approach that needs to be accompanied by quantitative analysis to provide hard facts. Table A3 is sorted ascending by time to first fixation (TTFF), and as shown in Figure 7, it is correlated by a −0.93 factor to ratio, as for a faster TTFF time, there is a higher ratio. As seen in the heat map analysis, the most visited AOI is the brand slogan in white font with a ratio of 31 users out of 39 total users, and it is also the most visited by 25 users out of 31 users who fixated. This particular AOI stands apart from the others by far, as shown in Table 5, with at least double in all metrics, except revisits to the closest, indicating high attention dominance.
Table A4 is ordered as the counterpart analysis of the off-stimulus, and similar to its analysis in this case, there is a direct relation between the TTFF and ratio metrics with the same behavior—inversely proportional—but with a correlation factor of −0.97, as shown in Figure 8, indicating a higher correlation than before. Analyzing the percentage difference between the first and second AOI in Table 6, we can see that for the ratio, revisits, and fixations metrics, the change between the two is very low, which could indicate a good attention intensity result for both components. The domain of this pair of components seen in Table 6 and Table 7 is greater than that seen in the other design, except TTFF and revisits, which could be interpreted as a higher level of attention for both AOIs.
As stated before, the closeness between the components could result in more attention as seen for those components closest to the first AOI in both designs, yet there is still a higher percentage difference for the second AOI of the off-stimulus against the on-stimulus, which can be seen comparing Table 5 and Table 6. This can be interpreted as a higher prominence for the second AOI in the new design versus the second AOI in the first design. Now, if we compare the first AOI in the new design to the first AOI in the old design, as seen in Table 8, the percentage difference for the metrics ratio, revisitors, and fixations is lower than 10%, which indicates minimum change, but when comparing the second AOI in the old design to the new design, the percentage difference comparing time spent and fixations passes 100%. Now, comparing the components that remained between designs for a percentage decrease in Table 9, we can see for the AOI brand name in white font that there is a decrease in the metrics ratio, revisitors, and fixations, and for brand name in white font in company sign, there is a decrease in the metrics ratio, revisits, and fixations. This impact on the AOIs can be interpreted as a lack of prominence or user appeal, which is overshadowed by the high salience of the animation and location preview.
The latter is an analysis of the eye tracking results, but as mentioned, the study also used an FEA technique to recognize emotions that could be observed on the user’s face. Preliminary results indicated a mean increase in emotional time percent for the on-stimulus against off-stimulus state, as shown in Figure 9, for all the emotions. This at first glance indicates an overall higher emotional reaction of the sample when being exposed to the dynamic website design against the static website design, which is a basis for a further analysis, but this is not enough to demonstrate that there is a significant difference between samples.
Figure 10 shows a comparison similar to the previous one, but instead of comparing the means, it uses the standard deviations of the samples—on-stimulus versus off-stimulus—this was performed with the intention of comparing whether the on-stimulus sample had a more similar behavior between subjects than the off-stimulus one. The result indicates an increment in the standard deviation for the on-stimulus state against the off-stimulus, which indicates a higher dispersion of the emotional time percentage between subjects of the same sample. This could indicate an increase in the number of outliers or the presence of outliers with values further from the mean; thus, an analysis in conjunction with the mean is needed, as the standard deviation analysis alone does not indicate if it is the first or the second case.
Diving deeper into the analysis and considering both the mean and standard deviation of the percentage of observable time for each emotion, we then compared the distribution of the samples to have a statistical approach of the situation. Figure 11 shows for every and each emotion a higher skewness to the right—larger right tail—and a lower hill for the on-stimulus distribution compared to the off-stimulus, indicating a decrease in the case count for the mode—except for the neutral emotion—of 0% and a shift for most of the subjects to higher values of the percentage of emotional time for the on-stimulus sample. This can be interpreted as an increase in the percentage of observable time for the sample on-stimulus versus off-stimulus in all emotions. This could lead to a first conclusion based on statistical data that, in general, there is an increment in the percentage of observable time for each emotion being exposed to the dynamic web design.
Lastly, a Wilcoxon signed-rank test was applied to compare the samples—on-stimulus and off-stimulus— to statistically accept or reject the null hypothesis—that there is no difference between samples—and we established a significance level of 5%. The test returns a p-value, which if higher than the established significance level would men the null hypothesis is accepted; on the contrary, if the p-value lies lower than the significance level, the null hypothesis is rejected, and the alternate hypothesis is accepted. In this case, two alternate hypothesis were proposed as follows: μ 1 μ 2 ( H a 1 )—the off-stimulus sample is different for left and right tail from the on-stimulus sample—and μ 1 < μ 2 ( H a 2 )—the off-stimulus sample mean is lower than the on-stimulus sample mean. Table 10 and Table 11 show the p-values obtained through the Wilcoxon signed-rank test for the alternative hypotheses H a 1 and H a 2 , respectively. Figure 12 shows the p-value of the percentage of observable time for each emotion of each alternative hypothesis and the significance level to visually compare for which emotions we can reject the null hypothesis. Dots falling down the line can be interpreted as accepted, and those that lay above the line are rejected; thus, we can statistically accept the alternate hypothesis H a 1 for the following emotions: joy, anger, surprise, fear, and neutral. Based o the interpretation for alternate hypothesis H a 2 , we can statistically accept the following emotions: joy, anger, surprise, fear, disgust, and neutral.

4. Discussion

The objective of this study was to look for evidence of an improvement in the design of the website after some modifications. The Mexican coffee company needed a new design that would engage with the user on a deeper level, and this could only be achieved by knowing what the end user wants and needs. With that in mind, based on the old website design, some modifications were applied based on innovative technological elements, such as interactive and animated components.
Thus, two hypotheses were established:
Hypothesis 3 (H3).
The quality of the interaction of a user with a website directly influences the design of the experience in the process of understanding the behavior, needs, and attitudes of the user using different methods of observation and the collection of comments.
Hypothesis 4 (H4).
There are psychological elements for the creation and manipulation of websites impacting clients.
The results are in line with the hypotheses: the alteration and usage of different technologies indeed influenced the user. This means that the results were in line with the first hypothesis, as seen both with the attention intensity and emotions metrics; the latter can be corroborated at a statistical level, as shown in the study. Attention intensity had a remarkable increment for the new website design; specifically, the metrics had an increment for the animation and local preview elements, which indicates a higher salience that can capture the users’ attention, allowing a higher memorability. This attention is completely parameterized, meaning that it does not give any insight about the thoughts or interaction between the user and the element that bridgesthe gap for the user reaction towards the element. That is why the emotion metrics plays an important role for this interpretation, since it gives insight into the reaction of the user towards the design. The emotions results showed a higher elicitation for five out of seven basic emotions; this indicates an increment for the emotional reaction on behalf of the user. There was a significant increase in the emotion of disgust and surprise, which can lead to a higher probability of remembering the stimulus [46], which allows a better memory imprint to remember the brand in the future. The emotional associations that arise as a result of the interaction with the brand during all phases of the sales process also contribute to improving the positioning and perceived value of the brand [47]. This is a first step toward better brand marketing. In fact, it is during the search phase, which is the first step in making a purchase, that it is essential to capture attention by communicating the attributes that correspond to the consumer’s need. Along with that, we can interpret that, since we have an increase in five out of seven basic emotions, we have a better emotion-based website design, which can eventually impact the sales and loyalty rate for the Mexican coffee company. Currently, consumers are exposed to a multitude of stimuli, which make them value immediacy, so adding dynamism in the digital context is an effective strategy to generate the desired engagement. In the second hypothesis, we established that psychological factors play an important role in the interplay between website and user, and even though the psychological spectrum is very broad, the results of the comparison between the interaction off-stimulus vs. on-stimulus demonstrated that the website design can indeed directly influence in a very concrete area: emotions. This can be seen in the following basic emotions: joy, anger, surprise, fear, and disgust, that is to say that in five of the seven basic emotions, there was a significant difference, more specifically a higher percentage of observation time for these emotions, indicating that for most emotions, the difference was statistically proven. This being a subconscious factor, which is belief directly affects human behavior, leaves as further research to complement said factor with a conscious one to have a better understanding of the user. The emotions elicited by the new website design in the majority are of a higher valence, which indicates that users had a more observable emotion when being presented this design.
The objective of this experiment was to understand why AR seems to be attractive at first instance, but then, people seem to get tired of it. To answer this question, it is necessary to have a comparison of emotions for at least two instances, one where AR is implemented and another one where AR is not implemented. This was applied directly in the study through the animated image, which was part of the second design of the website, thus allowing a comparison between designs, one with an AR element and the other without AR. The animated image consisted of capturing an AR interaction between a cup of coffee and virtual coffee.
The correct use of technology-based techniques was shown in this study to overcome certain gaps in research findings when it comes to understanding human behavior. This can be seen directly in the results of the heat maps and fixation metrics, returned by the eye tracking device, which provide concise and time-based results on what grabs the users’ attention and how they interact with the website compared to a human observation approach, which relies on the ability of the observer to obtain the results, which could lead to possible bias or incomplete metrics. That is why we decided that the elicitation of the user’s attention levels must be objective in order to be interpreted correctly, since there is no real alteration and it can be interpreted directly. Although eye tracking devices give us an idea of what the user saw, they ultimately do not tell us at what conscious level the user interacted with the viewed item, so it must be accompanied by user feedback, such as questionnaires or focus groups. Further analysis should consider this second element of the study for a more complete memorability interpretation.
Technology can also alter the UX and ultimately affect the consumer behavior and his/her perception of the brand. When it comes to web design, it is important to remain relevant, and the lack of innovation eventually leads to less relevance; thus, the software industry has been trying to achieve whatever is imaginable and avoids setting the boundaries for what can be done. Thus, websites have been innovating to achieve the ultimate design and get to the user’s needs and wants. This study extends the knowledge of website design by providing evidence of the physiological spectrum of the user and asserts that animated images such as the one featured and an interactive element such as the featured location preview can elicit greater user attention, interaction, and emotion.
This study used a statistical approach, which can ultimately be interpreted as an objective analysis of the data that does not consider external factors, but only data and their meaning. It also allows a visual interpretation of the data for a better understanding of the results. This, in terms of providing a better relation with the customer, can result in an easier approach to the customer and can evoke concrete facts to made a real change. The quantitative data allow uniformity, to eventually provide a better comparison of the metrics, which allows a more intuitive comprehension of the results, which can be ultimately presented to the client so the information can be discussed in a smoother way.
Finally, in terms of neuromarketing, this study tried to establish a direct link between the physiological elements of the user and his/her experience with the brand by observing and measuring one of the brand’s key components: the website. There was indeed an increment in the observed user emotions and attention intensity levels, which can be interpreted as a higher engagement between the user and the website design. Engagement is in fact one of the key elements for a successful marketing campaign that establishes a direct relationship between consumer and brand. Thus, we can state that a neuromarketing approach to website design becomes helpful to analyze and interpret a user interaction with the website.
This study leaves some questions to be answered, and that is because of the same nature of the neuromarketing field, which is very young. One of the most client-directed ones is how this website design could directly impact the sales rate. Another important question is to solve which elements elicited which emotions in concrete, thus allowing a component-based analysis and a more concrete assertion for element reaction. However, the most important question directly related to the analysis and results being carried in this study is what does the user have to say about his/her interaction with the website. This would be a first further study to realize since the data were collected through questionnaires, but they were not analyzed to complement the scope of the study. This other component can answer some doubts about whether the user really remembers the elements and at what level of consciousness the attention to the design was.
In terms of limitations, the small sample size can directly impact the generalization for the results and analysis by reducing the possibilities of finding different types of users. Another important limitation is the sample range of ages between 20 and 24, which also impacts the probability of generalization, since younger generations tend to have more affinity to technology, but are not the only ones surfing the Internet. Following this trend of the lack of generalizability, we encountered the limitation of education and nationality, since all participants had the same level of education and were also of Mexican nationality, which can eventually lead to bias. All of these limitations are sample related, and widening the range for the sample can eventually lead to a more generalized analysis and interpretation of the results for further usage in any environment.

5. Conclusions

Visual perception is a complex mind function in which our biological and cultural nature intervenes. Therefore, images we see are products of automatic mechanisms of seeing and personal experience in society. The mind tends to see what is expected, to group, order, and give meaning to what it sees, to simplify and eliminate details, to complete the incomplete, to reject (or not see) what has not been memorized in a scheme or conceptualized.
While optimizing the customer experience is a goal that brands have been pursuing for many years, today, technological innovation has blurred the barrier between the digital and physical worlds, making the entire customer journey much more tangible and real. With this work, we showed how the use of interactive tools in the search stage of a product or service affects emotions, which in turn improves memorability and increases the likelihood of a subsequent purchase. In an environment where e-commerce is the preferred shopping channel for new generations due to the convenience and immediacy it brings, our findings are a great contribution to demonstrate the convenience of migrating towards digital environments that transform the shopping process into an interesting and fun experience.

Supplementary Materials

The following supporting information can be downloaded at: https://www.mdpi.com/article/10.3390/app12168186/s1.

Author Contributions

Data curation, C.D.-V.-S. and V.C.; Formal analysis, G.G.-M. and C.D.-V.-S.; Investigation, C.D.-V.-S. and V.C.; Methodology, G.G.-M., C.D.-V.-S., V.C. and J.R.; Project administration, C.D.-V.-S.; Resources, V.C.; Software, C.D.-V.-S.; Supervision, C.D.-V.-S.; Validation, J.R.; Visualization, G.G.-M. and J.R.; Writing—original draft, G.G.-M.; Writing—review & editing, V.C. All authors have read and agreed to the published version of the manuscript.

Funding

This research received no external funding.

Institutional Review Board Statement

Not applicable.

Informed Consent Statement

Informed consent was obtained from all subjects involved in the study.

Data Availability Statement

Data is contained within the article or Supplementary Material.

Acknowledgments

The authors gratefully thank La Borra del Café® for supporting the development of this project.

Conflicts of Interest

The authors declare no conflict of interest.

Abbreviations

The following abbreviations are used in this manuscript:
UXUser experience
FEAFacial expression analysis
EEGElectroencephalography

Appendix A

Table A1. Dataset register attributes.
AttributeValue
Joy Threshold0.5
Anger Threshold0.5
Surprise Threshold0.5
Fear Threshold0.5
Contempt Threshold0.5
Disgust Threshold0.5
Sadness Threshold0.5
Neutral Threshold0.5
Positive Threshold2
Negative Threshold2
Table A2. Dataset register attributes.
AttributeValuesRepresentationMeaning
Stimulus NameDataDataType of stimulus applied to the subject
Age18–22Continuous (0–1)Age of the subject
GenderFEMALE, MALE0, 1Gender of the subject
Stimulus Duration0–60,126Continuous (0–1)Duration of the stimulus applied to the subject in ms
Count Frames in Stimulus80–2277Continuous (0–1)Count of frames that the subject is under the stimulus
Joy Time Percent0–57,052Continuous (0–1)Percentage of time that the subject presents joy
Anger Time Percent0–58,176Continuous (0–1)Percentage of time that the subject presents anger
Surprise Time Percent0–56,118Continuous (0–1)Percentage of time that the subject presents surprise
Fear Time Percent0–58,026Continuous (0–1)Percentage of time that the subject presents fear
Contempt Time Percent0–52,957Continuous (0–1)Percentage of time that the subject presents contempt
Disgust Time Percent0–60,021Continuous (0–1)Percentage of time that the subject presents disgust
Sadness Time Percent0–56,310Continuous (0–1)Percentage of time that the subject presents sadness
Neutral Time Percent0–64,246Continuous (0–1)Percentage of time that the subject presents neutral
Positive Time Percent0–48,521Continuous (0–1)Percentage of time that the subject presents positive
Negative Time Percent0–54,991Continuous (0–1)Percentage of time that the subject presents negative
Table A3. Old website design: area of interest (AOI) metrics. Note: time to first fixation (TTFF).
NumberDescriptionTTFF (s)Time Spent (s)RatioRevisitorsRevisitsFixations
1Brand slogan in white font1.70.631/3925/313.1132
2Brand name in white font4.60.115/396/15225
3Brand advertising phrase in black font5.10.114/393/142.322
4Brand name in white font in company sign5.20.115/393/152.323
5Brand name in white font in company umbrella5.900/390/303
Table A4. New website design: area of interest (AOI) metrics. Note: time to first fixation (TTFF).
NumberDescriptionTTFF (s)Time Spent (s)RatioRevisitorsRevisitsFixations
1Brand name in black font within animation1.60.733/3925/333.5128
2Company branch location preview30.832/3921/323.3131
3Brand name in white font in company sign5.40.19/393/9215
4Brand name in white font5.50.19/392/9217
5Brand name in white font in company umbrella5.604/390/405
6Brand name in black font in cup within animation5.802/390/202

References

  1. Bassett, D.S.; Sporns, O. Network neuroscience. Nat. Neurosci. 2017, 20, 353–364. [Google Scholar] [CrossRef] [PubMed]
  2. Bear, M.; Connors, B.; Paradiso, M.A. Neuroscience: Exploring the Brain, Enhanced Edition: Exploring the Brain; Jones & Bartlett Learning: Burlington, MA, USA, 2020. [Google Scholar]
  3. Boag, S. Conscious, preconscious, and unconscious. In Encyclopedia of Personality and Individual Differences; Springer Nature: Berlin, Germany, 2020; pp. 858–864. [Google Scholar]
  4. Almada, L.F.; Pereira, A., Jr.; Carrara-Augustenborg, C. What affective neuroscience means for science of consciousness. Mens Sana Monogr. 2013, 11, 253. [Google Scholar] [PubMed]
  5. Pereira, A., Jr. What the cognitive neurosciences mean to me. Mens Sana Monogr. 2007, 5, 158. [Google Scholar] [CrossRef] [PubMed]
  6. Lee, N.; Broderick, A.J.; Chamberlain, L. What is ‘neuromarketing’? A discussion and agenda for future research. Int. J. Psychophysiol. 2007, 63, 199–204. [Google Scholar] [CrossRef]
  7. Levrini, G.R.; Jeffman dos Santos, M. The influence of Price on purchase intentions: Comparative study between cognitive, sensory, and neurophysiological experiments. Behav. Sci. 2021, 11, 16. [Google Scholar] [CrossRef]
  8. Kumar, S. Neuromarketing: The new science of advertising. Univers. J. Manag. 2015, 3, 524–531. [Google Scholar] [CrossRef]
  9. Gabriel, D.; Merat, E.; Jeudy, A.; Cambos, S.; Chabin, T.; Giustiniani, J.; Haffen, E. Emotional effects induced by the application of a cosmetic product: A real-time electrophysiological evaluation. Appl. Sci. 2021, 11, 4766. [Google Scholar] [CrossRef]
  10. Aldayel, M.; Ykhlef, M.; Al-Nafjan, A. Deep learning for EEG-based preference classification in neuromarketing. Appl. Sci. 2020, 10, 1525. [Google Scholar] [CrossRef]
  11. Liao, Q.V.; Gruen, D.; Miller, S. Questioning the AI: Informing design practices for explainable AI user experiences. In Proceedings of the 2020 CHI Conference on Human Factors in Computing Systems, Honolulu, HI, USA, 25–30 April 2020; pp. 1–15. [Google Scholar]
  12. Hassenzahl, M. User experience and experience design. In The Encyclopedia of Human-Computer Interaction, 2nd ed.; IGI Global: Hershey, PA, USA, 2013. [Google Scholar]
  13. Filipović, F.; Baljak, L.; Naumović, T.; Labus, A.; Bogdanović, Z. Developing a web application for recognizing emotions in neuromarketing. In Marketing and Smart Technologies; Springer: Berlin/Heidelberg, Germany, 2020; pp. 297–308. [Google Scholar]
  14. Yadava, M.; Kumar, P.; Saini, R.; Roy, P.P.; Prosad Dogra, D. Analysis of EEG signals and its application to neuromarketing. Multimed. Tools Appl. 2017, 76, 19087–19111. [Google Scholar] [CrossRef]
  15. Burgos-Campero, A.A.; Vargas-Hernández, J.G. Analitical approach to neuromarketing as a business strategy. Procedia-Soc. Behav. Sci. 2013, 99, 517–525. [Google Scholar] [CrossRef]
  16. Tuerlan, T.; Li, S.; Scott, N. Customer emotion research in hospitality and tourism: Conceptualization, measurements, antecedents and consequences. Int. J. Contemp. Hosp. Manag. 2021, 33, 2741–2772. [Google Scholar] [CrossRef]
  17. Li, Q.; Huang, Z.; Christianson, K. Visual attention toward tourism photographs with text: An eye tracking study. Tour. Manag. 2016, 54, 243–258. [Google Scholar] [CrossRef]
  18. Pieters, R.; Wedel, M. Attention capture and transfer in advertising: Brand, pictorial, and text-size effects. J. Mark. 2004, 68, 36–50. [Google Scholar] [CrossRef]
  19. Wall, H.J.; Kaye, L.K.; Malone, S.A. An exploration of psychological factors on emoticon usage and implications for judgement accuracy. Comput. Hum. Behav. 2016, 62, 70–78. [Google Scholar] [CrossRef]
  20. Spence, C.; Gallace, A. Tasting shapes and words. Food Qual. Prefer. 2011, 22, 290–295. [Google Scholar] [CrossRef]
  21. Chen, X.; Chen, Z. Exploring visual attention using random walks based eye tracking protocols. J. Vis. Commun. Image Represent. 2017, 45, 147–155. [Google Scholar] [CrossRef]
  22. Lohse, G.L. Consumer eye movement patterns on yellow pages advertising. J. Advert. 2013, 26, 61–73. [Google Scholar] [CrossRef]
  23. Bang, H.; Wojdynski, B.W. Tracking users’ visual attention and responses to personalized advertising based on task cognitive demand. Comput. Hum. Behav. 2016, 55, 867–876. [Google Scholar] [CrossRef]
  24. Salvucci, D.D.; Goldberg, J.H. Eye Tracking Scanpath Analysis on Web Pages: How Many Users? In Proceedings of the ETRA ’00, 2000 Symposium on Eye Tracking Research and Applications, Charleston, SC, USA, 14–17 March 2016; ACM: New York, NY, USA, 2000; pp. 71–78. [Google Scholar] [CrossRef]
  25. Albayrak, D.; Cagiltay, K. Analyzing Turkish E-government Websites by Eye Tracking. In Proceedings of the 2013 Joint Conference of the 23rd International Workshop on Software Measurement and the 2013 Eighth International Conference on Software Process and Product Measurement (IWSM-MENSURA), Ankara, Turkey, 23–26 October 2013. [Google Scholar] [CrossRef]
  26. Oliveira, P.M.; Guerreiro, J.; Rita, P. Neuroscience research in consumer behavior: A review and future research agenda. Int. J. Consum. Stud. 2022. [Google Scholar] [CrossRef]
  27. Francis, R.; Reena, R. A study on Neuromarketing: A unique Bond between Consumer’s Cognizance And Marketing. Int. J. Commer. Manag. Res. 2016, 2, 51–54. [Google Scholar]
  28. Sebastian, V. Neuromarketing and evaluation of cognitive and emotional responses of consumers to marketing stimuli. Procedia-Soc. Behav. Sci. 2014, 127, 753–757. [Google Scholar] [CrossRef]
  29. Duchowski, A.T.; Duchowski, A.T. Eye Tracking Methodology: Theory and Practice; Springer: Berlin/Heidelberg, Germany, 2017. [Google Scholar]
  30. Elfenbein, H.A.; Marsh, A.A.; Ambady, N. Emotional intelligence and the recognition of emotion from facial expressions. In The Wisdom in Feeling: Psychological Processes in Emotional Intelligence; The Guilford Press: New York, NY, USA, 2002. [Google Scholar]
  31. National Coffee Association. National Coffee Data Trends 2022; Atlantis Press: Amsterdam, The Netherlands, 2022. [Google Scholar]
  32. Kalkova, N.; Reutov, V.; Mitin, E.; Velgosh, N. Neuromarketing study of consumers’ cognitive perception of labeling Information on a product’s package. In Proceedings of the International Scientific Conference “Far East Con” (ISCFEC 2020), Vladivostok, Russia, 1–4 October 2019; Atlantis Press: Dordrecht, The Netherlands, 2020; pp. 3029–3036. [Google Scholar]
  33. Iskandar, M.S.; Sholihat, K.Y. Role of web design for image brand toward business. IOP Conf. Ser. Mater. Sci. Eng. 2018, 407, 012050. [Google Scholar] [CrossRef]
  34. Lee, Z.C.; Yurchisin, J.; Te Lin, C. The impact of website attractiveness, consumer-website identification, and website trustworthiness on purchase intention. In Proceedings of the 2010 IEEE/ACIS 9th International Conference on Computer and Information Science, Yamagata, Japan, 18–20 August 2010; pp. 301–306. [Google Scholar]
  35. Kopczynski, M. Optimizations for fast wireless image transfer using H. 264 codec to Android mobile devices for virtual reality applications. In Proceedings of the International Conference on Dependability and Complex Systems, Wrocław, Poland, 28 June–2 July 2021; Springer: Cham, Switzerland, 2021; pp. 203–212. [Google Scholar]
  36. Lin, K.; Jiang, N.; Cheong, L.F.; Do, M.; Lu, J. Seagull: Seam-guided local alignment for parallax-tolerant image stitching. In Proceedings of the European Conference on Computer Vision, Amsterdam, The Netherlands, 11–14 October 2016; Springer: Cham, Switzerland, 2016; pp. 370–385. [Google Scholar]
  37. Zhao, H.; Wagner, C. How TikTok leads users to flow experience: Investigating the effects of technology affordances with user experience level and video length as moderators. Internet Res. 2022. ahead-of-print. [Google Scholar] [CrossRef]
  38. Lee, J.; Ngo, N.; Fung, H.; Isaacowitz, D.; Ho, Y. Age differences in attention under sadness: Comparisons between Chinese and US Americans. Innov. Aging 2017, 1, 981. [Google Scholar] [CrossRef]
  39. Zamani, H.; Abas, A.; Amin, M. Eye tracking application on emotion analysis for marketing strategy. J. Telecommun. Electron. Comput. Eng. (JTEC) 2016, 8, 87–91. [Google Scholar]
  40. Niehorster, D.C.; Cornelissen, T.H.; Holmqvist, K.; Hooge, I.T.; Hessels, R.S. What to expect from your remote eye tracker when participants are unrestrained. Behav. Res. Methods 2018, 50, 213–227. [Google Scholar] [CrossRef]
  41. Tian, Y.L.; Kanade, T.; Cohn, J.F. Facial expression analysis. In Handbook of Face Recognition; Springer: Berlin/Heidelberg, Germany, 2005; pp. 247–275. [Google Scholar]
  42. Ekman, P.; Friesen, W.V. Facial action coding system. Environ. Psychol. Nonverbal Behav. 1978. [Google Scholar] [CrossRef]
  43. Zhi, R.; Liu, M.; Zhang, D. A comprehensive survey on automatic facial action unit analysis. Vis. Comput. 2020, 36, 1067–1093. [Google Scholar] [CrossRef]
  44. Gelasca, E.D.; Tomasic, D.; Ebrahimi, T. Which colors best catch your eyes: A subjective study of color saliency. In Proceedings of the Fisrt International Workshop on Video Processing and Quality Metrics for Consumer Electronics, Scottsdale, AZ, USA, 2005; Available online: https://citeseerx.ist.psu.edu/viewdoc/summary?doi=10.1.1.361.7267 (accessed on 5 July 2022).
  45. Bojko, A. Eye Tracking the User Experience: A Practical Guide to Research; Rosenfeld Media: Brooklyn, NY, USA, 2013. [Google Scholar]
  46. Baraybar-Fernández, A.; Baños-González, M.; Barquero-Pérez, Ó.; Goya-Esteban, R.; De-la Morena-Gómez, A. Evaluation of emotional responses to television advertising through neuromarketing. Comun. Media Educ. Res. J. 2017, 25, 19–28. [Google Scholar] [CrossRef]
  47. Harris, J.M.; Ciorciari, J.; Gountas, J. Consumer neuroscience and digital/social media health/social cause advertisement effectiveness. Behav. Sci. 2019, 9, 42. [Google Scholar] [CrossRef]
Figure 1. New website design—denoted as dynamic website design and on-stimulus—with 6 areas of interest (AOI) metrics. Note: time to first fixation (TTFF). (1) Brand name in black font within animation; (2) company branch location preview; (3) brand name in white font in company sign; (4) brand name in white font; (5) brand name in white font in company umbrella; (6) brand name in black font in cup with animation. Note: Table A4 contains the same metrics for a more readable option.
Applsci 12 08186 g001
Figure 2. Old website design—denoted as static website design and off-stimulus—with 5 areas of interest (AOI) metrics. Note: time to first fixation (TTFF). (1) brand slogan in white font; (2) brand name in white font; (3) brand advertising phrase in black font; (4) brand name in white font in company sign; (5) brand name in white font in company umbrella. Note: Table A3 contains the same metrics for a more readable option.
Applsci 12 08186 g002
Figure 3. New website design element: preview of a company branch location. Panorama capture.
Applsci 12 08186 g003
Figure 4. New website design element: coffee animation. Note: the total length for the animation was 25 s. (a) Coffee elevation frame. Second 3. (b) Coffee falling frame. Second 19. (c) Coffee explosion frame. Second 21.
Applsci 12 08186 g004
Figure 5. Old website design: heat map.
Applsci 12 08186 g005
Figure 6. New website design: heat map.
Applsci 12 08186 g006
Figure 7. Old website design: area of interest (AOI) metrics Pearson standard correlation coefficient.
Applsci 12 08186 g007
Figure 8. New website design: area of interest (AOI) metrics Pearson standard correlation coefficient.
Applsci 12 08186 g008
Figure 9. Comparison of the mean of the percentage of observable time for each emotion between dynamic web design—on-stimulus—and static web design—off-stimulus.
Applsci 12 08186 g009
Figure 10. Comparison of the standard deviation of the percentage of observable time for each emotion between dynamic web design—on-stimulus—and static web design—off-stimulus.
Applsci 12 08186 g010
Figure 11. Comparison of the distribution of the percentage of observable time for each emotion between samples of dynamic web design—on-stimulus—and static web design—off-stimulus.
Applsci 12 08186 g011
Figure 12. p value—obtained with the Wilcoxon signed-rank test—for both alternative hypotheses—the off-stimulus sample is different from the on-stimulus sample, denoted as μ 1 μ 2 ( H a 1 ), and the off-stimulus sample is lower than the on-stimulus sample, denoted as μ 1 < μ 2 ( H a 2 )—for each emotion between samples of the dynamic web design—on-stimulus—and the static web design—off-stimulus—along with the significance level—horizontal line.
Applsci 12 08186 g012
Table 1. Post-survey.
QuestionRange
Is the website design attractive for you?1–7
Is the amount of content sufficient?1–7
Did you experience information overload?1–7
How much was the visual impact?1–7
How easy was to interact?1–7
Table 2. Final survey.
QuestionRange
How likely is it that you will return to the website with the animation?1–10
How likely is it that you will return to the website without the animation?1–10
Table 3. Elements of the typology.
ElementFeatures
FormAdjust and delimit a figure. This implies volume and height.
MovementInteraction of the components in a simple or multidimensional plane that adds value to a scene. Causes extension, continuity, sequence, and autonomy.
BackgroundGives depth accuracy.
ColorResult of electromagnetic radiation interpreted by the visual field. Causes absorption and reflection of light. The intensity of the color affects the discrimination or acceptance of the color scheme.
Symbolic structureRepresentation of a concept or significance.
EmotionsPerceptions linked to feelings based on lived experiences.
GroupArrangement of a specific structure. It can be given by proximity, by symmetry, by similarity, or by continuity.
ConstancyWe tend to perceive things by their color, shape, or how we are used to seeing them or how they are.
Intensity and sizeThe greater the intensity and size, the sooner we perceive it.
ContrastDifferences between our present and usual situation or a new situation.
RepetitionFactor that shows similarities of known or new characteristics.
Table 4. Data collection procedures.
Phase of the StudyData Collection Procedures
BeginningSensor calibration
BeginningLoad both web sites
DuringEye tracking
DuringObservations
EndPost-test questionnaire
EndInterview
Table 5. Old website design: area of interest (AOI) metrics percentage difference against brand slogan in white font AOI in Table A3. Note: the brand slogan in white font AOI was removed from the table for relevance purposes, but the order remained the same. Furthermore, percentages were truncated to no decimal places.
NumberDescriptionTTFF (s)Time Spent (s)RatioRevisitorsRevisitsFixations
2Brand name in white font92%142%69%67%43%136%
3Brand advertising phrase in black font100%142%75%116%29%142%
4Brand name in white font in company sign101%142%69%120%29%140%
5Brand name in white font in company umbrella110%200%200%200%200%191%
Table 6. New website design: area of interest (AOI) metrics percentage difference against brand name in black font within animation in Table A4. Note: the brand name in black font within animation AOI was removed from the table for relevance purposes, but the order remained the same. Furthermore, percentages were truncated to no decimal places.
NumberDescriptionTTFF (s)Time Spent (s)RatioRevisitorsRevisitsFixations
2Company branch location preview60%13%3%14%5%2%
3Brand name in white font in company sign108%150%114%77%54%158%
4Brand name in white font109%150%114%109%54%153%
5Brand name in white font in company umbrella111%200%156%200%200%184%
6Brand name in black font in cup within animation113%200%177%200%200%193%
Table 7. New website design: area of interest (AOI) metrics percentage difference against company branch location preview in Table A4. Note: the company branch location preview AOI was removed from the table for relevance purposes, but the order remained the same. Furthermore, percentages were truncated to no decimal places.
NumberDescriptionTTFF (s)Time Spent (s)RatioRevisitorsRevisitsFixations
1Brand name in black font within animation60%13%3%14%5%2%
3Brand name in white font in company sign57%155%112%65%49%158%
4Brand name in white font58%155%112%98%49%154%
5Brand name in white font in company umbrella60%200%155%200%200%185%
6Brand name in black font in cup within animation63%200%176%200%200%193%
Table 8. Area of interest (AOI) metrics percentage difference: old vs. new website design. Note: the last AOI from the new website design was removed since it does not have a pair, but the order remained the same. Furthermore, percentages were truncated to no decimal places.
NumberTTFF (s)Time Spent (s)RatioRevisitorsRevisitsFixations
16%15%6%6%12%3%
242%155%72%48%49%135%
35%0%43%43%13%37%
45%0%50%10%13%30%
55%-200%--50%
Table 9. Area of interest (AOI) metrics percentage decrease: shared AOIs from old to new website design. Note: negative percentages presented an increase of −1*percentage. Percentages were truncated to no decimal places.
DescriptionTTFF (s)Time Spent (s)RatioRevisitorsRevisitsFixations
Brand name in white font in company sign−3%0%40%−66%13%34%
Brand name in white font−19%0%40%44%0%32%
Brand name in white font in company umbrella5%----−66%
Table 10. p-values of the percentage of observable time for each emotion of H a 1 . Note: p-values were truncated to two decimal places.
Emotionp-Value
Joy0.01
Anger0.00
Surprise0.00
Fear0.02
Contempt0.26
Disgust0.02
Sadness0.08
Neutral0.00
Positive0.17
Negative0.30
Table 11. p-values of the percentage of observable time for each emotion of H a 2 . Note: p-values were truncated to two decimal places.
AttributeValue
Joy0.02
Anger0.00
Surprise0.01
Fear0.04
Contempt0.52
Disgust0.05
Sadness0.17
Neutral0.01
Positive0.34
Negative0.61
Publisher’s Note: MDPI stays neutral with regard to jurisdictional claims in published maps and institutional affiliations.

