Article

Research on the Prediction of the Time of Initial Support of Soft Rock Tunnel Based on the Optimized Longitudinal Deformation Profile

1
College of Civil and Architectural Engineering, East China University of Technology, Nanchang 330013, China
2
School of Resources and Civil Engineering, Northeastern University, Shenyang 110819, China
3
School of Civil Engineering and Architecture, Anhui University of Science and Technology, Huainan 232001, China
*
Author to whom correspondence should be addressed.
Appl. Sci. 2022, 12(14), 7221; https://doi.org/10.3390/app12147221
Submission received: 11 May 2022 / Revised: 11 July 2022 / Accepted: 14 July 2022 / Published: 18 July 2022
(This article belongs to the Section Civil Engineering)

Abstract

:
The longitudinal deformation profile (LDP) of the surrounding rock can intuitively and effectively reflect that the deformation of the surrounding rock of the tunnel wall is affected by the “spatial effect” at the front end of the excavation face during the tunnel excavation process, and provides a theoretical basis for the best time for the construction of the supporting structure. Taking a large-section tunnel of soft rock as an example, the LDP equation (displacement release coefficient) of the surrounding rock is derived based on Unlu and Gercek, and the optimization and improvement are proposed after comprehensively considering Poisson’s ratio, the elastic modulus, cohesion, internal friction angle, blasting parameters, etc., using FLAC3D to analyze the rationality and validity of improving the LDP equation of the surrounding rock. The results show that: (1) by adding the “expanded convergent function” in the x ≥ 0 section, the LDP equation of surrounding rock is optimized and improved, and the correlation coefficient of the data is increased from the original R-square = 0.8 to R-square = 0.95; (2) by comparing with the numerical simulation data, the improved LDP equation of the surrounding rock can better match it, which confirms that the improved LDP equation of surrounding rock is more reasonable and practical; (3) it is proposed that the displacement release coefficient value is the best time to apply support when the displacement increment of the surrounding rock has a sharp increase point, and it is concluded that when the Class-III surrounding rock is constructed by the long step method, it is best to start supporting at about x = 2.24 m from the tunnel face. When the Class-IV surrounding rock is constructed by the reserved core soil method, it is best to start supporting at about x = 1.47 m from the face of the tunnel.

1. Introduction

With the development of human society, the strengthening of environmental protection awareness and the increasing urgency of above-ground space, “requiring space and resources underground” has become an effective way for people to seek a good living environment and explore sustainable human development [1]. However, the development and utilization of underground space must first solve the relationship between dynamic cooperative deformation of the surrounding rock-supporting structure system. The LDP of surrounding rock described by the Convergence-Confinement Method (CCM) [2,3] can directly and effectively reflect the influence of the “spatial effect” of the front end of the excavation face on the deformation of the surrounding rock of the tunnel wall during the tunnel excavation process, and provide a theoretical basis for the optimal timing of the support structure.
At present, many scholars have discussed the surrounding rock deformation, support pressure, support opportunity and other related issues in the process of tunnel excavation based on the principle of CCM: Fang et al. [4] showed that by establishing the longitudinal deformation model of the tunnel, the solutions of the stress field and displacement field of the infinite body caused by the arbitrary load are obtained, which are replaced by the solutions of the tunnel wall displacement, thus confirming the LDP curve. Liang [5] introduced the failure proximity index (FAI) of rock mass and by considering the strain softening characteristics of the rock mass, the method of the optimal support timing of the tunnel was established. Tang [6,7] introduced the yield axial force of the initial support and the reduction rate of the surrounding rock deformation as the criterion of a reasonable support opportunity. The reasonable support opportunity of a deep buried tunnel is given under different surrounding rock qualities, the support type, initial stress, critical plastic softening coefficient and shear expansion angle. Wang et al. [8] sorted out the field monitoring data, meaning the research on the construction time of the second lining of a carbonaceous slate tunnel was carried out from the perspective of facilitating the stress release and reducing the extrusion deformation pressure of the second lining. Zhou et al. [9], by considering the “spatial effect”, lining aging and supporting structure application timing, constructed a tunnel mechanics model, and the analytical solutions for the displacement of the tunnel wall and the supporting pressure were derived. Su et al. [10,11] studied the optimal timing of initial support and the space effect of the excavation face by constructing the relationship between the load release rate, the tunnel face and the monitoring section. Zhang et al. [12] analyzed the deformation law of the surrounding rock in the process of tunnel excavation based on the CCM and found that the convergence law of the surrounding rock displacement was related to the quality of the surrounding rock. They proposed a correction formula for the longitudinal deformation curve of the tunnel and set a reasonable estimated timing of the initial payments. However, scholars have not given a good explanation for the longitudinal deformation curve of the surrounding rock and different supporting timing of the surrounding rock under the consideration of the “spatial effect” of the front end of the face.
Based on this, this paper takes a soft rock large-section tunnel as an example: (1) By comparing and analyzing on-site monitoring data and theoretical calculation data and comprehensively considering Poisson’s ratio, elastic modulus, cohesion, internal friction angle, blasting parameters, etc., an improvement is proposed for the LDP equation of the surrounding rock derived by Unlu and Gercek [13]. (2) The rationality and effectiveness of the improved LDP equation of the surrounding rock are analyzed by FLAC3D. (3) A proposal for the surrounding rock is that when the displacement increment appears to increase abruptly at one point, then the rock displacement release coefficient value is the best time to apply support, and the control distance between the support and the face of different surrounding rocks is obtained.

2. Convergence-Confinement Method and Displacement Release Coefficient

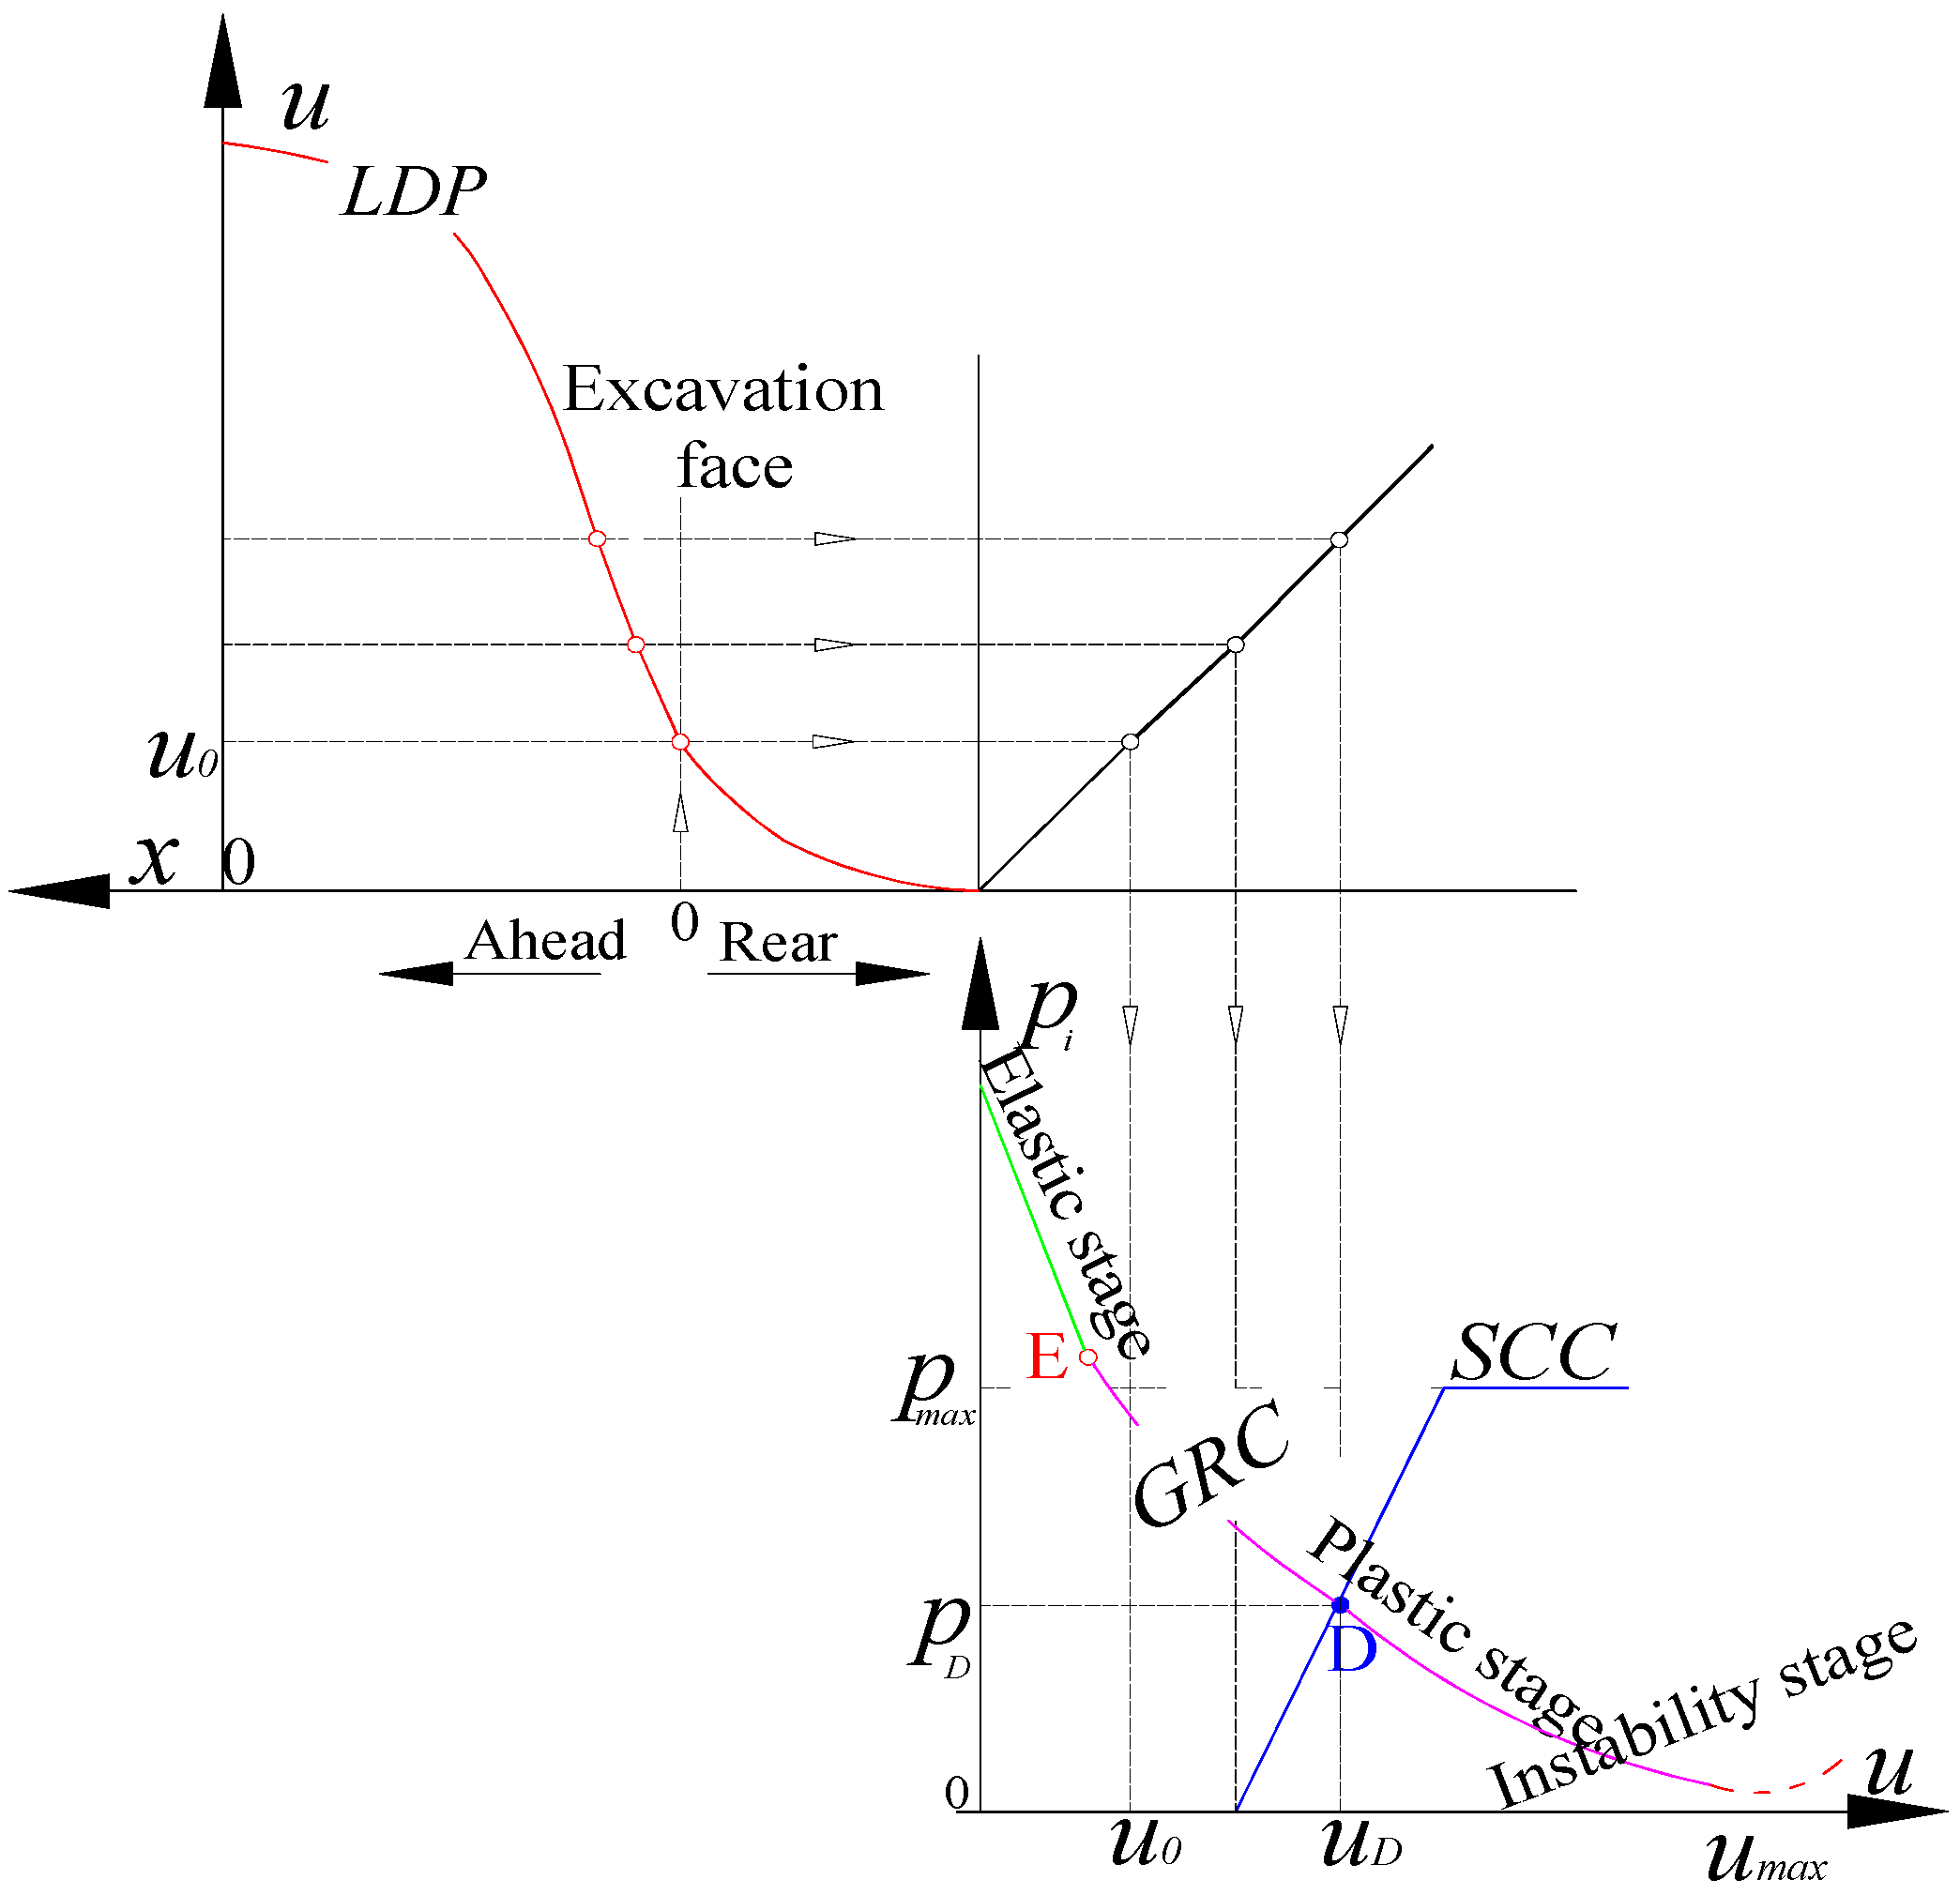
2.1. Principles of Convergence-Confinement Method

In actual engineering, tunnel excavation is a complex three-dimensional change process, especially in the vicinity of the excavation surface, where the unexcavated rock mass in front has a “semi dome “spatial constraint effect on the surrounding rock at a certain distance behind. It produces a radial constraint on the surrounding rock nearby, which is equivalent to applying a virtual support force, so that the stress of the surrounding rock after excavation cannot be released at one time in a very short time, but will continue to be released as the tunnel face gradually goes away.
In view of the spatial effect near the excavation surface, the stress mechanism of surrounding rock is simplified as a cantilever beam under the uniformly distributed load q, the excavation surface O is simplified as a rigid constrained end [14], and the excavation surface C, which is not supported far away from the excavation surface, is simplified as a free end.
From this, we can clearly understand the deformation process of surrounding rock under the action of spatial effect: when a certain point B of the tunnel is close to the excavation face O, it will receive the support force F provided by the excavation face and the virtual support force will make the surrounding rock in a state of stress balance. With the continuous advance of the excavation surface, the smaller the support force received at point B, the greater the deformation. Figure 1 shows the schematic diagram of the spatial constraint effect.
Therefore, whether or not it is possible to effectively grasp the early deformation of the surrounding rock and the interaction between the rock mass and the supporting structure after excavation, or to effectively estimate the various stresses and displacements of the rock mass and the supporting system, based on the on-site monitoring and measurement data, design finding the best support opportunity and support system is the main purpose of the theoretical analysis of the CCM.
The basic principle of the CCM is shown in Figure 2, including the Ground Reaction Curve (GRC), the Longitudinal Deformation Profile (LDP) and the Support Characteristic Curve (SCC); u is the radial displacement of the surrounding rock; x is the distance to the tunnel face; P i is the support resistance; u 0 is the early deformation of the monitoring section; point E is the boundary point of the elastic–plastic deformation of the surrounding rock; and point D is the support of the balance point between the characteristic curve and the surrounding rock characteristic curve.
GRC: It expounds the relationship between radial displacement and radial pressure of tunnel surrounding rock. When the radial displacement is 0, the surrounding rock pressure is equal to the initial in situ stress P 0 . When the surrounding rock pressure is 0, the tunnel radial is at its maximum u max , which is the case without any support. The characteristic curve of surrounding rock can be roughly divided into three stages: the straight-line segment is the elastic deformation stage, the curve segment is the plastic deformation stage and the imaginary segment is the instability failure stage.
LDP: It depicts x (generally 3~5 times the tunnel diameter) within a certain distance behind the front of the tunnel. The excavated surrounding rock has spatial constraints on the excavated surrounding rock and u 0 is the early deformation of the surrounding rock of the monitoring section.
SCC: It refers to the action process of support structures with different stiffnesses. The ordinate of intersection D is the final surrounding rock pressure acting on the support structure by P D , and the abscissa of intersection D is the final deformation of surrounding rock by u D .

2.2. Displacement Release Coefficient Analysis

For complex elastic–plastic problems, the relationship between stress and strain no longer satisfies the simple hoke equation, but depends on the plastic constitutive relationship of the material [15]. In order to more clearly and intuitively study the “spatial effect” of the tunnel face, the displacement release coefficient λ(x) is defined to describe the “spatial effect” of the face. The displacement release coefficient λ(x) is the ratio of the radial displacement u(x) of the surrounding rock at a certain point, at a certain distance x from the face to the radial displacement u(), at the same position and in the same direction, where the face is far enough away (not affected by the spatial constraint effect of the face):
λ ( x ) = u ( x ) / u ( )
The radial displacement u() of surrounding rock is calculated by empirical Equation:
u ( ) = P 0 R / 2 G
where P0 is the initial in situ stress, R is the tunnel excavation radius and G is the shear modulus.
Whether the displacement release coefficient λ can be effectively applied to calculate the longitudinal deformation curve of surrounding rock is the focus of current scholars. At present, the calculation equation of the displacement release coefficient λ in representing the longitudinal deformation curve of surrounding rock is as follows:
Panet [16] obtained the relationship of the displacement release coefficient when x ≥ 0 by using three-dimensional finite element elastic analysis (Equation (3)):
λ ( x ) = 0.25 + 0.75 [ 1 ( 0.75 / ( 0.75 + x / R ) ) 2 ]
Corbetta [17] used the elastic stress analysis method to put forward the relationship of the displacement release coefficient when x = 0, as in the following Equation:
λ ( x ) = 0.29 + 0.71 { 1 exp [ 1.5 ( x / R ) 0.7 ] }
The displacement release coefficients of the two equations at the tunnel face are 0.25 and 0.29, respectively. It is only suitable for section x ≥ 0, which is contrary to the actual project.
Plastic deformation often occurs in the surrounding rock in the actual underground engineering construction. It is more important to study the displacement release coefficient in the plastic deformation stage of the surrounding rock. The relationship between the displacement release coefficient of surrounding rock under the condition of elastic–plastic deformation is as follows:
Vlachopoulos [18], based on the elastic–plastic model and H-B strength criterion, uses FLAC3D for the simulation calculation to construct the V-D (09) displacement release coefficient based on plastic radius R (Equation (5)):
λ ( x ) = { 0.34 exp ( 0.15 R * ) , x = 0 λ 0 exp ( x * ) , x 0 1 ( 1 λ 0 ) exp ( 0.15 x * / R * ) , x 0
where the relative radius R* = R/r, relative position x* = x/r and λ0 is the displacement release coefficient at x = 0 from the tunnel face.
Lee [19] used the normalization method to analyze the tunnel monitoring data and proposed the empirical displacement release coefficient equation (Equation (6)) where its λ0 = 0.
λ ( x ) = 1 2 [ 1 tan h ( 1 3 x 2 R ) ]
Here, x is the axial distance from the excavation surface and R is half of the tunnel excavation diameter.
Hoek [20] established the empirical relationship between the radial displacement of the tunnel wall and the distance of the tunnel face by using the best fitting method, and the equation is as follows Equation (7):
λ ( x ) = [ 1 + exp ( x 1.1 R ) ] 1.7
The displacement release rate of this equation on the face of the tunnel is 0.31.
The displacement release coefficient equation given above has achieved some results in describing the longitudinal deformation curve of the surrounding rock, but it is mostly obtained by empirical speculation and numerical fitting, without considering the influence of the change of surrounding rock parameters during tunnel excavation, so it has certain limitations.
Unlu and Gercek [13], considering the influence of Poisson’s ratio, proposed a displacement release coefficient equation, which is more suitable for a practical engineering application (Equation (8)). However, the relationship only considers the influence of Poisson’s ratio on the displacement release coefficient and does not explain other parameters of rock mass. The influence of other parameters needs to be further studied.
λ ( x ) = { ( 0.22 ν + 0.19 ) exp [ ( 0.73 ν + 0.81 ) | x R | ] x < 0 ( 0.22 ν + 0.19 ) + ( 0.81 0.22 ν ) { 1 [ 0.39 ν + 0.65 0.39 ν + 0.65 + x / R ] 2 } x 0

3. Solution and Analysis of Longitudinal Deformation Curve of Surrounding Rock

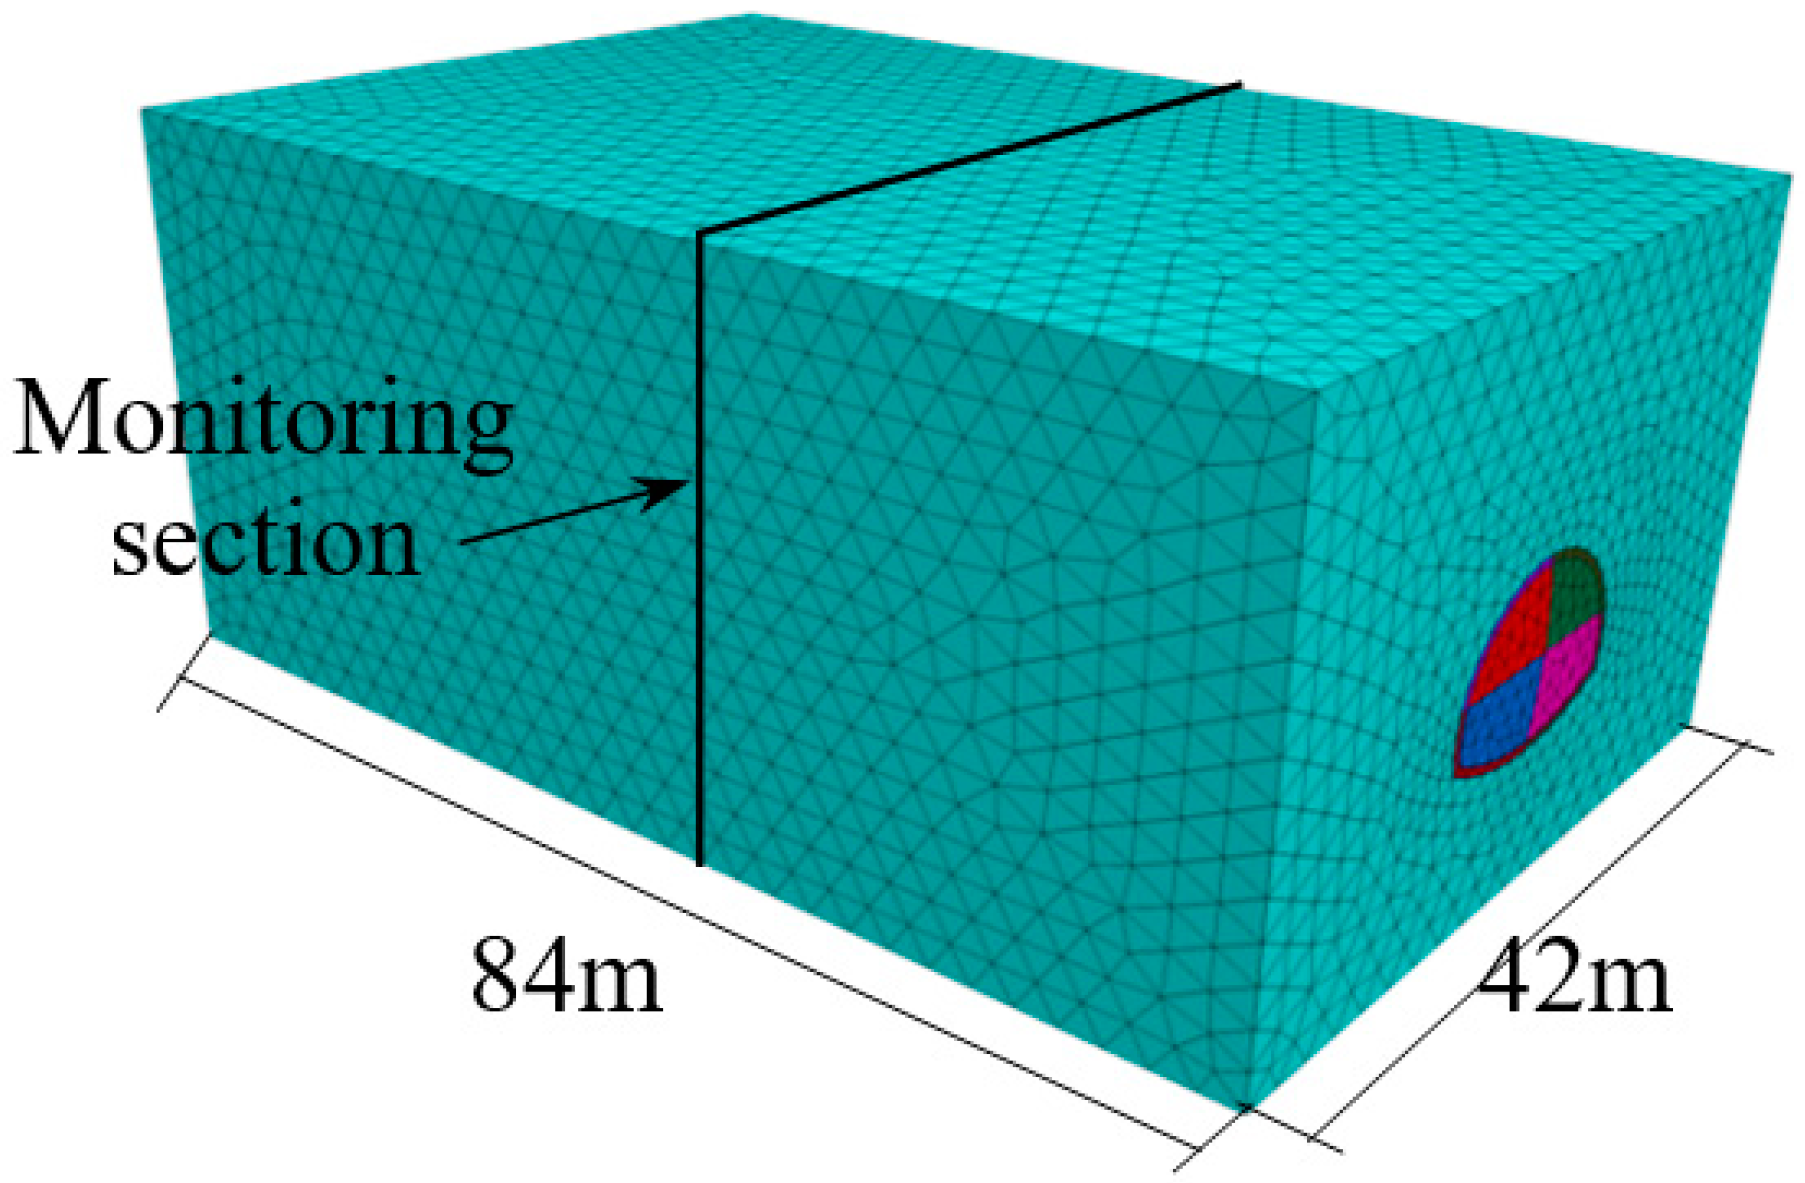
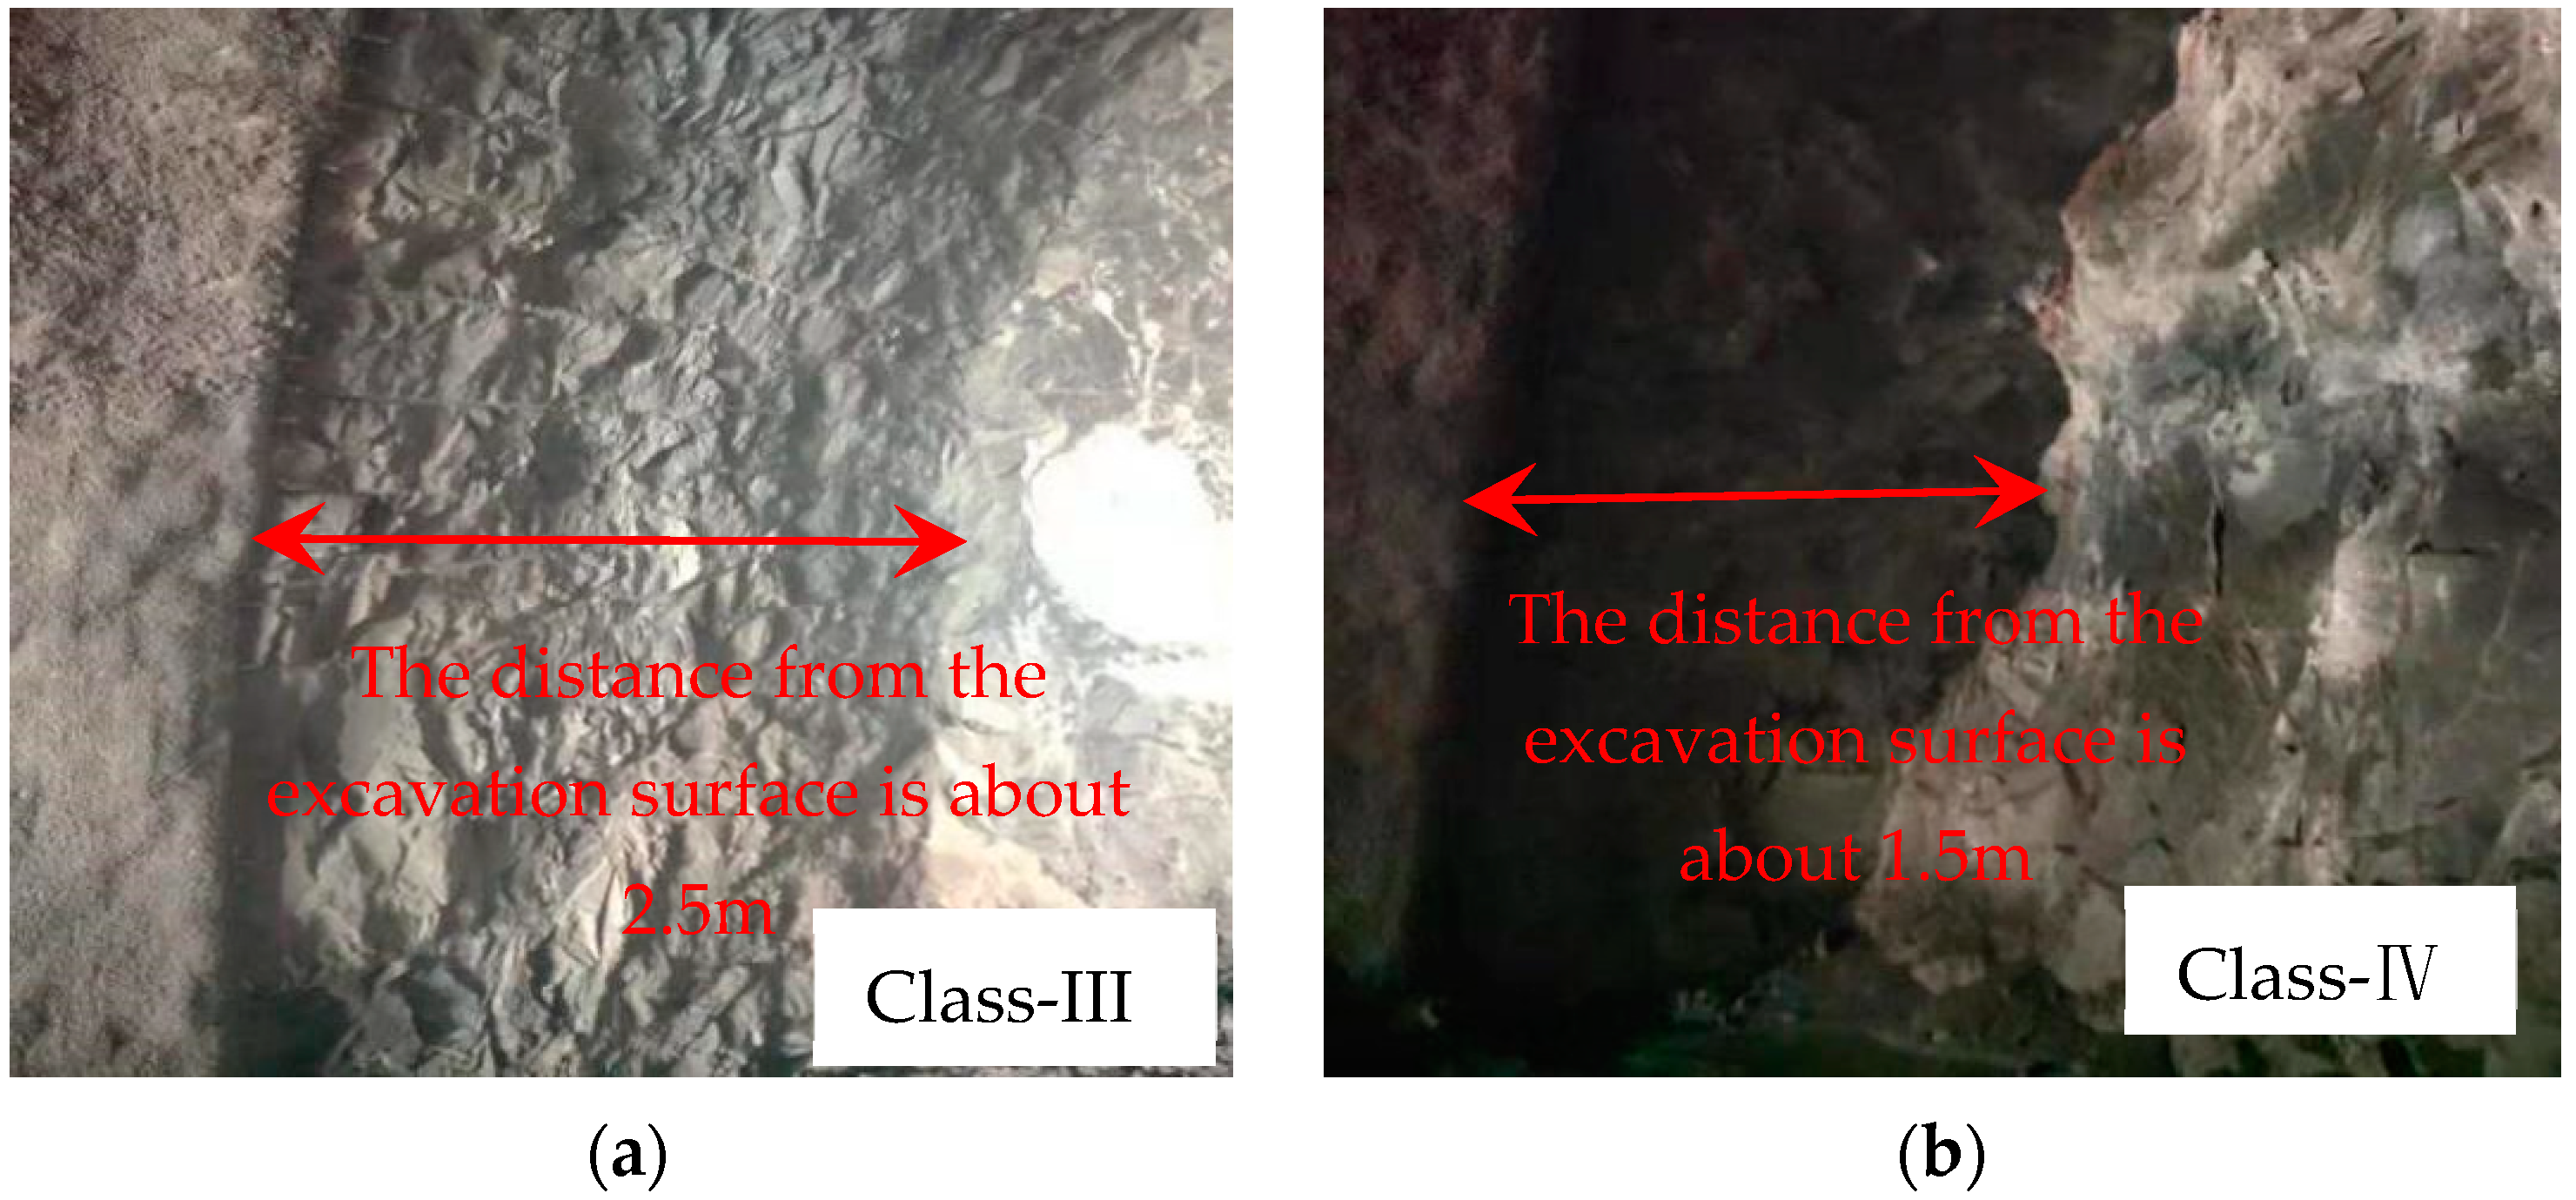
3.1. Project Overview

The tunnel is a twin tunnel. The entrance and exit are located near hills, slopes and valleys. The vegetation is developed, the natural slope is 20~45° and the design section radius is 7 m.
The surrounding rock is mostly strongly weathered to moderately weathered rock mass, which is cyan gray and green gray. The rock mass is in a fragmented mosaic structure, with developed fissures and is relatively broken. According to the survey report, tunnel design and construction drawings, the surrounding rock at sections YK30+960 and YK30+911 is Class-III, the buried depth is about 100–160 m, and the average density of the overlying stratum is about 2300 kg·m−3. The surrounding rock at sections YK31+645 and YK31+422 is Class-IV, the buried depth is about 60–120 m and the average density of the overlying stratum is about 2000 kg·m−3.
In the actual construction process, the long step method is used for the excavation and support of Class-III surrounding rock, and the reserved core soil method is used for the excavation and support of Class-IV surrounding rock. The excavation step distance of the tunnel is about 3.5 m, and the arch crown monitoring points are arranged at 0.2 m away from the tunnel face. The schematic diagram of the tunnel excavation and support is shown in Figure 3, and the parameters of the surrounding rock and support structure are shown in Table 1.

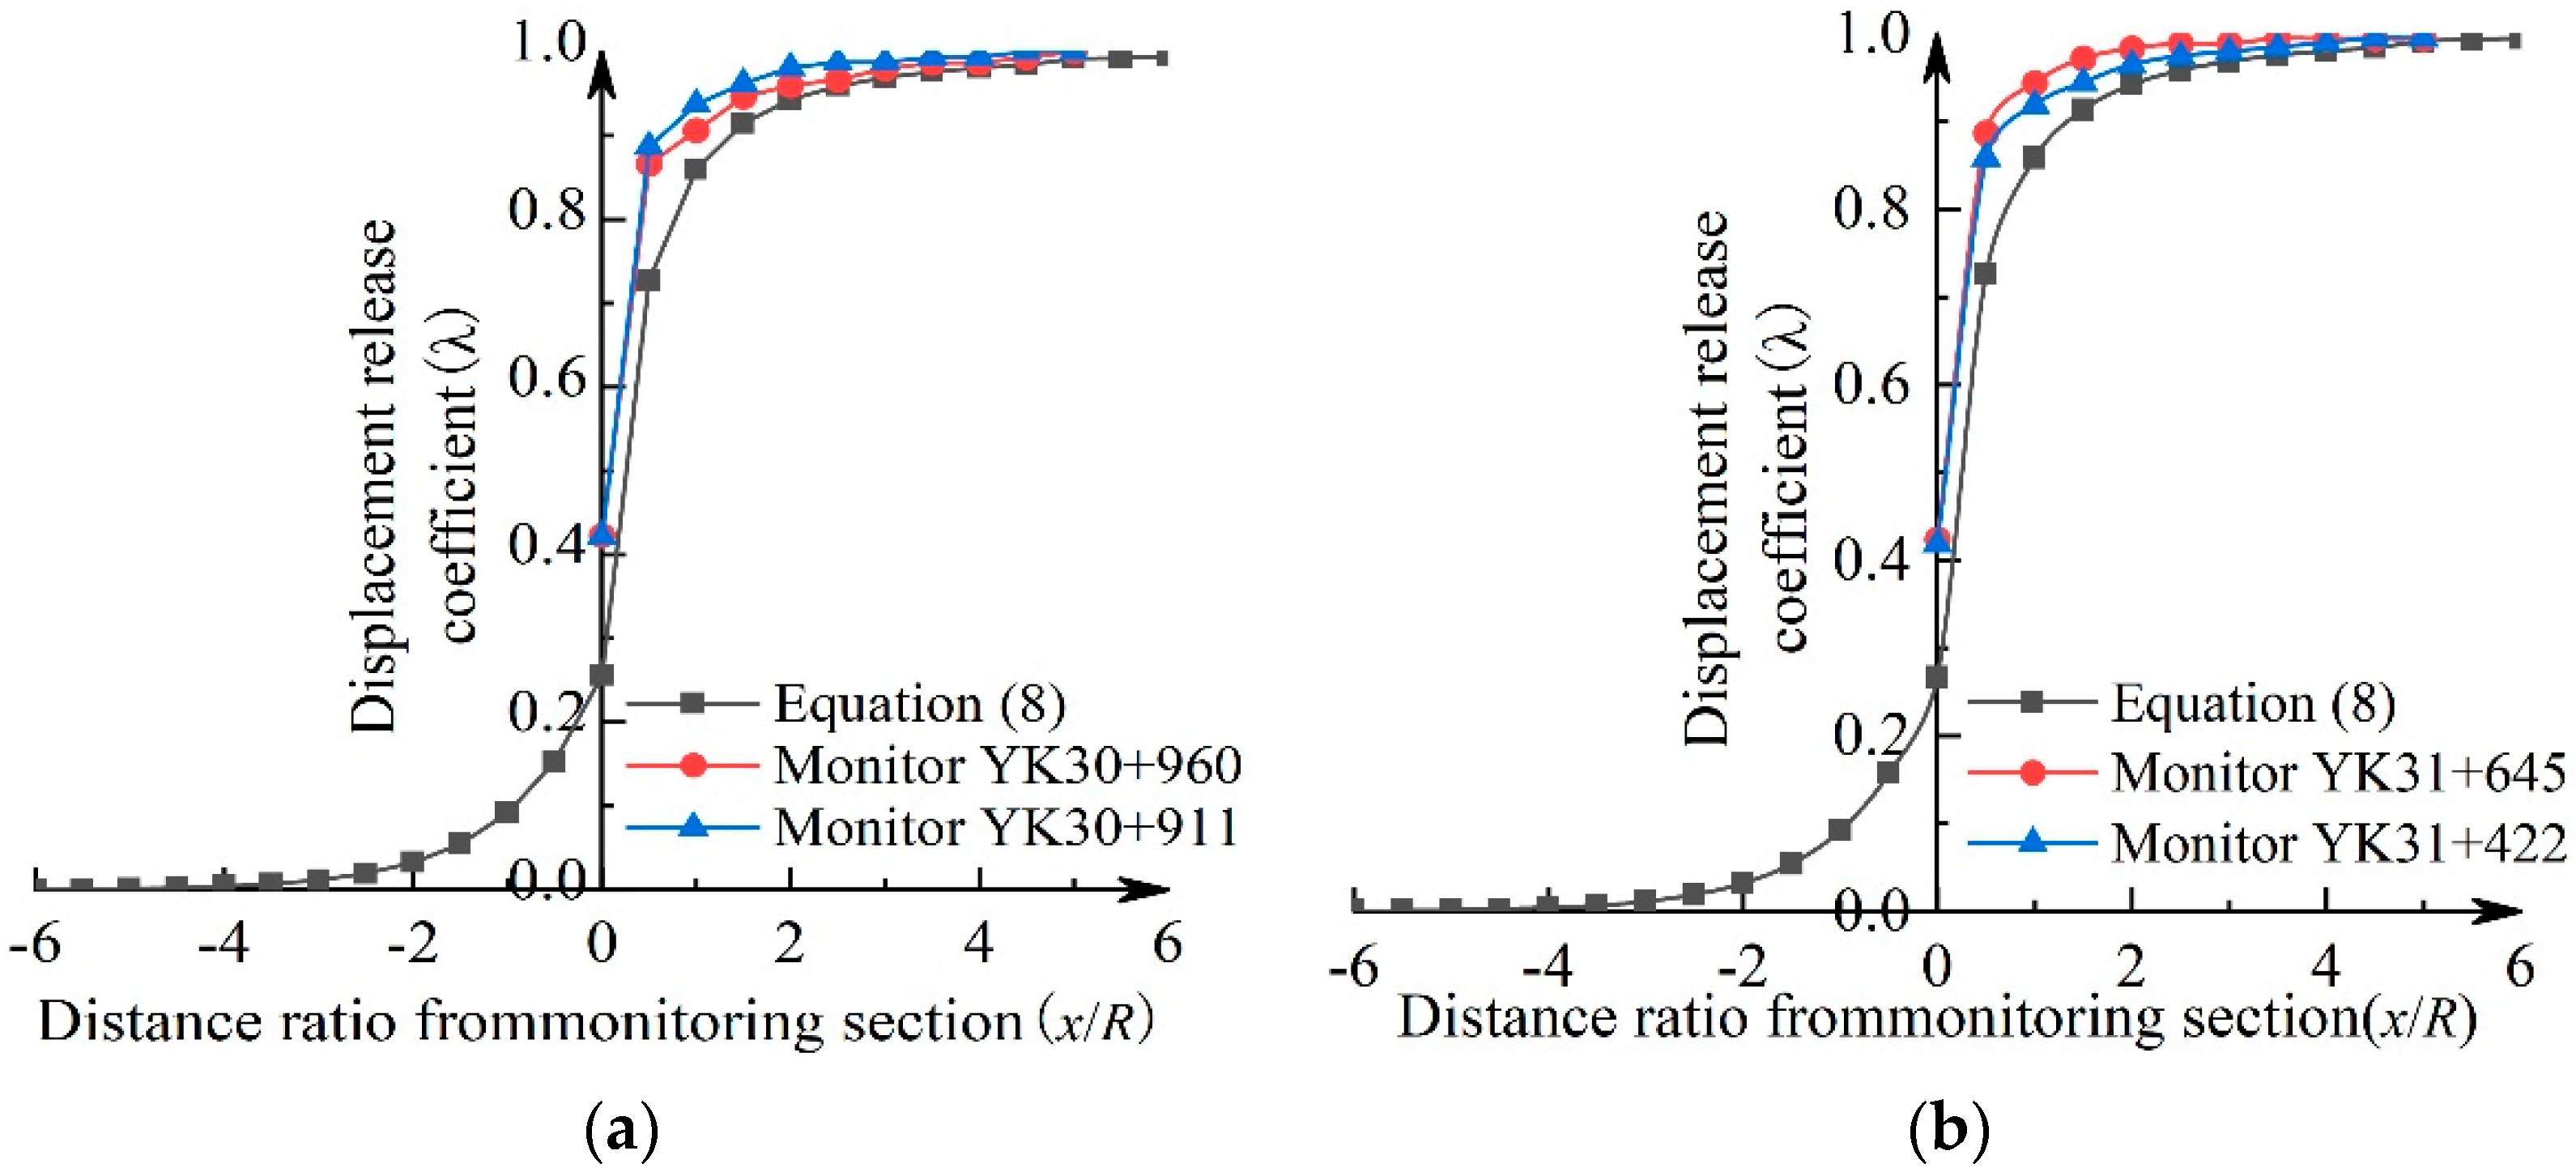
3.2. Data Comparison and Equation Optimization Analysis

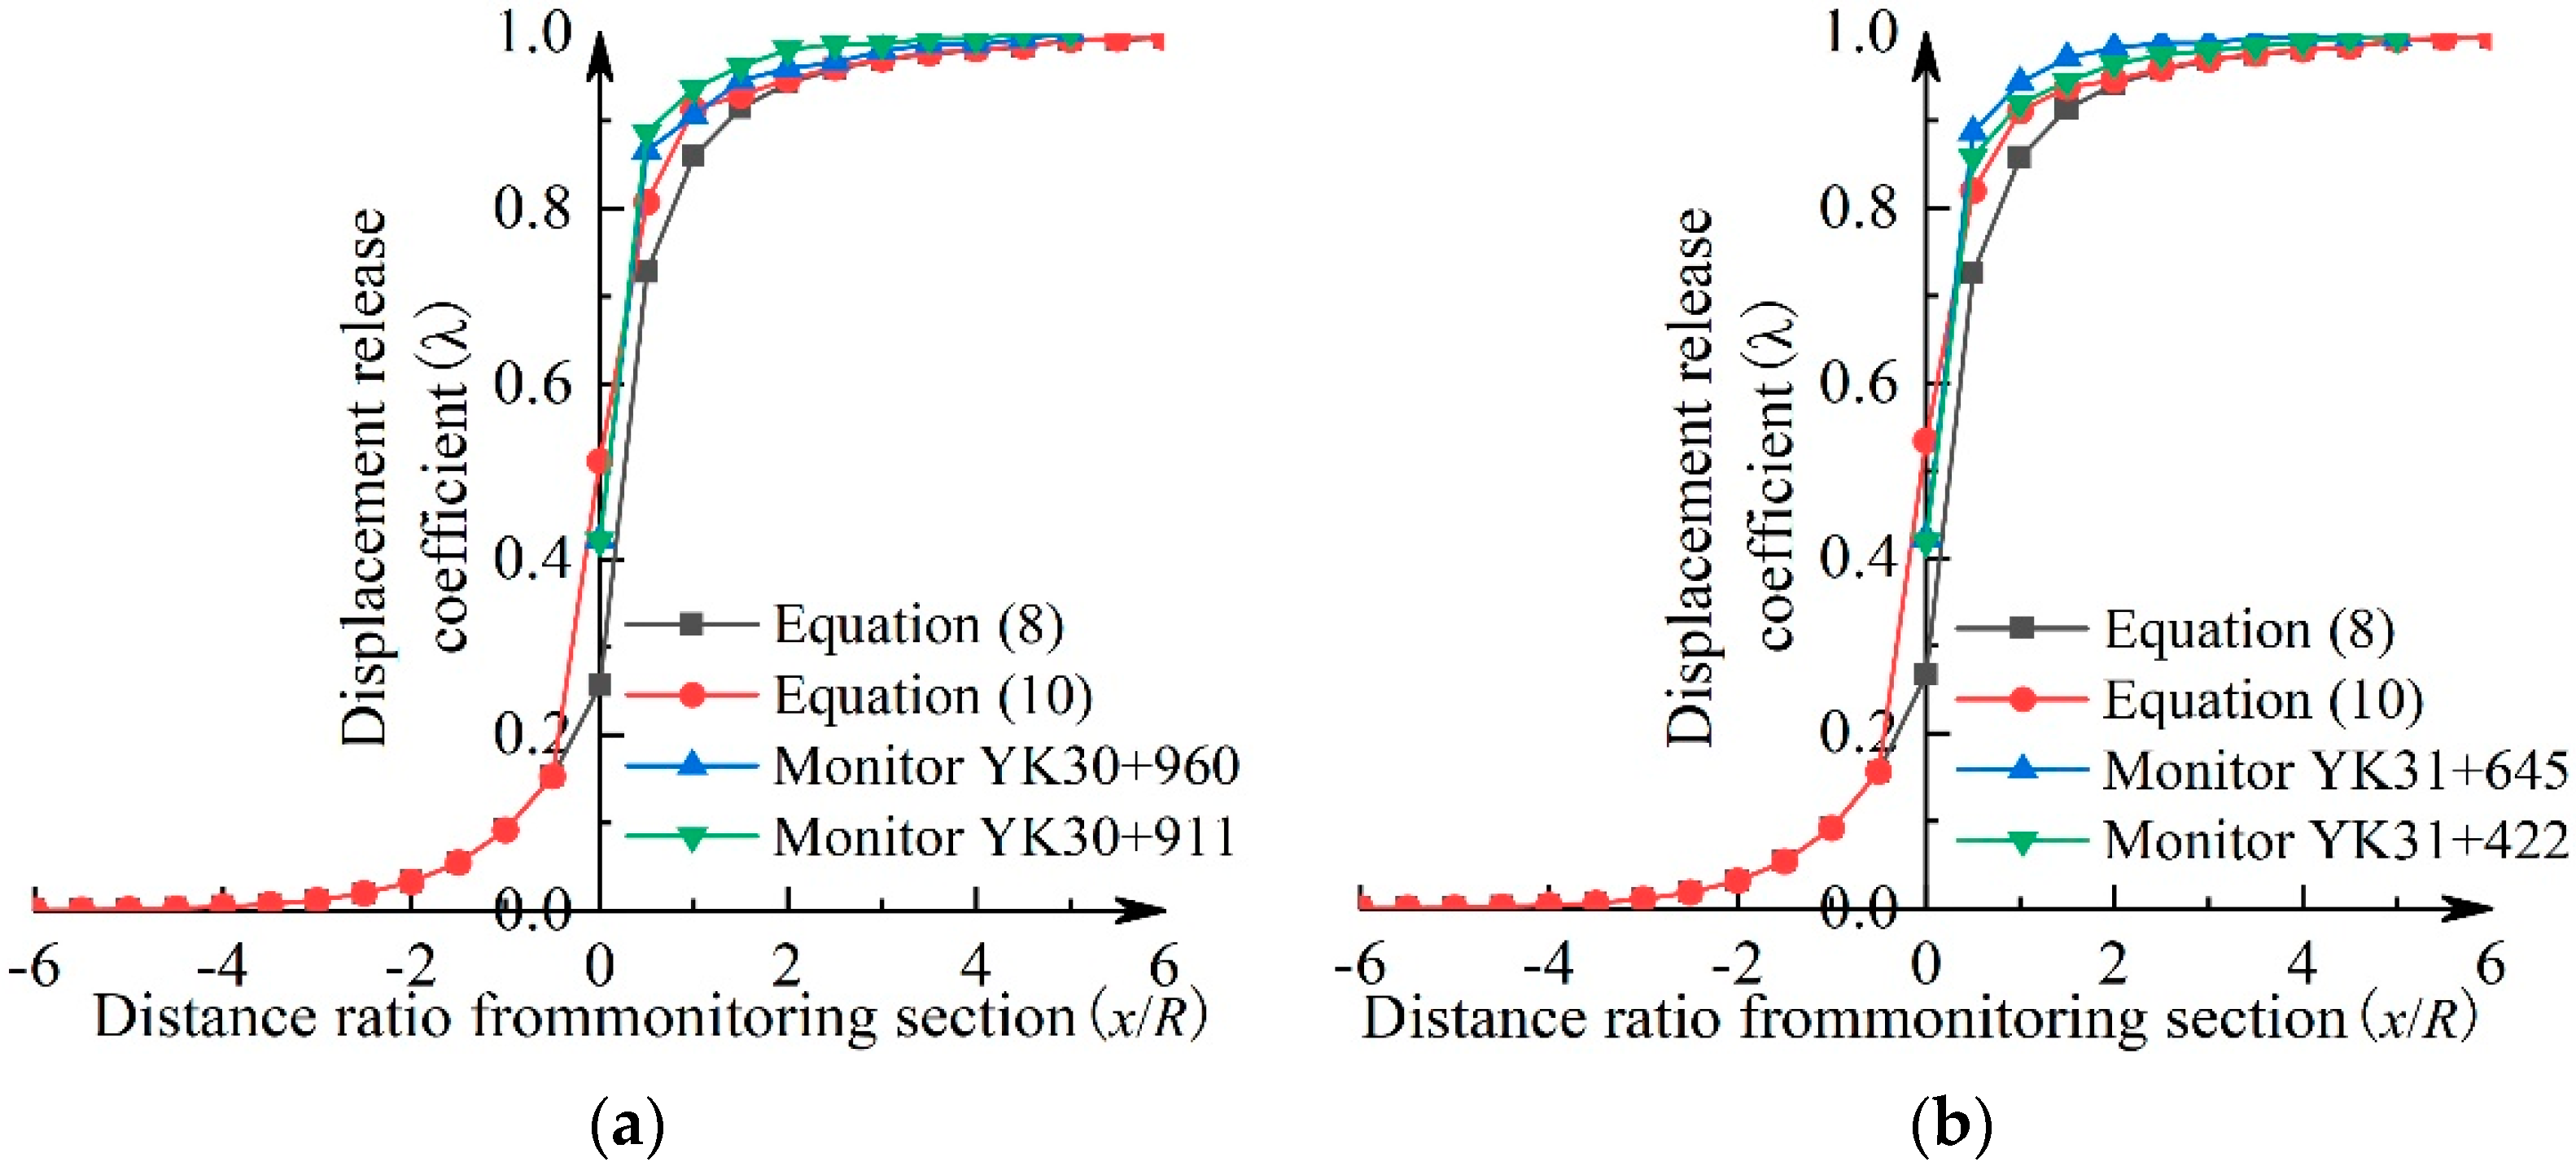
3.2.1. Comparative Analysis of Practice and Theory

Many characteristics of the surrounding rock and supporting structure in the New Austrian Tunneling Method (NATM) construction can be reflected macroscopically through deformation, that is, obtaining the convergence displacement of surrounding rock through monitoring and measurement is the most intuitive and effective information element to evaluate the bearing capacity of surrounding rock.
According to the field monitoring data, the monitoring data of Class-III surrounding rock sections, YK30+960 and YK30+911, and Class-IV surrounding rock sections, YK31+645 and YK31+422, are compared and analyzed with the calculation data of theoretical Equation (8), as shown in Figure 4.
Fit the curve in Figure 4 to obtain the variance and correlation coefficient of each fitting curve, as shown in Table 2:
The results show that the overall effect is good, but there are some errors. Especially between the distance ratio from the monitoring surface from 0~2, the displacement of Equation (8) is steep, the growth rate is relatively slow and there is a lag time difference with the actual construction monitoring data (the monitoring data shows that the displacement release coefficient of this section increases sharply, and the existence of the “spatial effect” of the tunnel face is identified), and it is also inconsistent with the law of gradually increasing the section after the steep increase. Taking this as the starting point, in order to improve the fitting accuracy, the x ≥ 0 segment function is optimized and improved on the basis of Equation (8).

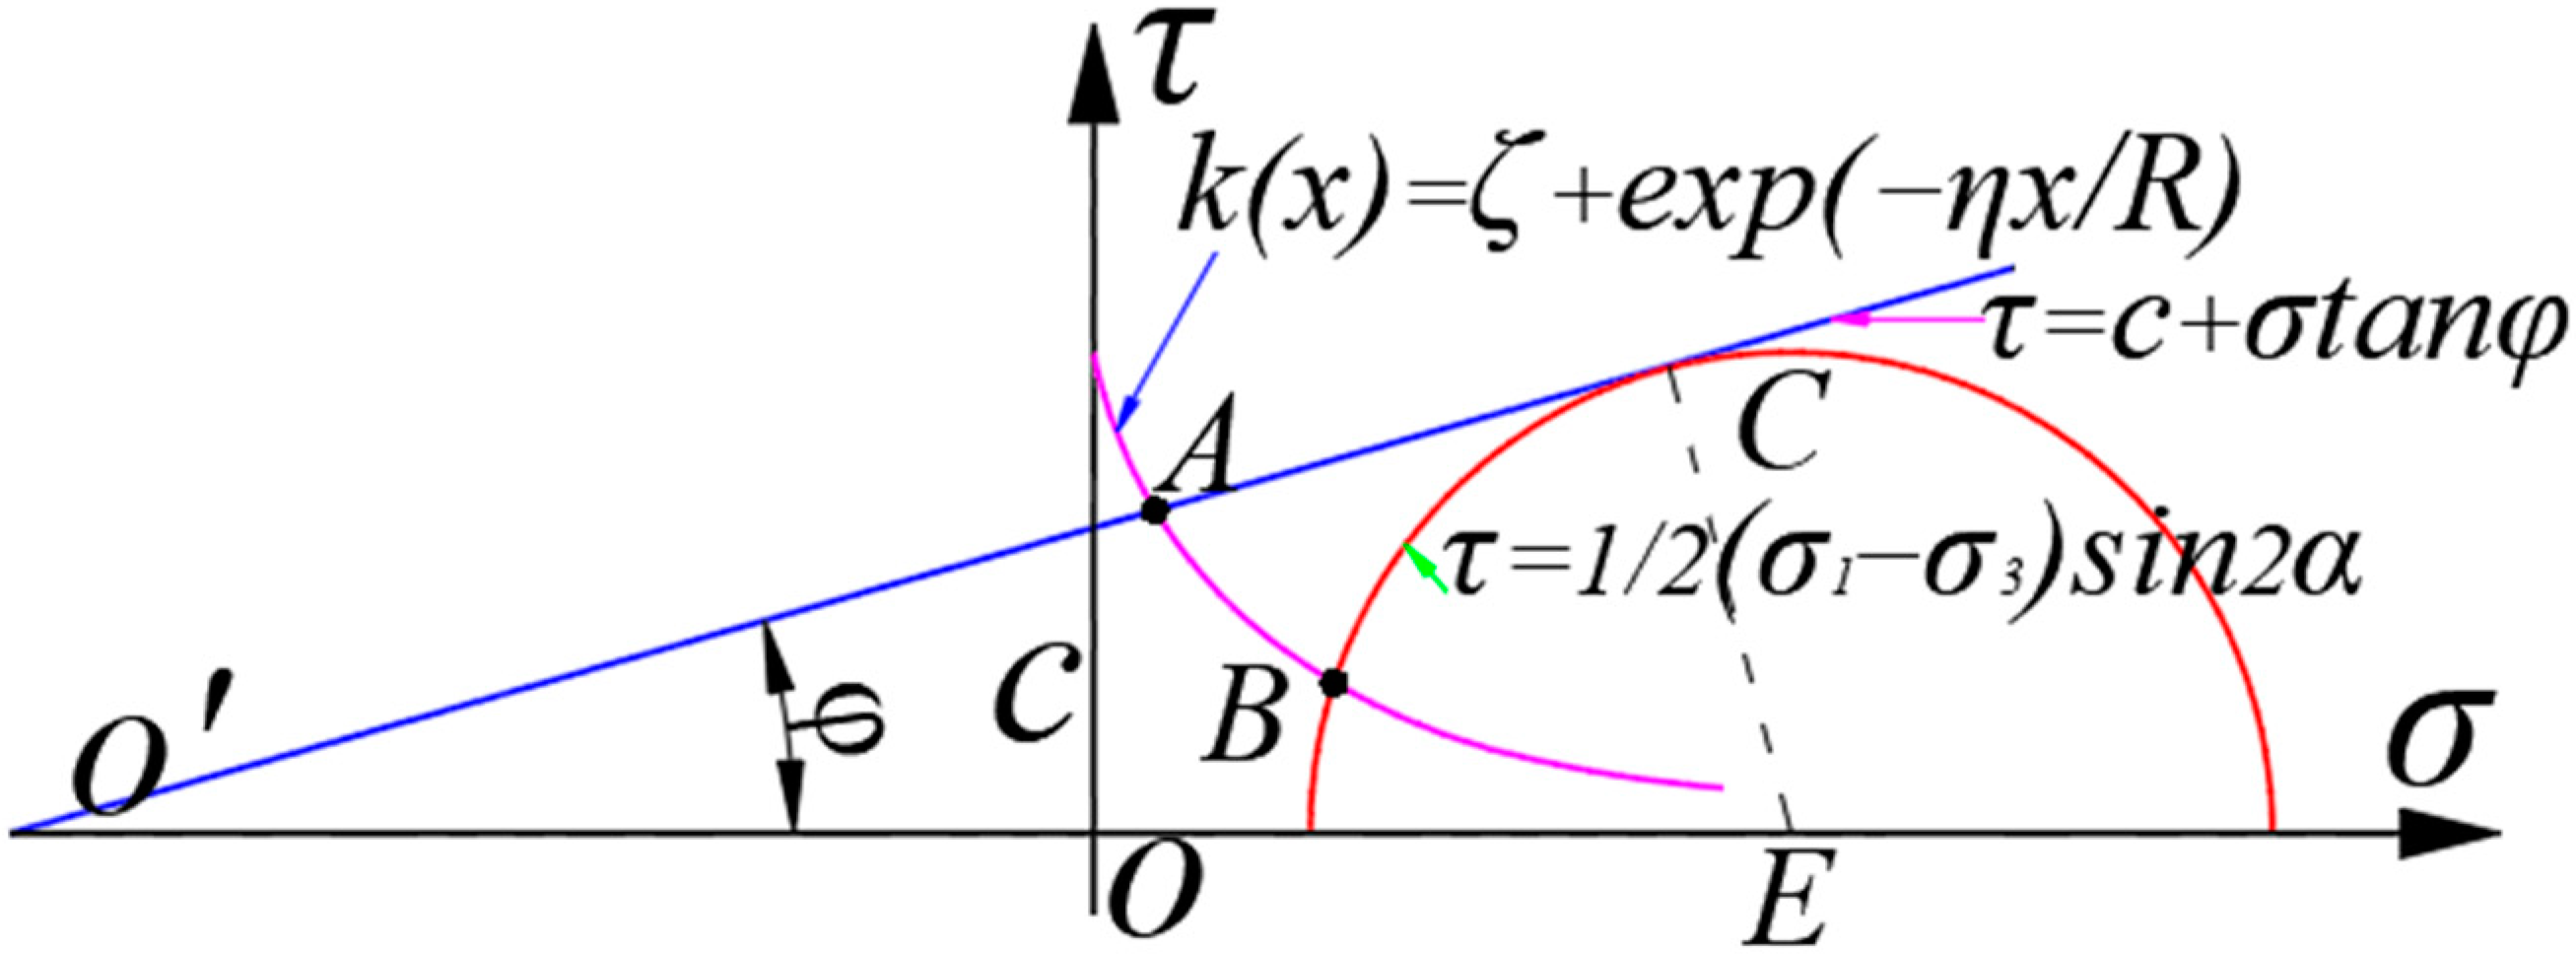
3.2.2. Equation Optimization and Improvement

The comparison between the monitoring data and theoretical calculation shows that the deformation of the surrounding rock during the actual construction of the tunnel is earlier than the theoretical derivation: it shows that the displacement release coefficient of the surrounding rock is not only related to Poisson’s ratio, but also related to the elastic–plastic modulus E, internal friction angle φ, cohesion c and blasting parameters.
(1) The relationship between the shear strength and Mohr-Circle (M-C) is shown in Figure 5 (σ is the compressive strength of the rock mass; τ is the shear strength of the rock mass; c is cohesion; φ is the internal friction angle): under the same internal friction angle φ, the greater the cohesion c and the wider the strength envelope range of the surrounding rock, the better the bearing capacity of the surrounding rock; similarly, under the same cohesion c, the larger the internal friction angle φ is, the wider the strength envelope range of the surrounding rock is, the better the bearing capacity of the surrounding rock is. The results show that the displacement release coefficient is no linearly proportional to the internal friction angle φ and cohesion c.
(2) The shear strength test of the rock mass shows that the strength of the surrounding rock is related to the bulk modulus K and shear modulus G. When Poisson’s ratio is constant, the bulk modulus K and shear modulus G are directly proportional to the elastic modulus E. It shows that the displacement release coefficient is nonlinearly proportional to the elastic modulus E.
(3) Blasting causes great damage to the integrity of the rock mass and greatly reduces the elastic modulus E and cohesion c of the rock mass. The results show that the displacement release coefficient is nonlinear and inversely proportional to the blasting parameters.
The following rules exist near the excavation face: the rock mass is damaged by construction blasting, resulting in cracks in the rock mass, and the bearing capacity of the surrounding rock is reduced, which is the main reason for the deviation between the monitoring data and the theoretical calculation. Therefore, for the theoretical Equation (8), it is proposed to add an “expanding convergence function” in the section x ≥ 0 to improve the practicability of the theoretical equation. Another exponential function ( y = e x ) is a convergent subtractive function with a maximum value of ( y 0 = 0 ) when x ≥ 0, and its deformation law meets the requirements of an “expanded convergent function”. Equation (9) of the “expanded convergent function” is obtained as follows in Equation (9):
k ( x ) = ξ + exp ( η x / R )
where, ξ and η are the fitting parameters related to the elastic modulus E, internal friction angle φ, cohesion c and blasting parameters.
The relationship between the expanded convergence function, shear strength and Mohr circle is shown in Figure 6.
By solving the relationship between the expanded convergence function, shear strength and the intersections A ( a 1 , b 1 ) and B ( a 2 , b 2 ) of the Mohr’s circle Equation (Equation (9a)), the fitting parameter expression Equation with parameters can be obtained (Equation (9b)):
{ ξ = c + a 1 tan φ exp ( η a 1 / R ) [ ξ + exp ( η a 2 / R ) ] 2 = 1 / 4 ( σ 1 + σ 3 ) 2 [ a 2 1 / 2 ( σ 1 + σ 3 ) ] 2
{ k ( x ) = ξ + exp ( η x / R ) τ = c + σ tan φ τ 2 + [ σ - 1 / 2 ( σ 1 + σ 3 ) ] 2 = 1 / 4 ( σ 1 σ 3 ) 2
where σ 1 and σ 2 are the maximum and minimum principal stress of rock mass and their values can be obtained through tests, the elastic modulus is E , the internal friction angle is φ , cohesion is c and the blasting parameters can be obtained through a geological survey. Parameters a 1 and a 2 are the fitting parameters.
Through the above analysis, the proposed Equation (9) of the “expanded convergence function” is combined with the theoretical Equation (8) given by Unlu and Gercek to obtain the modified Equation (10):
λ ( x ) = { ( 0.22 ν + 0.19 ) exp [ ( 0.73 ν + 0.81 ) | x R | ] x < 0 [ ξ + exp ( η x / R ) ] { ( 0.22 ν + 0.19 ) + ( 0.81 0.22 ν ) [ 1 ( 0.39 ν + 0.65 0.39 ν + 0.65 + x / R ) 2 ] } x 0
The relevant parameters contained in the “expanded convergence function” can be obtained by test and fitting, and it is reasonable to take ξ = 0.001 and η = 2.8 here.

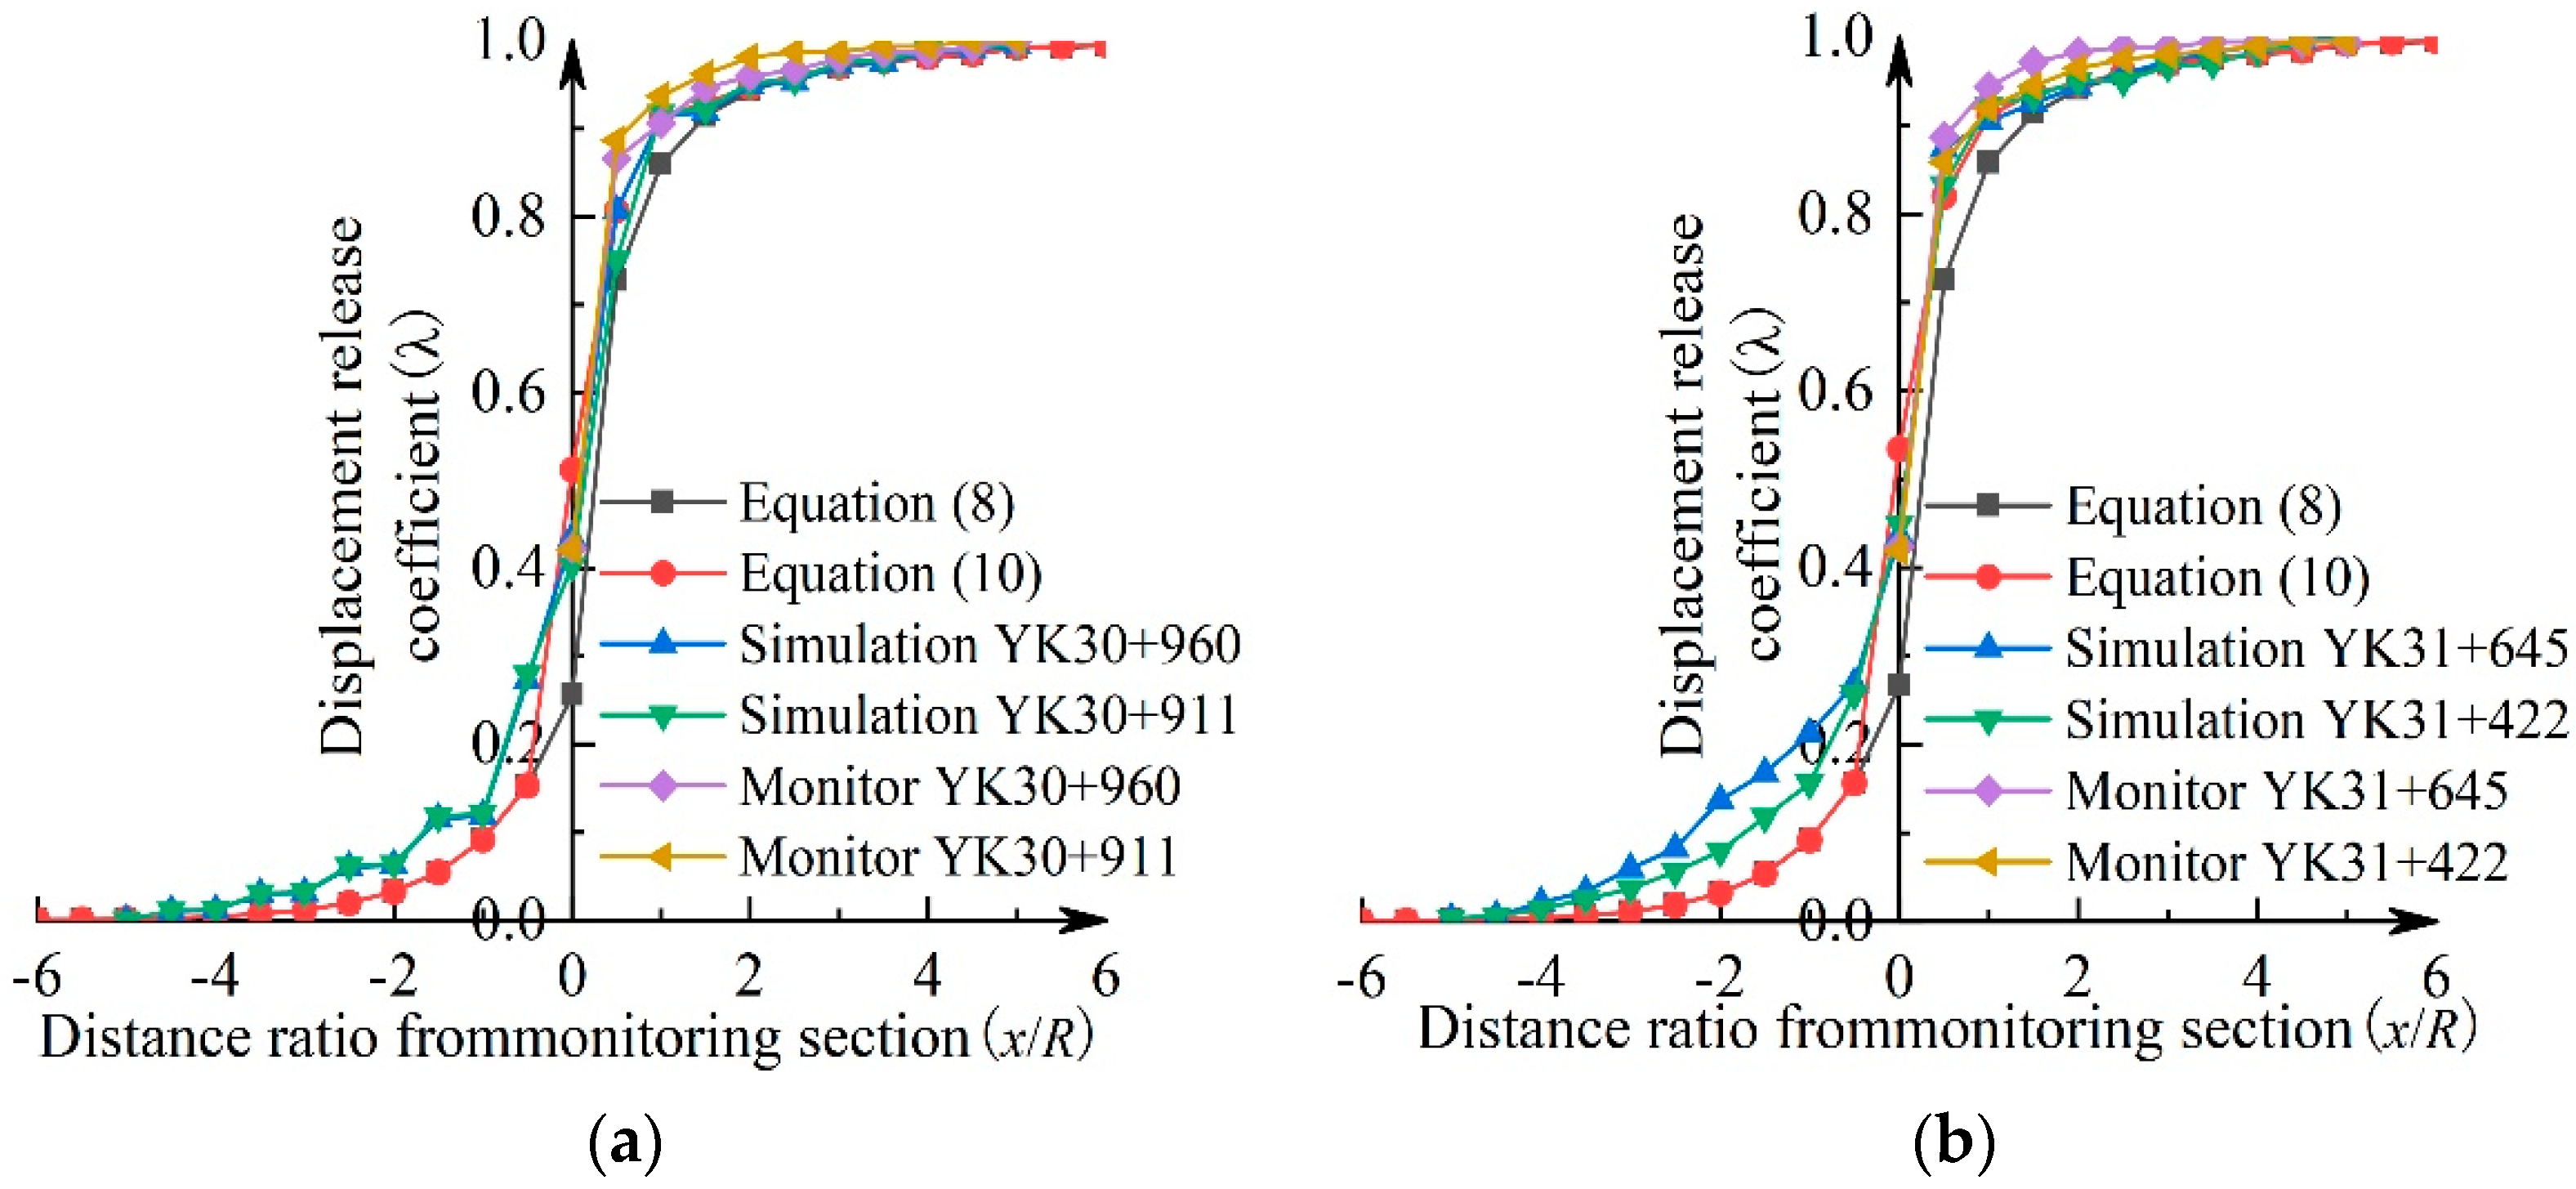
3.2.3. Analysis of Optimization Results of Theoretical Equation

A compare and analysis of the monitoring data of Class-III surrounding rock sections YK30+960 and YK30+911 and Class-IV surrounding rock sections YK31+645 and YK31+422 with the calculation data of Equation (8) and modified Equation (10) are shown in Figure 7.
The curve in Figure 7 is fit to obtain the variance and correlation coefficient of each fitting curve, as shown in Table 3:
The results show that the fitting effect of the theoretical equation is effectively improved by adding the “expanded convergence function” (the correlation coefficient is increased from about 0.8 to about 0.95); The fitting results show that the deformation law of surrounding rock is not only related to Poisson’s ratio, but is also related to the elastic–plastic modulus, internal friction angle, cohesion and blasting parameters. At the same time, it is also verified that the worse the quality of the surrounding rock, the more cracks, the lower the bearing capacity, the less significant the spatial constraint effect, the earlier the radial displacement of the surrounding rock in the excavation process, the greater the final deformation of surrounding rock and the later the final convergence is achieved.

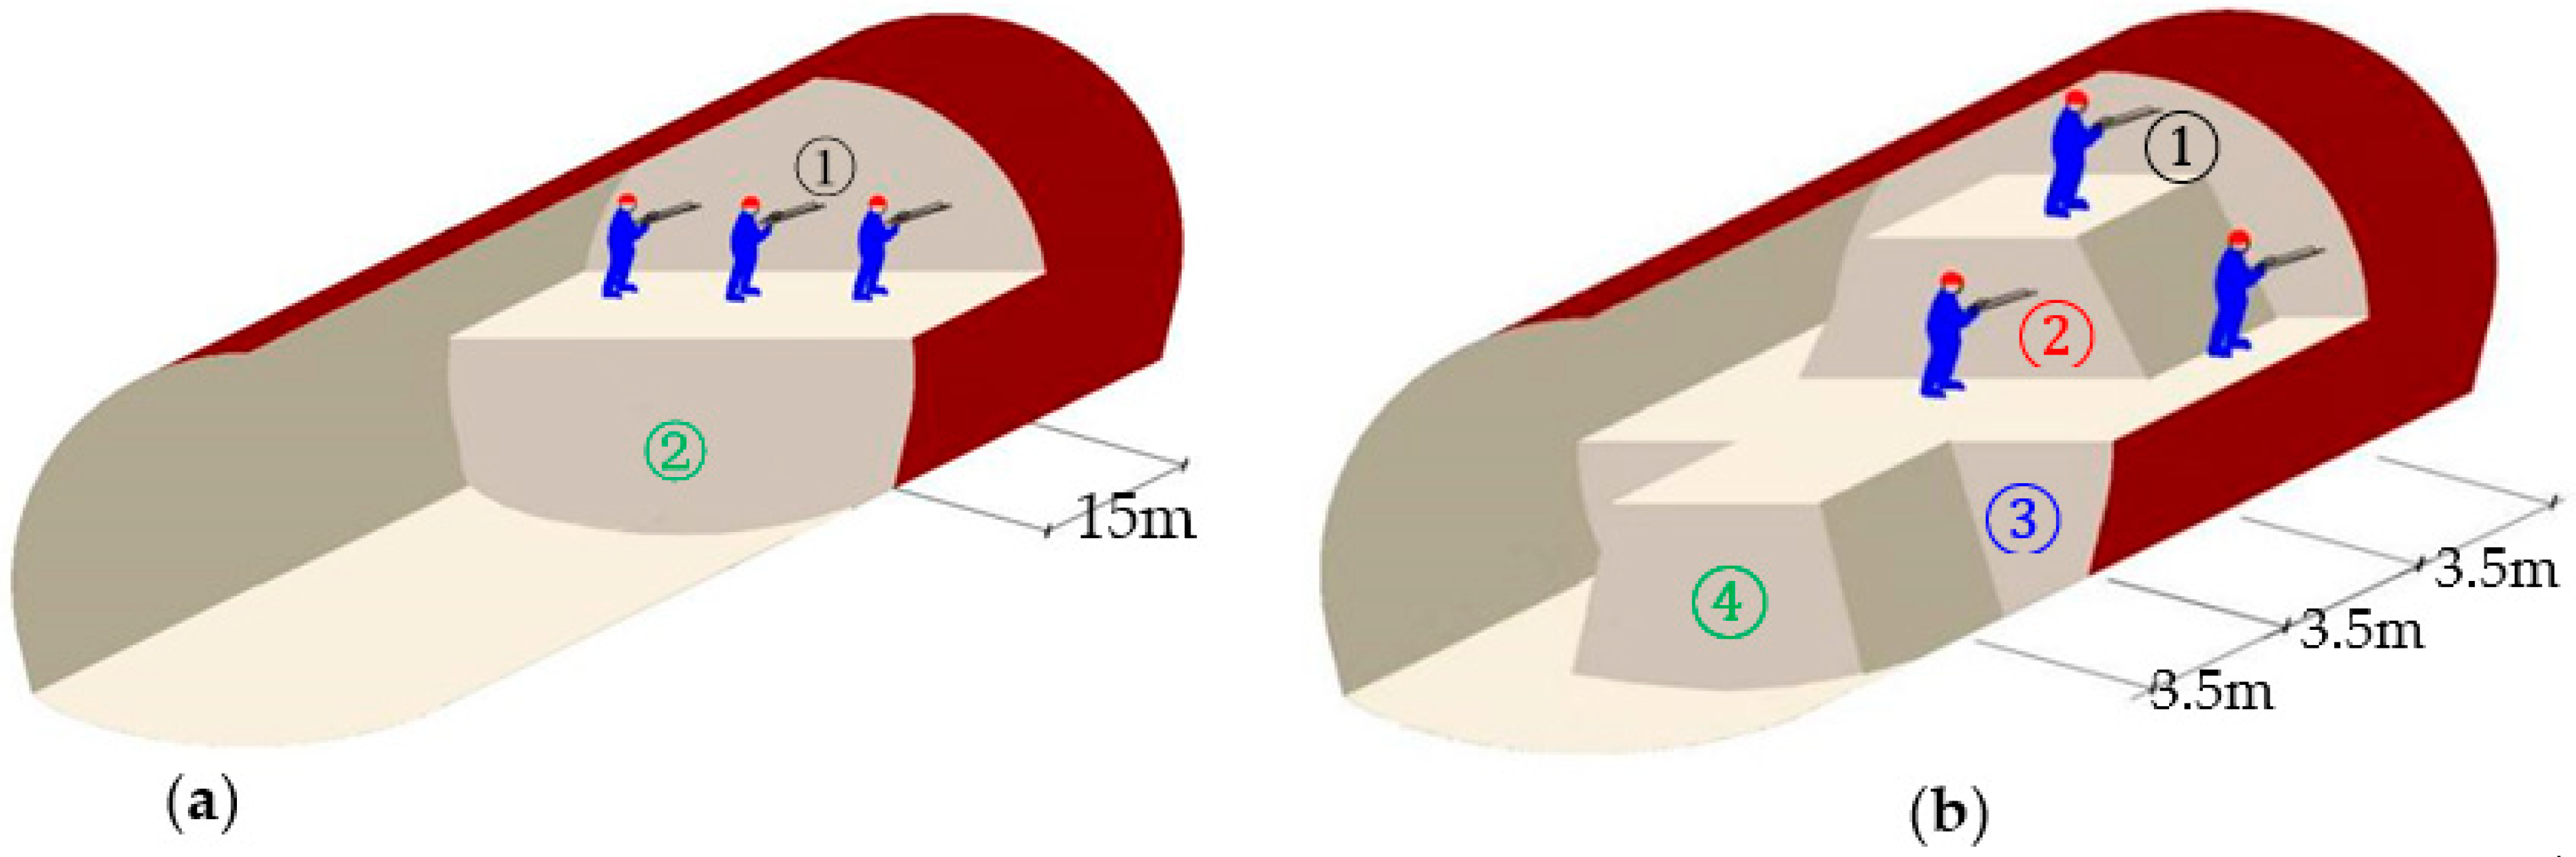
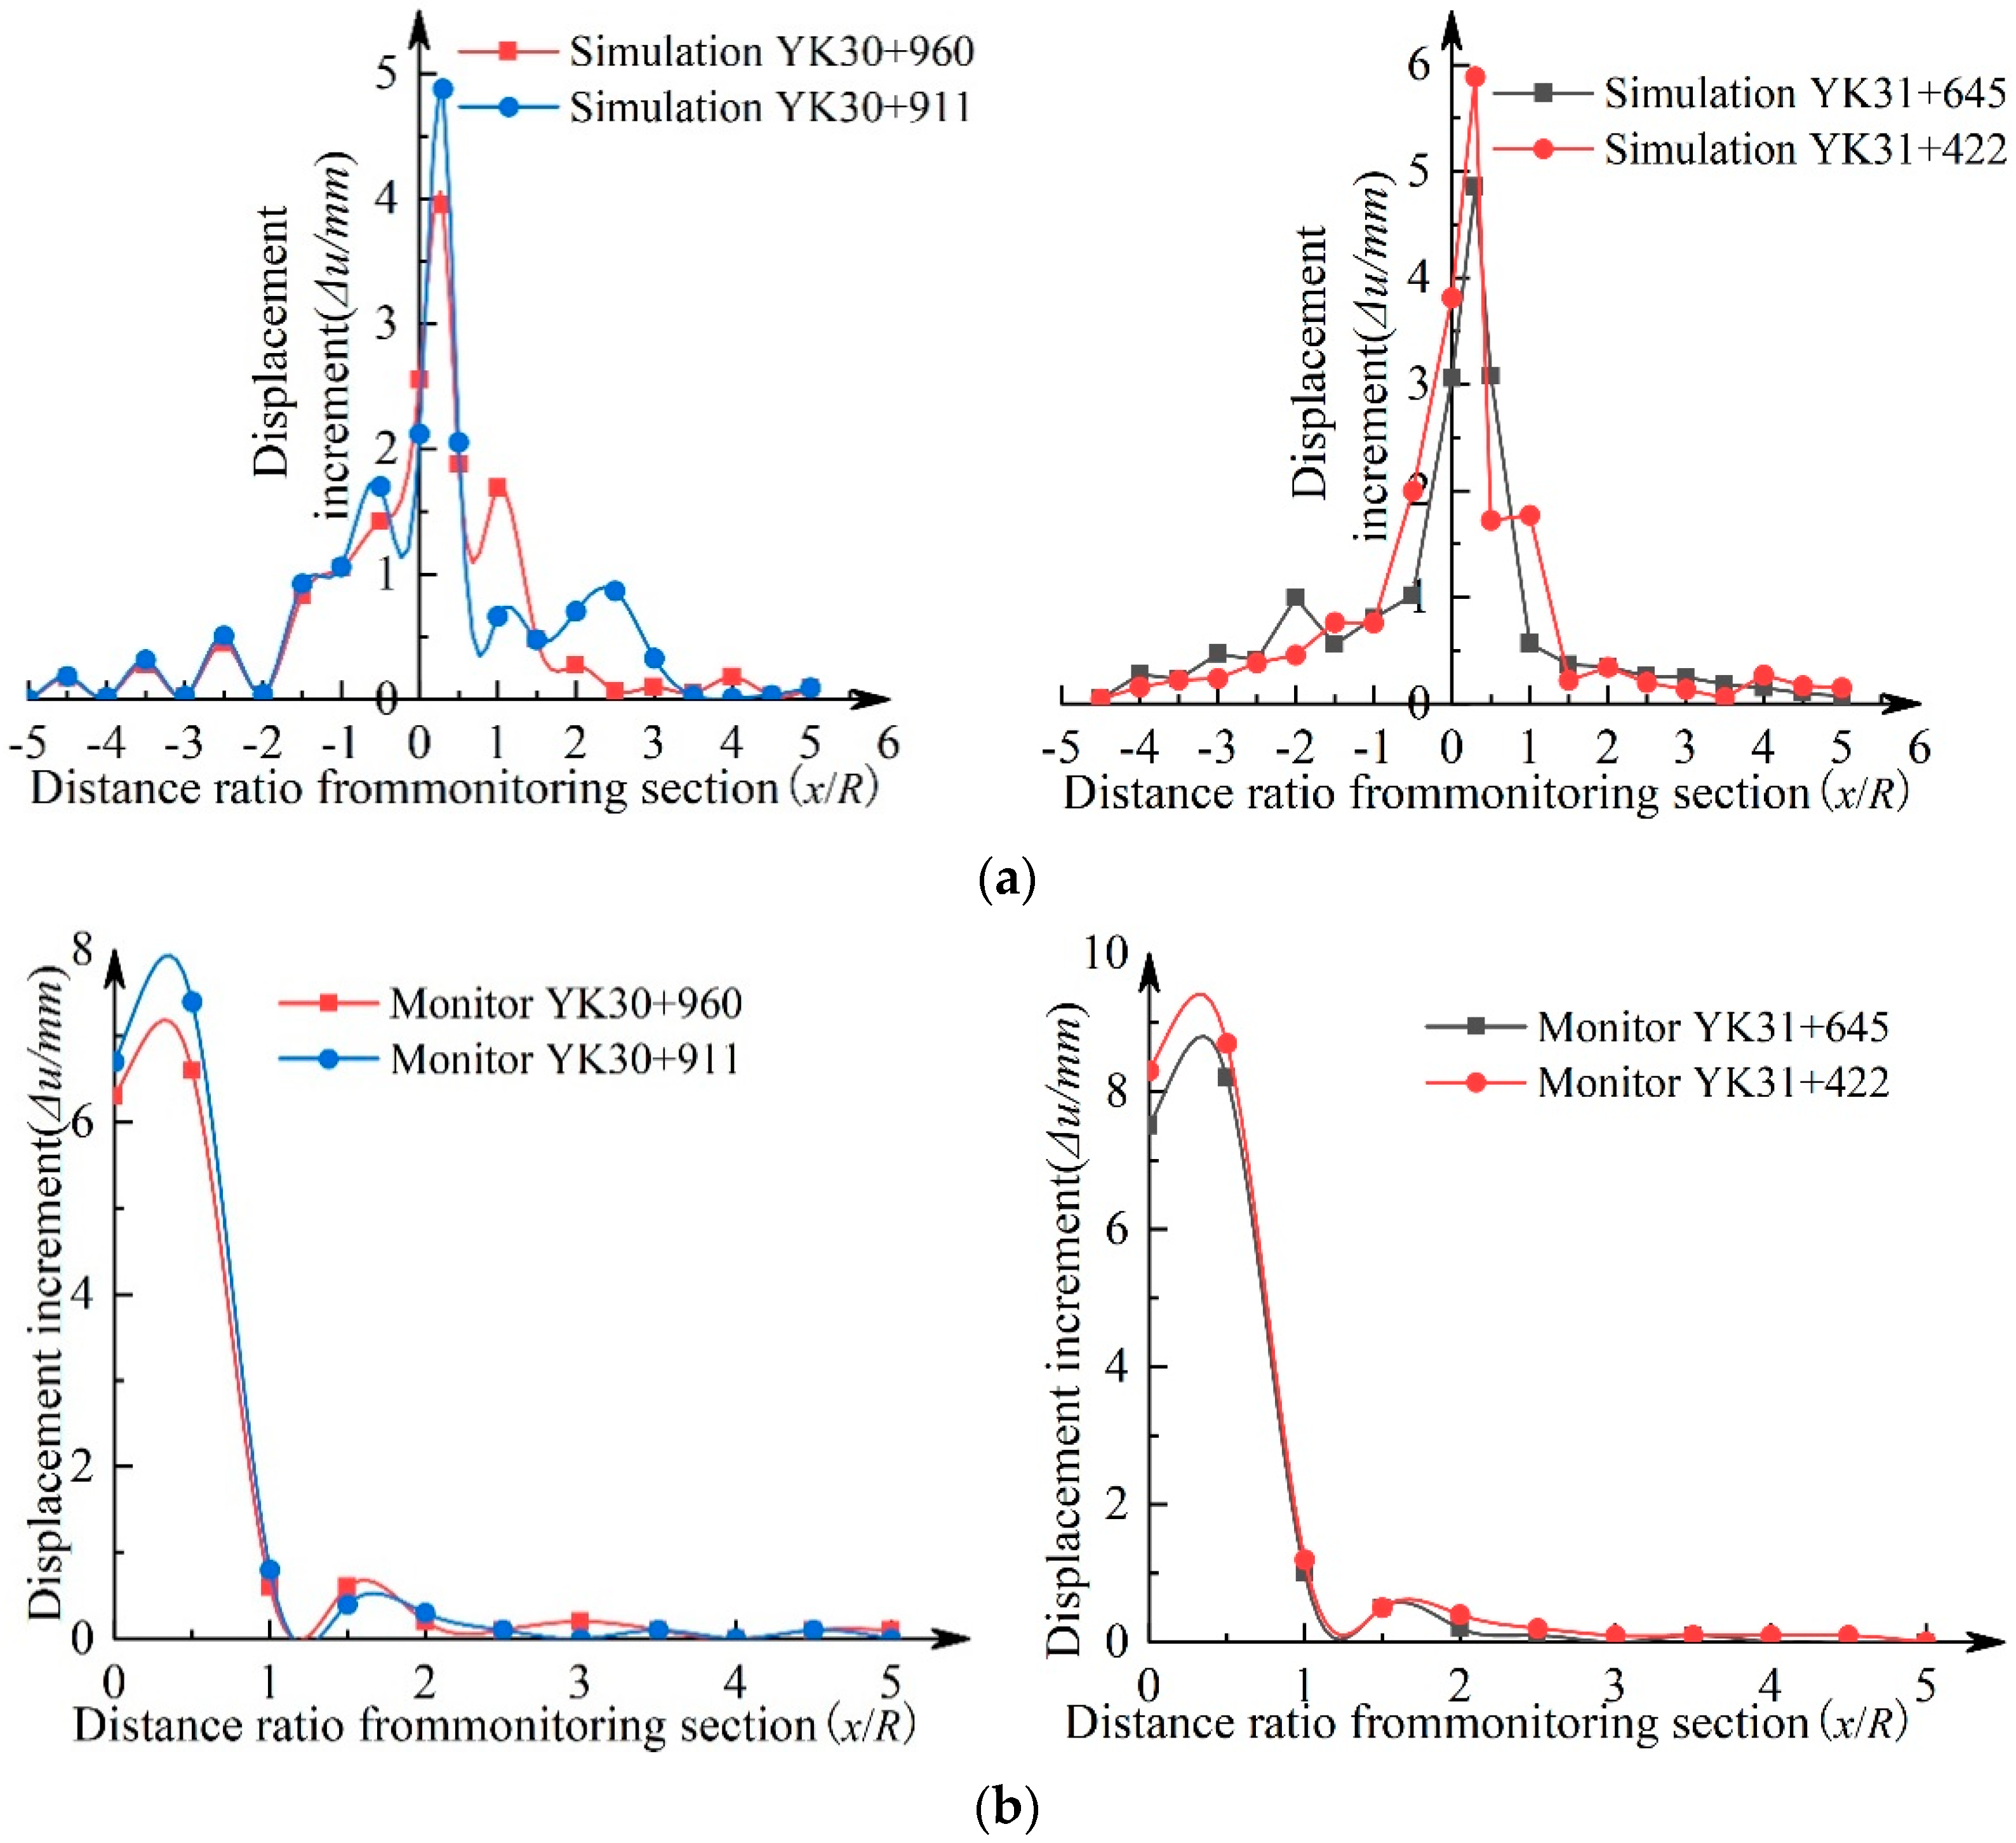
3.3. Numerical Simulation and Verification Analysis

To further verify the rationality and practicality of the optimization and improvement theory, FLAC3D is used to establish a numerical model, in which the model size is 42 m wide, 35 m high, 84 m long, with a total of 23,531 grid units and 21,902 nodes. The model adopts the M-C constitutive equation and the bottom and both sides are fixed constraints. According to the in situ stress at the location of the section, the buried depth of the Class-III surrounding rock is about 150 m, with 3.5 Mpa applied on the top, and the buried depth of the Class-IV surrounding rock is about 120 m, with 2.4 Mpa applied on the top. The model is shown in Figure 8.
FLAC3D is used to simulate the whole excavation process of the Class-III and -IV surrounding rocks. The footage of each excavation is 3.5 m. The whole process is excavated 24 times in a cycle and the radial displacement of the vault at the section is monitored. The displacement and stress changes of different monitoring sections are shown in Figure 9.
The monitoring results show that: (1) when the excavation surface is five times the tunnel radius from the monitoring surface, the monitoring points on the monitoring section begin to have radial displacement, but the displacement value is very small; (2) with the gradual advance of the excavation surface, the displacement of the surrounding rock at the monitoring point on the monitoring section increases rapidly, and then gradually tends to be stable; (3) the stress of the monitoring section is “8-shaped” and the stress of the arch crown and bottom is larger than that of the arch waist; (4) by analyzing the Class-III surrounding rock, the final settlement of the vault of the sections YK30+960 and YK30+911 measured when the long step method was used for excavation was 15.8 mm and 17.2 mm, respectively; (5) the final settlement of the vault of sections YK31+645 and YK31+422, measured when the reserved core soil method was used for the excavation of the Class-IV surrounding rock, was 18.3 mm and 20.2 mm, respectively. The above simulation results are close to the actual monitoring data, which confirms the effectiveness of the on-site tunnel excavation process.
By comparing and analyzing the simulation data with the monitoring data and theoretical calculation data, the displacement release coefficient deformation curves at different sections are obtained, as shown in Figure 10.
The simulation curve in Figure 10 is fitted with theoretical Equation (8) and theoretical Equation (10), and the correlation coefficients of each fitting curve are shown in Table 4:
Through the comparative analysis of the fitting parameters in Table 2, Table 3 and Table 4, it is not difficult to see that the modified Formula (10) can better match the actual monitoring data and simulation data (its R-square reaches about 0.95), and its curve change form has also been improved, meaning it can be more truly applied to practical projects. It is further confirmed that the variation law of the displacement release coefficient of the surrounding rock is not only related to Poisson’s ratio, but also related to the elastic–plastic modulus, internal friction angle, cohesion and blasting parameters.

4. Prediction of Initial Expenditure Opportunity

4.1. Theoretical Analysis

The “space-time effect” of the excavation face can be divided into two stages: the “spatial effect” and “time effect” [21,22] (as shown in Figure 11); the “spatial effect” mainly acts on the S1 section, whereas the “time effect” corresponds to the rheology of the surrounding rock, which is mainly reflected in the S3 section. However, the initial support of the tunnel is generally completed in the BC section and the CD section is mainly the equilibrium and stable stage of the interaction between the surrounding rock and the supporting structure.
Since the constitutive relationship adopted in the support design of soft rock tunnels is quite different from that adopted in the support design of hard rock tunnels, the support opportunity of a hard rock tunnel design is not to allow plastic deformation of the surrounding rock (once the surrounding rock enters the plastic state, it will lose its bearing capacity), while a soft rock tunnel has the opposite uniqueness because the soft rock itself has huge plastic properties (such as expansion deformation energy, high stress deformation energy, etc.). If it is effectively released through plastic deformation, it can well ensure the self-stable bearing capacity of soft rock.
Based on the unique elastic–plastic characteristics of soft rock, considering the “spatial effect”, the construction timing of the supporting structure can be judged by the surrounding rock displacement release coefficient and displacement increment change. Here, it is proposed that for the surrounding rock near the tunnel face, when the displacement increment has a sharp increase point, the corresponding displacement release coefficient value is the best point in which to apply the support structure.

4.2. Support Opportunity

According to the above theoretical analysis, the value of the displacement release coefficient corresponding to the sudden increase point of the displacement increment curve in the process of tunnel excavation is the best support time. According to the numerical simulation and field monitoring, the displacement increment change curve of the arch crown is displayed (as shown in Figure 12).
Under the construction process of the long step method, the distance ratio between the Class-III surrounding rock and the monitoring surface is between 0~0.5, and the displacement increment reaches the maximum. By using the linear interpolation method, the corresponding displacement release coefficient at this time can be obtained as λ = 0.8 by bringing the obtained displacement release coefficient into the modified Equation (10): x/R = 0.32, that is, after tunnel excavation. Due to the “space effect” of the tunnel face, the safety of supporting can be ensured at the place around the tunnel face x = 2.24 m.
Similarly, it can be obtained that the distance ratio between the Class-IV surrounding rock and the monitoring surface is between 0~0.5 when the reserved core soil method is adopted for excavation and the displacement increment reaches the maximum value. By using the linear interpolation method, the corresponding displacement release coefficient is λ = 0.75, and x/R = 0.21 can be obtained by introducing the modified Equation (10), that is, it is safe to start supporting at about x = 1.47 m from the tunnel face.
In the actual construction process, considering the mobilization of the self-bearing capacity of the surrounding rock, the staggered excavation is carried out between the support structure and the tunnel face. When the Class-III surrounding rock is constructed by the long step method, the support structure is measured to be about 2.5 m away from the upper guide face.
When the reserved core soil method is adopted for the construction of Class-IV surrounding rock, it is measured that the support structure is about 1.5 m away from the upper guide face, and it is observed that there are no obvious cracks and looseness in the surrounding rock. The results are in good agreement with the setting distance of the support structure obtained by the theoretical correction equation, which proves the rationality of the optimal support timing deduced by the theoretical equation. The distance between the on-site support structure and the tunnel face is shown in Figure 13.

5. Conclusions

In this paper, the LDP in the CCM is studied and based on the LDP of the surrounding rock, the support construction time of different grades of surrounding rock is proposed. The main achievements are as follows:
(1) By comparing the section monitoring data with the theoretical calculation data, it is found that the deviation of the LDP equation of the surrounding rock deduced by Unlu and Gercek is large in the section x ≥ 0. Considering the influence of the elastic–plastic modulus, Poisson’s ratio, cohesion, internal friction angle, blasting parameters and other factors, it is proposed to add an “expanded convergence function” for optimization and improvement.
(2) According to the deformation characteristics of soft rock, it is proposed that the displacement release coefficient value when the displacement increment occurs at the steep point is the best time to apply support. It is concluded that when the Class-III surrounding rock is constructed by the long step method, it is the best to start supporting at about x = 2.24 m from the tunnel face. When the reserved core soil method is adopted for the construction of the Class-IV surrounding rock, it is best to start the support at about x = 1.47 m from the tunnel face.

Author Contributions

All authors participated in the study. Conceptualization, Y.L., W.Z. and Z.L.; methodology, Y.L. and W.Z.; software, Y.L. and X.L.; formal analysis, Y.L. and W.Z.; investigation, Y.L. and X.L.; resources, W.Z. and Z.L.; data curation, Y.L. and X.L.; writing—original draft preparation, Y.L. and W.Z.; writing—review and editing, Y.L.; visualization, W.Z.; supervision, Z.L. and X.L. project administration, W.Z. and Z.L.; funding acquisition, W.Z. All authors have read and agreed to the published version of the manuscript.

Funding

This research was funded by the National Science Foundation of China, grant Number (51964002), the funded project of the “double millennium plan” in the Jiangxi Province, China, grant Number (DHSQT22021002), and the graduate innovation project of the Jiangxi Province in 2021, China, grant Number (YC2021-B160).

Institutional Review Board Statement

Not applicable.

Informed Consent Statement

Not applicable.

Data Availability Statement

Not applicable.

Conflicts of Interest

The authors declare no conflict of interest.

References

  1. Xie, H.; Liu, J.; Gao, M. Development and Utilization of Special Underground Space; Science Press: Beijing, China, 2018; p. 5. [Google Scholar]
  2. Oreste, P.P. Analysis of structural interaction in tunnels using the Convergence-Confinement approach. Tunn. Undergr. Space Technol. 2003, 18, 347–363. [Google Scholar] [CrossRef]
  3. Carranza-Torres, C.; Fairhurst, C. Application of the Convergence-Confinement Method of tunnel design to rock masses that satisfy the Hoek-Brown failure criterion. Tunn. Undergr. Space Technol. 2000, 15, 187–213. [Google Scholar] [CrossRef]
  4. Fang, Q.; Wang, G.; Yu, F.; Du, J. Analytical algorithm for LDP of a deep tunnel. J. Rock Mech. Geotech. Eng. 2021, 13, 845–854. [Google Scholar] [CrossRef]
  5. Liang, P.; Gao, Y.; Zhou, Y.; Deng, D. Determination method of reasonable support time for tunnel initial support and its engineering application. Chin. J. Eng. 2022, 44, 265–276. [Google Scholar]
  6. Tang, X. Analysis on reasonable support timing of deep buried tunnel considering strain softening and dilatancy effect of surrounding rock. Tunn. Construct. 2022, 3, 1–9. [Google Scholar]
  7. Tang, X. Theoretical Research and Application of Tunnel Convergence-Confinement Method. Ph.D. Thesis, Huazhong University of Science and Technology, Wuhan, China, 2009. [Google Scholar]
  8. Wang, Y.; Ding, W.; Liu, Z.; Wang, Z.; Li, W. Study on large deformation classification standard and support opportunity of Mu zhai ling tunnel. Chin. J. Undergr. Space Eng. 2020, 16, 1116–1122. [Google Scholar]
  9. Zhou, J.; Hu, J.; Wang, H.; Yang, X. Mechanical study on reasonable support time of step-by-step support of deep tunnel. Eng. Mech. 2019, 36, 145–152. [Google Scholar]
  10. Su, K.; Zhang, Y.; Wu, H.; Zhou, L. Study on evolution characteristics of safety factor of surrounding rock and selection method of support time during tunnel excavation. Chin. J. Rock Mech. Eng. 2019, 38, 2964–2975. [Google Scholar]
  11. Su, K.; Cui, J.; Zhang, Z. Method for selecting the timing of initial support during tunnel construction. J. Cent. South Univ. 2015, 46, 3075–3082. [Google Scholar]
  12. Zhang, Y.; Su, K.; Zhou, L.; Wu, H. Research on the evolution law of tunnel longitudinal deformation and estimation of support timing based on CCM. Rock Soil Mech. 2017, 38, 471–478. [Google Scholar]
  13. Unlu, T.; Gercek, H. Effect of Poisson’s ratio on the normalized radial displacements occurring around the face of a circular tunnel. Tunn. Undergr. Space Technol. 2003, 18, 547–553. [Google Scholar] [CrossRef]
  14. Zhou, S. Determination of Displacement Release Coefficient of Surrounding Rock Considering Spatial Effect. Ph.D. Thesis, Chongqing Univercity, Chongqing, China, 2014. [Google Scholar]
  15. Wu, Y.; Du, W.; Zhang, G.; Song, Y. The Longitudinal Deformation Profile of a Rock Tunnel: An Elastic Analysis. Math. Probl. Eng. 2021, 2021, 6684035. [Google Scholar]
  16. Panet, M. Le Calcul des Tunnels par la Méthode Convergence-Confinement; Press I’ecole Natinale des Ponts Chaussees: Paris, France, 1995. [Google Scholar]
  17. Corbetta, F.; Bernaud, D.; Nguyen Minh, D.N. Contribution à la méthode Convergence-Confinement par le principe de la similitude. Rev. Française Geotech. 1991, 54, 5–11. (In French) [Google Scholar] [CrossRef] [Green Version]
  18. Vlachopoulos, N.; Diederichs, M.S. Improved Longitudinal Displacement Profiles for Convergence-Confinement Analysis of Deep Tunnels. Rock Mech. Rock Eng. 2009, 42, 131–146. [Google Scholar] [CrossRef]
  19. Lee, Y.L. Prise en Compte des Non-Linéarités Decomportement des Sols et Roches Dans la Modélisation du Creusement d’un Tunnel; Ecole Nationale des Ponts et Chaussées: Paris, France, 1994. (In French) [Google Scholar]
  20. Hoek, E.; Brown, E.T. Practical estimates of rock mass strength. Int. J. Rock Mech. Min. 1997, 34, 1165–1186. [Google Scholar] [CrossRef]
  21. Huang, B.; Du, Y.; Zeng, Y.; Cao, B.; Zou, Y.; Yu, Q. Study on Stress Field Distribution during the Construction of a Group of Tunnels Using the Pile–Beam–Arch Method. Buildings 2022, 12, 300. [Google Scholar] [CrossRef]
  22. Zhang, C.; Zhang, J.; Cai, L.; Lv, W. Study on the timing of secondary lining support of large section tunnel in soft rock. Chin. J. Saf. Sci. Technol. 2018, 14, 116–121. [Google Scholar]
Figure 1. Schematic diagram of spatial effect of excavation face: (a) Semi dome effect; (b) Cantilever beam assumption of excavation face.
Applsci 12 07221 g001
Figure 2. Schematic diagram of CCM.
Applsci 12 07221 g002
Figure 3. Schematic diagram of tunnel excavation: (a) Long step method; (b) Reserved core soil method. ①~④ is the excavation sequence of surrounding rock.
Applsci 12 07221 g003
Figure 4. Monitoring and theoretical fitting diagram of vault displacement release coefficient: (a) Class−III surrounding rock; (b) Class−IV surrounding rock.
Applsci 12 07221 g004
Figure 5. M-C yield strength criterion of surrounding rock.
Applsci 12 07221 g005
Figure 6. Relationship between expanded convergence function, shear strength and M-C.
Applsci 12 07221 g006
Figure 7. Monitoring and theoretical fitting diagram of vault displacement release coefficient: (a) Class−III surrounding rock; (b) Class−IV surrounding rock.
Applsci 12 07221 g007
Figure 8. Schematic diagram of tunnel model and monitoring section.
Applsci 12 07221 g008
Figure 9. Nephogram of displacement and stress changes of different monitoring sections: (a) displacement nephogram; (b) stress nephogram.
Applsci 12 07221 g009
Figure 10. Simulation, theory, monitoring fitting diagram of vault displacement release coefficient: (a) Class−III surrounding rock; (b) Class−IV surrounding rock.
Applsci 12 07221 g010
Figure 11. The whole process curve of surrounding rock deformation.
Applsci 12 07221 g011
Figure 12. Displacement increment curve of different sections: (a) numerical simulation displacement increment change curve; (b) field monitoring displacement increment change curve.
Applsci 12 07221 g012
Figure 13. Site surrounding rock-support spacing map: (a) Class−III surrounding rock; (b) Class−IV surrounding rock.
Applsci 12 07221 g013
Table 1. Physical and mechanical parameters of surrounding rock and support.
Rock
Grade
Mechanical Parameters
Density
ρ (kg/m3)
Young’s Modulus
E (Gpa)
Poisson’s Ratio ν Internal Friction Angle φ (0) Cohesion
c (Mpa)
Tensile Strength
σ f (Mpa)
230060.3300.30.3
200020.35250.20.2
Support2400210.2
Table 2. Fitting parameters of surrounding rock.
Fitting
Parameters
IV
YK30+960YK30+911YK31+645YK31+422
RMSE0.06780.07060.07080.0601
SSE0.04560.06470.06530.0470
R-square0.79200.79200.77940.8415
Notes: RMSE is mean square deviation, SSE is sum variance, R-square is correlation coefficient.
Table 3. Fitting parameters of surrounding rock.
Fitting
Parameters
IV
YK30+960YK30+911YK31+645YK31+422
RMSE0.03100.03220.03750.0361
SSE0.01220.01340.01830.0170
R-square0.96500.95490.93860.9428
Notes: RMSE is mean square deviation, SSE is sum variance, R-square is correlation coefficient.
Table 4. Fitting parameters of surrounding rock.
Fitting
Parameters
IV
YK30+960YK30+911YK31+645YK31+422
Equation (8)
R-square
0.84390.8760.78240.7871
Equation (10)
R-square
0.93830.93020.97180.9597
Notes: R-square is correlation coefficient.
Publisher’s Note: MDPI stays neutral with regard to jurisdictional claims in published maps and institutional affiliations.

