1. Introduction
Recently, as an increasing variety of attacks have been actively performed, a growing number of methods for detecting them have been studied. The attack graph-based method uses information such as the existing network elements (nodes) and relationships (edges) between elements to identify the optimal intrusion route. By blocking in advance, it is possible to quickly and accurately detect attacks and then defend against them. In particular, it creates an attack graph based on the existing network and uses it to create an optimal attack route. Therefore, the security system that should be applied to the existing network is also determined by calculating the optimal attack route and the expected damage in the network. With this background, in fields such as national defense and security, research is being conducted to perform optimized attack and target removal by applying it to the enemy’s network where the attack is being performed. Related research includes the creation of an automated attack/defense agent based on reinforcement learning [
1], the establishment of a cyber battlefield based on the attack graph [
2,
3], and network attack and defense based on the attack graph [
4,
5,
6,
7,
8,
9].
Attack graph is mainly used when a user, who plays the role of an attacker or intruder, attacks a particular network to reach a target and attempts to compensate for each node’s vulnerability by utilizing the intrusion results. In this context, it is important to create an attack graph, as well as determine whether it is possible to construct and detect an optimal route to a target node, at a minimum cost. The information used at that time includes network security conditions, node-specific vulnerabilities, input/output information, protocols, and IP addresses. In previous research works, it was difficult to analyze and create the optimal route because they analyzed the network and found the attack route within the vast network. To overcome this problem, recent research has studied an automatic attack route and defended the attack using it [
1,
10,
11].
To identify and supplement vulnerabilities as well as prevent and detect attacks occurring in the network, it is necessary to collect and analyze information related to each node and edge in the network to build an attack graph and detect the optimal route accordingly. Representative network information related to this includes network connection information, access authority, network type, confidentiality, integrity, availability, vulnerability score, etc. Using this information, most existing studies that have built attack graphs and evaluated network vulnerabilities have used CVSS scores. CVSS performs an assessment of each vulnerability and calculates the risk based on information that can be analyzed or collected in common between networks. However, the problem with this is, because common information is used, the exact score cannot be calculated by not considering the special situations or information that each network has, and the association between network nodes is not considered because each vulnerability is evaluated individually. Therefore, further research is needed to solve this problem.
The number of attacks using vulnerabilities in the network is increasing rapidly every year, and attacks using vulnerabilities in the network are mainly used. In addition, CVSS scores, which are mainly used to detect such attacks, have a problem in that they do not reflect the specialized parts of each security environment, because they are a universal evaluation method. Therefore, in this paper, we propose a method that can determine the risk of attacks utilizing network vulnerabilities on nodes and edges, and we calculate them comprehensively to calculate the risk of each attack route and accordingly select the priority. The CVSS score, attack type, and vulnerability association analysis were applied to calculate the risk of nodes, edges, and attack routes. CVSS only used access location and CIA scores, and the impacts of the attacks were determined through attack types that occurred during the year collected in advance. In addition, the effect of vulnerabilities between nodes connected to each other through experts was judged and analyzed. Experiments were conducted through a self-generated network to verify the proposed method.
In this method, an attack graph was created, and an optimized route was then created by analyzing the associations and vulnerabilities between nodes and edges based on various points of information present in the nodes and edges included in the generated graph. The vulnerability of each node was analyzed using CVSS, and the relationship between nodes was analyzed to calculate the edge value. This allowed for the risk of nodes and edges to be measured and identified the most vulnerable attack route. The contributions obtained through the proposed method in this study are as follows.
To calculate attack route risk score, we collect various types of information (vulnerabilities, CIA, access methods, etc.) about each node and edge present in the network.
We propose VCGA-SS using CVSS, attack type, and vulnerability correlation, and calculate each of the attack route risk scores based on the collected node and edge information.
We calculate the attack route risk scores and utilize them to compare attack routes using the calculated node and edge risk value.
The rest of the paper is organized as follows. In
Section 2, we provide related work. In
Section 3, we present the VCAG-SS that evaluates nodes and edges to calculate the risk of the attack route. In
Section 4, we experimentally verify the proposed method. Finally,
Section 5 draws conclusions and discusses future work.
2. Related Works
As shown in
Section 1, attackers use various vulnerabilities present in the network to perform attacks. To defend against such attacks, we need to know what vulnerabilities exist on each node in the network and what routes can be created by them, and we typically use attack graphs to identify them. CVSS is used for assessments of attack possibility or risk on these routes.
2.1. Attack Graph
An attack graph is used in various fields, such as attack detection, identification, and defense. In the security field, it helps establish an effective defense system by identifying the intention, attack range, and vulnerability, and providing this information to the defender. It also creates attack scenarios that extract possible routes that attackers can use to break into target networks, which are then used to predict and block future attacks. This approach creates an attack graph for the target, and it conducts attack simulation and attack optimal route analysis. This approach makes it possible to understand what components the network has, and the related cyber assets and problems (damage, situation, etc.) that occur when each asset is attacked.
When carrying out an attack on a target, the attack graph provides priority to decision makers, thus enabling quick and accurate decision-making. By evaluating the attack graph-based target attack method, it provides the decision-maker with the expected effect according to the attack route and the future occurrence situation. Related technologies include Multihost, multistage Vulnerability Analysis (MulVAL), NETSPA, Dijkstra, and Floyd. Jha et al. [
4] proposed a method for determining the possibility of an attack through an attack graph to which minimum hitting and greedy algorithm could be applied, so that the minimum security measures to ensure the safety of the network could be determined. Jajodia et al. [
5] described a tool that implemented an integrated topology approach to network vulnerability analysis. Then, an attack graph was created to analyze the network security conditions of the Topological Vulnerability Analysis (TVA) tool, Exploit, Nessus vulnerability scanner, and attack route analysis leading to a specific attack target, and the vulnerabilities for each network were analyzed. Ingols et al. [
6] proposed a method for analyzing multiple prerequisite graph-based attacks that linearly expanded as the size of the network increased. Ammann et al. [
7] proposed a more concise and expandable method with which to solve the expandability and complexity problems that occurred in the existing attack graph generation method. Thus, an attack graph was created and applied to a large network to identify useful information. Wang et al. [
8] proposed an attack graph-based automation method that strengthened the network in preparation for intrusions performed in multiple stages, and unlike previous methods, it minimized the cost with satisfactory conditions at the beginning. Sheyner et al. [
9] defined the attack model and attack graph in network security, proposed a method for accordingly generating and visualizing the attack graph, and built an attack graph tool to automatically generate the attack graph. This was visually shown to the user, so that vulnerability analysis could be easily performed. Yoon et al. [
12] proposed an attack graph-based moving target defense (MTD) technique that used software-defined networking (SDN) to change the host network configuration according to the host importance, and they built a hierarchical attack graph model that provided network topology and network vulnerabilities that could be used to make MTD shuffling decisions. Gonda et al. [
13] proposed a method of inferring the importance of vulnerabilities in a LAG or connection graph analysis and relaxed planning graph using node centrality measurement. Thus, the number of meaningless attack vectors was quickly reduced, and the vulnerabilities of each node were properly reflected. In Lu et al. [
14], a graph neural network (GNN)-based attack graph ranking method was proposed, and the optimal route of the attack graph was measured through the suitability analysis of the GNN.
2.2. Common Vulnerability Scoring System
Starting with the Internet worm in November 1988, there has been increasing demand for computer accident response over time, and many accident response teams have provided their own security incident results, but the vulnerability analysis standards were different from one another, thus resulting in the problem that the standards for vulnerabilities became unclear. To solve this problem, the CVSS method was proposed.
CVSS is an open-source-based framework that can calculate vulnerability risk, and it performs risk assessment using items such as access route, complexity, authentication, confidentiality, integrity, availability, etc. The National Institute of Standards and Technology’s National Vulnerability Database (NVD) also provides relevant information. This has the advantage of providing a standard for measuring the vulnerability score, providing an open framework for evaluating the vulnerability score, and prioritizing and supporting vulnerabilities through vulnerability score evaluation. CVSS upgrades vulnerability evaluation items through continuous updates; in this method, three types of matrix information (base, temporal, and environmental) are calculated, and these are used to calculate a vulnerability value. This method is also useful for using the network vulnerability level or detailed values (CIA, access vector, complexity, authentication, etc.) as they are. A recent study improved the CVSS and suggested a more suitable formula for each network.
Yang et al. [
15] proposed a DBRank algorithm that calculated the vulnerability of a node by considering the gain and spread of the vulnerability according to the attacker’s characteristics. Spanos et al. [
16] proposed the Weighted Impact Vulnerability Scoring System (WIVSS) with improved CVSS, and in their method, the CIA weight was modified from the existing base matrix. They proposed new rule about CIA. For example, the weights were defined higher in the order of confidentiality, integrity, and availability, partial value was multiplied by 0.5 of complete value, and impact score range was defined from 0 to 7. Based on these rules, new confidence, integrity, availability values were proposed. In CVSS 2.0, when the CIA value were ‘None’, ‘partial’, and ‘complete’, their weights defined 0.0, 0.275, 0.660. And the weights in confidence, integrity, availability were all the same. But in this method, confidence was 0.0, 1.5, 3.0, integrity was 0.0, 1.2, 2.4 and availability was 0.1, 0.8, 1.6. Through this, more detailed vulnerability risk scores could be obtained.
Jacobs et al. [
17] proposed a system for predicting exploits using the information provided by NVD’s CVSS and MITER’s Common Vulnerabilities and Exposures (CVE), along with other information. The features used in that study were selected through three steps. First, all the available information was extracted from the collected data set, and then information having a share of less than 1% in the entire vulnerability database was removed. Then, meaningless information was removed through expert opinion. Gallon et al. [
18] applied CVSS to the attack graph to increase accuracy. The CVE identifier and the base, temporal, and environmental scores of CVSS were used. As such, rather than applying the existing CVSS as is, it was necessary to improve CVSS, and apply a method suitable for each network or attack graph. Gencer et al. [
19] proposed a method for determining a fuzzy-based vulnerability score using CVSS score. To define the relationship between the exact inputs and fuzzy multiple outputs, they used a fuzzy logistic regression (FLR). They also used the least squares method to estimate the parameters of the presented model. Ref. [
20] proposed a system utilizing a Markov chain and CVSS that identified and evaluated vulnerabilities that occur frequently on the Internet of Medical Things (IoMT). They analyzed representative vulnerabilities and weaknesses from IoMT, and they measured scores by defining CVSS information according to the IoMT network. Moreover, the probability for IoMT threats was calculated based on the Markov transition probability matrix. Ref. [
21] proposed a security system for detecting vulnerabilities that exist in the government’s website. They used vulnerability scanners to analyze vulnerabilities that existed on websites and measured CVSS scores for vulnerabilities. Through this method, they were able to identify what risks existed on the website and accordingly propose recommendations. Ref. [
22] proposed a method to reduce the CVSS matrix by using a decision tree (DT) and reduce the error of the resulting score. A group of 15 experts calculated a vulnerability assessment using the basic CVSS matrix and found that most vulnerabilities scored differently. Therefore, to reduce these errors, basic CVSS metrics were classified, and overlapping parts were removed through a correlation analysis between metrics. In addition, the score was calculated by constructing an attribute subset through a DT-based attribute selection. Ref. [
23] proposed a method of detecting vulnerabilities and determining priorities by analyzing the variables and the characteristics of the network environment. Various information was collected through open-source intelligence (OSINT), defined as global, IP, and vulnerability variables, and the risk was calculated using the CVSS based on the variables.
2.3. Vulnerability Correlation
Most vulnerability research has focused on vulnerability classification and the vulnerability analysis of security assets. However, by applying the attack graph to the network and comparing the vulnerabilities of each node, it has been confirmed that they are affected by the vulnerabilities of other nodes, rather than independent vulnerabilities [
24]. This correlation is mainly expressed as a matrix, and refs. [
25,
26,
27,
28] also studied how to advance this matrix. For example, in a specific network, if an attacker gains access by exploiting the vulnerability of one node, then in this state, the attacker continues to perform additional attacks using other weaknesses to reach the desired target node. This method shows that there is a correlation between vulnerabilities, and it can be confirmed that vulnerabilities are used as a precondition for attacking other vulnerability. Therefore, it is possible to obtain an optimized attack route or pattern in a vast network by analyzing and understanding the correlations between vulnerabilities.
Li et al. [
24] performed a network security analysis by creating a matrix showing CVE correlation information between two nodes. At that time, a vulnerability analysis graph (VCG) was defined to identify the vulnerability correlation, and the correlation was defined as one metric based on the precondition between the CVEs of the two nodes. Liang et al. [
29] proposed a method with which to evaluate a network security risk using VCG. They generated VCG, and the node in the graph included the attacked node IP, the name of the vulnerability, the permission obtained through the attack, and the security state at the edge. Nan et al. [
30] performed a vulnerability correlation analysis for a network situation analysis while using a correlation coefficient. Further, Debnath et al. [
31] proposed a CVSS-based vulnerability and risk assessment (HPCvul) to analyze and evaluate vulnerabilities in high-performance computing (HPC) networks. Standardization was performed to enable smooth sharing of data, and the possibility of an attack using vulnerabilities was identified using an attack graph. Static and dynamic risk assessments were conducted; the static risk assessments were used to explore known vulnerabilities in the network and evaluate the relationship between vulnerabilities to derive the possibility of successful exploitation, while the dynamic risk assessment was used to perform a real-time risk analysis.
Previous research has applied methods such as redefining CVSS scores for each environment [
20,
21,
23], collecting additional information for risk assessment [
15,
17,
23], applying CVSS weights [
16,
18], and combining them with other algorithms [
19,
22,
28,
29,
30], and an improved CVSS-based risk calculation method has accordingly been proposed. However, these methods are based on existing CVSS mechanisms, so they only evaluate the risk by calculating the scores of each vulnerability while not considering possible associations that could arise from vulnerabilities (PC, servers, users, etc.) in the network. Further, even in the case of analyzing the correlation, a graph-based analysis using VCG was the main focus. Therefore, this paper proposes a simple yet effective relationship analysis method between vulnerabilities to solve the previous research problem of only calculating individual vulnerability scores, and a method for calculating the risk of attack route as well as vulnerability scores.
3. Vulnerability Correlation and Attack Graph-Based Node-Edge Scoring System
In this paper, we propose VCAG-SS, a node-edge vulnerability correlation analysis method for attack graph-based optimized attack route detection. The nodes PCs, servers, users, and the like are included in the network, and node information includes IP, access location, and CVE information. Further, the edge refers to the relationship between the vulnerabilities of the nodes. For example, assuming that CVE
i and CVE
j vulnerabilities exist, CVE
i steals administrator information through an attack, and CVE
j performs an attack under the precondition that it has the authority of an administrator, then this indicates that CVE
i is an attack that must be carried out before CVE
j is performed. Therefore, the vulnerability correlation analysis identifies the relationship between the vulnerabilities existing between the two nodes. The information collected in this way calculates the individual risk of nodes and edges through the VCAG-SS, and the overall risk score for the attack route is calculated by adding the node risk score and the edge risk score of the attack route. For the node risk, the CVSS score is used, and for the edge risk, the access location, attack type, CIA, and correlation are used. The proposed method calculates the edge weight using the correlation index between vulnerabilities and the CIA values for each access location, attack target, and vulnerability; through this, the node-edge value that provides the optimal route at the minimum cost is identified. The proposed method can be expressed as:
Based on the node risk, edge risk, and number of routes, the attack priority risk is calculated for the corresponding route. The node risk is determined as in Equation (2), and the CVSS score of the vulnerability occurring in the node is used. The edge risk is as expressed in Equation (3), and the evaluation is performed with the access method of the two nodes, the type of attack performed on each node, the CIA, and the correlation between the two nodes.
Equations (4)–(6) are the methods used to obtain each item of the edge risk, where
is the access location,
is the target of attack,
is the CIA value for each vulnerability, and
is the correlation index between vulnerabilities.
,
,
, and
, respectively, refer to the weights according to the access location, attack target, CIA value for each vulnerability, and the correlation index between vulnerabilities, which are arbitrarily calculated by the user according to the relative importance of the four values. The
AL values are calculated according to the proposed method with the access methods (network, local, etc.) of two nodes. To determine which attack method was used in the attack type, the CIA used the CVSS-based CIA of the vulnerability. The vulnerability correlation index can be used by experts to evaluate the correlation between possible vulnerabilities in the two nodes.
3.1. Access Location
The access location is one of the important factors to determine the vulnerability of hosts and servers, and it can be divided into external and internal access. External access refers to direct access to the host or server from the external network, without going through a host or server in another internal network, and an attacker can perform various attacks through the external network. Representative attack methods include DDos, hijacking, drive-by, password, and phishing attacks. Conversely, internal access means that the host or server can only be accessed through another internal host or server. As such, external access can only be exposed to a larger variety of attacks than internal access, so there are much more vulnerabilities in external access.
The access location can be largely divided into external and internal, and in detail, it can be divided into network, adjacent network, local, and physical. “Network” means that “the node (host, server, etc.) can be accessed from all external networks”; “adjacent network” means “the node can only be accessed from the adjacent external network”; “local” means “the node can be accessed only from the internal network”; and “physical” means “the node can only be accessed by a physical method”. The access location was defined based on the attack vector (access vector) provided by the CVSS, and it was proposed to be applicable according to the CVSS version as presented in
Table 1.
We calculated the edge weights based on the association between the two nodes; the access location weights defined in
Table 1 are defined for the two nodes and the edge weights in
Table 2 are defined according to Equation (4).
3.2. Attack Type
The attack type was defined based on the thirteen vulnerabilities that were defined in [
32] and the relative vulnerability occurrence rate according to Equation (5).
means the total number of occurrences of each vulnerability provided, and the number of
is the number of occurrences of a specific vulnerability in the previous year. Through this, the relative weight of each type of vulnerability can be obtained.
is the weight given to the attack target, and we used a
value of 2. The 13 attack targets are DoS, Code Execution, Overflow, Memory Corruption, Sql Injection, XSS, Directory Traversal, Http Response Splitting, Bypass something, Gain Information, Gain Privileges, CSRF, and File Inclusion. For example, if there were vulnerabilities that occurred in 2021 and the number of occurrences was as presented in
Table 3, it could be calculated as (1836/14,318) = 0.1287 in the case of DoS, and as (1680/14,318) = 0.1173 in the case of overflow.
3.3. CIA Impact by Vulnerability
The CIA impact for each vulnerability used the CIA impact of the base metric used in the formula proposed in the CVSS [
33]. CIA refers to confidentiality, integrity, and availability. The corresponding values used the CIA impact value provided by each version of CVSS, and
Table 4 presents those values. Moreover, suitable weights can be used depending on the CVSS version. In CIA, the values for each type of C, I, and A are the same for each version.
3.4. Correlation Index between Vulnerabilities
We generated a matrix based on the prerequisites between the CVE of the two nodes. A correlation between nodes can help identify what kind of relationship there is. At that time, information such as the presence or absence of pre and post conditions, similar attack methods, and conflicting attack methods was identified. Through this, the correlation index between vulnerabilities was generated, and the method was as follows:
In the proposed correlation index method (
c), the vulnerabilities belonging to the two nodes (
i,
j) are identified, and the prerequisite relationship is identified accordingly. If the vulnerability in
is a prerequisite or an attack that occurs in advance to the vulnerability in
, then the matrix is defined as a value of 1; in the opposite case, it is defined as a value of 0. This is also determined when the two nodes are opposite to each other. That is, all the preconditions between the two nodes are grasped (
↔
). The preconditions of the two nodes analyzed in this way can be expressed in the manner listed in
Table 5, and the weights for each situation are defined and used in the previously defined arsRank.
4. Experiment
In this section, an experiment is conducted using a network established by obtaining the opinions of experts and data generated with vulnerabilities. It evaluates the risk of each node and edge present in the network, defines six possible attack routes, and calculates the risk of each route.
4.1. Data Set
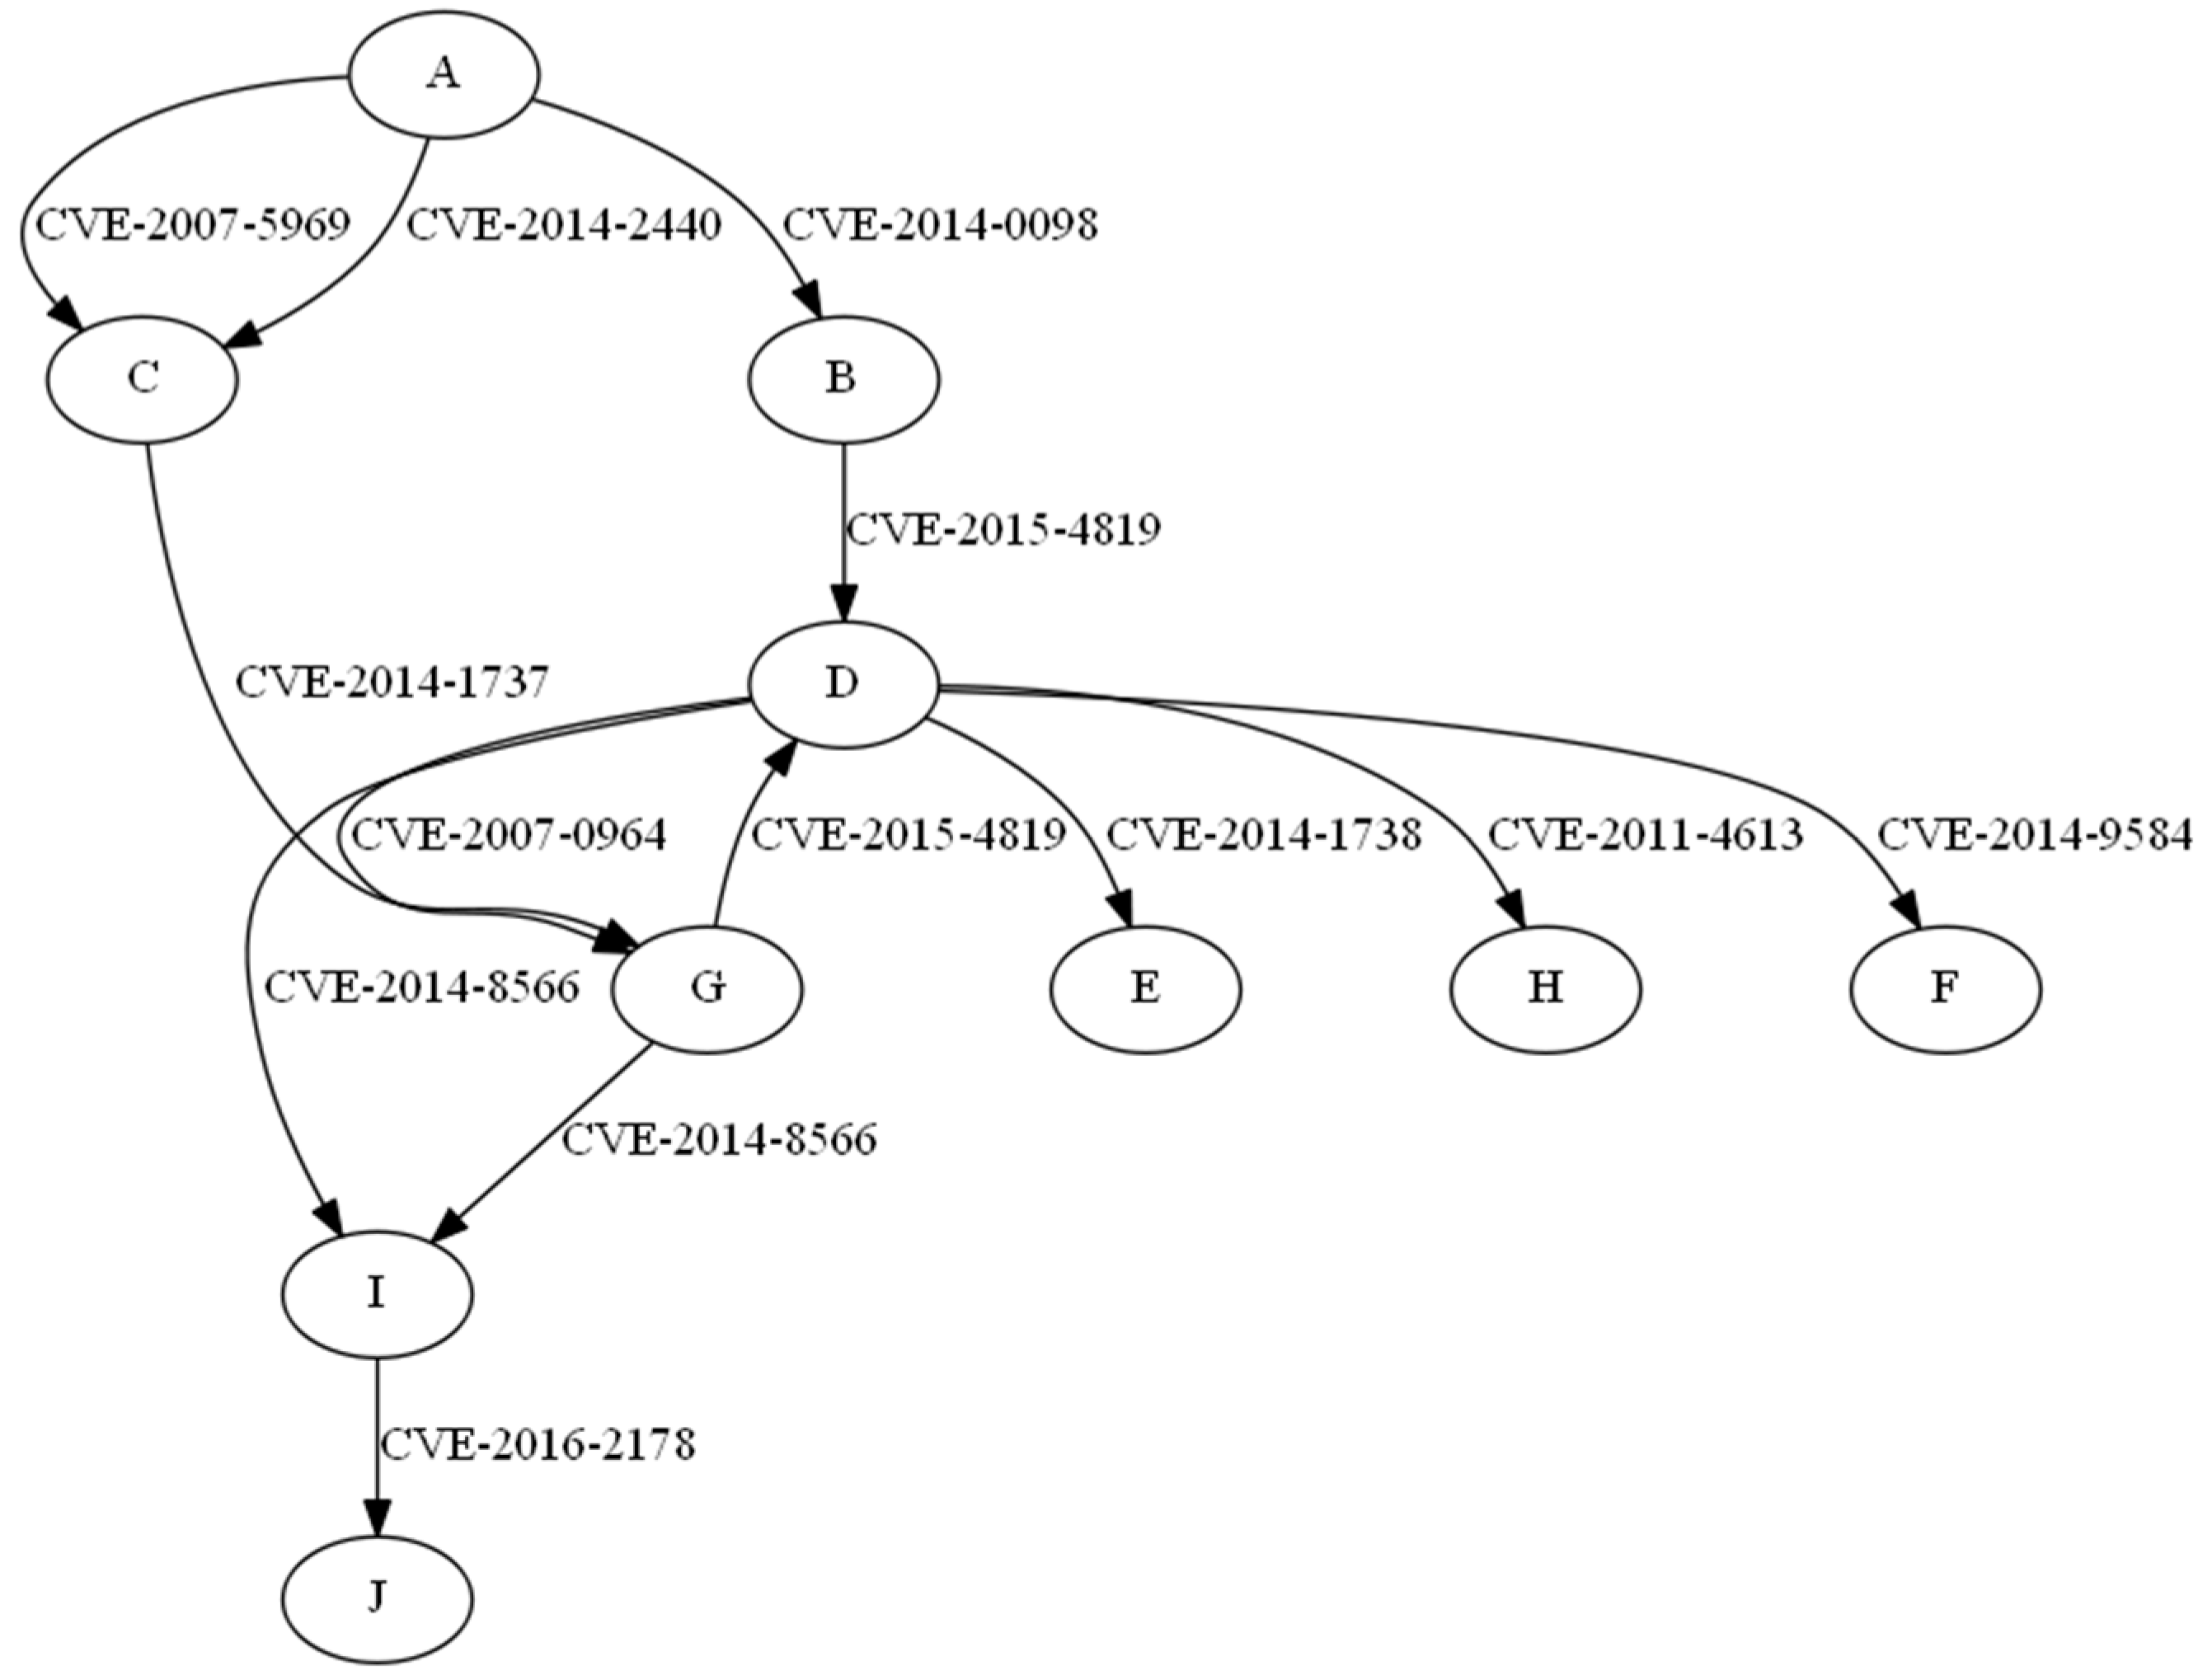
In this paper, we defined the network and detailed information (vulnerability, port, address, etc.) according to each node. In particular, the network and its vulnerabilities were established with the advice of a group of experts. The network built using this method is illustrated in
Figure 1, and the attacker started the attack through node A and aimed to reach node J, the final target. Each node contained vulnerabilities for an attacker to perform an attack, and there were nine nodes (PC and server), with 11 vulnerabilities defined.
4.2. Priority Evaluation According to Attack Route
First, the attack priority was calculated through a method that suggested the risk of each node and edge.
Table 6 lists the result of calculating the risk for each node, and
Table 7 presents the result of calculating the risk for each edge. C
1 and C
2 denotes CVE-2007-5969, CVE-2014-2440. All values related to CVSS were calculated based on version 2.0. The node risk was calculated using the CVSS basic score of the vulnerabilities of each node (PC, server, etc.), and the edge risk was calculated by applying the risk calculation method suggested in
Section 3. Regarding the weight of each item of edge risk, the attack location, attack type, and node association were judged to be more important than the CIA, and the weight was calculated while reflecting this.
For the node risk, the experimental results confirmed that nodes with vulnerabilities with relatively high CVSS scores showed higher values. It was confirmed that nodes with various vulnerabilities scored higher than attacks that could penetrate through a single vulnerability, such as nodes C, G, and I, and that nodes that could attack with various nodes such as nodes D and G also scored higher. In terms of the edge risk, it was confirmed that the nodes (attack locations) that can be accessed from outside rather than inside and the attack types that occurred more frequently as of 2021 showed relatively higher risks. As a result of comparing D-G and G-D edge analysis, it was confirmed that the edge risk differed depending on the correlation between each vulnerability, and that even when connected to various nodes such as node D, different risk scores were calculated depending on how the vulnerability of each node was related to the vulnerability of node D. Further, in the case of A-C, it was confirmed that the vulnerabilities used to attack the two nodes and the corresponding correlation showed different edge risks, although they were the same nodes. Next, the risk for each attack route was calculated based on the calculated node and edge risk;
Table 8 lists the attack route used in this experiment.
Table 9 lists the results, and the attack route risk was calculated with 10 as the maximum. In the attack path
route risk calculation, along with the risks of nodes and edges, the path route that was calculated based on the total number of nodes passed to reach the final target, node J, is also included. path
route is a value obtained by dividing the maximum number of routes to reach the final goal by the number of corresponding attack routes. The longer the path
route, the lower the value. There were six routes in total, and the nodes and the edges used according to each route were as follows.
It was confirmed that the risk of the fourth attack route was the highest, and it was confirmed that the risk increased that much because the path was connected to the most nodes, and passed through D nodes with various attack methods. Further, the vulnerability score for Path 3 was higher than those for Paths 1 and 5, which had the same number of paths. It was confirmed that the access method (access location) of the nodes was from the outside, and it was an attack type that was used relatively more frequently than the attack type used in other routes. It was also confirmed that attack routes containing routes with a high edge risk had a relatively high attack route risk scores than the other routes. We compared the proposed method with the method used in previous research. Since most previous research works do not provide open network data and the information used is different from each other, we compared research works that improved the value of CVSS. As presented in
Table 10, the priority for attack routes is the same as a result of comparing the proposed method with existing methods, and there is only a deviation in the degree of risk for each route.
5. Conclusions
In this paper, we proposed a method for defining node and edge values based on the information of the network, accordingly calculating the risk of each node and edge, and calculating the risk of a specific attack path through this. In previous research, the information contained in the node was used preferentially; in particular, the vulnerability scores provided by CVSS were used. However, in this study, we aimed to solve the problems associated with previous studies by proposing a method to calculate edge risk along with these values. A formula for calculating edge risk score was defined; access location, attack type, CIA, and correlation were calculated; and we attempted to use correlation to calculate more accurate risk scores through a vulnerability correlation analysis of two nodes. In the process of calculating the edge risk score, by analyzing the link between the two nodes, it was possible to determine which node was more dangerous when moving from one node to the next. This method also helped reduce the error of the risk generated by calculating the risk using only the CVSS information held by previous research. For the experiment, a network was built, an attack route was defined, and the risk level for each attack route was finally calculated. As a result of the experiment, the risks for 12 nodes and 13 edges were calculated, and through this, the risk score increased as the number of vulnerabilities increased or the number of nodes that could go through the node increased. In the edge risk score, it was confirmed that the risk was calculated differently depending on the prerequisites required for the vulnerability even if the two nodes were the same, and even if the two edges started from the same node, the risk varied depending on which vulnerability the arrival node had. Moreover, we calculated the risk score for six attack routes, and it was confirmed that the higher the risk calculated through nodes and edges, the higher the risk, which depended on the correlation between the states of the nodes included in the attack path and the vulnerability. In addition, we confirmed the number of paths according to the attack route, and we confirmed that the states of the nodes and edges included in it was more important than the number of paths. Unlike previous research, this paper proposed a method of measuring risk score by defining an edge rather than improving its own values of the CVSS. This made it possible to calculate a simple and effective attack route risk score. However, since the values of CVSS 2.0 were used as is, the values were old, and an association analysis between nodes was performed, but the pre and post conditions of vulnerabilities were judged through experts, so a more accurate analysis should be conducted. Therefore, in future research, we will propose a more sophisticated risk calculation method by constructing a more complex network data set, calculating the risk along the attack path, and upgrading the node risk and edge risk. Further, since the number of paths to go through increases as the network becomes larger, we will also study how to effectively apply the number of paths to the attack vector risk.
Author Contributions
Conceptualization, S.-S.H.; methodology, G.-Y.S.; software, G.-Y.S.; validation, J.-S.L. and H.-R.O.; formal analysis, I.-S.H.; investigation, H.-R.O.; resources, I.-S.H.; data curation, H.-K.K.; writing—original draft preparation, G.-Y.S.; writing—review and editing, S.-S.H.; supervision, J.-S.L.; project administration, H.-R.O.; funding acquisition, H.-R.O. All authors have read and agreed to the published version of the manuscript.
Funding
This work was funded by the Defense Acquisition Program Administration and Agency for Defense Development under the contract cybercenter-MIS-997(21.10.15).
Institutional Review Board Statement
Not applicable.
Informed Consent Statement
Not applicable.
Data Availability Statement
Not applicable.
Conflicts of Interest
The authors declare no conflict of interest.
References
- Strickland, E. AI agents play hide-and-seek: An OpenAI project demonstrated “emergent behavior” by AI players-[News]. IEEE Spectr. 2019, 56, 6–7. [Google Scholar] [CrossRef]
- Pridmore, L.; Lardieri, P.; Hollister, R. National Cyber Range (NCR) automated test tools: Implications and application to network-centric support tools. In Proceedings of the 2010 IEEE AUTOTESTCON, Orlando, FL, USA, 13 September 2010; pp. 1–4. [Google Scholar] [CrossRef]
- Yamin, M.M.; Katt, B.; Gkioulos, V. Cyber ranges and security testbeds: Scenarios, functions, tools and architecture. Comput. Secur. 2020, 88, 101636. [Google Scholar] [CrossRef]
- Jha, S.; Sheyner, O.; Wing, J. Two formal analyses of attack graphs. In Proceedings of the 15th IEEE Computer Security Foundations Workshop, Washington, DC, USA, 24 June 2002; pp. 49–63. [Google Scholar]
- Jajodia, S.; Noel, S.; O’Berry, B. Topological Analysis of Network Attack Vulnerability. In Managing Cyber Threats; Springer: Boston, MA, USA, 2005; pp. 247–266. [Google Scholar] [CrossRef]
- Ingols, K.; Lippmann, R.; Piwowarski, K. Practical attack graph generation for network defense. In Proceedings of the 2006 22nd Annual Computer Security Applications Conference (ACSAC’06), Miami Beach, FL, USA, 11 December 2006; pp. 121–130. [Google Scholar]
- Ammann, P.; Wijesekera, D.; Kaushik, S. Scalable, graph-based network vulnerability analysis. In Proceedings of the 9th ACM Conference on Computer and Communications Security, Washington, DC, USA, 18 November 2002; pp. 217–224. [Google Scholar]
- Wang, L.; Noel, S.; Jajodia, S. Minimum-cost network hardening using attack graphs. Comput. Commun. 2006, 29, 3812–3824. [Google Scholar] [CrossRef]
- Sheyner, O.; Wing, J. Tools for generating and analyzing attack graphs. In International Symposium on Formal Methods for Components and Objects; Springer: Berlin/Heidelberg, Germany, November 2003; pp. 344–371. [Google Scholar]
- Walter, E.; Ferguson-Walter, K.; Ridley, A. Incorporating Deception into CyberBattleSim for Autonomous Defense. arXiv 2021, arXiv:2108.13980. [Google Scholar]
- Hammar, K.; Stadler, R. Finding Effective Security Strategies through Reinforcement Learning and Self-Play. In Proceedings of the 2020 16th International Conference on Network and Service Management (CNSM), Izmir, Turkey, 2–6 November 2020; pp. 1–9. [Google Scholar] [CrossRef]
- Yoon, S.; Cho, J.-H.; Kim, D.S.; Moore, T.J.; Free-Nelson, F.; Lim, H. Attack Graph-Based Moving Target Defense in Software-Defined Networks. IEEE Trans. Netw. Serv. Manag. 2020, 17, 1653–1668. [Google Scholar] [CrossRef]
- Gonda, T.; Pascal, T.; Puzis, R.; Shani, G.; Shapira, B. Analysis of Attack Graph Representations for Ranking Vulnerability Fixes. In Proceedings of the Global Conference on Artificial Intelligence, Luxembourg, 17–19 September 2018; pp. 215–228. [Google Scholar] [CrossRef] [Green Version]
- Lu, L.; Safavi-Naini, R.; Hagenbuchner, M.; Susilo, W.; Horton, J.; Yong, S.L.; Tsoi, A.C. Ranking attack graphs with graph neural networks. In Proceedings of the International Conference on Information Security Practice and Experience, Xi’an, China, 13–15 April 2009; pp. 345–359. [Google Scholar]
- Yang, X.; Shunhong, S.; Yuliang, L. Vulnerability ranking based on exploitation and defense graph. In Proceedings of the 2010 International Conference on Information, Networking and Automation (ICINA), Kunming, China, 17–19 October 2010; pp. V1-163–V1-167. [Google Scholar] [CrossRef]
- Spanos, G.; Sioziou, A.; Angelis, L. WIVSS: A new methodology for scoring information systems vulnerabilities. In Proceedings of the 17th Panhellenic Conference on Informatics, Thessaloniki, Greece, 19–21 September 2013; pp. 83–90. [Google Scholar]
- Jacobs, J.; Romanosky, S.; Edwards, B.; Adjerid, I.; Roytman, M. Exploit Prediction Scoring System (EPSS). Digit. Threat. Res. Pract. 2021, 2, 1–17. [Google Scholar] [CrossRef]
- Gallon, L.; Bascou, J.J. Using CVSS in attack graphs. In Proceedings of the 2011 Sixth International Conference on Availability, Reliability and Security, Vienna, Austria, 22–26 August 2011; pp. 59–66. [Google Scholar]
- Gencer, K.; Başçiftçi, F. The fuzzy common vulnerability scoring system (F-CVSS) based on a least squares approach with fuzzy logistic regression. Egypt. Inform. J. 2020, 22, 145–153. [Google Scholar] [CrossRef]
- Allouzi, M.A.; Khan, J.I. Identifying and modeling security threats for IoMT edge network using Markov chain and common vulnerability scoring system (CVSS). arXiv 2021, arXiv:2104.11580. [Google Scholar]
- Putra, F.G.; Soewito, B. Measurement of Security System Performance on Websites of Personnel Information Systems in Government Using Common Vulnerability Scoring System. J. Pendidik. Tambusai 2022, 6, 2949–2957. [Google Scholar]
- Kai, S.; Zheng, J.; Shi, F.; Lu, Z. A CVSS-based Vulnerability Assessment Method for Reducing Scoring Error. In Proceedings of the 2021, 2nd International Conference on Electronics, Communications and Information Technology (CECIT), Sanya, China, 27–29 December 2021; pp. 25–32. [Google Scholar] [CrossRef]
- Reyes, J.; Fuertes, W.; Arévalo, P.; Macas, M. An Environment-Specific Prioritization Model for Information-Security Vulnerabilities Based on Risk Factor Analysis. Electronics 2022, 11, 1334. [Google Scholar] [CrossRef]
- Li, Z.-Y.; Xie, C.-H.; Tao, R.; Zhang, H.; Shi, N. A Network Security Analysis Method Using Vulnerability Correlation. In Proceedings of the 2009 Fifth International Conference on Natural Computation, Tianjian, China, 14–16 August 2009; pp. 17–21. [Google Scholar] [CrossRef]
- Ali, M.U.; Aydi, H.; Batool, A.; Parvaneh, V.; Saleem, N. Single and Multivalued Maps on Parametric Metric Spaces Endowed with an Equivalence Relation. Adv. Math. Phys. 2022, 2022, 6188108. [Google Scholar] [CrossRef]
- Zhou, M.; Saleem, N.; Liu, X.-L.; Özgür, N. On two new contractions and discontinuity on fixed points. AIMS Math. 2022, 7, 1628–1663. [Google Scholar] [CrossRef]
- Saleem, N.; Zhou, M.; Bashir, S.; Husnine, S.M. Some new generalizations of F-contraction type mappings that weaken certain conditions on Caputo fractional type differential equations. AIMS Math. 2021, 6, 12718–12742. [Google Scholar] [CrossRef]
- Kalsoom, A.; Saleem, N.; Işık, H.; Al-Shami, T.M.; Bibi, A.; Khan, H. Fixed Point Approximation of Monotone Nonexpansive Mappings in Hyperbolic Spaces. J. Funct. Spaces 2021, 2021, 3243020. [Google Scholar] [CrossRef]
- Liang, L.; Yang, J.; Liu, G.; Zhu, G.; Yang, Y. Novel method of assessing network security risks based on vulnerability correlation graph. In Proceedings of the 2012 2nd International Conference on Computer Science and Network Technology, Changchun, China, 29–31 December 2012; pp. 1085–1090. [Google Scholar]
- Nan, X.; Chen, R.; Tian, H.; Liu, Y. Network Situation Risk Assessment Based on Vulnerability Correlation Analysis. In Proceedings of the 2021 IEEE International Conference on Progress in Informatics and Computing (PIC), Shanghai, China, 17–19 December 2021; pp. 330–334. [Google Scholar]
- Debnath, J.K.; Xie, D. CVSS-based Vulnerability and Risk Assessment for High Performance Computing Networks. In Proceedings of the 2022 IEEE International Systems Conference (SysCon), Montreal, QC, Canada, 25 April–23 May 2022; pp. 1–8. [Google Scholar] [CrossRef]
- CVE Detail. Available online: https://www.cvedetails.com/vulnerabilities-by-types.php (accessed on 30 May 2022).
- FiRst. Available online: https://www.first.org/cvss/ (accessed on 30 May 2022).
| Publisher’s Note: MDPI stays neutral with regard to jurisdictional claims in published maps and institutional affiliations. |
© 2022 by the authors. Licensee MDPI, Basel, Switzerland. This article is an open access article distributed under the terms and conditions of the Creative Commons Attribution (CC BY) license (https://creativecommons.org/licenses/by/4.0/).


