Article

Detecting Atypical Values and Their Influence on Blast-Induced Seismic Measurement Results

by
Siniša Stanković
*,
Mateja Katalinić
,
Dalibor Kuhinek
and
Vječislav Bohanek
Faculty of Mining, Geology and Petroleum Engineering, University of Zagreb, 10000 Zagreb, Croatia
*
Author to whom correspondence should be addressed.
Appl. Sci. 2022, 12(12), 5820; https://doi.org/10.3390/app12125820
Submission received: 2 May 2022 / Revised: 1 June 2022 / Accepted: 6 June 2022 / Published: 8 June 2022

Abstract

:
Blasting is an essential part of any mining or civil engineering project along with all the benefits that it brings, such as cost and time effectiveness, and safety. Still, there are a few downsides to blasting. Ground oscillation velocity as the most significant impact of blasting has been studied broadly. However, not all measured values should be used for PPV (peak particle velocity) predictor or model development. If a false measured value is included in the model or predictor development, it will provide erroneous results that can lead to the damage of the surrounding structures or an increase in the cost of blasting works. There is no clearly defined procedure for separating atypical values (outliers) within blast-induced seismic-effects measurement data. This paper recommends how to properly validate vibration velocity data by detecting and excluding atypical values and how it influences blast-induced seismic measurement results.

1. Introduction

Blasting is used as an efficient and cost-effective means for rock excavation in construction, geotechnical, and mining projects. Contrariwise, several negative effects occur involving the surrounding environment, including blast-induced seismic effect, fly rock, and air blast, with seismic effect as the most important one [1]. Hence, controlling the negative effects is essential to conform with the existing regulations and laws.
The main concern for contractors and owners is the realization of a project including blasting works without risking the safety of the surrounding buildings [2].
There are three steps in blast-induced seismic effects on structures: ground motion estimation, analysis, and establishing permissible PPV (peak particle velocity) limits [3].
Nowadays, in the wake of technological advancements, only the methodology to obtain results varies.
Several researchers have investigated the problem of ground vibration prediction and proposed various equations that were recently summarized [4].
Various authors have published research that provides site-specific equations. Ozer described different equations for different areas and geological conditions within the “Istanbul, Kadikoy–Kartal Railway Mass Transport System” project [5]. ISEE presented an equation for the 95% line equation for standard data from quarry blasting [6]. A similar 95%-line equation has been given by Ak et al. to measure PPV during magnesite-mine-blasting works [7]. Nicholson produced a prediction equation derived from the Bengal Quarry blasting [8]. In the thesis “Blast vibration studies in surface mines”, Badal proposed a PPV equation for the “Jindal Power Open Cast Coal Mine” [9]. Mesec founded his research on numerous test sites in sediments with different Geological Strength Index (GSI) values [10].
The attenuation law of dominant frequency has also been researched [11] as well as damage characteristics of a rock mass [12] and crack propagation behavior [13,14]. Agrawal modified the scaled distance using the superimposition factor of vibration waves [15].
Nowadays, most of the published articles on the subject of blast-induced seismic effects are founded on a significant quantity of measurement data compiled during the particular project or quarry development and analyzed through statistical methodology or ANN (Artificial Neural Network) [16,17]. Substantial amounts of open-pit blasting works measurements can be compiled to obtain an attenuation curve. Civil works generally lack this type of measurement data; therefore, the assessment of the first test blast is vital for acquiring an adequate amount of data for the safe execution of blasting works [18]. The uncertainty in measurements has been researched in relation to the horizontal orientation of the triaxial geophone and coupling method [19]. There are guidelines in which the requirements for measuring instruments (seismographs) and the method for installation during measurement are described [20]. However, not all measurement data are eligible for calculations. Errors during measurement should be avoided as much as possible [19]. In many different fields, methods for the detection of atypical values have already been accepted [21,22,23]. Different fields use different confidence intervals for atypical value detection [24]. In blasting, confidence intervals are used to provide the certainty of the calculated PPV (peak particle velocity) prediction results. However, there is no reference to any kind of atypical value detection in blast-induced seismic measurement data.
The test blast measurements used in this paper are performed for several parallel studies. First, we analyze the benefit of using a larger number of instruments in one measurement line [25], followed by measurement instruments positioned at distances that are of relevance; thus, the data is not extrapolated, because results achieved using extrapolation are at least questionable, if not erroneous [26]. This study is concerned with errors in the measurement data and how to detect them. There are three types of errors: gross, systematic, and random. Gross errors mainly cover human mistakes in reading instruments and recording and calculating measurement results. Systematic errors can be instrumental, environmental, and observational. Random errors are caused by happenings or disturbances about which we are unaware. Studied errors fall under the random errors category, which unfortunately cannot be prevented. Therefore, this research recommends how to detect and exclude atypical values (outliers) and clarifies what influence they have on blast-induced seismic measurement results.
The paper is divided in two parts. The first part and the main hypothesis include finding the optimal tool to detect atypical values in blast-induced seismic measurement data. The second part is the verification of results through the blast-induced analysis software “Blastware” from Instantel, Ottawa, ON, Canada.

2. Materials and Methods

To find the optimal tool to detect atypical values in blast-induced measurement data, 17 trial blasts with the same conditions were performed. The blasts were executed in a test site, a foraminiferal limestone deposit quarry near the city of Zadar, Croatia. The quarry fracture system is quite dense, with the majority of fractions resulting from the tectonic activity during and after the folding [27].
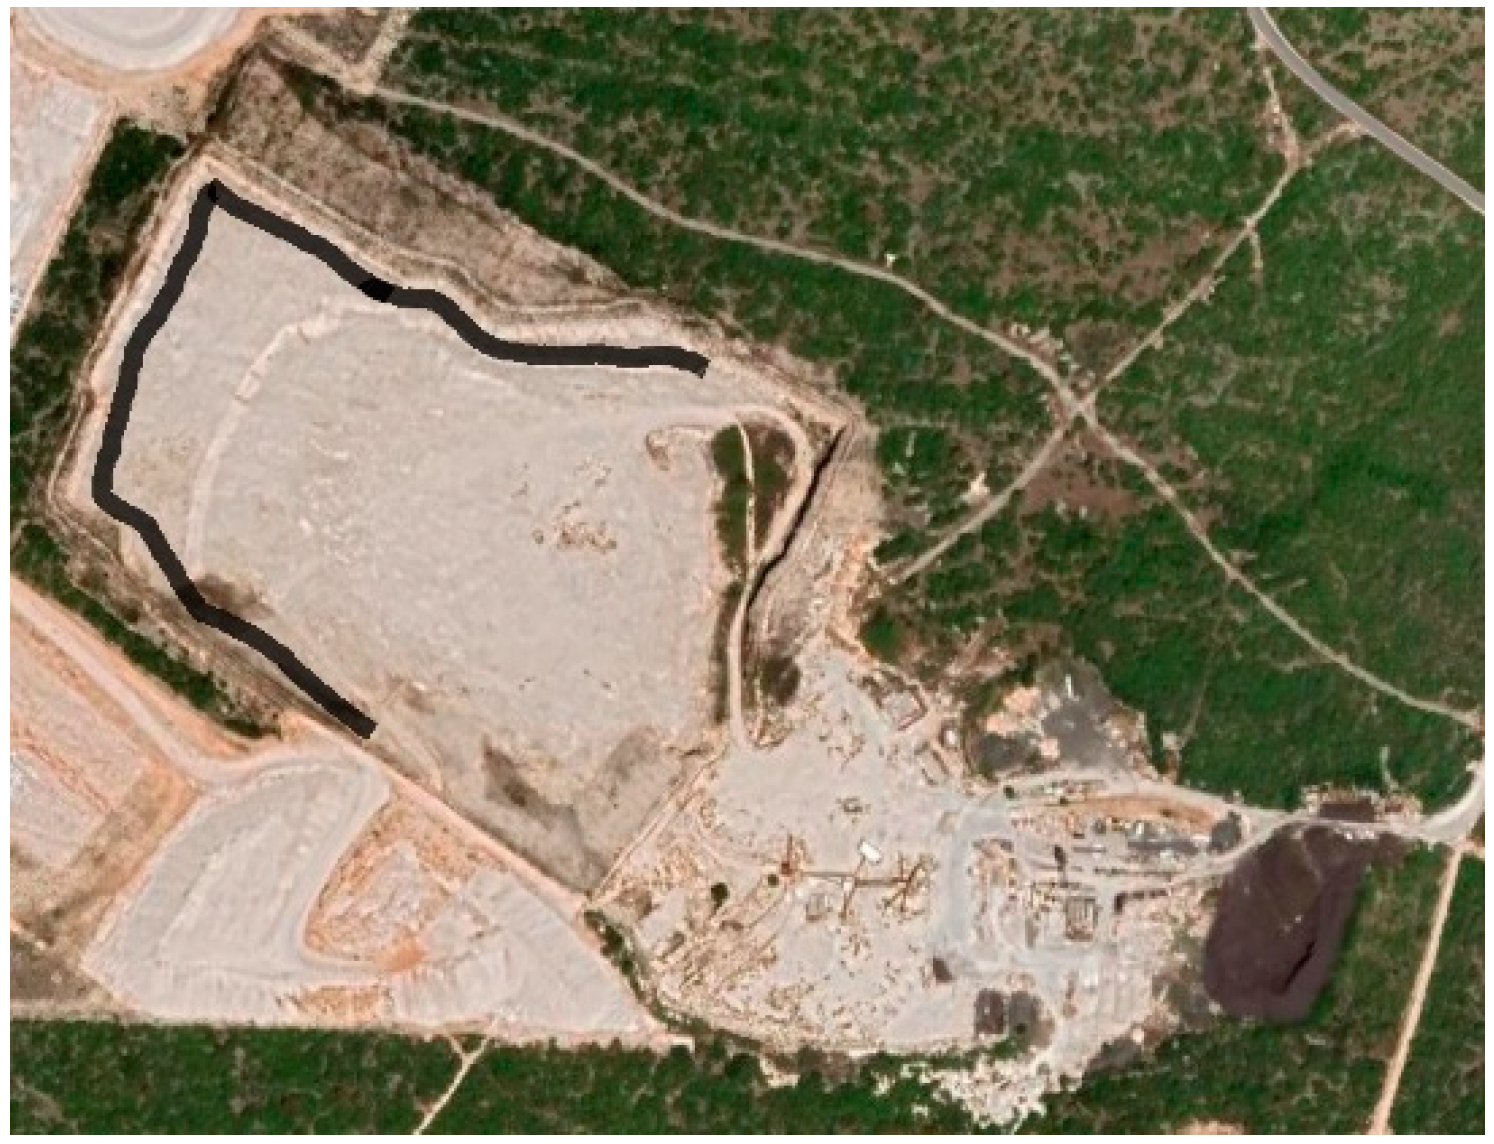
Test blasts were performed in different locations at the test site (Figure 1), with different directions of measurement lines and micro geology conditions, in order to test the theory on a variety of conditions.
Even within the same site, PPV estimation can be quite different in different locations/directions [28].
Test blasts were performed with a constant quantity of explosives and as confined, to reduce the number of dependable variables. All blastholes were charged with a single cartridge of the explosive “ELEXIT-2”, drilled 3 m deep and with a drilling diameter of 89 mm, since it is well known that, the diameter of the blasthole affects the blast-induced ground oscillation velocity [29]. To avoid the influence of free surface on the blasting results [30], all blastholes were confined. Topographic factors were nullified by performing the blasts on the same bench, i.e., at the same height above sea level. The technical specifications of the used explosive were: water resistant gelatinous dynamite, length of 590 mm, diameter of 65 mm, total quantity of 2.778 kg (weight of one cartridge), explosive density of 1400 kg/m3, and VoD of 5500 m/s [31]. Regardless of using a single cartridge of the same explosive for all blasts, the calculations were performed with a scaled distance rather than with distance itself, so that the final solution can be used with different types and quantities of the explosive.
The large number of measurement instruments were positioned in a single line at a predefined distance from the blast (up to 8 instruments). A larger number of instruments was required due to the impossibility of the Instantel software “Blastware” to calculate the regression line with a 95%-line equation with less than 4 measurement points.
The measurement data of seismic effects for all 17 boreholes include the distance of the measurement instruments from blasting zone, the PPV for each spatial component (longitudinal, transversal, and vertical), and peak vector sum (PVS) (Table 1).
The general form of the regression curve equation attained from the measurements during blasting works [32] is as follows:
P P V = H ( S D ) β
where SD is the scaled distance (m/kg1/2), H is coefficient in the blast design, and β is the attenuation coefficient. Both coefficients are determined by test blasts.
The scaled distance (2) is required to determine the peak particle velocity when both charge weight per delay W (kg) and distance R (m) vary [3].
S D = R W
It should be noted that the comparison of the effect of the detonation properties of the different explosives on blast-induced ground oscillation velocity, i.e., peak particle velocity, can be achieved through the equivalent weight approach. This approach consists of comparing the effects of the output of a given explosive to that of the reference explosive (usually TNT) [33]. Most recently, an equivalent TNT weight links the weight of a given explosive to the equivalent weight of TNT using the ratio of their detonation heats [34]:
W e = W e x p H e x p d H T N T d
where We (kg) is the TNT equivalent weight, Wexp (kg) is the weight of the actual explosive, H e x p d (MJ/kg) is the heat of the detonation of the actual explosive, and H T N T d (MJ/kg) is the heat of the detonation of the TNT.
In addition to detonation heat, some authors suggest the use of detonation velocity, detonation pressure, or detonation energy to estimate TNT equivalent mass [33,35]. The TNT equivalence can be determined experimentally by various types of experiments (e.g., Trauzl test, plate dent, ballistic mortar, and air blasts tests) or can be estimated by thermochemical equilibrium codes [36].
Given that commercial explosives are highly non-ideal, the estimation of TNT equivalence is not a trivial task. It must take into account the effects of the confinement and size of explosive charge on detonation properties.
The theoretical estimation of the detonation parameters of commercial explosives applying the Wood–Kirkwood detonation theory coupled with thermochemical code EXPLO5 [37] is the subject of another ongoing research that we are undertaking, which should contribute to a more reliable estimation of the detonation parameters of commercial explosives, and consequently the equivalent weights of commercial explosives needed by Equation (2) in the case of different explosives being used.
Since, for this research, only one type of explosive (ELEXIT-2) was utilized, the weight of explosive used in Equation (2) is the actual weight of the explosive charge (cartridge).
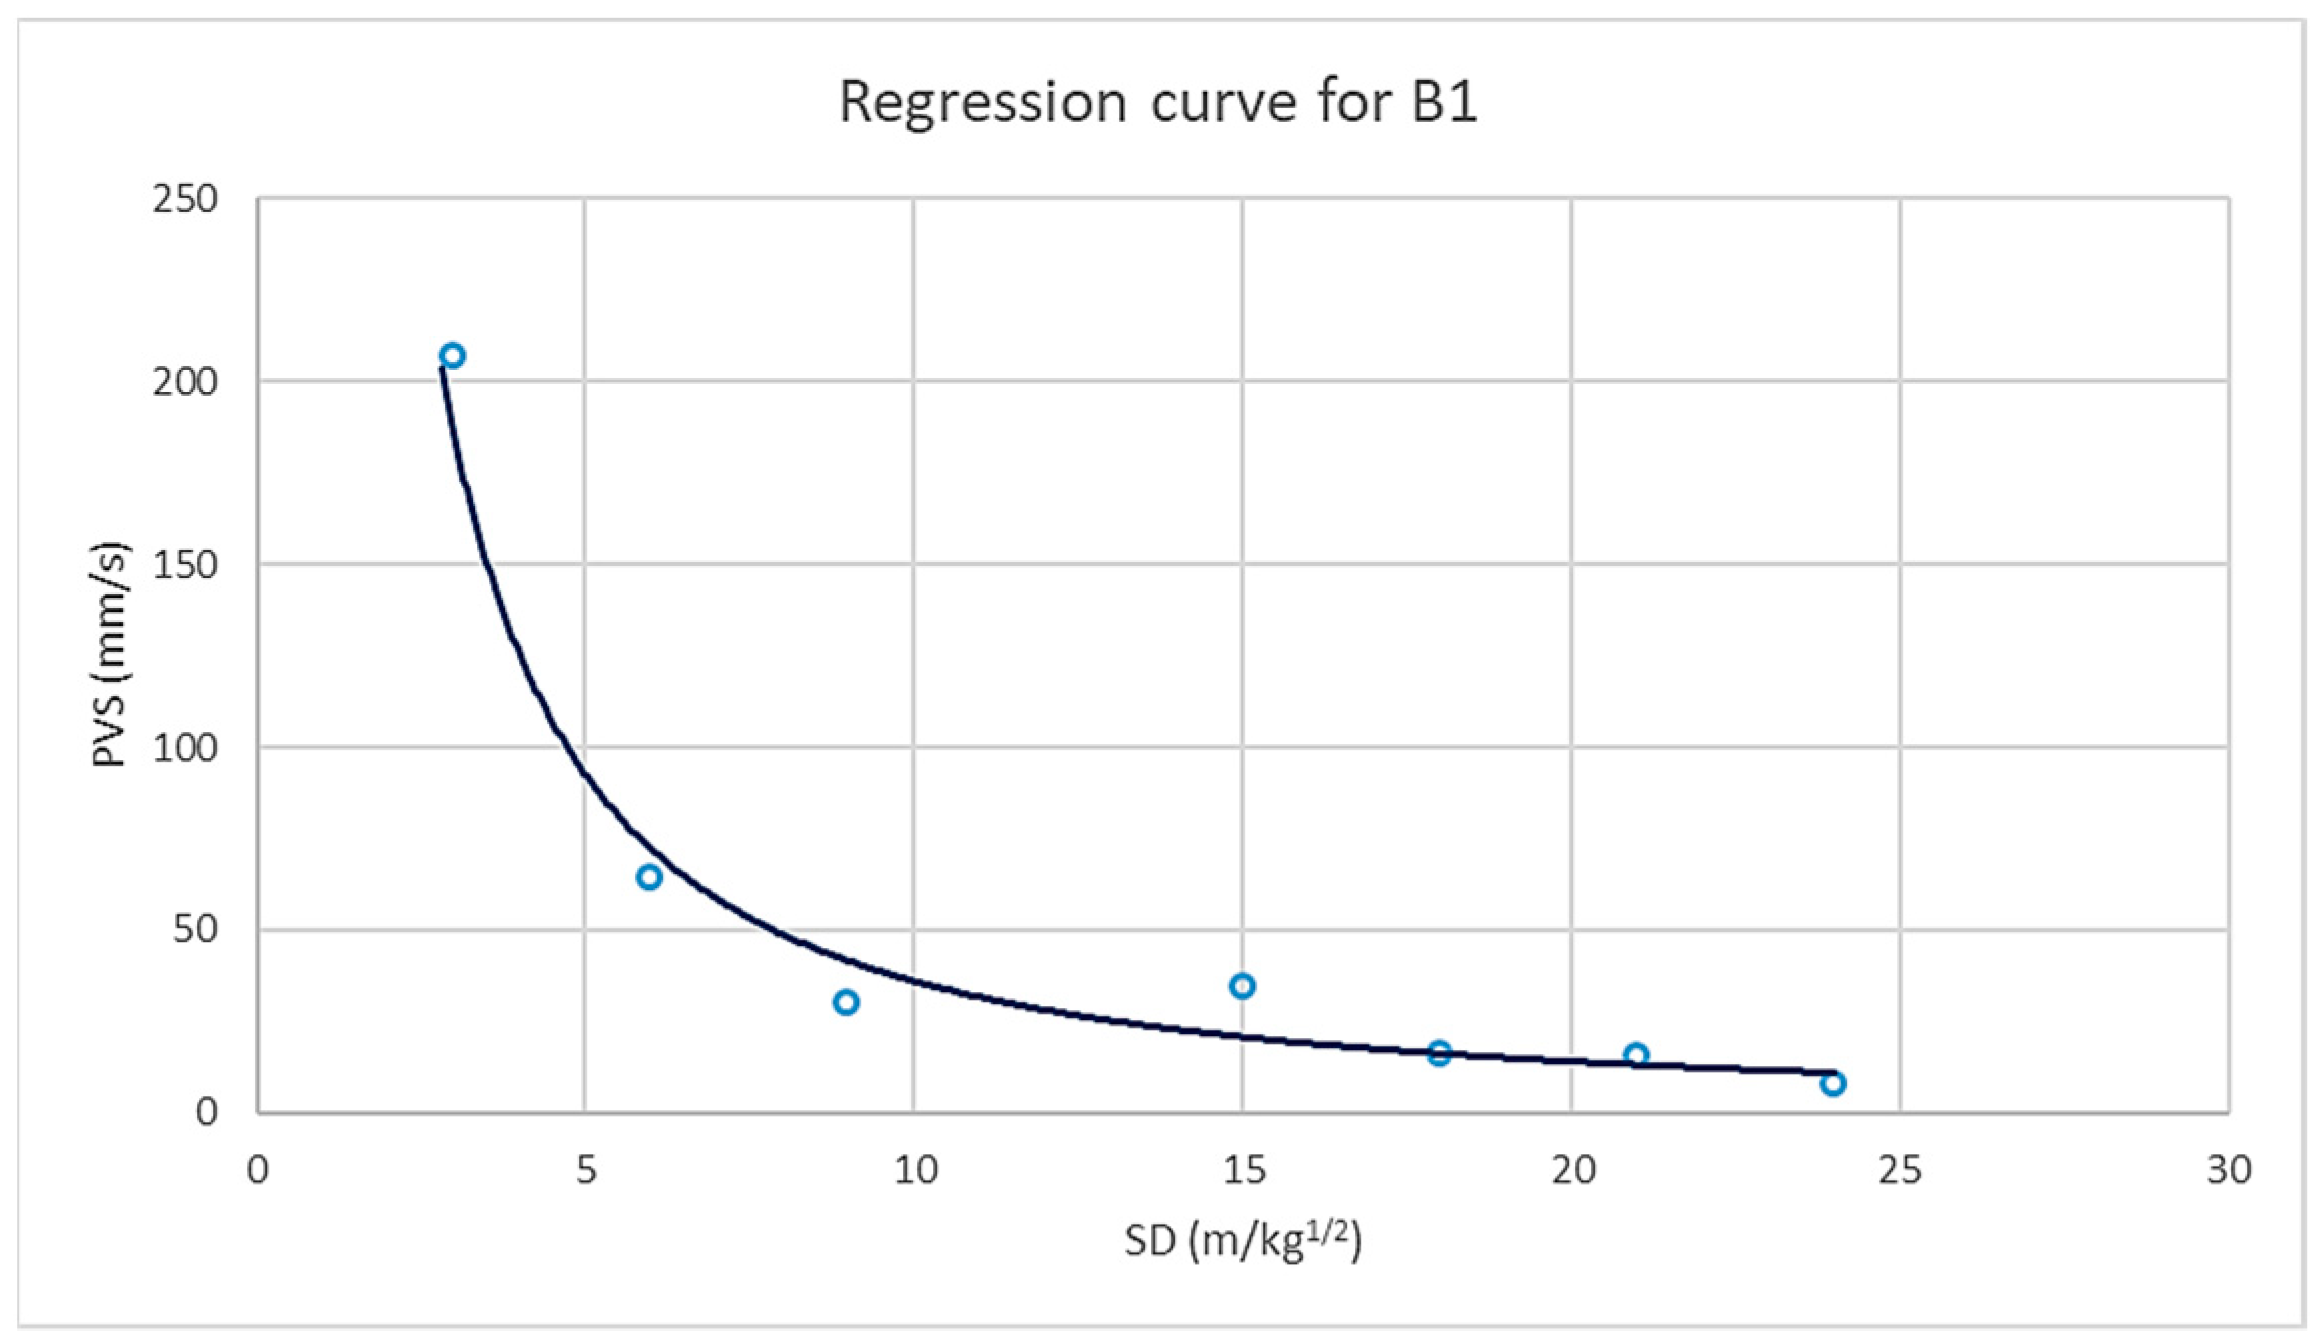
Equation (1) provides a general form of regression curve [38], which, for the borehole B1 data, is displayed in Figure 2.
To be able to put measurement data through linear regression, it is required to transform the regression curve (Figure 2) to a straight line, by taking logarithms to the base 10 of both sides of Equation (1):
log P P V = log H β log S D
All measurement values were prepared according to Equation (4) for further analysis.
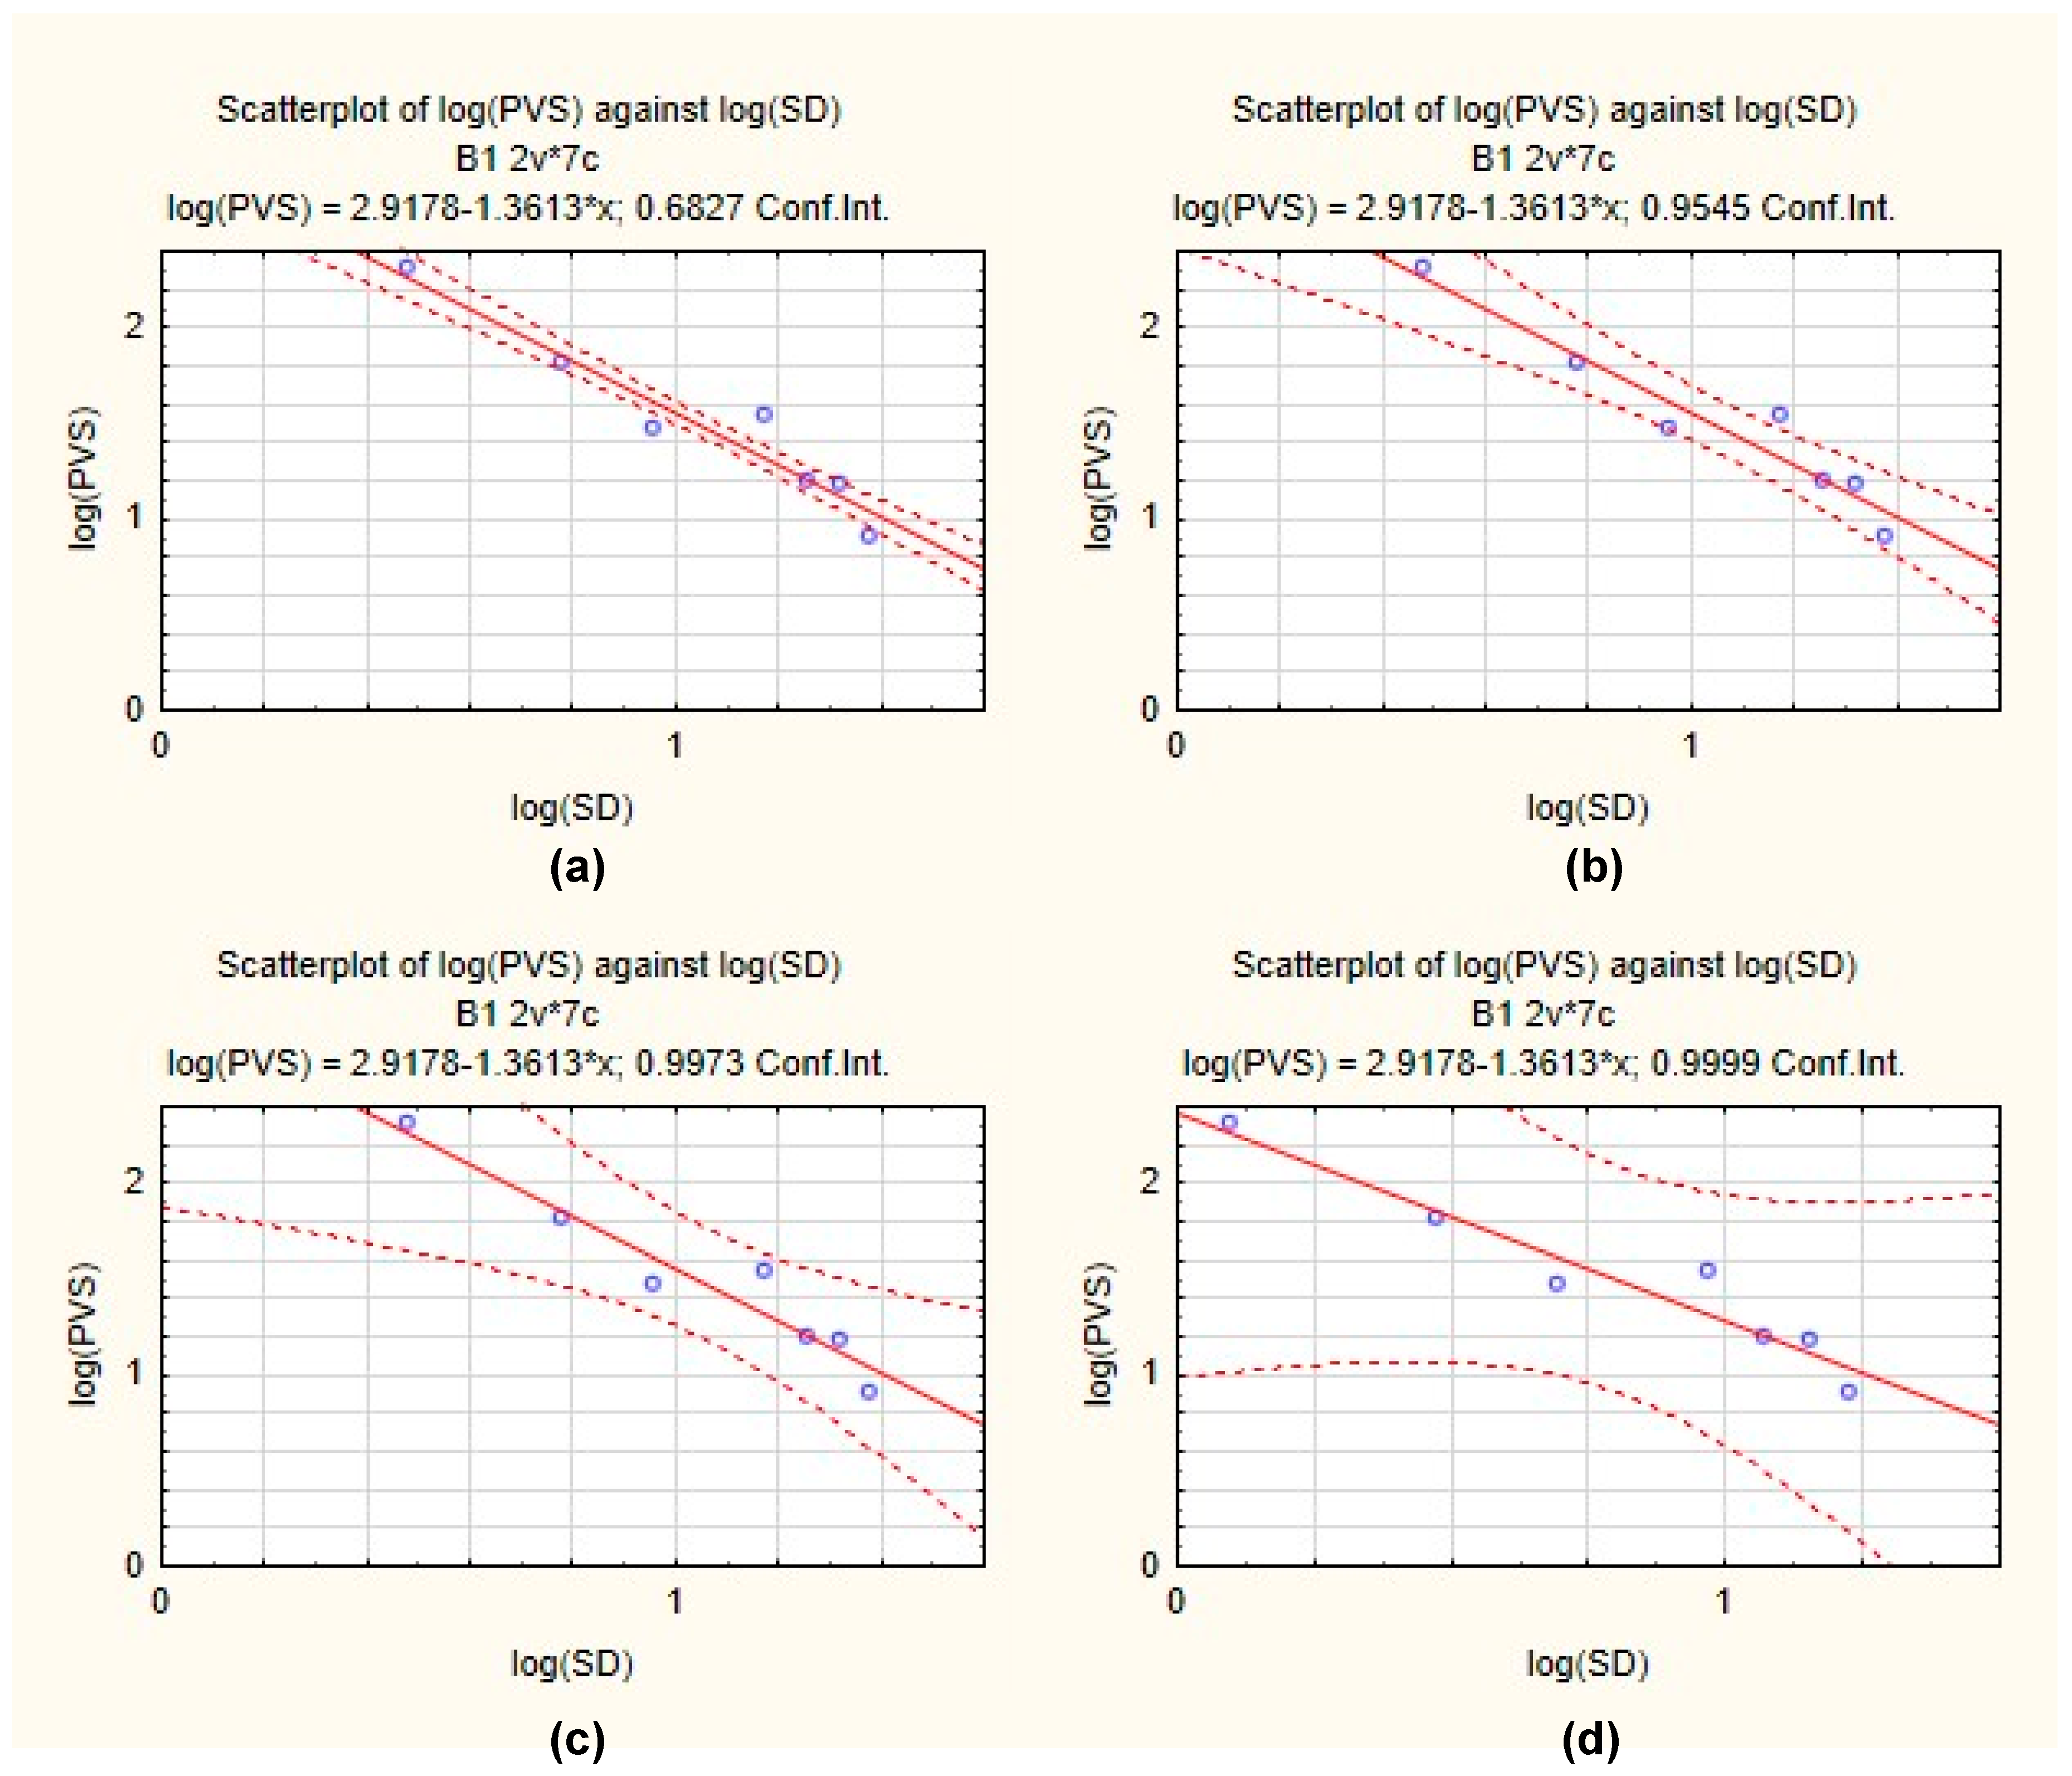
In many different fields, the methods for the detection of atypical values have already been accepted. As there is no clearly defined procedure for the detection of atypical values (outliers) in the measurements of blast-induced seismic effects and their exclusion, each dataset, prepared according to Equation (4), was put through regression statistics in the software “Statistica” with different regression bands and confidence at the levels of 68.27%, 95.45%, 99.73% and 99.99% (Sigma 1–4), to detect possible outliers (Figure 3).
There are certain prerequisites to be able to identify false measurement values. The large number of measurement instruments should be positioned in a single line at predefined distances from the blast. There should be a minimum of 4 instruments in the measurement line for each direction of interest from the blast. After each blast, the measured values should be validated to be eligible for further calculations and analysis. It is reasonable to expect some dispersion of data due to the geology.
The number of measurement points for borehole B1 after the exclusion of atypical values, according to each confident interval, is presented in Table 2.
Measurement data with confidence intervals of 97.73% and 99.99% (Sigma 3 and 4) do not exclude any value; hence, there are no atypical values (outliers) outside of the mentioned intervals.
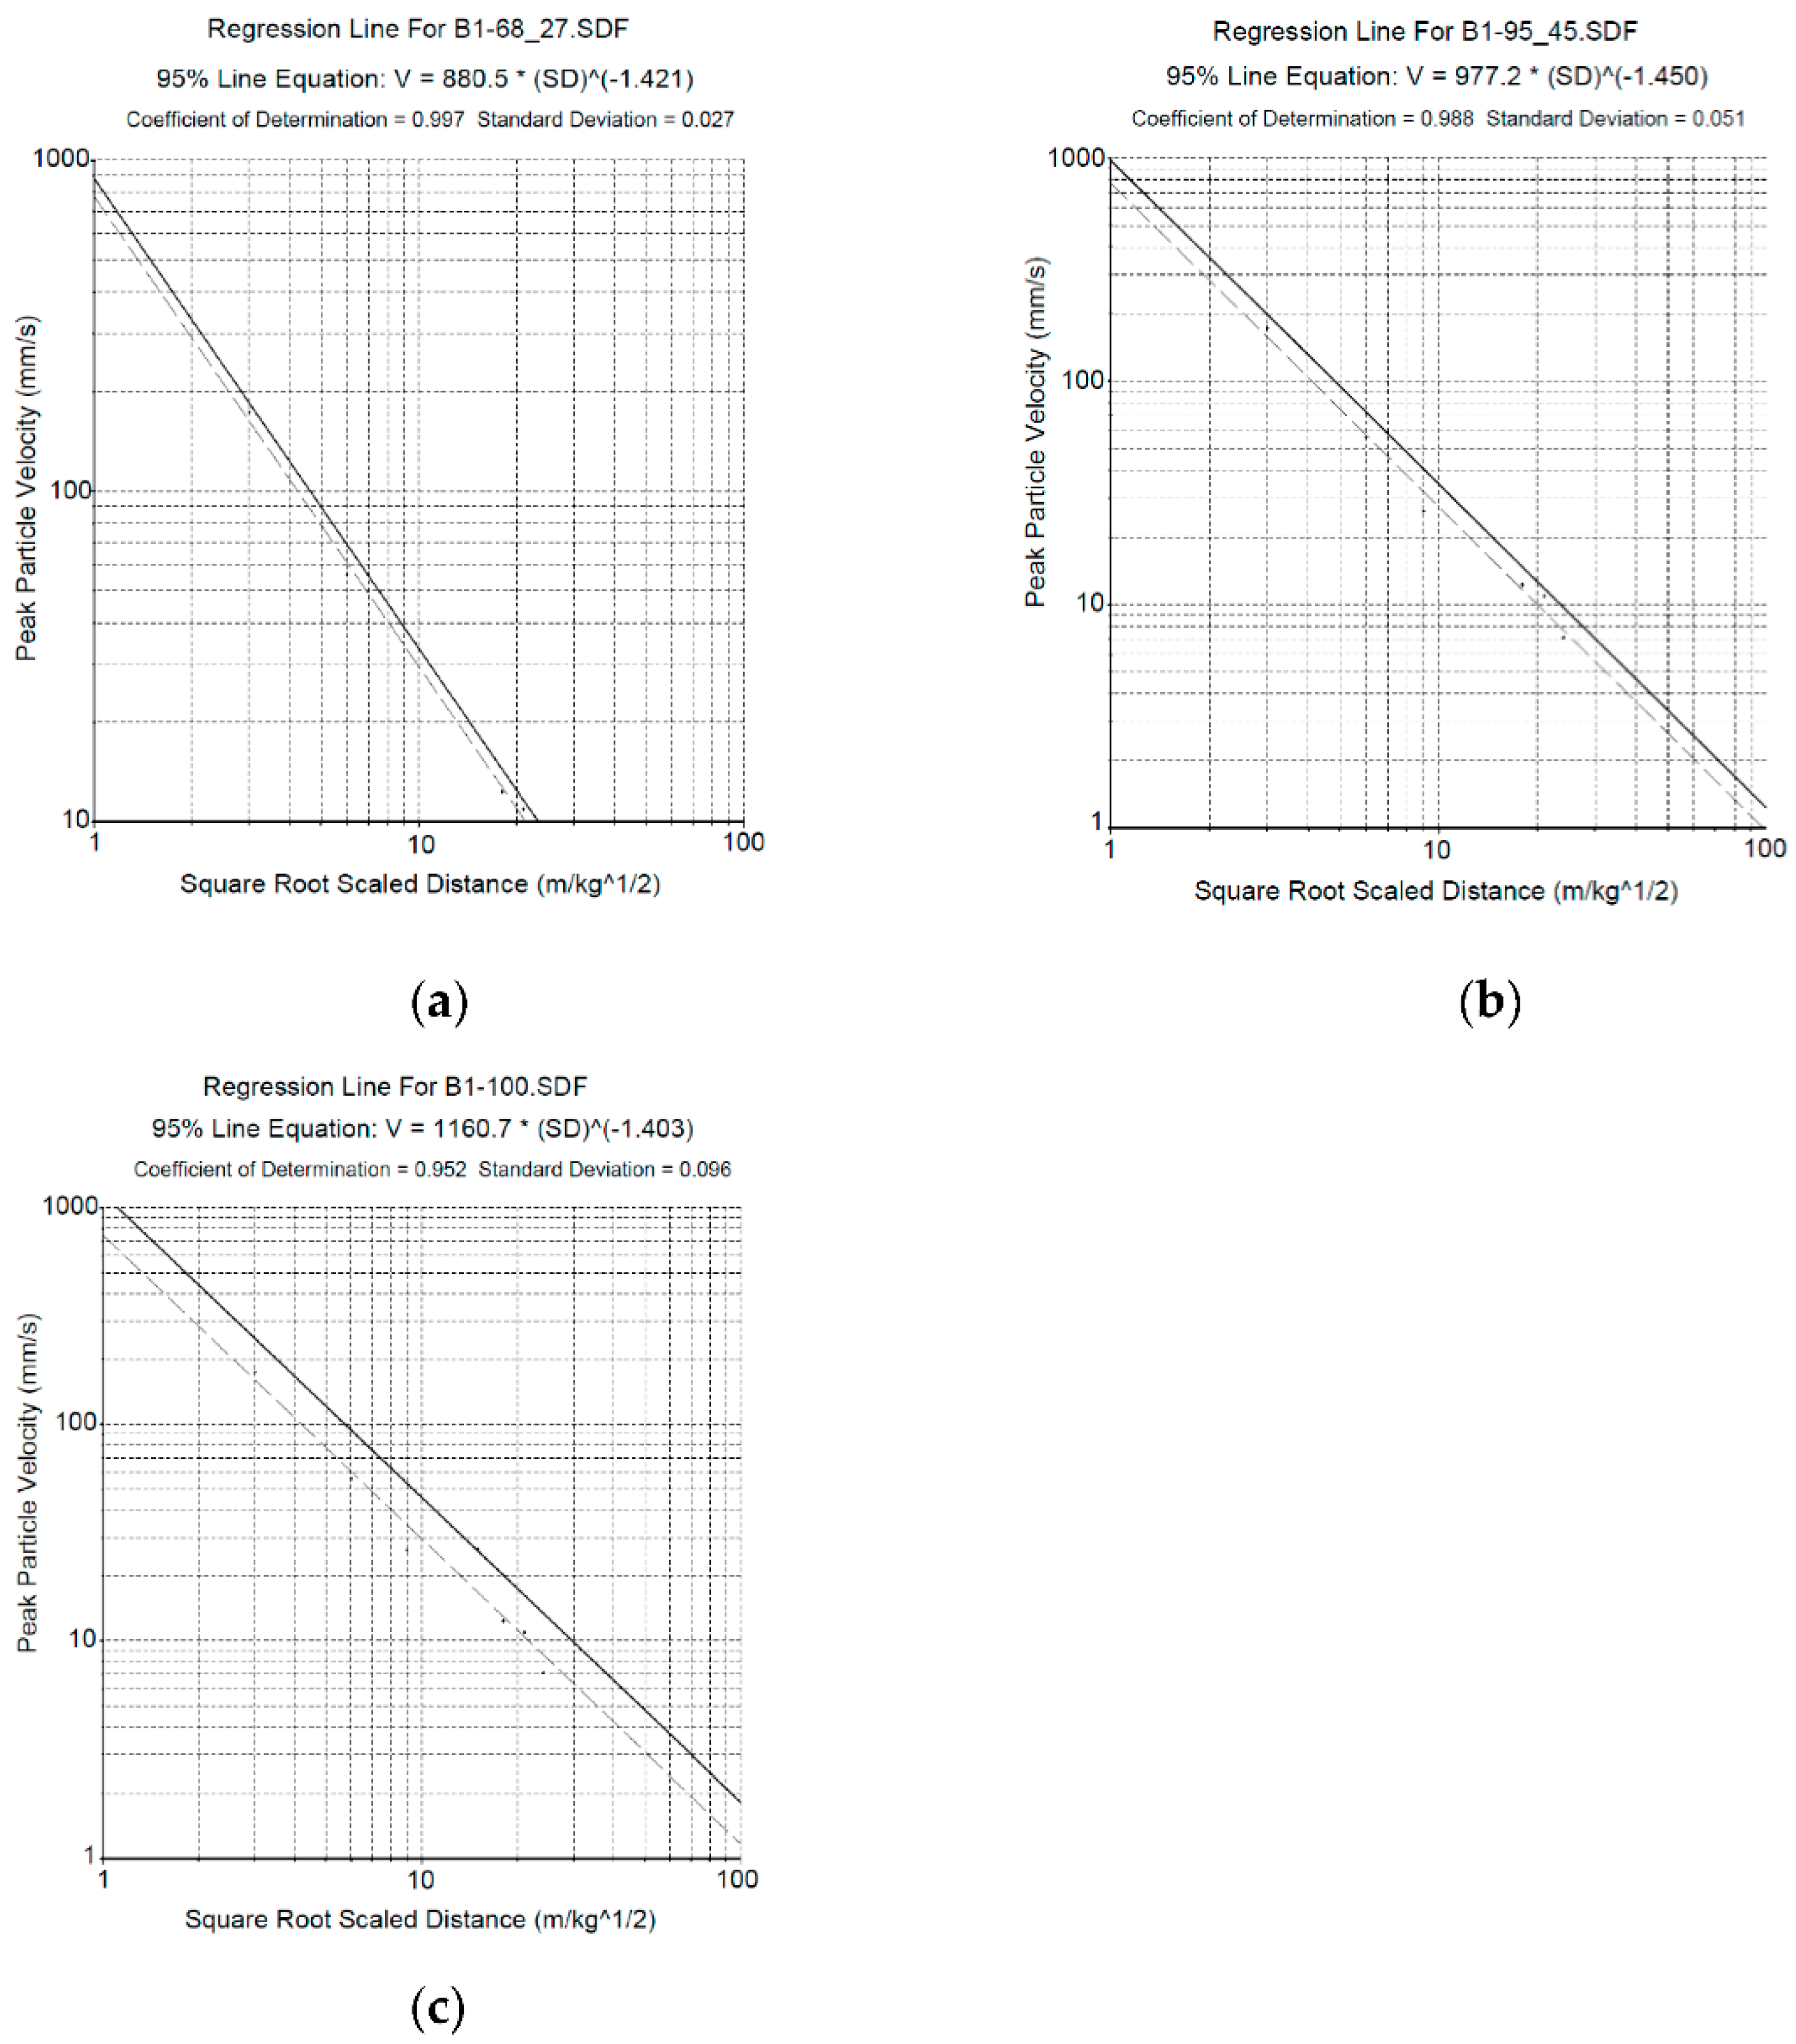
3. Results

After the detection of atypical values, for borehole B1, it is noticeable that the confidence intervals of 97.73% and 99.99% have all measurement points included within the interval lines. Since the results are the same as for full measurement data, they are not included in further analyses. For the remaining two confidence intervals (68.27% and 95.45%) and the full dataset (100.00%) for borehole B1, further analyses were performed in the Instantel application “Blastware”. After combining all measurement data, a graphical presentation of the regression line with the 95%-line equation, coefficient of determination and standard deviation is presented (Figure 4).
Data from the graphical presentation are summarized in the Table 3.
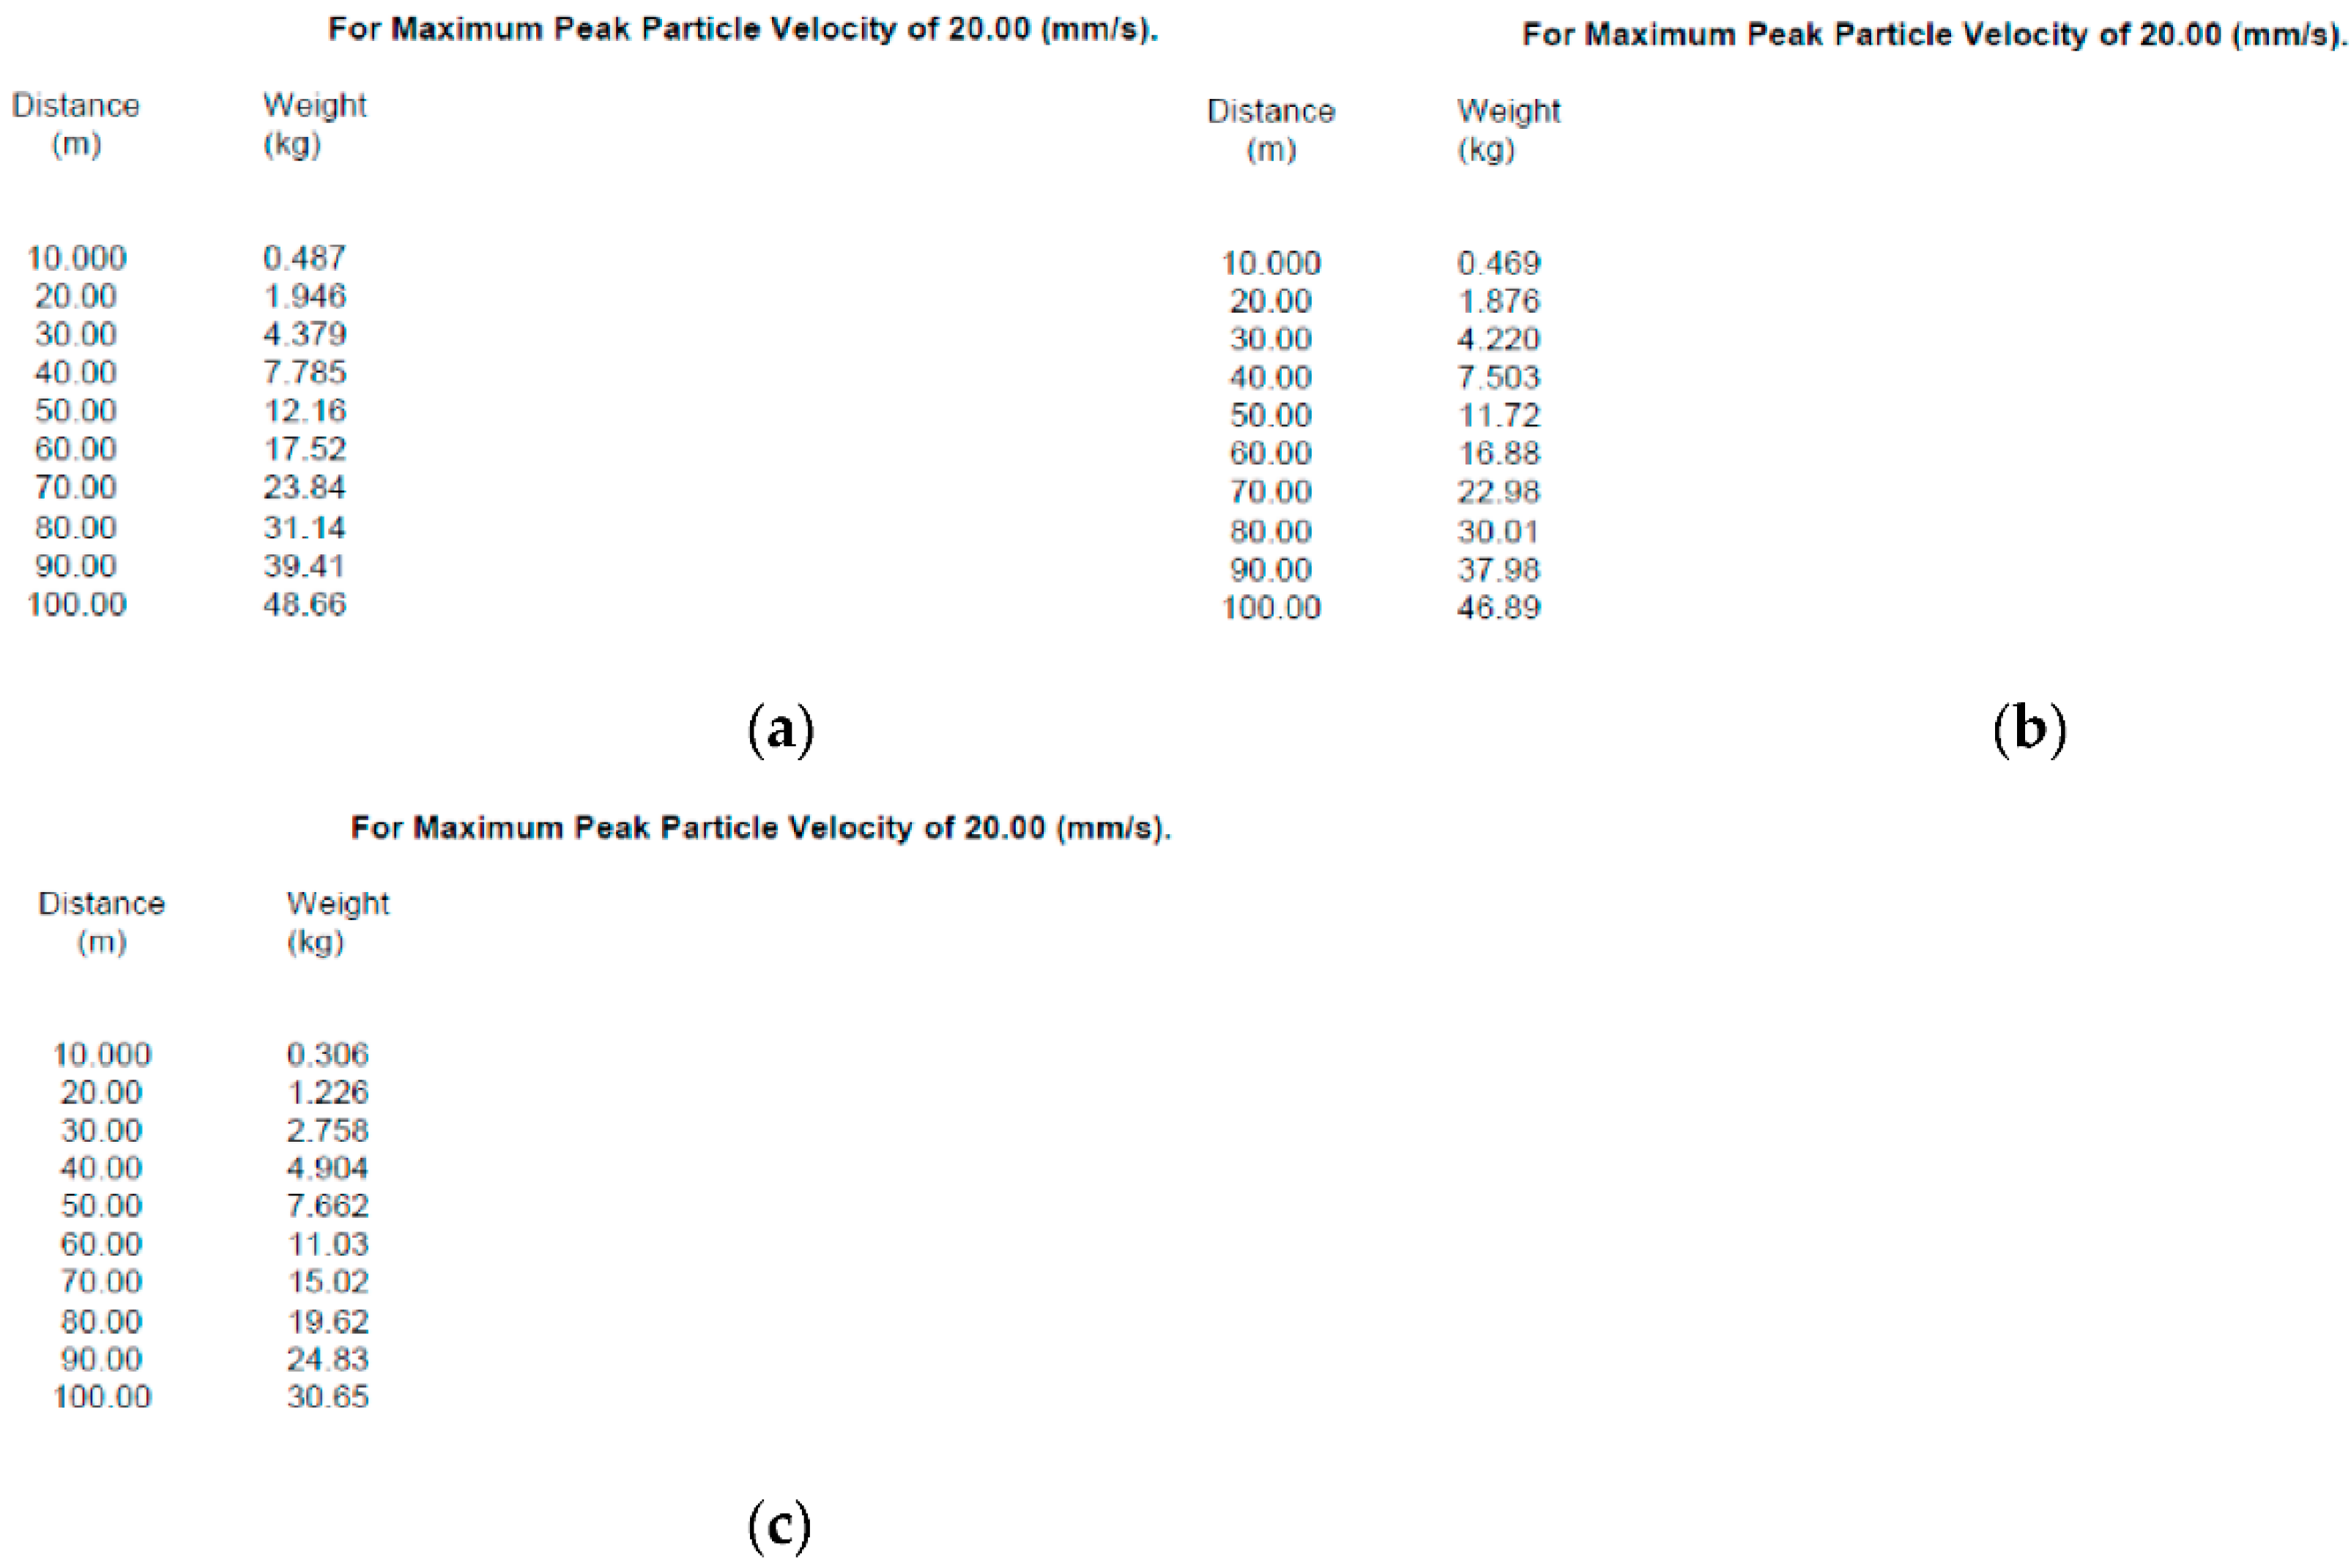
From each 95%-line equation, the application calculates the permitted charge weight per delay for the required distances from the blasting zone, with a selected maximum PPV according to the category of the surrounding structures and lists them as shown in Figure 5.
Data from the calculated permitted charge weight per delay for the required distances from the blasting zone with the selected maximum PPV according to the type of surrounding structures for all three cases are summarized in Table 4. Additionally, the ratio was calculated between both confidence intervals (68.27% and 95.45%) and the full measurement dataset.
The same procedure was conducted for all 17 boreholes with similar results; atypical values are present only with confidence intervals of 68.27% and 95.45% (Sigma 1 and 2), as presented in Table 5.
Equally, in Table 6, the regression lines with 95%-line equations, coefficients of determination and standard deviations for all 17 boreholes and different confidence intervals are presented.
Due to the large amount of data, in Table 7 for each borehole, only the ratios between both confidence intervals (68.27% and 95.45%) and the full dataset are presented.

4. Discussion

Figure 3 and Figure 4 along with Table 2 and Table 5 present the atypical values’ detection process of blast-induced seismic effects measurement data. It is visible that only the confidence intervals of 0.6827 and 0.9545 (Sigma 1 and 2) detect atypical values (outliers). The other two confidence intervals of 0.9973 and 0.9999 (Sigma 3 and 4) do not detect any measurement point as an atypical value. Therefore, only the first two were used for further analyses. It also shows that a confidence interval of 0.6827 excludes about half or more measurement points from one measurement dataset, while a confidence interval of 0.9545 excludes only one or two points.
Regression lines with 95%-line equations, coefficients of determination (R2) and standard deviations are presented in Figure 5 and Table 3 and Table 6. It is observable that the 95%-line equations are different depending on how many measurement points were excluded during the detection of atypical values. Mainly the coefficient of determination (R2) is closest to the value of 1 when atypical values are excluded using a confidence interval of 0.6827 compared to a confidence interval of 0.9575 or the full measurement dataset. This is because, when using the confidence interval of 0.6827, about half or more measurement points were excluded; therefore, only measurement points closest to the mean remained. However, the coefficient of determination for the equations using the confidence interval of 0.9575 is not far behind. When looking at the standard deviation for the mentioned cases, the results are similar. When using the confidence interval of 0.6827, the standard deviation is closest to zero, as expected, followed by a confidence interval of 0.9575 and the further away from zero is again the full measurement dataset. Additionally, boreholes B2, B3, B4, B7, B8 and B17, while using a confidence interval of 0.6827, do not provide any result for the regression lines with 95%-line equations, coefficients of determination and standard deviations due to not having the minimum of four monitoring points required for the application “Blastware” to perform further analyses.
The final and most important calculation for blasting contractors is the permitted charge weight per delay for the required distances from the blasting zone, with selected maximum PPV according to the type of the surrounding structures. Figure 5 and Table 4 and Table 7 provide an insight into how different these values can depend on how many monitoring points are excluded during the atypical value detection process. It can be observed that, at boreholes B2, B3, B4, B7, B8 and B17, while using a confidence interval of 0.6827, there are less than the minimum four measurement points required for the application to calculate the regression lines with 95%-line equations, coefficients of determination and standard deviations as well as the permissible charge weight per delay. The remaining results obtained using a confidence interval of 0.6827 provide lenient results, i.e., causes an increase in the permissible charge weight per delay comparing to the full measurement dataset, maintaining the safety level identical, which in the end provides more cost-efficient blasting works. When using a confidence interval of 0.9575 for boreholes B1–7 and B12–14, same results were obtained. Stricter results using a confidence interval of 0.9575 were obtained for boreholes B10, B11, B15 and B16, i.e., causes decrease in the permissible charge weight per delay comparing to the full measurement dataset, which in the end provides increase in the safety of the surrounding structures during blasting works. Using a confidence interval of 0.9575 for boreholes B8, B9 and B17, the results are equal to the full measurement data results.

5. Conclusions

By scrutinizing all aforementioned results, the following conclusions can be drawn:
  • Although the measurement data processed through regression statistics with a confidence interval of 0.6827 (Sigma 1) provides a better coefficient of determination and standard deviation, since it excludes about half or more measurement values, they do not completely nor correctly represent the full measurement dataset. In some cases, the data do not even provide enough measurement points for further analyses using the “Blastware” application. Therefore, it is recommended to use a confidence interval of 0.9575 (Sigma 2) for atypical value detection, since both the R2 (CoD) and the standard deviation are highly acceptable. This is also a typical range used in metrology.
  • The calculation of the permitted charge weight per delay for the required distances from the blast with selected maximum PPV according to the type of the surrounding structures is a final product provided to blasting engineers. For a confidence interval of 0.9575 (Sigma 2), the calculations can, in some cases, offer more cost-efficient blasting by increasing the charge weight per delay, and, in others, stricter by decreasing the charge weight per delay, while always retaining the safety of the surrounding structures.
The results show that, if a false measured value is included in the model or predictor development, it will provide erroneous results, which can lead to damage to the surrounding structures or an increase in the cost of blasting works. The detection and exclusion of atypical values (outliers) should be used in all projects where blasting works are performed in populated areas. By increasing the calculation accuracy, PPV control is improved. This would finally optimize blasting works by decreasing the costs and increasing safety. The next stage will be testing the proposed methodology on a large number of ongoing and future projects, such as blasting in quarries and open cuts for road/highway excavations and for excavation of underground parking in cities, to confirm the applicability of the results in all types of blasting works. The testing will be performed by installing a larger number of measurement instruments in the required number of measurement lines, depending on the number and direction of the protected structures surrounding blasting area. For each blast, the detection and exclusion of atypical values will be performed prior to calculations for the permitted charge weight per delay for the next blast.

Author Contributions

Conceptualization, S.S. and M.K.; Formal analysis, S.S. and M.K.; Investigation, S.S. and V.B.; Methodology, S.S. and D.K.; Resources, D.K. and V.B.; Software, S.S. and V.B.; Validation, M.K., D.K. and V.B.; Visualization, M.K., D.K. and V.B.; Writing—original draft, S.S. and M.K.; Writing—review and editing, S.S., M.K., D.K. and V.B. All authors have read and agreed to the published version of the manuscript.

Funding

This research received no external funding.

Acknowledgments

This work was supported by the Croatian Science Foundation (HRZZ) under the project IP-2019-04-1618.

Conflicts of Interest

The authors declare no conflict of interest.

References

  1. Resende, R.; Lamas, L.; Lemos, J.; Calçada, R. Stress Wave Propagation Test and Numerical Modelling of an Underground Complex. Int. J. Rock Mech. Min. Sci. 2014, 72, 26–36. [Google Scholar] [CrossRef]
  2. Tripathy, G.R.; Shirke, R.R.; Kudale, M.D. Safety of Engineered Structures against Blast Vibrations: A Case Study. J. Rock Mech. Geotech. Eng. 2016, 8, 248–255. [Google Scholar] [CrossRef] [Green Version]
  3. Dowding, C.H. Blast Vibration Monitoring and Control; Prentice Hall, Inc.: Hoboken, NJ, USA, 1985; ISBN 0-9644313-0-0. [Google Scholar]
  4. Kumar, R.; Choudhury, D.; Bhargava, K. Determination of Blast-Induced Ground Vibration Equations for Rocks Using Mechanical and Geological Properties. J. Rock Mech. Geotech. Eng. 2016, 8, 341–349. [Google Scholar] [CrossRef] [Green Version]
  5. Ozer, U. Environmental Impacts of Ground Vibration Induced by Blasting at Different Rock Units on the Kadikoy-Kartal Metro Tunnel. Eng. Geol. 2008, 100, 82–90. [Google Scholar] [CrossRef]
  6. Hopler, R. Blasters’ Handbook; International Society of Explosives Engineers: Cleveland, OH, USA, 1998; ISBN 978-1892396006. [Google Scholar]
  7. Ak, H.; Iphar, M.; Yavuz, M.; Konuk, A. Evaluation of Ground Vibration Effect of Blasting Operations in a Magnesite Mine. Soil Dyn. Earthq. Eng. 2009, 29, 669–676. [Google Scholar] [CrossRef]
  8. Nicholson, R.F. Determination of Blast Vibrations Using Peak Particle Velocity at Bengal Quarry, In St Ann, Jamaica Determination of Blast Vibrations Using Peak A Case Study. Master’s Thesis, Department of Civil and Environmental Engineering, Luleå University of Technology, Lulea, Sweden, 2005. [Google Scholar]
  9. Badal, K.K. Blast Vibration Studies in Surface Mines. Ph.D. Thesis, National Institute of Technology, Rourkela, India, 2010. [Google Scholar]
  10. Mesec, J.; Strelec, S.; Težak, D. Ground Vibrations Level Characterization Through the Geological Strength Index (Gsi). Rud. Zb. 2017, 32, 1–6. [Google Scholar] [CrossRef]
  11. Sun, P.; Lu, W.; Zhou, J.; Huang, X.; Chen, M.; Li, Q. Comparison of Dominant Frequency Attenuation of Blasting Vibration for Different Charge Structures. J. Rock Mech. Geotech. Eng. 2022, 14, 448–459. [Google Scholar] [CrossRef]
  12. Zeng, Y.; Li, H.; Xia, X.; Liu, B.; Zuo, H.; Jiang, J. Blast-Induced Rock Damage Control in Fangchenggang Nuclear Power Station, China. J. Rock Mech. Geotech. Eng. 2018, 10, 914–923. [Google Scholar] [CrossRef]
  13. Wan, D.; Zhu, Z.; Liu, R.; Liu, B.; Li, J. Measuring Method of Dynamic Fracture Toughness of Mode I Crack under Blasting Using a Rectangle Specimen with a Crack and Edge Notches. Int. J. Rock Mech. Min. Sci. 2019, 123, 104104. [Google Scholar] [CrossRef]
  14. Wang, M.; Zhu, Z.; Dong, Y.; Zhou, L. Study of Mixed-Mode I/II Fractures Using Single Cleavage Semicircle Compression Specimens under Impacting Loads. Eng. Fract. Mech. 2017, 177, 33–44. [Google Scholar] [CrossRef]
  15. Agrawal, H.; Mishra, A.K. Modified Scaled Distance Regression Analysis Approach for Prediction of Blast-Induced Ground Vibration in Multi-Hole Blasting. J. Rock Mech. Geotech. Eng. 2019, 11, 202–207. [Google Scholar] [CrossRef]
  16. Monjezi, M.; Ahmadi, M.; Sheikhan, M.; Bahrami, A.; Salimi, A.R. Predicting Blast-Induced Ground Vibration Using Various Types of Neural Networks. Soil Dyn. Earthq. Eng. 2010, 30, 1233–1236. [Google Scholar] [CrossRef]
  17. Hasanipanah, M.; Faradonbeh, R.S.; Amnieh, H.B.; Armaghani, D.J.; Monjezi, M. Forecasting Blast-Induced Ground Vibration Developing a CART Model. Eng. Comput. 2017, 33, 307–316. [Google Scholar] [CrossRef]
  18. Rodríguez, R.; García de Marina, L.; Bascompta, M.; Lombardía, C. Determination of the Ground Vibration Attenuation Law from a Single Blast: A Particular Case of Trench Blasting. J. Rock Mech. Geotech. Eng. 2021, 13, 1182–1192. [Google Scholar] [CrossRef]
  19. Segarra, P.; López, L.M.; Sanchidrián, J.A. Uncertainty in Measurements of Vibrations from Blasting. Rock Mech. Rock Eng. 2012, 45, 1119–1126. [Google Scholar] [CrossRef]
  20. ISEE. ISEE Field Practice Guidelines for Blasting Seismographs; International Society of Explosives Engineers: Cleveland, OH, USA, 2020. [Google Scholar]
  21. Yang, J.; Rahardja, S.; Fränti, P. Mean-Shift Outlier Detection and Filtering. Pattern Recognit. 2021, 115, 107874. [Google Scholar] [CrossRef]
  22. Smiti, A. A Critical Overview of Outlier Detection Methods. Comput. Sci. Rev. 2020, 38, 100306. [Google Scholar] [CrossRef]
  23. Vishwakarma, G.K.; Paul, C.; Elsawah, A.M. A Hybrid Feedforward Neural Network Algorithm for Detecting Outliers in Non-Stationary Multivariate Time Series. Expert Syst. Appl. 2021, 184, 115545. [Google Scholar] [CrossRef]
  24. Lehmann, R. 3σ-Rule for Outlier Detection from the Viewpoint of Geodetic Adjustment. J. Surv. Eng. 2013, 139, 157–165. [Google Scholar] [CrossRef] [Green Version]
  25. Stanković, S.; Dobrilović, M.; Bohanek, V. A Practical Approach to the Ground Oscillation Velocity Measurement Method. Rud. Zb. 2017, 32, 55–60. [Google Scholar] [CrossRef] [Green Version]
  26. Stanković, S.; Dobrilović, M.; Škrlec, V. Optimal Positioning of Vibration Monitoring Instruments and Their Impact on Blast-Induced Seismic Influence Results. Arch. Min. Sci. 2019, 64, 591–607. [Google Scholar] [CrossRef]
  27. IGI. Osnovna Geološka Karta, Tumač za List Zadar L 33-139; IGI: Belgrade, Serbia, 1967. [Google Scholar]
  28. Jayasinghe, B.; Zhao, Z.; Teck Chee, A.G.; Zhou, H.; Gui, Y. Attenuation of Rock Blasting Induced Ground Vibration in Rock-Soil Interface. J. Rock Mech. Geotech. Eng. 2019, 11, 770–778. [Google Scholar] [CrossRef]
  29. Kuzmenko, A.A.; Vorobev, V.D.; Denisyuk, I.I.; Dauetas, A.A. Seismic Effects of Blasting in Rock; CRC Press: Boca Raton, FL, USA, 1993; Volume 103, ISBN 90-5410-214-4. [Google Scholar]
  30. Zhu, Z. Numerical Prediction of Crater Blasting and Bench Blasting. Int. J. Rock Mech. Min. Sci. 2009, 46, 1088–1096. [Google Scholar] [CrossRef]
  31. MAXAM Hrvatska d.o.o. ELEXIT Gelatinous Dynamite Catalogue 2010; MAXAM Hrvatska d.o.o.: Mahovo, Croatia, 2010. [Google Scholar]
  32. Siskind, D.E. Vibrations from Blasting; International Society of Explosives Engineers: Cleveland, OH, USA, 2000. [Google Scholar]
  33. Cooper, P.W. Comments on TNT Equivalence. In Proceedings of the 20th International Pyrotechnics Seminar, Colorado Springs, CO, USA, 25–29 July 1994; pp. 215–226. [Google Scholar]
  34. Karlos, V.; Solomos, G. Calculation of Blast Loads for Application to Structural Components. In Administrative Arrangement No JRC 32253-2011 with DG-HOME Activity A5—Blast Simulation Technology Development; Publications Office of the European Union: Luxembourg, 2013; ISBN 9789279351587. [Google Scholar]
  35. Panowicz, R.; Konarzewski, M.; Trypolin, M. Analysis of Criteria for Determining a TNT Equivalent. J. Mech. Eng. 2017, 63, 666–672. [Google Scholar] [CrossRef]
  36. Maienschein, J.L. Estimating Equivalency of Explosives Through a Thermochemical Approach; Lawrence Livermore National Lab: Livermore, CA, USA, 2002. [Google Scholar]
  37. Štimac, B.; Škrlec, V.; Dobrilović, M.; Sućeska, M. Numerical Modelling of Non-Ideal Detonation in ANFO Explosives Applying Wood-Kirkwood Theory Coupled with EXPLO5 Thermochemical Code. Def. Technol. 2021, 17, 1740–1752. [Google Scholar] [CrossRef]
  38. Serdar, V. Udžbenik Statistike, 10th ed.; Školska Knjiga: Zagreb, Croatia, 1977. [Google Scholar]
Figure 1. Test site with the marked location of the test blasts area.
Applsci 12 05820 g001
Figure 2. Regression curve for data from borehole B1.
Applsci 12 05820 g002
Figure 3. Detection of the atypical values (outliers) for the blast-induced seismic effects measured data for borehole B1 with confidence intervals of (a) 0.6827; (b) 0.9545; (c) 0.9973; and (d) 0.9999.
Applsci 12 05820 g003
Figure 4. Regression line with the 95%-line equation, coefficient of determination and standard deviation for borehole B1: (a) confidence interval of 68.27%; (b) confidence interval of 95.45%; and (c) full dataset (100.00%).
Applsci 12 05820 g004
Figure 5. “Blastware” printout of the permitted charge weight per delay for the required distances from the blasting zone with the selected maximum PPV of 20 mm/s according to the category of the surrounding structures: (a) for a confidence interval of 68.27%; (b) for a confidence interval 95.45%; and (c) for full dataset (100.00%).
Applsci 12 05820 g005
Table 1. The measurement data of the blast-induced seismic effects for all 17 boreholes.
BoreholeDistance (m)PPVt (mm/s)PPVv (mm/s)PPVl (mm/s)PVS (mm/s)BoreholeDistance (m)PPVt (mm/s)PPVv (mm/s)PPVl (mm/s)PVS (mm/s)
B1539.2173161207B9584.369.179.2116
1011.755.947.864.5102646.787.198.9
1516.52326.229.81528.810.731.942.6
2515.126.520.134.62021.69.9119.325.9
3012.39.276.615.8258.515.469.029.24
3510.98.899.7815.3306.484.8311.212.6
404.197.116.488.05357.375.0812.112.5
B29.511.430.12636.3403.944.068.389.39
14.58.6441.721.342.7B101012.221.321.324.8
19.51815.530.134.81512.61112.216.3
29.51617.521.8292013.59.6520.621.9
34.57.625.594.710.2258.134.7611.414
39.510.36.8611.913302.415.087.497.74
44.54.065.715.217.38353.563.569.49.68
B31069.253.858.583.1406.14.711.412
1510.731.527.435.08453.942.037.497.55
209.7821.817.724.1B111521.328.416.831.2
254.951517.718.62014.23.1718.221.9
304.0611.215.216.22515.910.523.724.8
3515.611.632.134.3306.63.051515.3
405.338.641415353.33.8110.410.5
B41021.636.636.639.7402.673.6810.810.9
1535.128.315.639.8456.865.0812.613.1
205.46148.8914.4504.192.039.6510.1
2510.710.59.7814.4B121038.23062.164.9
303.38.138.269.16207.379.148.3812.1
353.35.339.7810.7304.764.518.649.43
4014.66.62426.64016.410.210.217
453.684.0612.412.7503.172.413.944.33
B51520.8146.3521.5604.062.164.324.59
2014.413.29.9115.8702.670.761.92.9
256.67.879.413.2B131515.715.429.532.2
308.765.469.9112.2257.627.628.3810
352.674.196.356.97352.792.735.526.25
403.684.328.649.41452416.116.524.1
459.525.3321.221.5552.411.522.542.8
503.052.6712.212.3652.161.022.542.81
B6538.415165.7166752.030.641.42.22
1035.632.56166.1B142016.415.113.620.2
1540.450.736.452.7305.845.917.117.62
2014.213.527.431.5402.732.033.814.87
2517.515.22224.35017.712.712.320.3
306.986.2215.917.6601.781.021.92.13
358.257.491515.4701.651.022.542.58
408.253.6810.411.6801.270.510.761.37
B71017.827.327.337.6B1511.511.728.218.534.2
1523.410.233.535.112.521.225.730.540.9
2020.618.91126.71525.619.42027.8
2511.27.8721.322.22014.914.616.620.1
309.2711.818.718.8254.323.563.185.03
355.593.9413.613.8305.468.386.489.59
409.024.1913.214.6354.572.034.75.32
456.222.545.596.26B166.526.956.838.261.2
B81516.927.722.534.17.537.241.959.264.3
2025.919.339.644.4159.6519.212.820.7
2521.810.814.223.2205.084.954,956.11
307.876.621.622.62510.71811.922.4
354.0610.816.417.8305.843.436.987.31
404.193.0512.212.3B172.5121203163228
457.243.312.713.61020.381.437.786.5
503.682.166.66.851512.316.915.720.4
2018.837.635.640.8
259.7810.716.918.7
Table 2. The number of measurement points for borehole B1 after the exclusion of atypical values.
BoreholeRemaining Measurement Points after Excluding Outliers for Confidence Intervals (%)
68.2795.4599.7399.99100.00
B14/76/77/77/77/7
Table 3. Regression line with 95%-line equation, coefficient of determination (R2) and standard deviation for borehole B1 for different confidence intervals.
BoreholeConf. Int. (%)95%-Line EquationR2Std. Dev.
B168.27 V = 880.5 × (SD)−1.4210.9970.027
95.45 V = 977.2 × (SD)−1.4500.9880.051
100.00 V = 1160.7 × (SD)−1.4030.9520.096
Table 4. Data from the calculated permissible charge weight per delay for the required distances from the blast, with the chosen maximum PPV for both confidence intervals (68.27% and 95.45%) and the full dataset, and their correlation.
B1Weight (kg) for Conf. Int. (%)Ratio
Distance (m)68.2795.45100.0068.27/100.0095.45/100.00
100.4870.4690.3061.591.53
201.9461.8761.2261.591.53
304.3794.222.7581.591.53
407.7857.5034.9041.591.53
5012.1611.727.6621.591.53
6017.5216.8811.031.591.53
7023.8422.9815.021.591.53
8031.1430.0119.621.591.53
9039.4137.9824.831.591.53
10048.6646.8930.651.591.53
Table 5. The number of measurement points for all boreholes after the exclusion of the atypical values.
BoreholeRemaining Measurement Points after Excluding Outliers for Confidence Intervals (%)
68.2795.4599.7399.99100.00
B14/76/77/77/77/7
B22/76/77/77/77/7
B33/75/77/77/77/7
B42/86/88/88/88/8
B55/86/88/88/88/8
B65/87/88/88/88/8
B73/87/88/88/88/8
B82/88/88/88/88/8
B95/86/88/88/88/8
B104/86/88/88/88/8
B114/86/88/88/88/8
B124/76/77/77/77/7
B134/76/77/77/77/7
B145/76/77/77/77/7
B154/76/77/77/77/7
B164/65/66/66/66/6
B172/55/55/55/55/5
Table 6. Regression lines with 95%-line equations, coefficients of determination (R2) and standard deviations for all 17 boreholes and different confidence intervals.
BoreholeConf. Int. (%)95%-Line EquationR2Std. Dev.
B168.27 V = 880.5 × (SD)−1.4210.9970.027
95.45 V = 977.2 × (SD)−1.4500.9880.051
100.00 V = 1160.7 × (SD)−1.4030.9520.096
B268.27 ///
95.45 V = 746.9 × (SD)−1.1740.7740.156
100.00 V = 731.2 × (SD)−1.1170.7030.167
B368.27 ///
95.45 V = 608.9 × (SD)−1.1600.9270.064
100.00 V = 487.5 × (SD)−0.8970.6240.138
B468.27 ///
95.45 V = 322.9 × (SD)−0.9230.7320.122
100.00 V = 270.6 × (SD)−0.7370.4230.180
B568.27 V = 65.65 × (SD)−0.4310.3690.099
95.45 V = 77.01 × (SD)−0.5060.4660.095
100.00 V = 60.71 × (SD)−0.3000.0860.165
B668.27 V = 624.5 × (SD)−1.2140.9970.019
95.45 V = 659.2 × (SD)−1.2330.9950.027
100.00 V = 776.4 × (SD)−1.2510.9840.046
B768.27 ///
95.45 V = 133.4 × (SD)−0.6100.7800.064
100.00 V = 293.6 × (SD)−0.8530.7130.113
B868.27 ///
95.45 V = 876.8 × (SD)−1.1840.7850.105
100.00 V = 876.8 × (SD)−1.1840.7850.105
B968.27 V = 346.6 × (SD)−1.0790.9850.043
95.45 V = 384.1 × (SD)−1.0970.9790.049
100.00 V = 889.8 × (SD)−1.2720.8780.135
B1068.27 V = 75.77 × (SD)−0.6830.9970.009
95.45 V = 64.00 × (SD)−0.5250.7990.062
100.00 V = 98.20 × (SD)−0.6120.6180.101
B1168.27 V = 193.5 × (SD)−0.8410.9620.033
95.45 V = 178.5 × (SD)−0.7910.9260.042
100.00 V = 257.9 × (SD)−0.8700.8150.070
B1268.27 V = 1237.4 × (SD)−1.5510.9860.062
95.45 V = 1035.2 × (SD)−1.4420.9170.128
100.00 V = 1357.4 × (SD)−1.3810.7910.195
B1368.27 V = 1098.2 × (SD)−1.5780.9760.072
95.45 V = 1126.6 × (SD)−1.6090.9700.070
100.00 V = 2632.1 × (SD)−1.4970.6060.277
B1468.27 V = 1283.3 × (SD)−1.6470.9530.083
95.45 V = 1446.4 × (SD)−1.6940.9490.083
100.00 V = 3075.3 × (SD)−1.5810.5650.274
B1568.27 V = 1241.5 × (SD)−1.7290.9710.058
95.45 V = 1032.5 × (SD)−1.6010.9510.067
100.00 V = 1968.4 × (SD)−1.7780.8360.138
B1668.27 V = 540.3 × (SD)−1.4400.9900.038
95.45 V = 554.1 × (SD)−1.2360.9020.109
100.00 V = 1015.1 × (SD)−1.4000.7510.203
B1768.27 ///
95.45 V = 778.8 × (SD)−1.0520.8060.183
100.00 V = 778.8 × (SD)−1.0520.8060.183
Table 7. Ratio between both confidence intervals (68.27% and 95.45%) and the full dataset for all 17 blast holes.
BoreholeRatio
68.27/10095.45/100
B11.591.53
B2/1.59
B3/10.93
B4/2.83
B56.637.99
B61.201.20
B7/1.08
B8/1.00
B91.031.00
B107.940.66
B111.400.85
B123.172.17
B134.965.58
B144.214.54
B151.370.95
B163.060.81
B17/1.00
Publisher’s Note: MDPI stays neutral with regard to jurisdictional claims in published maps and institutional affiliations.

