
Effect of Environment-Related Cues on Auditory Distance Perception in the Context of Audio-Only Augmented Reality


Abstract
:1. Introduction
1.1. Acoustic Cues Combination for Auditory Distance Perception
1.2. Vision Contribution
1.3. Research Aim
2. Design of Distance-Rendering Methods
2.1. Reference Method Based on Measurements
2.2. Envelope-Based Model
2.3. Intensity-Based Model
2.4. Energy Differences between the Methods
3. Material and Methods
3.1. Participants
3.2. Auditory Stimuli
3.3. Report Method
3.4. Online Experiment Design
3.5. Procedure
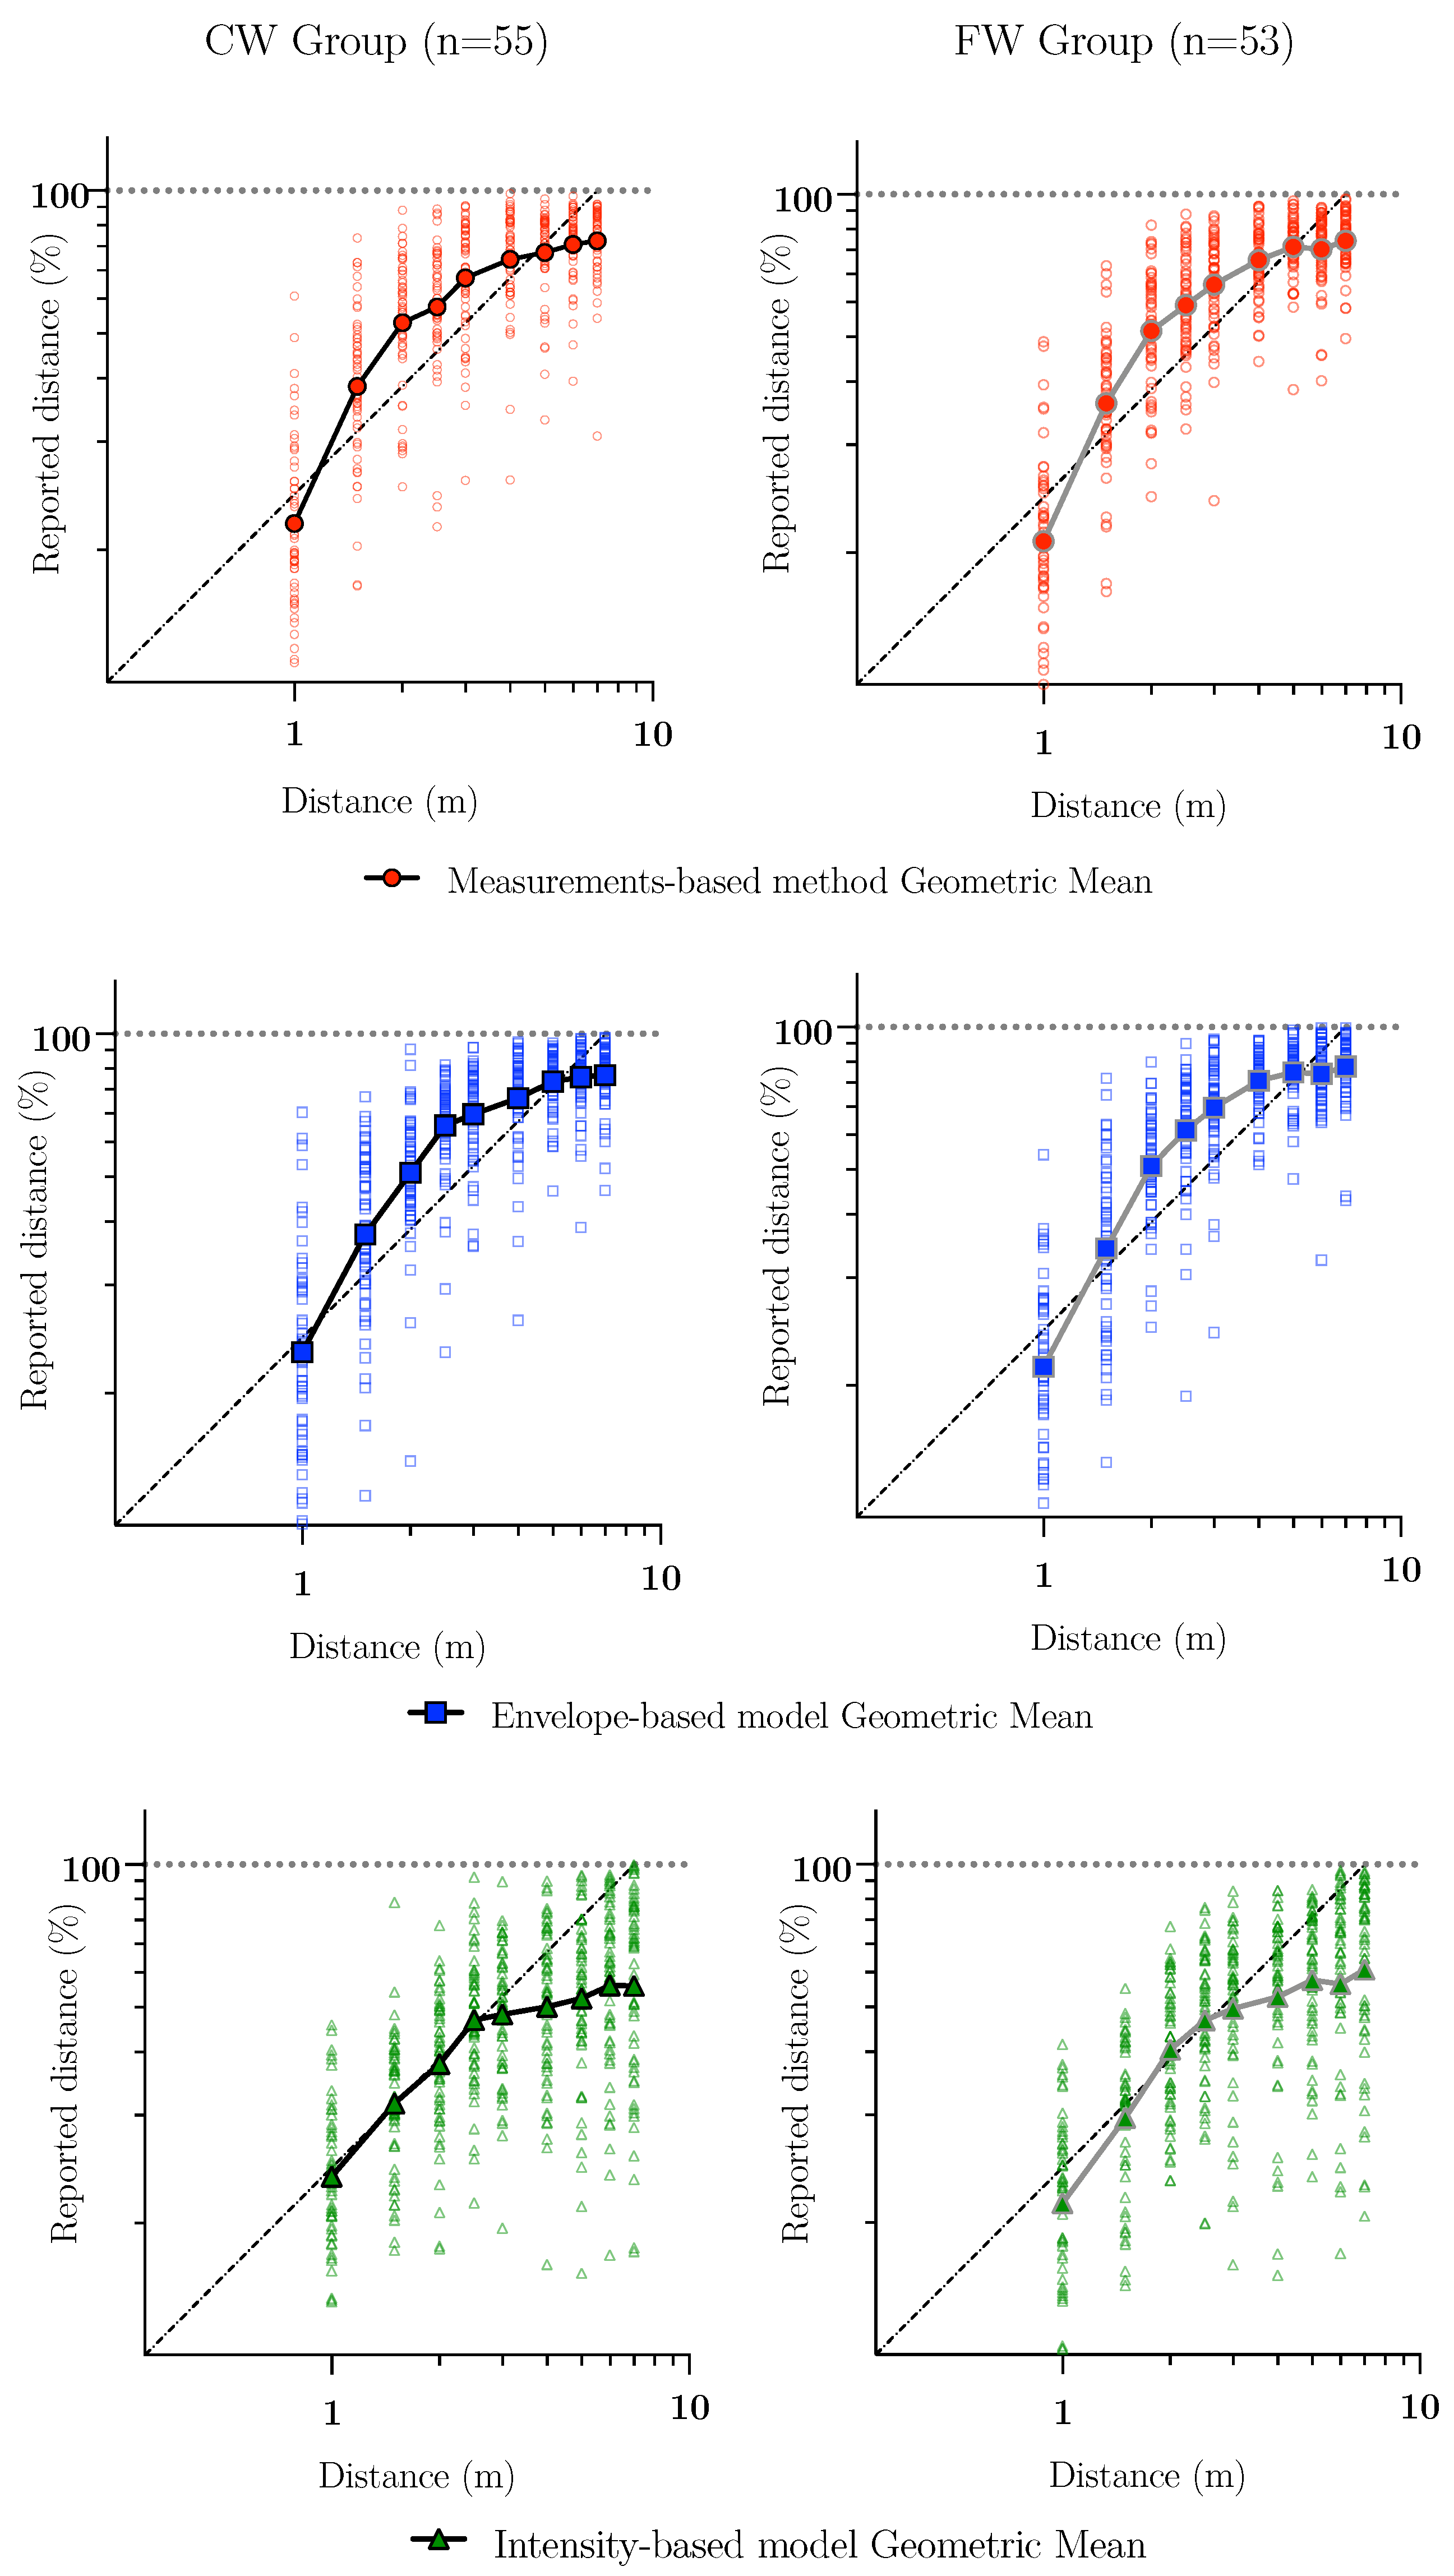
4. Results
4.1. General Results
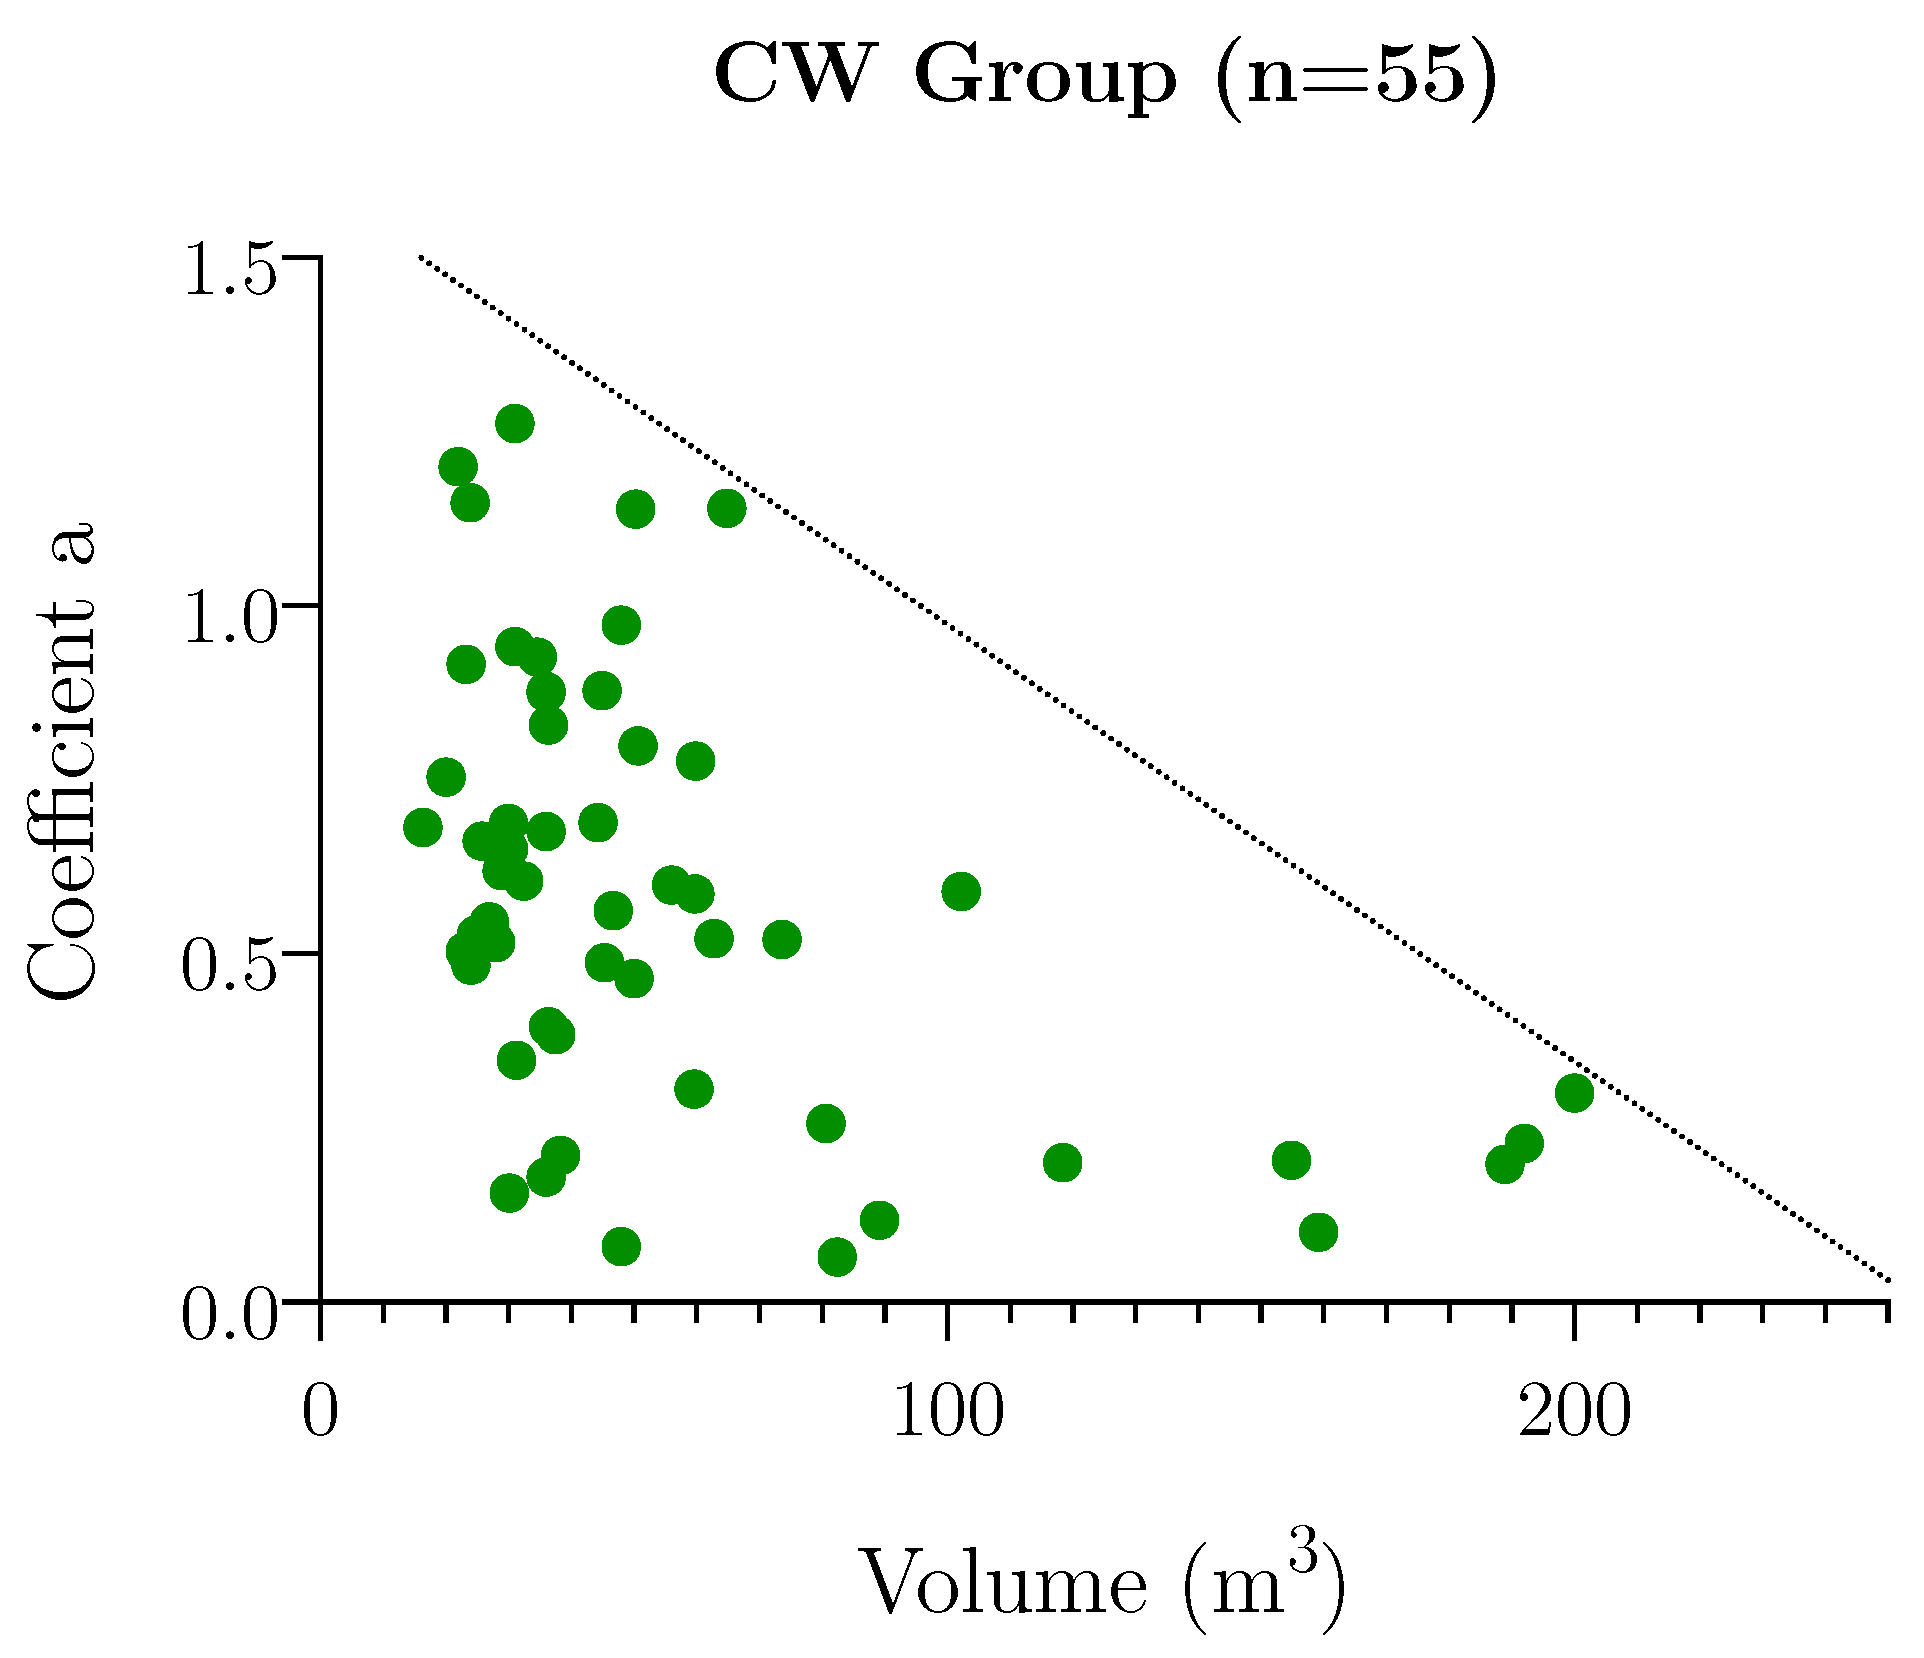
4.2. Effect of Room Volume
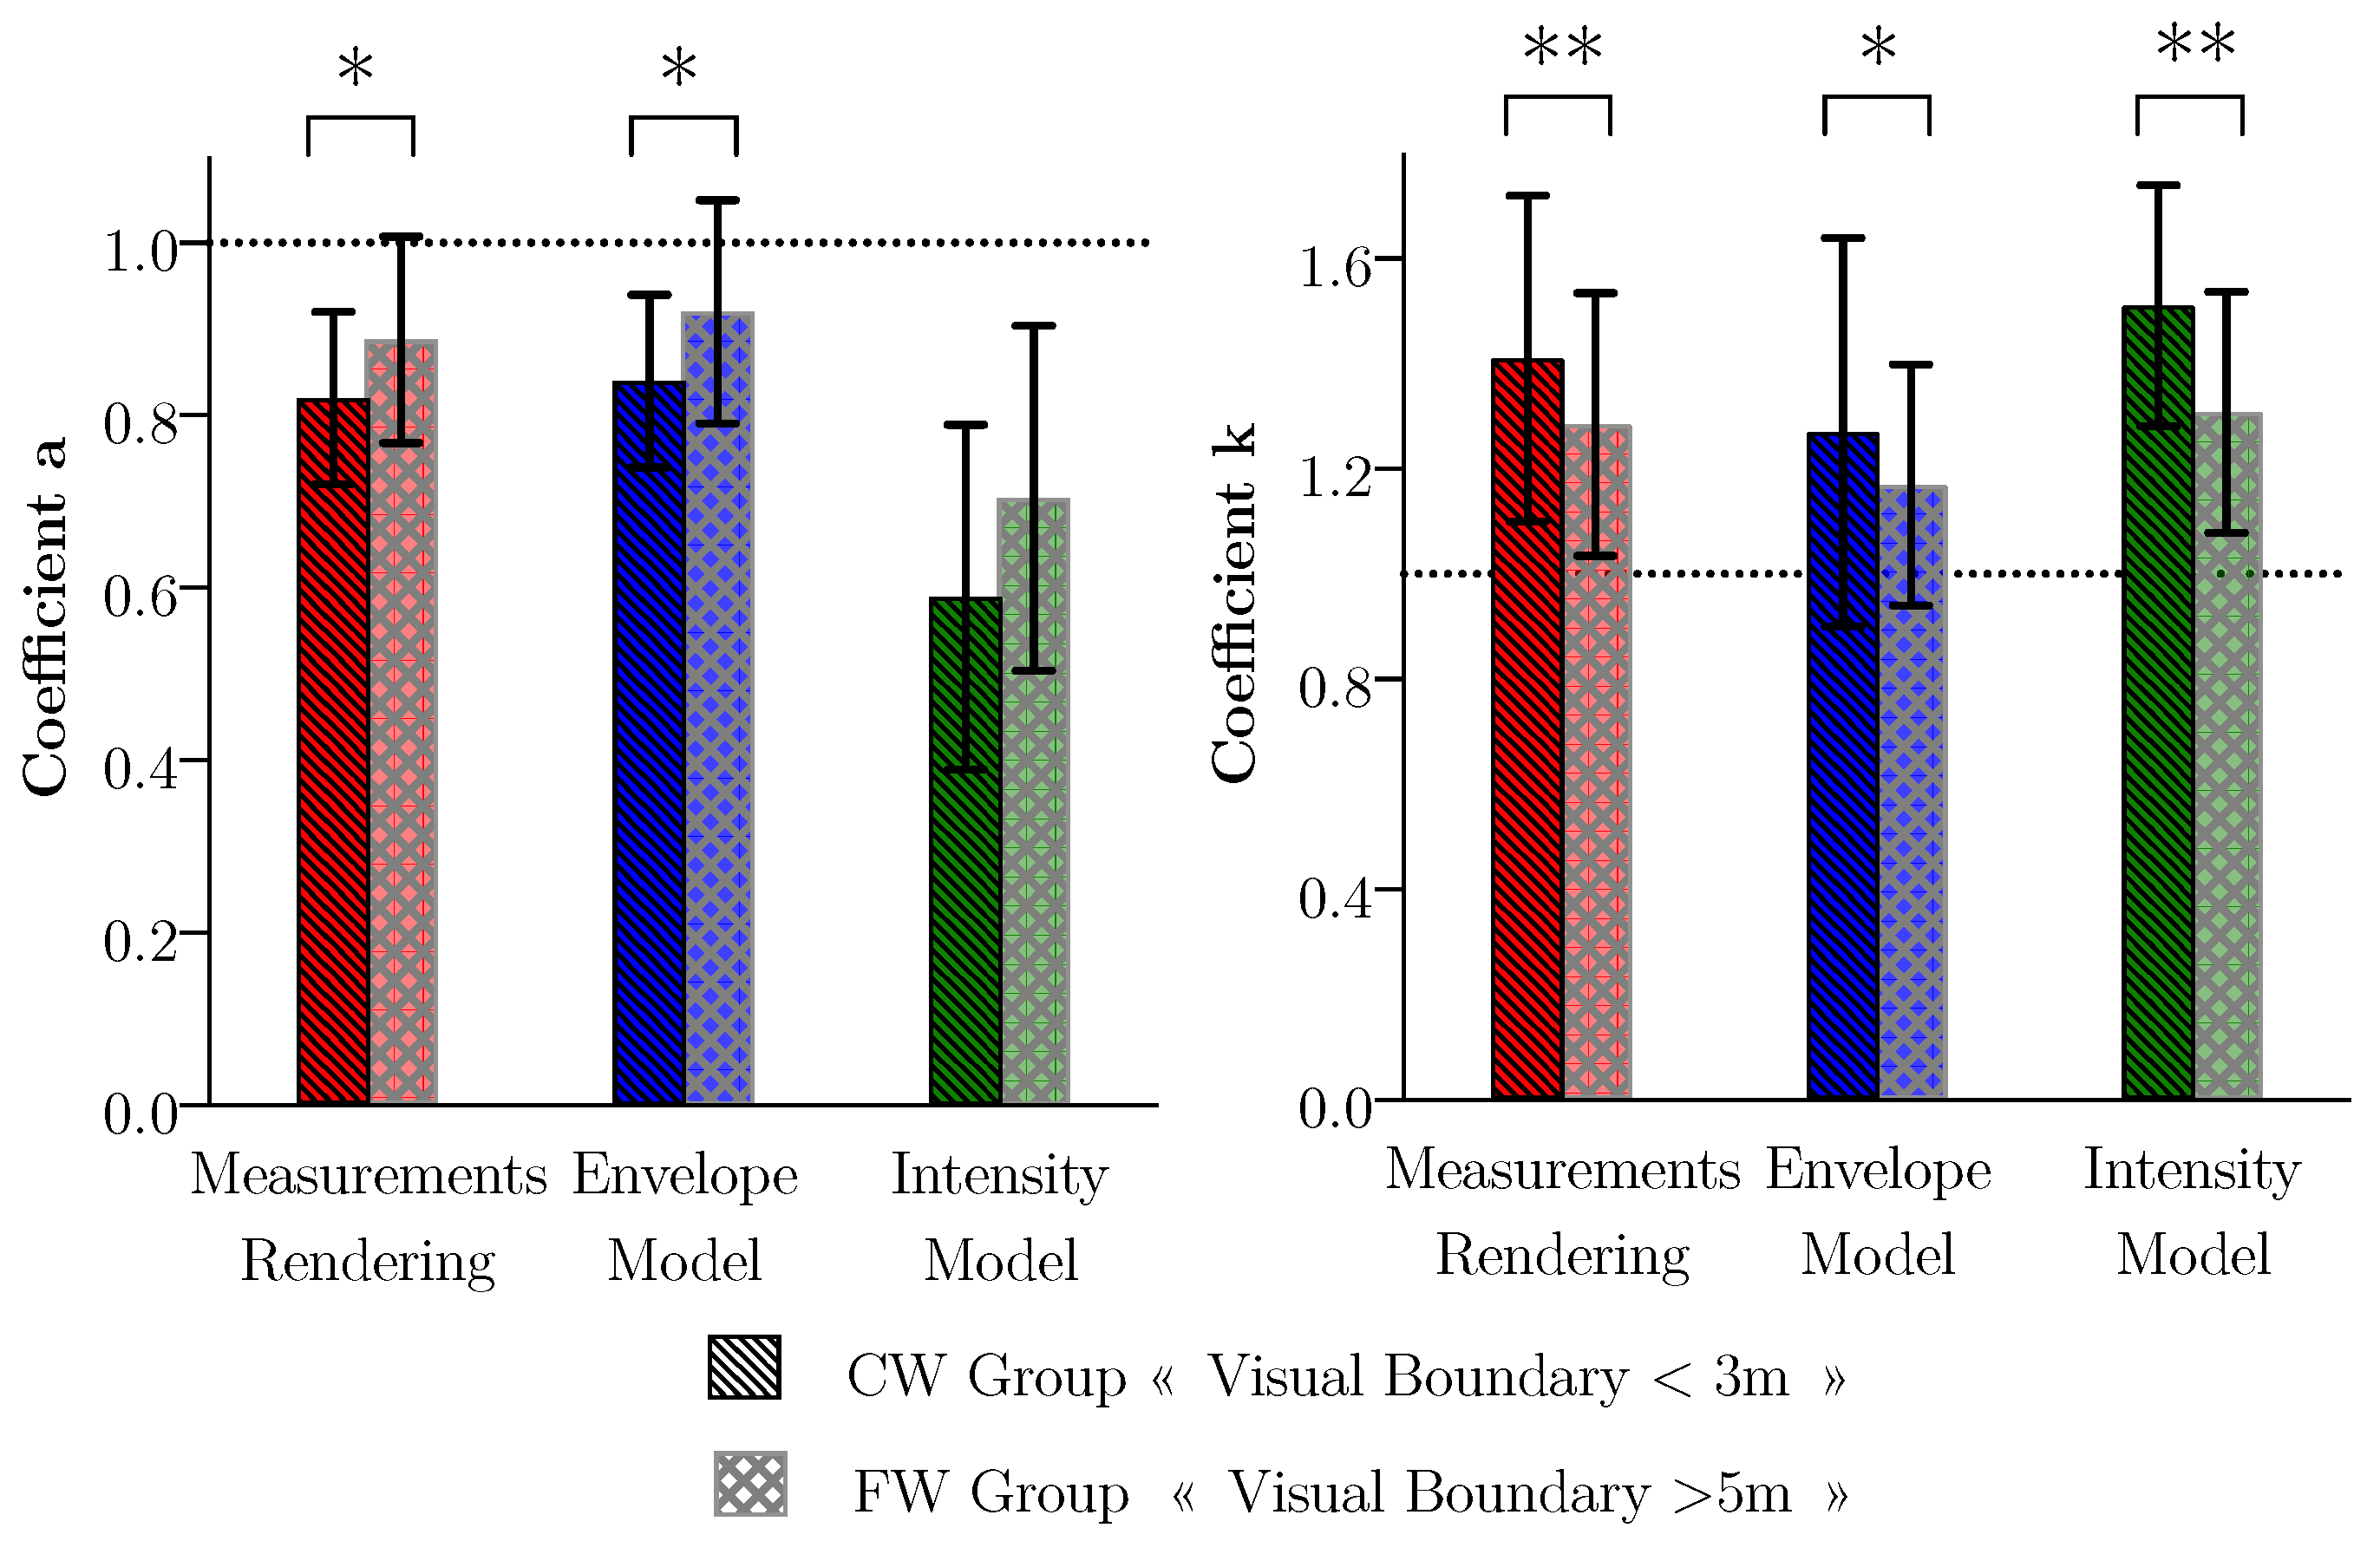
4.3. Compression Effect Quantification across Rendering Methods
4.4. Visual Spatial Boundary and Compression Coefficients
4.5. Room Volume and Compression Coefficients
5. Discussion
5.1. Early-to-Late Energy Ratio as a Distance Cue
5.2. Individual Acoustic Cues Weighting Strategies
5.3. Room Volume and Acoustic Cues Weighting Strategies
5.4. Visual Spatial Boundary and the Calibration of the Auditory Space
5.5. Study Limitations
6. Conclusions
Author Contributions
Funding
Institutional Review Board Statement
Informed Consent Statement
Data Availability Statement
Acknowledgments
Conflicts of Interest
References
- Blauert, J. Spatial Hearing: The Psychophysics of Human Sound Localization; MIT Press: Cambridge, MA, USA, 1997. [Google Scholar]
- Werner, S.; Klein, F.; Mayenfels, T.; Brandenburg, K. A summary on acoustic room divergence and its effect on externalization of auditory events. In Proceedings of the IEEE 2016 Eighth International Conference on Quality of Multimedia Experience (QoMEX), Lisbon, Portugal, 6–8 June 2016; pp. 1–6. [Google Scholar]
- Kolarik, A.J.; Moore, B.C.; Zahorik, P.; Cirstea, S.; Pardhan, S. Auditory distance perception in humans: A review of cues, development, neuronal bases, and effects of sensory loss. Atten. Percept. Psychophys. 2016, 78, 373–395. [Google Scholar] [CrossRef] [PubMed] [Green Version]
- Zahorik, P.; Brungart, D.S.; Bronkhorst, A.W. Auditory distance perception in humans: A summary of past and present research. ACTA Acust. United Acust. 2005, 91, 409–420. [Google Scholar]
- Kopčo, N.; Shinn-Cunningham, B.G. Effect of stimulus spectrum on distance perception for nearby sources. J. Acoust. Soc. Am. 2011, 130, 1530–1541. [Google Scholar] [CrossRef] [Green Version]
- Bronkhorst, A.W.; Houtgast, T. Auditory distance perception in rooms. Nature 1999, 397, 517–520. [Google Scholar] [CrossRef]
- Bronkhorst, A.W. Modeling Auditory Distance Perception in Rooms; Forum Acusticum: Sevilla, Spain, 2002. [Google Scholar]
- Bidart, A.; Lavandier, M. Room-induced cues for the perception of virtual auditory distance with stimuli equalized in level. Acta Acust. United Acust. 2016, 102, 159–169. [Google Scholar] [CrossRef]
- Larsen, E.; Iyer, N.; Lansing, C.R.; Feng, A.S. On the minimum audible difference in direct-to-reverberant energy ratio. J. Acoust. Soc. Am. 2008, 124, 450–461. [Google Scholar] [CrossRef] [Green Version]
- Prud’Homme, L.; Lavandier, M. Do we need two ears to perceive the distance of a virtual frontal sound source? J. Acoust. Soc. Am. 2020, 148, 1614–1623. [Google Scholar] [CrossRef]
- Werner, S.; Füg, S. Controlled Auditory Distance Perception using Binaural Headphone Reproduction–Evaluation via Listening Tests. In Proceedings of the 27th Tonmeistertagung, VDT International Convention, Cologne, Germany, 22–25 November 2012. [Google Scholar]
- Zahorik, P. Assessing auditory distance perception using virtual acoustics. J. Acoust. Soc. Am. 2002, 111, 1832–1846. [Google Scholar] [CrossRef] [PubMed]
- Calcagno, E.R.; Abregu, E.L.; Eguía, M.C.; Vergara, R. The role of vision in auditory distance perception. Perception 2012, 41, 175–192. [Google Scholar] [CrossRef]
- Valzolgher, C.; Alzhaler, M.; Gessa, E.; Todeschini, M.; Nieto, P.; Verdelet, G.; Salemme, R.; Gaveau, V.; Marx, M.; Truy, E.; et al. The impact of a visual spatial frame on real sound-source localization in virtual reality. Curr. Res. Behav. Sci. 2020, 1, 100003. [Google Scholar] [CrossRef]
- Warren, D.H. Intermodality interactions in spatial localization. Cogn. Psychol. 1970, 1, 114–133. [Google Scholar] [CrossRef]
- Warren, D.H.; Welch, R.B.; McCarthy, T.J. The role of visual-auditory “compellingness” in the ventriloquism effect: Implications for transitivity among the spatial senses. Percept. Psychophys. 1981, 30, 557–564. [Google Scholar] [CrossRef] [Green Version]
- Etchemendy, P.E.; Abregú, E.; Calcagno, E.R.; Eguia, M.C.; Vechiatti, N.; Iasi, F.; Vergara, R.O. Auditory environmental context affects visual distance perception. Sci. Rep. 2017, 7, 1–10. [Google Scholar] [CrossRef] [Green Version]
- Best, V.; Baumgartner, R.; Lavandier, M.; Majdak, P.; Kopčo, N. Sound externalization: A review of recent research. Trends Hear. 2020, 24, 2331216520948390. [Google Scholar] [CrossRef]
- Carpentier, T.; Noisternig, M.; Warusfel, O. Twenty years of Ircam Spat: Looking back, looking forward. In Proceedings of the 41st International Computer Music Conference (ICMC), Denton, TX, USA, 25 September–1 October 2015; pp. 270–277. [Google Scholar]
- Lochner, J.; Burger, J. The subjective masking of short time delayed echoes by their primary sounds and their contribution to the intelligibility of speech. Acta Acust. United Acust. 1958, 8, 1–10. [Google Scholar]
- Polack, J.D. Modifying chambers to play billiards: The foundations of reverberation theory. Acta Acust. United Acust. 1992, 76, 256–272. [Google Scholar]
- Abel, J.S.; Huang, P.; Abel, J.S.; Huang, P. A simple, robust measure of reverberation echo density. In Audio Engineering Society Convention 121; Audio Engineering Society: New York, NY, USA, 2006. [Google Scholar]
- Stewart, R.; Sandler, M. Statistical measures of early reflections of room impulse responses. In Proceedings of the 10th International Conference on Digital Audio Effects (DAFx-07), Bordeaux, France, 10–15 September 2007; pp. 59–62. [Google Scholar]
- Massé, P.; Carpentier, T.; Warusfel, O.; Noisternig, M. Denoising directional room impulse responses with spatially anisotropic late reverberation tails. Appl. Sci. 2020, 10, 1033. [Google Scholar] [CrossRef] [Green Version]
- Jot, J.M.; Cerveau, L.; Warusfel, O. Analysis and synthesis of room reverberation based on a statistical time-frequency model. In Audio Engineering Society Convention 103; Audio Engineering Society: New York, NY, USA, 1997. [Google Scholar]
- Barron, A.; Rissanen, J.; Yu, B. The minimum description length principle in coding and modeling. IEEE Trans. Inf. Theory 1998, 44, 2743–2760. [Google Scholar] [CrossRef] [Green Version]
- Jesteadt, W.; Wier, C.C.; Green, D.M. Intensity discrimination as a function of frequency and sensation level. J. Acoust. Soc. Am. 1977, 61, 169–177. [Google Scholar] [CrossRef]
- Peirce, J.; Gray, J.R.; Simpson, S.; MacAskill, M.; Höchenberger, R.; Sogo, H.; Kastman, E.; Lindeløv, J.K. PsychoPy2: Experiments in behavior made easy. Behav. Res. Methods 2019, 51, 195–203. [Google Scholar] [CrossRef] [Green Version]
- Anderson, P.W.; Zahorik, P. Auditory/visual distance estimation: Accuracy and variability. Front. Psychol. 2014, 5, 1097. [Google Scholar] [CrossRef] [Green Version]
- Valente, D.L.; Braasch, J. Subjective scaling of spatial room acoustic parameters influenced by visual environmental cues. J. Acoust. Soc. Am. 2010, 128, 1952–1964. [Google Scholar] [CrossRef]
- Moon, H.G.; Noh, J.U.; Sung, K.M.; Jang, D.Y. Reverberation cue as a control parameter of distance in virtual audio environment. IEICE Trans. Fundam. Electron. Commun. Comput. Sci. 2004, 87, 1822–1826. [Google Scholar]
- Messonnier, J.C.; Moraud, A. Auditory distance perception: Criteria and listening room. In Audio Engineering Society Convention 130; Audio Engineering Society: New York, NY, USA, 2011. [Google Scholar]
- Bradley, J.S.; Reich, R.; Norcross, S. A just noticeable difference in C50 for speech. Appl. Acoust. 1999, 58, 99–108. [Google Scholar] [CrossRef]
- Ashmead, D.H.; Leroy, D.; Odom, R.D. Perception of the relative distances of nearby sound sources. Percept. Psychophys. 1990, 47, 326–331. [Google Scholar] [CrossRef]
- Brungart, D.S.; Rabinowitz, W.M. Auditory localization of nearby sources. Head-related transfer functions. J. Acoust. Soc. Am. 1999, 106, 1465–1479. [Google Scholar] [CrossRef] [PubMed] [Green Version]
- Zahorik, P. Auditory display of sound source distance. In Proceedings of the International Conference on Auditory Display, Kyoto, Japan, 2–5 July 2002; pp. 326–332. [Google Scholar]
- Mershon, D.H.; Ballenger, W.L.; Little, A.D.; McMurtry, P.L.; Buchanan, J.L. Effects of room reflectance and background noise on perceived auditory distance. Perception 1989, 18, 403–416. [Google Scholar] [CrossRef] [PubMed]
- Sandvad, J. Auditory perception of reverberant surroundings. J. Acoust. Soc. Am. 1999, 105, 1193. [Google Scholar] [CrossRef]
- Kolarik, A.J.; Pardhan, S.; Cirstea, S.; Moore, B.C. Using acoustic information to perceive room size: Effects of blindness, room reverberation time, and stimulus. Perception 2013, 42, 985–990. [Google Scholar] [CrossRef]
- Cabrera, D.; Jeong, C.; Kwak, H.J.; Kim, J.Y. Auditory room size perception for modeled and measured rooms. In Proceedings of the INTER-NOISE and NOISE-CON Congress and Conference Proceedings, Dearborn, MI, USA, 12–14 July 2005; Volume 2005, pp. 2995–3004. [Google Scholar]
- Kearney, G.; Gorzel, M.; Rice, H.; Boland, F. Distance perception in interactive virtual acoustic environments using first and higher order ambisonic sound fields. Acta Acust. United Acust. 2012, 98, 61–71. [Google Scholar] [CrossRef]
- Udesen, J.; Piechowiak, T.; Gran, F. The effect of vision on psychoacoustic testing with headphone-based virtual sound. J. Audio Eng. Soc. 2015, 63, 552–561. [Google Scholar] [CrossRef]


Publisher’s Note: MDPI stays neutral with regard to jurisdictional claims in published maps and institutional affiliations. |
© 2021 by the authors. Licensee MDPI, Basel, Switzerland. This article is an open access article distributed under the terms and conditions of the Creative Commons Attribution (CC BY) license (https://creativecommons.org/licenses/by/4.0/).
Share and Cite
Martin, V.; Viaud-Delmon, I.; Warusfel, O. Effect of Environment-Related Cues on Auditory Distance Perception in the Context of Audio-Only Augmented Reality. Appl. Sci. 2022, 12, 348. https://doi.org/10.3390/app12010348
Martin V, Viaud-Delmon I, Warusfel O. Effect of Environment-Related Cues on Auditory Distance Perception in the Context of Audio-Only Augmented Reality. Applied Sciences. 2022; 12(1):348. https://doi.org/10.3390/app12010348
Chicago/Turabian StyleMartin, Vincent, Isabelle Viaud-Delmon, and Olivier Warusfel. 2022. "Effect of Environment-Related Cues on Auditory Distance Perception in the Context of Audio-Only Augmented Reality" Applied Sciences 12, no. 1: 348. https://doi.org/10.3390/app12010348
APA StyleMartin, V., Viaud-Delmon, I., & Warusfel, O. (2022). Effect of Environment-Related Cues on Auditory Distance Perception in the Context of Audio-Only Augmented Reality. Applied Sciences, 12(1), 348. https://doi.org/10.3390/app12010348