Abstract
In the current paper, a novel experimental methodology to characterize the contact behavior on thin plates under bending is presented. The method is based on the experimental measurement of the indentation observed during contact experiments. Tests were conducted using aluminum thin plates and a steel sphere to evaluate the effect of thickness and bending during contact. For this purpose, a non-contact optical technique, 3D Digital Image Correlation (3D-DIC), has been employed to measure the out-of-plane displacements experienced at the rear face of the specimens (opposite where the contact is occurring). An indirect measurement of the experimental contact law is obtained for different plate thicknesses (2 mm, 3 mm, 4 mm, 5 mm and 6 mm) as the contact load increases. An energy balance performed during contact experiments made it possible to evaluate and quantify the applied energy to generate bending and contact deformation. When the specimen thickness increases from 2 mm to 6 mm, contact deformation reaches higher values from the total applied energy. In addition, it is also possible to evaluate the portion of the elastically recovered energy for contact and bending deformation during the unloading. It has been observed that thicker specimens show a lower elastic energy recovery due to bending and a higher elastic energy recovery due to contact. Results clearly show how the ratio between absorbed and applied energy changes as the specimen thickness increases, highlighting the relevance of the proposed method for the characterization of contact behavior in thin plates.
1. Introduction
The analysis of structural damage caused by an impact or quasi-static event on a structure is a widely studied problem. The contact phenomenon between two bodies has been widely analysed and investigated in the past [1]. Hertz adopted some assumptions for the calculation of local deformations, assuming that each body could be regarded as an elastic half-space. Besides this main assumption, many efforts have been done to consider the effect of permanent deformation. Early studies were mainly focused on the elastic/elastoplastic behavior of isotropic materials [2,3]. The same concept was also extrapolated to the analysis of anisotropic and orthotropic materials [4,5]. However, when half-space conditions are not achieved, the experimental determination of a static contact law is crucial to the evaluation of the material contact behavior since measured indentation values are strongly affected by the specimen deflection during the test [4,6].
Many authors have conducted contact experiments using metallic or composite plates and a spherical indenter to validate the proposed analytical and numerical models, such as Wagih et al. [4] and Breumier et al. [4,7] reported. However, in most of the cases the bending effect was overlooked by assuming that the half-space conditions were achieved or the plate was properly supported. Nevertheless, in a real experiment, when the load is applied, the contact behavior is influenced by the plate thickness and its deflection [8]. Recently, Chen et al. [9] proposed an analytical model which included the influence of the specimen thickness to consider the effect of bending during contact. The reported experimental set up to measure indentation by Boyce et al. [10] and Saadatfard et al. [11] was crucial in the performed contact analysis providing high accuracy results. However, most of the reported methodologies so far are not able to differentiate accurately between the induced deformation due to bending and contact respectively. An example is the set-up proposed by Wagih et al. [4], who were able to quantify indentation but not the bending occurring during experiments, which could lead to inaccurate indentation results. Similar problems were found by other authors such as Sutherland et al. [12], and Daniel et al. [13], who minimized the bending effect using fully supported plate geometry and measuring from both faces of the specimens, and hence introducing more variability and less precision in the results. An alternative solution was then adopted by McMillan et al. [14], who subtracted from experimental results the estimated deflection calculated from Finite Element Analysis to obtain the true relative approach as a function of applied load. Moreover, in the case of impact tests, indentation was measured after the impact and using manual methodologies [15,16] showing discrepancies with the static contact law depending on the loading rate.
Within this framework, large efforts have been performed towards the development of light-weight structures for high performance in dynamics applications using thin plates. Within this context, it is worth noting relevant works published in this field [17,18].
The purpose of this paper is to present a novel experimental methodology to characterize the contact behavior of thin plates with different thicknesses using a full-field technique. Thicknesses between 2 mm and 6 mm have been used so as to be considered as thin plates with ratios a/h between 10 and 100 [19], where h is a typical dimension of a plate in a plane and h is the plate thickness. To illustrate the potential of the proposed methodology for the analysis of contact problems with the presence of bending deformation, a quasi-static contact experiment has been performed using a rigid bearing sphere on an aluminum plate to quantify the indentation occurring when increasing the contact load. The influence of bending in the contact law depends on the specimen thickness. To avoid some of the main difficulties reported by other authors to obtain accurate measurements, a full-field optical technique known as 3D-DIC (Three Dimensional Digital Image Correlation) has been used. Some authors, such as preliminary studies using DIC to analyze the contact phenomenon were reported for other applications Brake et al. [20] and Baca et al. [21] have performed preliminary studies using the DIC technique to analyze the contact phenomena for other applications. In a contact test using conventional techniques, the indenter usually hides the area of interest and it represents a limitation in the measuring process during the experiment, as it was reported by Jamari and Schipper [22] in the experiment designed. In the presented setup, the indenter was fixed while the specimen was rigidly clamped to a movable loading frame. Thus, cameras were placed to record the face of the specimen opposite to that where contact was taking take place. In this way, it was possible to quantify bending and indentation measurements during the loading and unloading path. With the proposed methodology, it is possible to quantify the portion of applied energy employed to generate contact damage and bending deformation. In addition, it is also possible to evaluate the portion of the elastically recovered energy for contact and bending deformation during the unloading. Therefore, the absorbed energy due to the permanent indentation and bending can be inferred. Another important aspect investigated has been the influence of the specimen stiffness. The proposed methodology has been validated using conventional indentation-measuring techniques reported in literature, highlighting the potential of the proposed approach for the analysis of contact problems and its extrapolation to dynamic events such as impact.
The first attempt to develop a theory based on the quantification of indentation produced by two loaded bodies in contact was suggested by Hertz [1]. Hertz theory was developed to study a static loading event on isotropic linear elastic half-space. The particular case of a sphere and a planar surface gave the relation between indentation, defined as the relative displacement of the indenter and the bottom face of the specimen, and the contact load. It is well known that this theory considers elastic conditions on homogeneous isotropic materials without the presence of damage and deflection of the specimen. However, once the yield strength of the material is exceeded, permanent indentation is generated, even for low loads. Hence, literature shows that some efforts have been made in order to consider the effect of permanent deformation by contact during the loading and unloading in plates [23].
More complex theories using elastoplastic contact laws combining Hertz theory and the effect of plastic deformation produced by the contact load in composites materials are also available in the literature [24,25]. In these theories, three phases are specified, elastic and elastoplastic during the loading and the unloading phases. In this case, the bending effect of the fully supported plate is not considered.
However, not many experimental approaches for the determination of the contact law can be found in the literature. In addition, previous authors such as Ghaednia et al. [26] reported some difficulties in accurately measuring indentation. In some cases, bending was avoided even when it was known that it had a relevant influence in the contact law determination [27]. In addition, some investigators such as Lee and Liu [15] and Spronk et al. [28] have also incorporated static contact laws for the analysis of impact problems even when it was reported that for dynamic condition the contact law differed from the static contact law [15,28].
DIC is a full-field and non-contact optical technique for strains and displacements measurements in structural components under loading. During the deformation, a sequence of images showing a random gray intensity (speckle) over the surface are captured during the test. Each image is divided into square virtual subsets or facet in pixels, centered at a point P (X0,Y0,Z0). Every facet presents a different gray scale of intensity. During the deformation, some algorithms of correlation [29] track the speckle contained into a facet. Each facet at the reference image is searched in the deformed image P’(X’0,Y’0,Z’0). The result is a displacement vector located in the center of each virtual facet.
When a stereoscopic system is adopted (3D-DIC), a minimum of two cameras or a mirror-based system is required. Thus, out-of-plane displacement and strains over the surface of the specimen can be computed. In this case, the system must be previously calibrated [30,31]. Although many factors are involved, errors in measurements are kept lower than 0.1 mm for most DIC-3D applications [32,33].
DIC technique has been widely employed in many fields in experimental mechanics; however, due to the nature of the technique (non-contacting and full-field), its application is highly interesting for the analysis of contact problems. However, no information has been found in the literature related to the application of 3D-DIC to the analysis of contact problems. In this study, the relative out-of-plane displacements in the thickness direction of the specimen have been measured using 3D-DIC. The indentation during a quasi-static test between a plane specimen and a rigid sphere has been experimentally measured and evaluated in thin aluminum plates. As a result, the experimental contact law behavior and the effect of bending have been quantified.
2. Materials and Methods
The experimental stage was performed using specimens from commercial AL-1050 H-14 (see Table 1 for main properties from the manufacturer [34]) and cut by a waterjet technique from 2 m × 1 m sheets with different thicknesses, namely 2 mm, 3 mm, 4 mm, 5 mm and 6 mm. In all cases, the adopted geometry was a square of 150 mm × 150 mm.

Table 1.
Aluminum 1050 H14 properties [34].
Each specimen was clamped using a frame which covered the specimen 15 mm from each edge, leaving a free area of 120 mm × 120 mm. To evaluate indentation when the monotonic load increased, 3D-DIC was adopted. For this purpose, the surface was treated by painting it first with white paint and subsequently black paint was sprayed to generate a speckle pattern over the surface. The presence of bending during experiments induced a break of the paint at the area where the indenter was contacting the specimen generating a lack of information. To overcome this problem, a wet white coating was applied instead.
For 3D-DIC, two monochromatic CCD (Charge-Coupled Device) 5-megapixel cameras (brand Allied Vision Technologies, model Stingray F-504 B/C) were employed. Additionally, two 23 mm focal length lenses (brand Schneider) were employed. The cameras were synchronized and monitored from a laptop connected to a DAQ (Data Acquisition System) and a halogen light (brand Hedler, model DX15, 150W) to illuminate the specimen. The stereoscopic system was mounted on a tripod and subsequently calibrated. Finally, the displacements fields occurring at the specimen surface during loading and unloading stages were measured using the commercial software package VIC-3D, from Correlated Solutions Inc. [31,35].
To measure indentation during monotonic loading, 3D-DIC technique was adopted. Tests were conducted using a MTS 370.02 servohydraulic machine with a maximum load capacity of 25 kN, where grips were removed and replaced by a loading frame. The top part of the loading frame was clamped to the hydraulic cylinder, while the bottom part was attached to the machine body frame. Thus, the top part of the structure could move in a vertical direction through four guides to ensure a perpendicular application of the monotonic loading during experiments (Figure 1a). Each specimen was clamped using a frame which covered 15 mm of the specimen from each edge (the free area for analysis was a square of 120 mm side). Different specimen thicknesses were analyzed to evaluate the effect of bending during indentation.
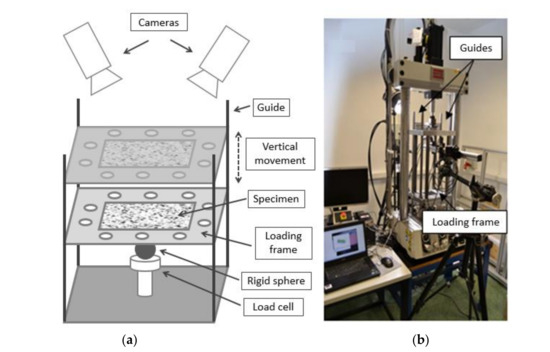
Figure 1.
(a) Schematic of the setup to perform the experiments; (b) laboratory-adopted setup for the proposed experimental methodology.
A Ø20 mm spherical indenter (steel ball bearing) was screwed using an adaptor to a load cell to acquire the load magnitude during experiments. During indentation experiments, the plate was loaded against the sphere. As recommended by Mata [36], the plate was previously lubricated with industrial oil to consider an almost-frictionless contact. Even if the contact is not lubricated, the effect of friction could be neglected, especially for non-sharped indenters, where differences of 4% in loading curves were reported by Harsono et al. [37]. Figure 1b shows the setup of the experiment.
2.1. Experimental Methodology
During the experiments, the specimen loading and unloading stages were programmed and controlled using the registered displacement by the hydraulic cylinder. This issue was extremely important since the aluminum employed for experiments had an almost perfect elastic plastic behavior. Thus, when the material yielded, a force control was not possible since the results were inaccurate. The hydraulic machine was governing the adopted optical system to ensure that images were captured in a synchronized way. Thus, +5 V TTL pulse was generated to trigger the cameras. For each displacement step, the load, the cylinder displacement, and the time for each camera-acquired image were registered. As previously indicated, different specimen thicknesses were tested to evaluate bending during contact. The indentation was measured at the back of the contact surface of the plate, evaluating the thickness reduction of the plate, where the indenter is in contact with the specimen. Thus, the location with minimum out-of-plane displacement variation was identified for each image using a routine written in Matlab®. The script takes the output data from VIC-3D (displacements in matrix structures) and a loop cycle links the minimum displacement with the corresponding load, as both systems were synchronized. The measured out-of-plane displacement values were referred to a reference image, corresponding to zero indentation to obtain the indentation value for each loading state.
As illustrated in Figure 2, the location with minimum out-of-plane displacement provided the indentation value, α, for each displacement step, assuming that the indenter did not deform during the experiment. This assumption was realistic since the adopted aluminum material was very soft compared with the indenter material. In addition, the deformation due to membrane and transverse shear deformation was neglected, simplification considering that small displacements were induced to the plates [38]. Figure 2a shows that maximum out-of-plane displacement, d, occurred at the edge of the plate or the clamped perimeter in this case. Therefore, the energy applied for bending deformation was obtained after evaluating the maximum deflection experienced by the plate during the experiment [39]. The maximum deflection was calculated as the displacement differences between the edge of the plate, d, and the peak point where the indenter was contacting. During the test, the frame displacement was also measured using DIC. It was observed that there were some differences between the displacement provided by the hydraulic cylinder and the measured displacement at the loading frame. These differences were attributed to elastic energy absorption occurring at the loading frame during the test. Thus, the maximum bending displacement experienced by the plate is the difference between d and α. In Figure 2a, the area with the minimum out-of-plane displacement is highlighted. For a better understanding of the mechanical behavior of the plate at this area, a simple test was performed and illustrated in Figure 2b. It was obtained from an indented plate in which a section was made just in the profile in contact with the indenter. A profile projector using a 10X magnifier (brand Nikon, model V-20, Japan) was used to accurately measure the thickness. As is observed in Figure 2b, the plate experiences the greatest thickness reduction at the contact point with the bearing ball. On the back face of the plate, it was measured 0.19 mm out-of-plane displacement. Therefore, comparing the thickness measurement at this point (1.81 mm) shows the indentation value considering the assumption commented above.
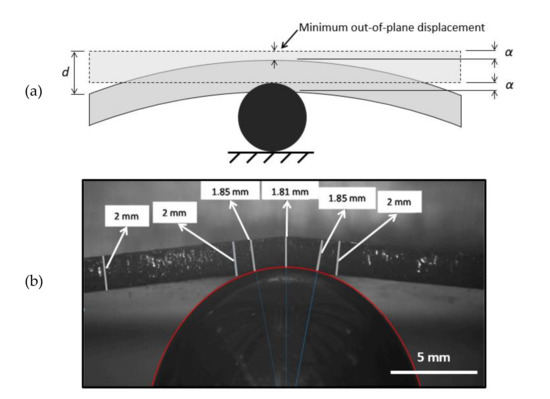
Figure 2.
(a) Schematic illustration showing the indentation measurement principle during a contact experiment which includes bending. (b) Real test illustrating the thickness reduction at the contact area and the indentation measurement.
As a result of the test, a force versus the indentation plot was obtained. The analysis was performed for loading and unloading and indentations and deflection were inferred measuring at the edges of the specimen clamped to the load frame.
Prior to start the tests, a preload of 25 N was applied to ensure a contact between the plate and the sphere. Subsequently, when the test was started, a TTL pulse was automatically generated and sent to both cameras to acquire images from the 3D-DIC system. Figure 3 shows a flow chart summarizing the implemented experimental methodology. During step 1, the cylinder was moved with a displacement rate of 0.1 mm/s during both loading and unloading, controlled by the LVDT (Linear Variable Displacement Transducer). The maximum cylinder displacement was limited to 2 mm. During this displacement interval, images were captured. In step 2, images were post-processed to obtain the out-of-plane displacements field to infer the indentation and the deflection experienced by the specimen during each deformation step. Finally, during step 3, the load for every captured image was plotted (load from image) versus the measured displacements using 3D-DIC. The test was finished when the load cell reading was below 25 N, which meant that no contact existed between the sphere and the specimen.
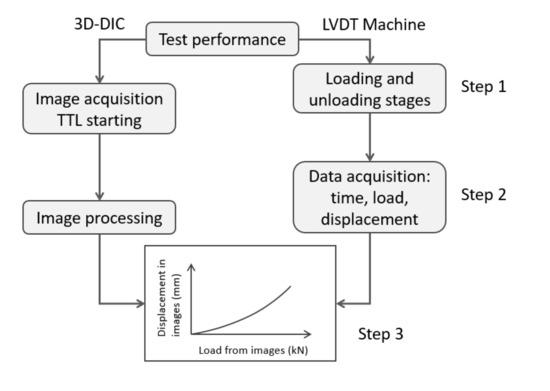
Figure 3.
Flow chart illustrating the implemented experimental methodology to extract test results.
After the results were obtained, a post-processing analysis was conducted. For each test, it was plotted indentation results versus load, as Figure 4 shows as an example. For contact behavior, as it is shown in Figure 4, the area under the loading branch was the energy employed to indent the specimen, while the area under the unloading branch was the recovered elastic energy [39,40]. The difference between both areas was the absorbed energy to produce local contact damage at the contact area [41]. In this case, it was plotted the maximum bending deflection vs. load. Again, part of the energy was stored during the loading and unloading paths. The stored energy (differences of areas between both paths) was the energy absorbed due to plastic deformation as a result of bending.
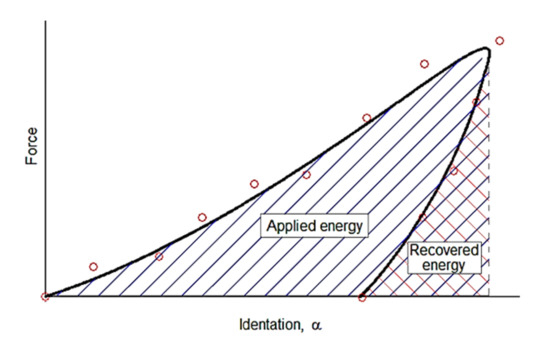
Figure 4.
Evaluation of the absorbed energy due to contact during an experiment.
Therefore, for this case, the general energy balance is [39]:
where the term ET is the energy applied to the specimen, Ec is the involved energy due to contact, Eb is the involved energy due to bending and Esys is the elastic energy absorbed by the loading frame during the test. Both energies terms Ec and Eb, have an elastic component that is recovered during the unloading path, (Ec,elastic and Eb,elastic) and a plastic component that is absorbed by the specimen, which is responsible for the remaining permanent damage after the load is removed (Ec,plast and Eb,plast). Thus, the energy balance is presented as:
According to the experimental methodology previously proposed, it is possible to evaluate the energy transferred due to contact and bending for each loading state [39]. Esys was evaluated by comparing the displacements of the machine actuator provided by the LVDT and those measured using DIC for the clamp frame holding the specimen.
2.2. Experimental Validation of the Proposed Methodology
Before performing the experimental analysis, a preliminary experiment was conducted to evaluate the measurement uncertainty of the proposed 3D-DIC setup. The test was carried out without specimen. Consequently, the movement of the hydraulic cylinder was entirely transferred to the loading frame. Then, only the motion as a rigid body was measured without any load application. The cylinder was moved up to 3 mm in six sequent displacement steps of 0.5 mm. Hence, the displacement data provided by the LVDT sensor in the hydraulic machine were compared with those measured by the 3D DIC system. Thus, the measurement uncertainty of the technique was evaluated. A statistical analysis was subsequently performed. The mean, µ, and variance, s2, of the measurement differences between 3D-DIC (values in the considered region of analysis) and the LVDT was calculated for each vertical displacement step according to the following expressions [42].
where I is the number of experimental points evaluated and hi is the relative error in the measurement. Values for the mean error, µ, and standard deviation of the error, s, at each displacement step were evaluated. Table 2 shows the average mean and the standard deviation for the different displacements steps.
Table 2.
Results of the mean and the variance of the measurement differences between 3D DIC and LVDT for each displacement step.
In general terms, the experimental results from 3D-DIC matched with the LVDT measurements with a very low scatter. Statistical calculations such us the mean and the standard deviation clearly show the high level of concordance where values are lower than 0.20% and 0.15%, respectively. Moreover, the average mean for the different displacements step was lower than 2·10−3 mm and the average standard deviation lower than 1·10−3 mm.
As a second part of the validation, two experiments were performed. Subsequently, the accuracy and repeatability of the setup were quantified using 2 mm thick specimens. A battery of 20 tests was performed to measure the indentation at different loading levels. Firstly, indentation measurements were performed 10 times using a dial indicator and also 10 times using 3D-DIC. During the experiments, the indenter was moved 2 mm down (once the indenter touched the specimen, as reference) in steps of 0.1 mm at 0.1 mm/s, as programmed in the hydraulic cylinder. Between steps, a dwell and a TTL pulse were set to trigger both cameras. Then, the load, the dial indicator measurement and both cameras’ shots were logged at each step. As previously indicated, a 25 N preload was set for each test. The gauge head of the used dial indicator, which has an accuracy of 1·10−3 mm, was placed and vertically aligned with the center of the sphere, in the non-contact side of the specimen. Figure 5 shows the results obtained for four of these indentation experiments using the dial indicator and DIC technique simultaneously. Error bars show a deviation percentage of ±6% respect to the average value. It can be observed that in all the cases, experimental results are within the error bars which indicate that repeatability of the results. During the unloading path, values were also inside of the 6%; however, more scatter in the results was found. Figure 5b shows the same test conditions as in Figure 5a, but in this case 3D-DIC was employed. Figure 5c overlays the results of both techniques. In all the cases, differences are smaller than 6%, using this value as a reference from the previously calculated dispersion bands of 3D-DIC. These differences in the indentation results could be associated to small deviations in the position of the dial gauge or to a slight loss of perpendicularity of the gauge when large deflections are experienced due to bending.
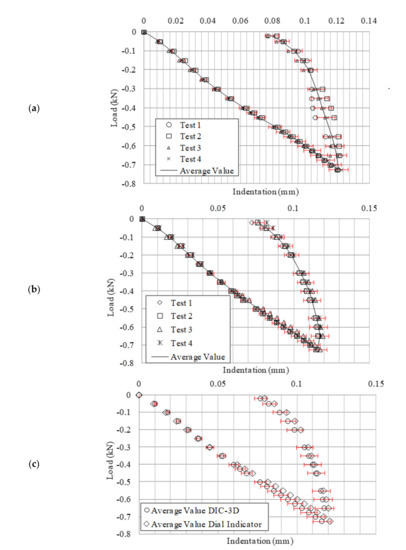
Figure 5.
(a) Tests results for the dial indicator setup; (b) tests results for 3D-DIC setup; (c) results comparison using 3D-DIC and the dial indicator.
As has been presented in Figure 5a,b, the repeatability of indentation measurements has been achieved using two different experimental techniques. 3D-DIC technique provides the indentation measurement and the information related to the contact area between the indenter and the specimen. The maximum indentation point was clearly identified using DIC-3D, while the dial indicator was very sensitive to the gauge head position. Moreover, less scatter has been observed in the results from 3D-DIC when they are compared with those obtained by the dial indicator. During unloading, results were noisier; however, 3D-DIC results again showed less scatter than those obtained with the dial indicator. Only results from four experiments have been presented in Figure 5a,b to have a clear comparison of the results obtained with both techniques. As it is shown, differences were smaller than 6% in all cases. Then, it can be summed up that the adopted setup provides an accurate, repeatable and robust procedure to obtain the material quasi-static contact law. Furthermore, 3D-DIC makes it possible the extrapolation of this methodology to dynamic experiments.
3. Results and Discussion
In this section, the experimental results from the analysis of the contact and bending deformation of the specimen using 3D-DIC during the tests will be analyzed and discussed.
To establish the contact model, images from both cameras were captured during the test at each displacement step and post-processed using the 3D-DIC technique. The facet size was set to 25 × 25 pixels with an overlap of 2 pixels. As an example, Figure 6 shows the measured out-of-plane displacements in a 2 mm thick specimen for different cylinder displacements. They show the cylinder displacement of 0 mm, 0.72 mm, 1.57 mm and 2 mm, which corresponds to 0 mm, −0.05 mm, −0.096 mm and −0.111 mm indentation and loads of 0 N, 320 N, 611 N, and 731 N, respectively.
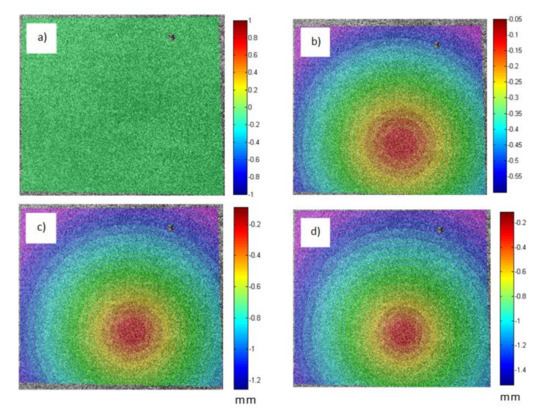
Figure 6.
Out-of-plane displacements at the region of analysis when a 2 mm thick specimen is analysed at different loads: (a) 0 mm and 0 N; (b) −0.05 mm and 320 N; (c) −0.096 mm and 611 N; (d) −0.111 mm and 731 N.
For each displacement step of the cylinder (from 0 mm to 2 mm), indentation values were evaluated and the applied load was measured to obtain the experimental contact model. Figure 7 shows the experimental contact force for a 2 mm thick specimen. As it can be observed, the maximum indentation value was −0.111 mm, which corresponded to 731 N compression load. After this value was reached, an elastic recovery of the material was observed during the unloading path show in the graph. The measured permanent indentation was −0.059 mm. In the figure, it is observed a small scattering that could be associated with the material behavior during plasticity produced due to contact.
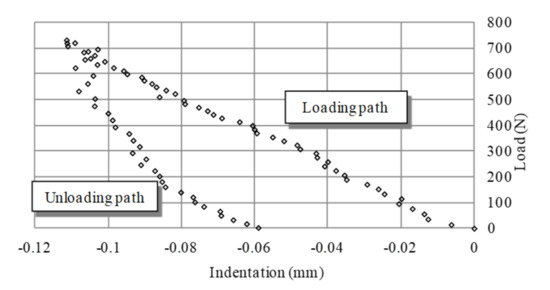
Figure 7.
Experimental contact force for a 2 mm thick specimen.
The same procedure was followed to the rest of specimen thicknesses. Figure 8 shows the experimental contact force for 3 mm, 4 mm, 5 mm and 6 mm thick specimens. The indentations were −0.189 mm, −0.279 mm, −0.359 mm and −0.447 mm, which corresponded to a maximum compression load of 1758 N, 3745 N, 4791 N and 6274 N respectively. It is observed that, as the specimen stiffness (i.e., thickness) increases, more contact damage occurs. For 6 mm thick specimen, the highest contact damage is reached. The permanent indentation after the load was removed was −0.114 mm, −0.190 mm, −0.235 mm and −0.313 mm for the different specimen thicknesses of 3 mm, 4 mm, 5 mm and 6 mm, respectively. It is also noticed that the signal noise is being reduced as the thickness and load increases in both loading and unloading stages.
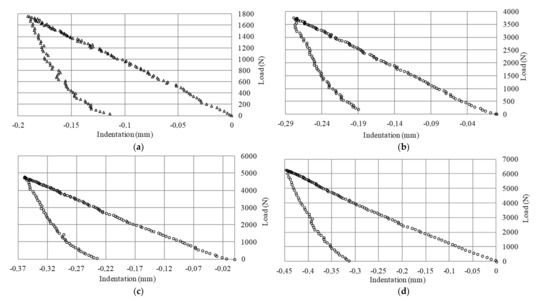
Figure 8.
Experimental contact force for: (a) 3 mm; (b) 4 mm; (c) 5 mm and (d) 6 mm thick specimens.
To compare results for different specimen thicknesses, Figure 9a shows the normalized contact load as a function of the indentation/thickness ratio for different specimen thicknesses. It is observed an increase in the indentation/thickness ratio as the specimen thickness increases. An explanation for this effect is that the contact damage is more significant as the specimen stiffness increases. Although it is not presented in Figure 9, similar behavior was observed for 3 mm and 5 mm thicknesses. Thus, increasing the specimen thickness implies higher contact damage, showing indentations of 2% of the initial thickness in 3 mm thick specimens to 5% of the initial thickness in 6 mm thick specimens. Increasing the specimen thickness enhances the bending stiffness and the transferred ball pressure increases as the ball displacement is imposed. Nevertheless, the bending deformation is more relevant when the specimen thickness is smaller. Figure 9b shows the specimen maximum relative deflection experienced for different specimen thicknesses. As previously mentioned, the maximum specimen deflection was obtained as the out-of-plane displacement difference between the clamped edge and the position of minimum indentation, it represents the maximum bending deformation experienced by the specimen. Results show how the specimen with less stiffness experiences a higher bending deformation. From this information, it is possible to extract the involved energy to generate the contact damage and bending deformation at the specimen. The same conclusions could be obtained from the energy point of view. As shown in Figure 8, the area under the curve is higher for thicker specimens, which means that more energy has been used to create the contact damage.
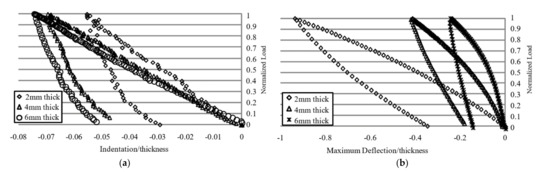
Figure 9.
(a) Normalized contact load as a function of the indentation/thickness ratio for different specimen thicknesses, (b) normalized contact load as a function of the maximum deflection/thickness ratio for different specimen thicknesses.
Once the information related to the contact model and bending experienced by the specimen was obtained, an energy analysis was performed, as Figure 4 shows. Table 3 summarizes the values of applied, absorbed and recovered energy for contact experiments with different specimen thicknesses. These values were obtained by quantifying the areas under the experimental plot measurements, as explained in Figure 4. As shown in Table 3, the total applied energy increases as the thickness increases, due to higher stiffness being involved. Similarly, both elastic energy and absorbed energy to generate permanent damage in contact increases as the thickness increases, while the bending energy (elastic and plastic) is consequently reduced as the thickness increases. It supports the assertion of higher thicknesses leading to higher contact damage. As the supporting structure was designed for high loads, the absorbed energy in the system remains below 2% for all cases, although a slight increase is shown when the specimen stiffness increases.
Table 3.
Energy balance for contact experiments with different specimen thicknesses.
To perform a comparison between experiments with different specimen thicknesses, Figure 10a shows the evolution of the applied energy due to contact normalized by the total applied energy versus the normalized load for three different thicknesses. As expected, the absorbed energy by contact increases for any thickness as the load increases. For the analysed and equally spaced thicknesses, the gap between curves tends to be also equally spaced. Nevertheless, this trend will disappear for very high thicknesses, in which most energy will be dissipated in the contact as permanent damage. It can be observed in Figure 10, where the plastic energy increases faster than the elastic energy as thickness increases. It could be explained taking into account that thicker specimens enhance the indentation-induced damage, while thin plates absorbed most of energy as bending. Consequently, the total applied bending energy tends to be lower as thickness increases, as is shown in Figure 10b. The rate of applied energy in contact increases as the thickness increases, whereas the rate of bending energy is going lower. To sum up, stiffness increases the contact forces at the ball contact point, which lead to deeper indentations, higher applied energy at contact, and lower applied energy for bending energy. All of these effects are enhanced as thickness increases.
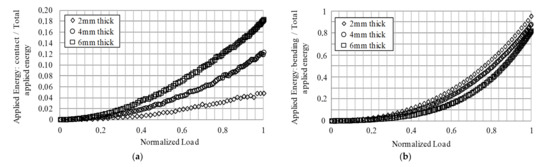
Figure 10.
(a) Normalized evolution of the applied energy due to contact versus normalized load for different specimen thicknesses. (b) Normalized evolution of the applied energy due to bending versus normalized load for different specimen thicknesses.
Figure 11 shows the percentage of applied energy due to contact and bending as a function of the specimen thickness. It is observed, that values of applied energy due to contact increases when specimen thickness increases linearly. In addition, for thicker specimens the percentage of applied energy due to bending decreases, also linearly.
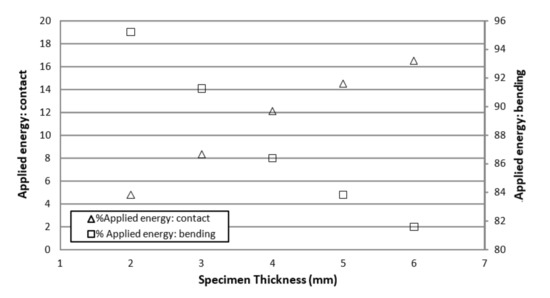
Figure 11.
Applied energy percentage due to contact and bending as a function of the specimen thickness.
Splitting up the applied energies into elastic and plastic, Figure 12 shows the percentage of recovered elastic energy due to contact and bending as a function of the specimen thickness. Again, the results illustrate that thicker specimens show a lower elastic energy recovery due to bending, while thinner specimens experience a higher elastic energy recovery. For the case of contact damage, the percentage of recovered energy increases with the specimen thickness.
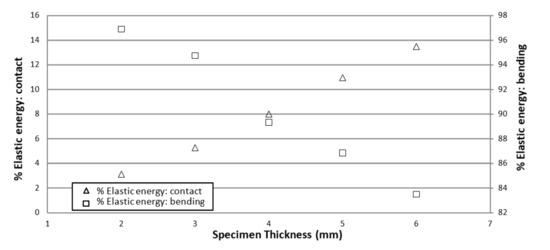
Figure 12.
Percentage of elastic recovered energy due to contact and bending as a function of the specimen thickness.
Figure 13 shows the percentage of absorbed energy due to contact and bending. The results are represented as a function of the specimen thickness. They support the results shown in Figure 10, where both the three curves and thicknesses (2 mm, 4 mm and 6 mm) are linearly spaced. It means a linear influence of thickness on the total applied energy.
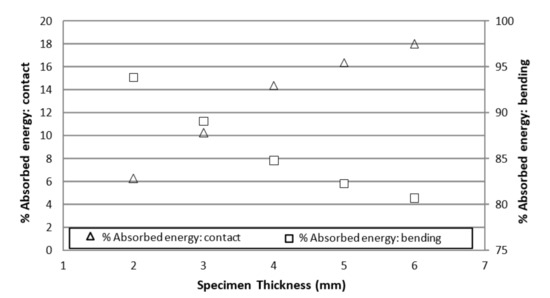
Figure 13.
Percentage of absorbed energy due to contact and bending as a function of the specimen thickness.
The energy evolution involved in different contact experiments conducted on aluminum specimens is shown in Figure 11, Figure 12 and Figure 13. It can be observed that the influence of bending drastically influences the energy absorption due to contact. An extreme case would be a half space where not bending occurred and all the percentage of the energy would be absorbed by contact damage. It is remarkable that, for 2 mm thick specimens, from the total applied energy, 4.8% is transformed to create contact damage; however, for thicker specimens this value is bigger, up to 16.5% for 6 mm thick specimens. These results are relevant for an accurate energy balance during experiments. The applied energy for bending deformation is decreasing for thicker specimens, being 81.6% of the applied energy for 6 mm thick specimens. During the unloading path, the recovered energy is evaluated, and therefore the absorbed energy is quantified. Thus, it is possible to distinguish between absorbed energy due to permanent contact damage and bending deformation. For a 6 mm thick specimen, around 18% of the total applied energy was absorbed to generate permanent contact damage. However, for the case of 2 mm thick specimens, only 6.27% of the energy was absorbed. The loading frame behavior was assumed as elastic, although a small portion of energy was absorbed, it could be neglected. It could be associated to the applied preload which is introduced by screws when clamping the specimen. The results shown in Figure 7 and Figure 8, and specifically the quasi-linearity in loading curve, reproduces the findings of other authors in metal specimens indented with spherical indenter.
Data in Figure 11, Figure 12 and Figure 13 could be fitted by third-order function. The flexural stiffness and compliance of an edge-clamped plate is related with the cubic power of the thickness [43]. On the other hand, the superficial indentation stiffness and harness (i.e. at contact point) do not depend on the plate flexural thickness as it is an intrinsic material property. Then, when the plate thickness is increased, the bending effect is going lower due to the higher thickness, which follows a thickness to the third power function. Consequently, the local contact damage absorbs a higher amount of energy. As an example, for very high thicknesses, the bending energy tends to be zero (both plastic and elastic), whilst the energy at the contact point tends to be equal to the applied energy. As a result, the highest contact damage as indentation is found in thick plates, while the highest bending deflections are shown for the smallest thicknesses. According to these figures, when the thickness tends to zero, the contact-associated energy decreases quickly. Despite the high accuracy of the method, it could lead to insufficient exactitude in these cases, although further experimentation should be addressed.
The proposed methodology could be used to characterize the contact behavior in dynamic events (e.g. impact) as high-speed cameras and DAQ are used, as well as indentation cycles experiments. Additionally, long-term effects (e.g. creep) could also be analysed at the different stages. It is specifically useful for thin or thick plates, when thicker geometry or raw material is not available, or the real application is based on thin plates. In these cases, bending effect cannot be neglected and the alternative methods find difficulties to analyze the contact and bending effect independently. Additionally, since the post-processing is able to evaluate the maximum indentation point and bending effect, the accuracy in the positioning is not affecting the final results. Alternative methods can be influenced by these factors. It could also be used for any material (such as metals or composites) and even for non-flat surfaces, specifically for high-stiffness materials.
Further analyses could be performed in order to correlate this method with harness methods, to be highlighted as potential and alternative applications. The presented method does not require accurate measurement of the real length or diameter of the indentation, so surface roughness, quality or the operator skills are not affecting the measurement. As an example, when the values of permanent indentation after removing the load (for 4 mm, 5 mm and 6 mm) are used, the assessed Brinell Harness ranges between 32 HB and 33 HB are obtained. Although the real value has not been measured, the data from the manufacturer specify 35 HB, and then the mean error for thickness between 4 and 6 mm is lower than 8%. For 2 mm and 3 mm thick specimens, the error is higher and some conclusions are drawn. The variations can be associated to the high curvature of plate at the indentation point because of bending effect. In these cases, the material is reducing the indentation depth as the contact surface is higher. Then, it can be concluded that small ball diameters should be used as the specimen is thinner, in order to highlight the contact and attenuate the bending effects. The application of this methodology could be extended for using other indenters such as pyramidal or conical. Its application could be limited for very thin specimens of very hard materials even using small indenters and further experimentation is required.
4. Conclusions
A novel full-field experimental methodology based on 3D-DIC measurements has been presented to determine the real contact law of thin plates. The adopted setup uses a perimeter-clamped squared plate and takes into account the influence of bending in the measured indentation during contact experiments on thin aluminum plates. To illustrate the proposed methodology, specific contact experiments with different specimen thicknesses have been conducted. During the experiments, images were captured using two CCD cameras to determine the full-field displacements pattern at the rear surface of the specimen.
The main conclusions from the study are:
- Results from the performed experiments made it possible to infer the experimental contact law for 2 mm, 3 mm, 4 mm, 5 mm and 6 mm thick specimens made of AL 1050 H14 and an energy balance was performed to quantify the amount of energy to generate contact damage and bending deformation.
- The recovered elastic energy during the unloading has been also quantified. Higher contact damage was observed as the thickness increases while bending effect is minimized when thickness increases.
- The adopted experimental methodology makes potentially possible the contact behavior evaluation at different loading rates as well as obtaining the real contact law and a complete energy balance during the test. Then, the proposed method could be used to characterize the contact behavior during impact events or creep effects.
- Additional experimentation could highlight some uses as a method to measure the contact laws and harness in complex geometries or scenarios.
Author Contributions
Conceptualization, F.-A.D.-G. and E.L.-A.; methodology, E.L.-A.; software, E.L.-A. and J.-A.A.-L.; validation, E.L.-A., J.-A.A.-L. and F.-A.D.-G.; formal analysis, F.-A.D.-G.; investigation, E.L.-A. and J.-A.A.-L.; writing—original draft preparation, E.L.-A. and J.-A.A.-L.; writing—review and editing, J.-A.A.-L.; visualization, L.R.-G.; supervision, L.R.-G.; funding acquisition, L.R.-G. All authors have read and agreed to the published version of the manuscript.”
Funding
This research was funded by CTA (Corporación Tecnológica de Andalucía) and the IDEA agency, in collaboration with Airbus Military through the contract “Análisis de desplazamiento y deformaciones en estructuras multifuncionales sometidas a impacto empleando la técnica DIC 3D HS” as part of the project “DESAFIO”.
Institutional Review Board Statement
Not applicable.
Informed Consent Statement
Not applicable.
Data Availability Statement
Data is contained within the article.
Acknowledgments
Authors would like to acknowledge Airbus Military, CTA (Corporación Tecnológica de Andalucía) and IDEA agency for supporting this work.
Conflicts of Interest
The authors declare no conflict of interest.
References
- Hertz, H. Über die Berührung Fester Elastischer Korper. J. Reine Angew. Math. 1881, 92, 156–171. [Google Scholar]
- Big-Alabo, A.; Harrison, P.; Cartmell, M.P. Contact model for elastoplastic analysis of half-space indentation by a spherical impactor. Comput. Struct. 2015, 151, 20–29. [Google Scholar] [CrossRef]
- Olsson, E.; Larsson, P.-L. A unified correlation model describing global properties at elastoplastic sharp indentation contact. Tribol. Int. 2016, 103, 252–260. [Google Scholar] [CrossRef]
- Wagih, A.; Maimí, P.; Blanco, N.; Trias, D. Predictive model for the spherical indentation of composite laminates with finite thickness. Compos. Struct. 2016, 153, 468–477. [Google Scholar] [CrossRef]
- Papa, I.; Formisano, A.; LoPresto, V.; Langella, A. Low velocity impact behaviour of reinforced plastic laminates: Indentation and penetration laws validated for different fibres and matrices. Compos. Part B Eng. 2019, 164, 61–66. [Google Scholar] [CrossRef]
- Cao, G.; Ren, Y. A paradox in mechanical property characterization of multilayer 2D materials based on existing indentation bending model. Int. J. Mech. Sci. 2020, 187, 105912. [Google Scholar] [CrossRef]
- Breumier, S.; Villani, A.; Maurice, C.; Lévesque, M.; Kermouche, G. Effect of crystal orientation on indentation-induced residual stress field: Simulation and experimental validation. Mater. Des. 2019, 169, 107659. [Google Scholar] [CrossRef]
- Hongkarnjanakul, N.; Rivallant, S.; Bouvet, C.; Miranda, A. Permanent indentation characterization for low-velocity impact modelling using three-point bending test. J. Compos. Mater. 2013, 48, 2441–2454. [Google Scholar] [CrossRef]
- Chen, P.; Xiong, J.; Shen, Z. Thickness effect on the contact behavior of a composite laminate indented by a rigid sphere. Mech. Mater. 2008, 40, 183–194. [Google Scholar] [CrossRef]
- Boyce, A.; Tankasala, H.; Fleck, N. Indentation of a layer on foam substrate. Int. J. Mech. Sci. 2019, 150, 379–392. [Google Scholar] [CrossRef]
- Saadatfard, H.; Niknejad, A.; Liaghat, G.; Hatami, S. A novel general theory for bending and plastic hinge line phenomena in indentation and flattening processes. Thin Walled Struct. 2019, 136, 150–161. [Google Scholar] [CrossRef]
- Sutherland, L.; Soares, C.G. Contact indentation of marine composites. Compos. Struct. 2005, 70, 287–294. [Google Scholar] [CrossRef]
- Daniel, I.M.; Abot, J.L.; Schubel, P.M.; Luo, J.-J. Response and Damage Tolerance of Composite Sandwich Structures under Low Velocity Impact. Exp. Mech. 2011, 52, 37–47. [Google Scholar] [CrossRef]
- McMillan, A.; Aceves, C.M.; Sutcliffe, M. Moderate energy impact analysis combining phenomenological contact law with localised damage and integral equation method. Int. J. Impact Eng. 2012, 43, 29–39. [Google Scholar] [CrossRef]
- Lee, C.-Y.; Liu, D. Effect of impact velocity on the indentation of thick composite laminate. Exp. Tech. 2008, 33, 59–64. [Google Scholar] [CrossRef]
- Big-Alabo, A. Equivalent impact system approach for elastoplastic impact analysis of dissimilar spheres. Int. J. Impact Eng. 2018, 113, 168–179. [Google Scholar] [CrossRef]
- Khan, A.S.; Liu, H. Variable strain rate sensitivity in an aluminum alloy: Response and constitutive modeling. Int. J. Plast. 2012, 36, 1–14. [Google Scholar] [CrossRef]
- Rodríguez-Millán, M.; Vaz-Romero, A.; Rusinek, A.; Rodríguez-Martínez, J.A.; Arias, A. Experimental Study on the Perforation Process of 5754-H111 and 6082-T6 Aluminium Plates Subjected to Normal Impact by Conical, Hemispherical and Blunt Projectiles. Exp. Mech. 2014, 54, 729–742. [Google Scholar] [CrossRef]
- Ventsel, E.; Krauthammer, T.; Carrera, E. Thin Plates and Shells: Theory, Analysis, and Applications. Appl. Mech. Rev. 2002, 55, B72–B73. [Google Scholar] [CrossRef]
- Brake, M.R.; Aragon, D.S.; Reu, P.L.; Baca, R.N.; Vangoethem, D.J.; Bejarano, M.V.; Sumali, H.; Volk, C. Experimental validation of an elastic-plastic contact model. In Proceedings of the European Congress on Computational Methods in Applied Sciences and Engineering, Vienna, Austria, 10–14 September 2012. [Google Scholar]
- Baca, R.N.; Reu, P.L.; Aragon, D.S.; Brake, M.R.W.; VanGoethem, D.J.; Bejarano, M.V.; Sumali, H.A. A Novel Experimental Method for Measuring Coefficients of Restitution; Sandia National Laboratories: Albuquerque, NM, USA, 2016. [Google Scholar] [CrossRef]
- Jamari, J.; Schipper, D.J. Experimental Investigation of Fully Plastic Contact of a Sphere Against a Hard Flat. J. Tribol. 2006, 128, 230–235. [Google Scholar] [CrossRef][Green Version]
- Bikakis, G.S.; Savaidis, A. FEM simulation of simply supported GLARE plates under lateral indentation loading and unloading. Theor. Appl. Fract. Mech. 2016, 83, 2–10. [Google Scholar] [CrossRef]
- Shen, Z.; Xu, Y.; Chrysanthou, A. Contact Behaviour of Composite Laminate under Quasi-Static Indentation Load. Key Eng. Mater. 2013, 577–578, 545–548. [Google Scholar] [CrossRef]
- Herb, V.; Couégnat, G.; Martin, E. Damage assessment of thin SiC/SiC composite plates subjected to quasi-static indentation loading. Compos. Part A Appl. Sci. Manuf. 2010, 41, 1677–1685. [Google Scholar] [CrossRef]
- Jackson, R.L.; Ghaednia, H.; Lee, H.; Rostami, A.; Wang, X. Contact mechanics. In Tribology for Scientists and Engineers; Springer: New York, NY, USA, 2013; pp. 93–140. ISBN 978-1-4614-1944-0. [Google Scholar]
- Wu, E.; Shyu, K. Response of Composite Laminates to Contact Loads and Relationship to Low-Velocity Impact. J. Compos. Mater. 1993, 27, 1443–1464. [Google Scholar] [CrossRef]
- Spronk, S.; Kersemans, M.; De Baerdemaeker, J.; Gilabert, F.; Sevenois, R.; Garoz, D.; Kassapoglou, C.; Van Paepegem, W. Comparing damage from low-velocity impact and quasi-static indentation in automotive carbon/epoxy and glass/polyamide-6 laminates. Polym. Test. 2018, 65, 231–241. [Google Scholar] [CrossRef]
- Zhao, J.; Sang, Y.; Duan, F. The state of the art of two-dimensional digital image correlation computational method. Eng. Rep. 2019, 1. [Google Scholar] [CrossRef]
- Schreier, H.; Orteu, J.-J.; Sutton, M.A. Image Correlation for Shape, Motion and Deformation Measurements: Basic Concepts, Theory and Applications; Springer: New York, NY, USA, 2009; ISBN 978-0-387-78746-6. [Google Scholar]
- Gamboa, C.B.; Martín-Béjar, S.; Vilches, F.J.T.; López, G.C.; Hurtado, L.S. 2D–3D Digital Image Correlation Comparative Analysis for Indentation Process. Materials 2019, 12, 4156. [Google Scholar] [CrossRef]
- Pankow, M.; Justusson, B.; Waas, A.M. Three-dimensional digital image correlation technique using single high-speed camera for measuring large out-of-plane displacements at high framing rates. Appl. Opt. 2010, 49, 3418–3427. [Google Scholar] [CrossRef] [PubMed]
- Xue, Y.; Cheng, T.; Xu, X.; Gao, Z.; Li, Q.; Liu, X.; Wang, X.; Song, R.; Ju, X.; Zhang, Q. High-accuracy and real-time 3D positioning, tracking system for medical imaging applications based on 3D digital image correlation. Opt. Lasers Eng. 2017, 88, 82–90. [Google Scholar] [CrossRef]
- Alacermas Datasheet Al-1050 (99.5%). Available online: https://www.alacermas.com/img/galeria/files/aluminio/chapa_1050_aluminio.pdf (accessed on 2 February 2021).
- Ellis, C.L.; Hazell, P. Visual Methods to Assess Strain Fields in Armour Materials Subjected to Dynamic Deformation—A Review. Appl. Sci. 2020, 10, 2644. [Google Scholar] [CrossRef]
- Mata, M.; Alcalá, J. The role of friction on sharp indentation. J. Mech. Phys. Solids 2004, 52, 145–165. [Google Scholar] [CrossRef]
- Harsono, E.; Swaddiwudhipong, S.; Liu, Z. The effect of friction on indentation test results. Model. Simul. Mater. Sci. Eng. 2008, 16, 65001. [Google Scholar] [CrossRef]
- Zaera, R.; Arias, A.; Navarro, C. Analytical modelling of metallic circular plates subjected to impulsive loads. Int. J. Solids Struct. 2002, 39, 659–672. [Google Scholar] [CrossRef]
- López-Alba, E.; Díaz-Garrido, F.A. Full-Field Indentation Damage Measurement Using Digital Image Correlation. Materials 2017, 10, 774. [Google Scholar] [CrossRef] [PubMed]
- Wang, Q.; Ozaki, K.; Ishikawa, H.; Nakano, S.; Ogiso, H. Indentation method to measure the residual stress induced by ion implantation. Nucl. Instruments Methods Phys. Res. Sect. B Beam Interact. Mater. Atoms 2006, 242, 88–92. [Google Scholar] [CrossRef]
- Xue, H.; He, J.; Zhang, J.; Xue, Y. ISSI2020: An Approach for Obtaining Material Mechanical Properties in Structure Local Region Based on An Accurate Analysis of Micro-Indentation Test. Chin. J. Mech. Eng. Under review. [CrossRef]
- Nurse, A.D.; Patterson, E.A. Determination of predominantly mode II stress intensity factors from isochromatic data. Fatigue Fract. Eng. Mater. Struct. 1993, 16, 1339–1354. [Google Scholar] [CrossRef]
- Landau, L.D.; Lifshitz, E.M. Theory of Elasticity, 3rd ed.; Butterworth-Heinemann: Oxford, UK; Elsevier: Amsterdam, The Netherlands, 1986; ISBN 9780750626330. [Google Scholar]
Publisher’s Note: MDPI stays neutral with regard to jurisdictional claims in published maps and institutional affiliations. |
© 2021 by the authors. Licensee MDPI, Basel, Switzerland. This article is an open access article distributed under the terms and conditions of the Creative Commons Attribution (CC BY) license (http://creativecommons.org/licenses/by/4.0/).