Article

Use of Hydraulic Test Data to Recognize Fracture Network Pattern of Rock Mass in Taiwan Mountainous Areas

1
Department of Harbor and River Engineering, National Taiwan Ocean University, Keelung 202301, Taiwan
2
Geotechnical Engineering Research Center, Sinotech Engineering Consultants, Inc., Taipei 114065, Taiwan
*
Author to whom correspondence should be addressed.
Appl. Sci. 2021, 11(5), 2127; https://doi.org/10.3390/app11052127
Submission received: 9 February 2021 / Revised: 23 February 2021 / Accepted: 24 February 2021 / Published: 27 February 2021

Abstract

:

Featured Application

The proposed approach provides the interpretation of fracture network properties of rock mass around a borehole, to establish a hydrogeological site descriptive model which facilitates the design and planning of groundwater-related engineering systems.

Abstract

Comprehensive information on fracture network properties around a borehole is indispensable for developing a hydrogeological site descriptive model. However, such information usually relies on various cross-hole field tests at a high cost. This study presents a cost-effective option regarding the identification of fracture network density around a borehole. Based on packer-test and drilling-core data from 104 boreholes in Taiwan mountainous areas, Barker’s generalized transient radial flow model and the concept of fractal flow dimension were used to reanalyze the existing hydraulic test data for obtaining the n value related to the geometry of groundwater flow for each test section. The analyzed n value was utilized to explain the characteristics of the fracture network in the adjacent area of each packer inspection section. The interpretation results were verified, using five hydrogeological indicators, namely rock-quality designation, fracture aperture, fracture density, hydraulic conductivity, and fracture/matrix permeability ratio. All hydrogeological indices have high correlations with flow dimension n values. Based on the verification results from using these indices, the proposed method in exploring such information was proven to be feasible. Finally, three practical relations were established, to provide additional information for designing and planning groundwater-related engineering systems in Taiwan mountainous areas.

1. Introduction

The geological environment of mountainous areas in Taiwan is characterized by active orogenesis and abundant rainfall, resulting in complex hydrogeological characteristics of the rock strata [1]. Understanding the hydrogeological characteristics is of importance for constructing and designing engineering works in fractured rock mass [2]. Moreover, collecting such information can help establish a hydrogeological site descriptive model [3,4].
While engineers conduct such an investigation, a series of single-borehole hydrogeological surveys, including borehole drilling, laboratory tests for rock samples, and conventional hydraulic testing, have to be carried out. This survey method has the advantage of less workforce and lower costs. Nevertheless, the survey accuracy may not be satisfied for dealing with more complicated geological conditions. To obtain better survey results, engineers then plan more intensive survey points, as well as advanced and cross-hole hydrogeological tests, to achieve this task. The improved survey technologies include multilevel monitoring approaches [5], tracer tests [6,7], cross-borehole flowmeter tests [8], double-packer hydraulic test [7,9], distributed temperature sensing [10,11,12], borehole radar [13,14], hydraulic tomography [15,16], seismic [17,18], and fractured rock passive flux meters [19,20,21]. Although these methods with case studies have proved that more information in identifying fractured rock network systems can be obtained, the survey’s cost is not affordable for budget-constrained projects. Whether or not there are cheaper alternatives that can provide the same information was the focus of this study. To reduce investigation costs, one of the possible methods is to simply use existing data to perform a value-added analysis of the data, to reveal comprehensive hydrogeological information around a borehole.
This study examined available data from past research projects in Taiwan mountainous regions. The existing data showed that the fracture network properties mainly relied on investigations of individual borehole scale. Based on the sparse data, the hydrogeological site descriptive model was then developed. As an example, the groundwater resource exploration project in the Taiwan Mountain Region initiated by Taiwan Central Geological Survey [22] was a valuable study in seeking alternative water resources for combating drought. The purpose of this study was to understand the flow behavior of groundwater in the mountain region and to locate sites with high potential groundwater resources. However, the determination of the potential sites only relied on borehole-scale hydraulic testing data. From the engineering design point of view, if two- and three-dimensional hydrogeological information can be explored based on the existing data from single boreholes, the interpretation of the groundwater resource potential is more reliable and practical in helping the information needed for actual engineering development and design.
The typical use of the existing hydraulic test data, measured by double-packer hydraulic testing with a fixed interval of 1.5 m, was to provide information on the hydraulic conductivity. However, hydraulic testing using a constant head test lasts for a long period. During the testing, variations of water injection rate into rock mass may reveal fracture network properties (e.g., fracture network pattern and degree of connectivity) in an extended area from the testing borehole. A few studies attempted to use the concept of flow geometry or flow dimension to understand geometries of fracture network systems [23,24]. Their studies also reported that the flow dimension was expected to be low in a relatively spare fracture system; the flow dimension was expected to be high in a relatively dense fracture system. Indeed, most traditional flow models, such as the Theis equation [25], for flow toward a borehole assume a radial flow. The flow dimension for the radial flow is exactly two, and this fixed flow dimension value also indicates that the geometric configuration of the stratum is assumed to be homogeneous. Practically, the geometric configuration of a stratum is unknown if no further in situ investigation is applied. For porous media, such an assumption may give good results because the material is relatively uniform; for heterogeneous fractured bedrocks, the assumption may give poor results. If the flow dimension cannot be identified correctly, there will be a large error for the accuracy of measured hydraulic conductivity [26]. To solve this problem, Baker [23] developed a generalized radial flow (GRF) model for an arbitrary flow dimension that can fit the real geometric configuration. In the early time, the primary application of the GRF model focused on hydraulic test data interpretation for obtaining hydrogeological parameters. Later, a few studies [27,28,29] utilized the concept of fractional flow dimensions to investigate possible fracture geometry in dolomites through analyses of hydraulic test data. Such a concept is still unexplored in other lithologies. Moreover, validations for interpretations of fracture network systems using flow dimensions are not systematically proposed yet.
In response to the insufficiency of previous studies and cost-effective issues of field tests, it remains enticing to reanalyze double-packer hydraulic test data by focusing on the exploration of fracture network systems. The research aimed to unravel fracture network patterns around a borehole for establishing a hydrogeological site descriptive model. A total of 262 existing double-packer hydraulic test data collected from the project entitled “Ground-water Resources Investigation Program for Mountainous Region of Taiwan” [30,31] with Baker’s generalized radial flow model were analyzed, to obtain the flow dimension of each packer test, which reflects several characteristics of the fracture system, including heterogeneity, fracture density, and fracture network connectivity. After analyzing these hydraulic test data from 104 boreholes located in Central and Southern Taiwan, the spatial distribution of the geologic structure and aquifer hydraulic properties for each borehole were recognized. The above outcomes were successfully confirmed by five hydrogeological indices proposed by this study, namely rock-quality designation (RQD), fracture aperture (FA), fracture density (FD), hydraulic conductivity (K), and fracture/matrix permeability ratio (Kf/Km). Finally, relationships between flow dimension and depth, flow dimension and lithology, and Kf/Km ratio and lithology were discussed, to support other hydrogeological applications in engineering practice.

2. Methodology

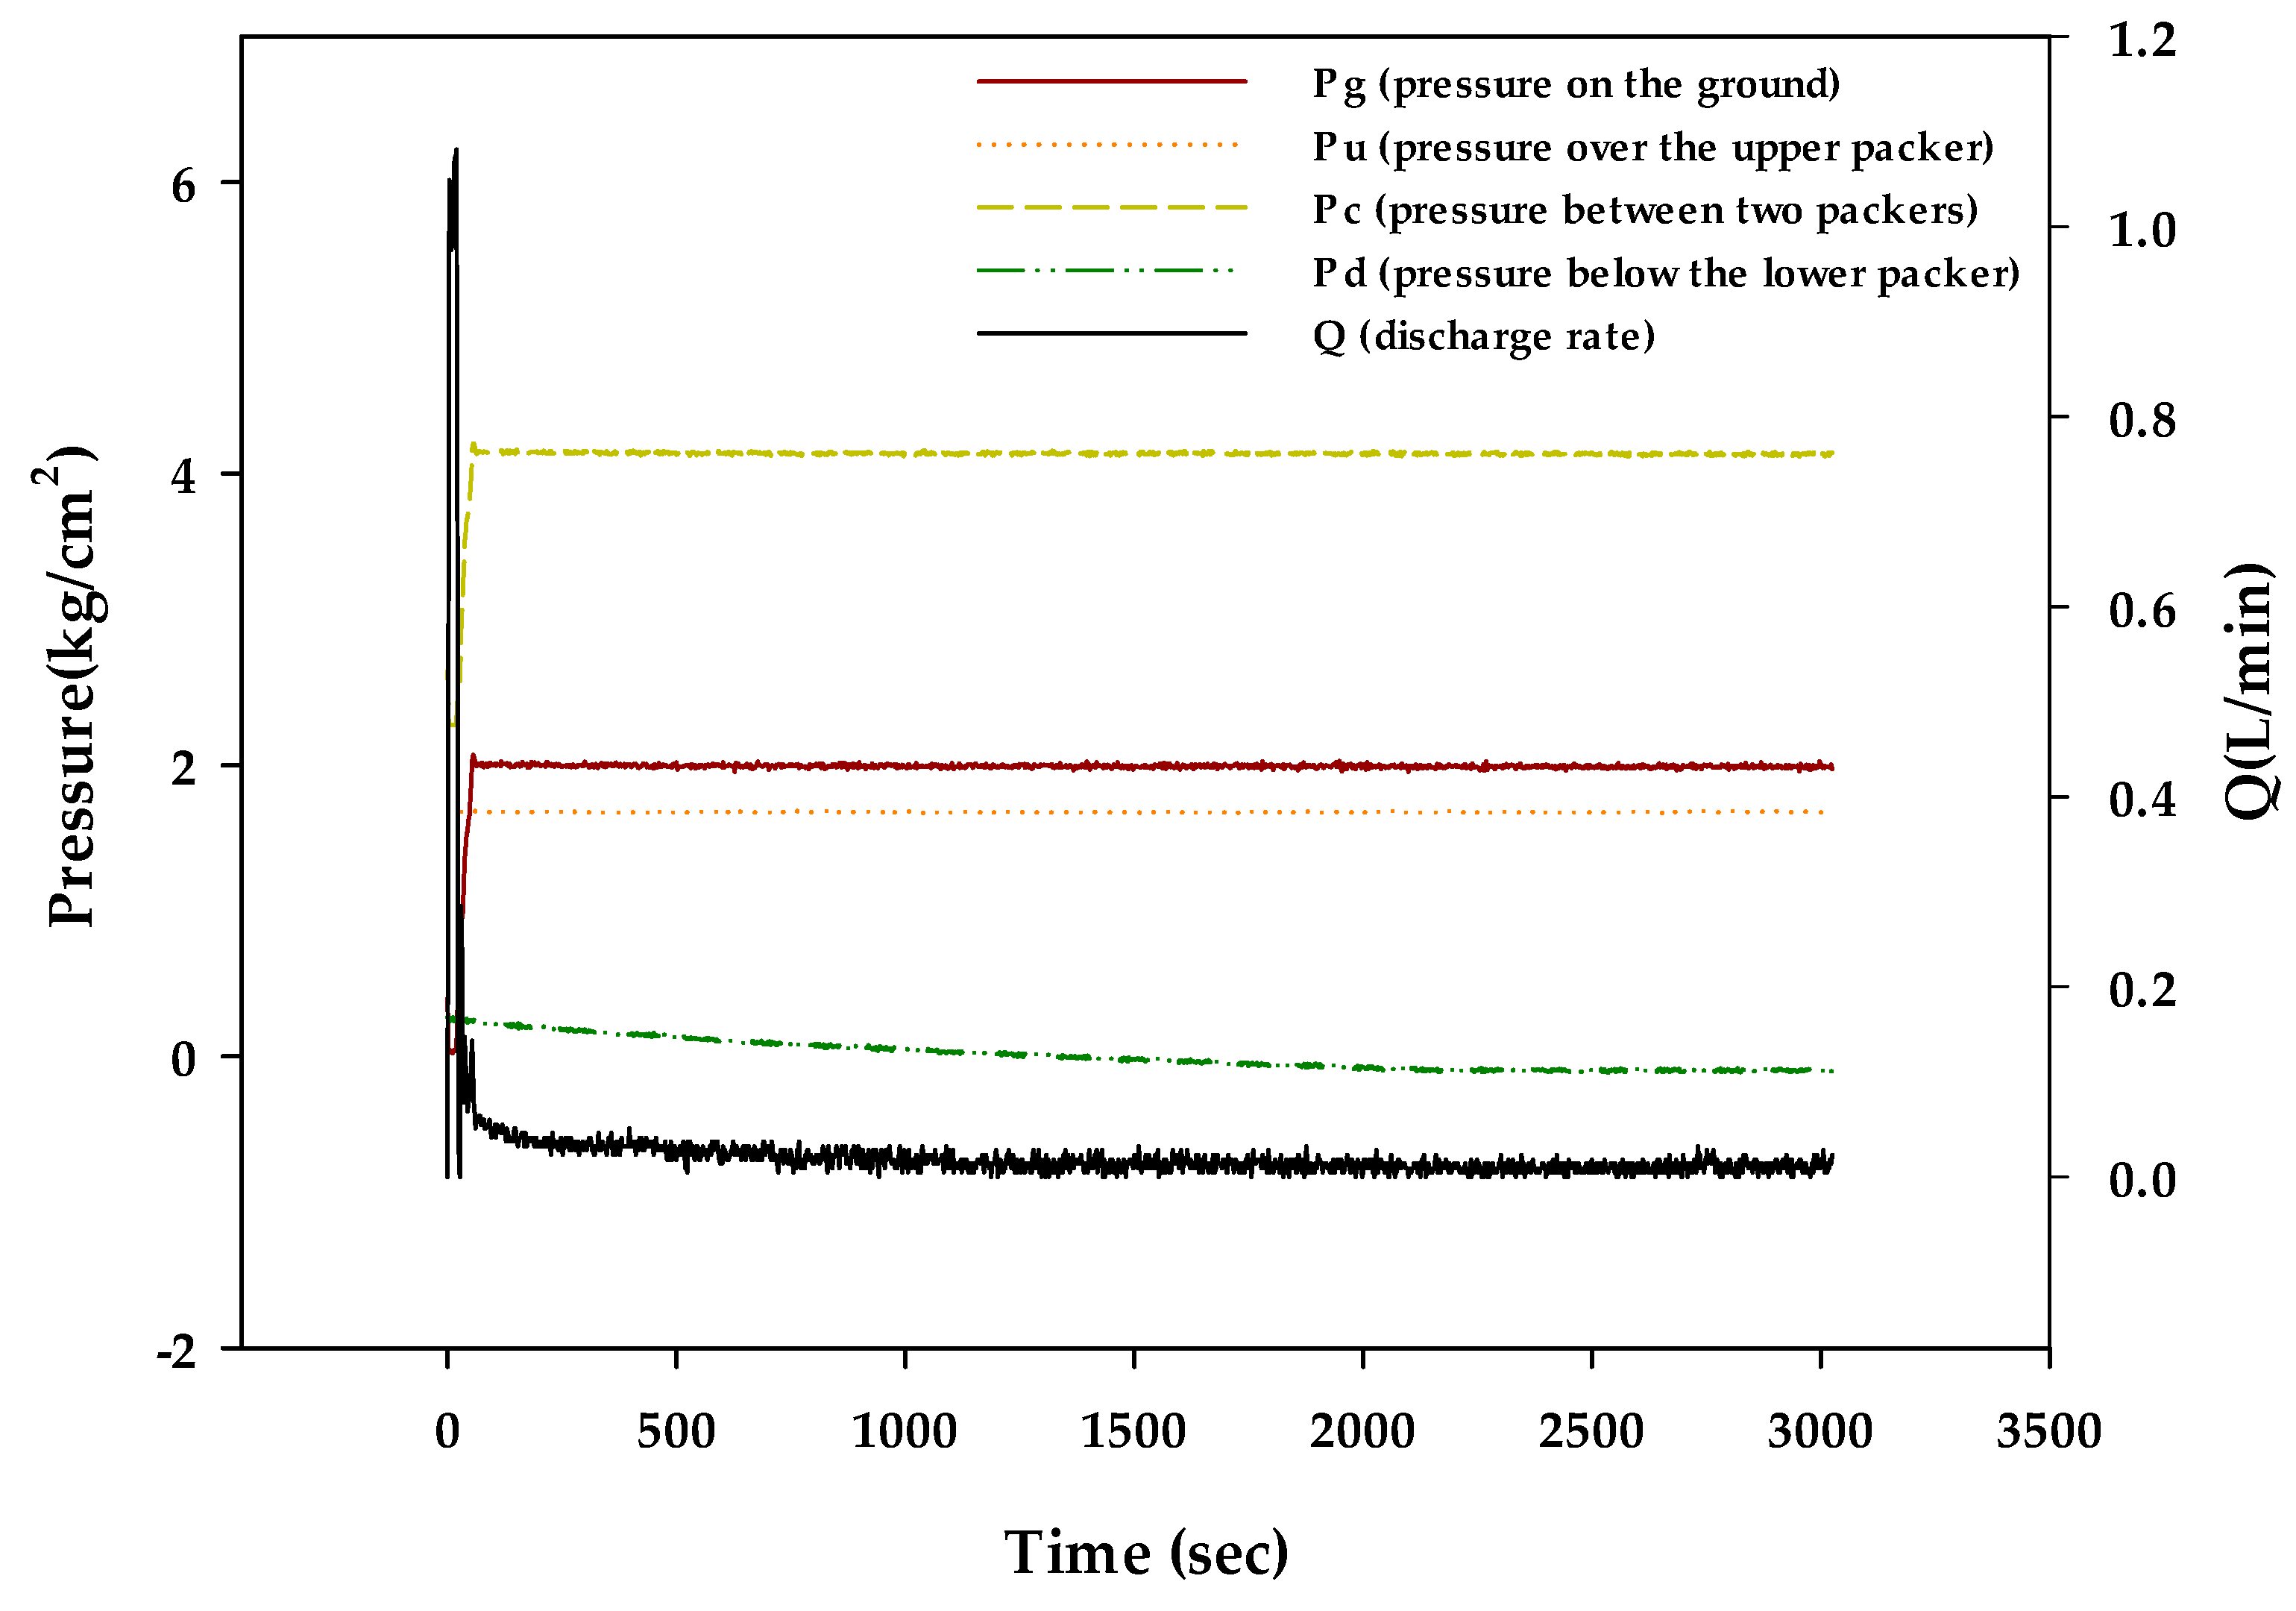
2.1. Generalized Radial Flow Model

A typical double-packer hydraulic test in fractured bedrock is done by injecting water between two packers into a section of a borehole under a constant head. One of the fundamental questions that arises is, where did that water in the borehole flow during the hydraulic test? The geometry of a fractured system, which represents the spatial distribution of fractures around a borehole, may dominate the flow geometry. Fracture geometric parameters, such as aperture, orientation, trace length, and spacing, may affect the hydraulic conductivity of the fractured rock formation and even the groundwater flow pattern, resulting in different flow models. When the density of fracture geometry is large, a spherical flow model (flow dimension n = 3) might be applicable; while the density of fracture geometry is low, a linear (flow dimension n = 1) or cylinder model (flow dimension n = 2) would possibly be suggested. Indeed, most of the flow dimension in nature is a non-integral value. Due to the unknown flow dimension of a borehole site and its non-integral character, Baker [23] developed a generalized radial flow model to determine this parameter from hydraulic testing data. In addition to obtaining flow dimension, the advantage of this model can improve the estimation accuracy of hydraulic conductivity (K).
In Barker’s theory, the generalized radial flow model was derived utilizing an n-dimensional spherical surface system focalized on a common source point. The areas (A) of these surfaces change with radial distance from the source (r). The area can be given by the following:
A = α n r n 1
in which αn is defined as follows:
α n = 2 π n 2 / Γ ( n 2 )
where Γ ( n 2 ) is the gamma function; n is the flow dimension that determines the changes in the through-flow area with distance from the source. Furthermore, Equation (1) also describes the power relation of the through-flow area to the radial distance.
Based on Equations (1) and (2), the generalized groundwater flow equation can be expressed as follows:
K r n 1 r [ r n 1 h r ] = S s h t
where K is hydraulic conductivity, h is hydraulic head, and Ss is specific storage.
The flow dimension n in Equation (3) can be determined from hydraulic test data with Barker’s generalized radial flow model. The following results were used to recognize fracture network properties around a borehole.

2.2. Hydrogeological Indices for Validation

As shown in Section 2.1, performing flow dimension n attempts to identify a possible fracture network pattern around a borehole. The concept proposed above needs to be validated. Thus, this study proposes five hydrogeological indicators that can quantitatively describe the density of fracture network system. Each hydrogeological indicator was used to correlate with the flow dimension n for checking whether or not a good relationship between both parameters exists. The selected five indicators are explained as follows.

2.2.1. Rock-Quality Designation (RQD)

In rock engineering, the degree of rock mass fragmentation represents the quality of the rock mass and an essential indicator for understanding the mechanical behavior of the rock mass. The degree of fragmentation attempts to describe the degree of density of the fracture network system. In order to assess the degree of rock mass fragmentation, the rock-quality designation (RQD) system developed by Deere [32] was used as the rating rule for evaluating the density of fracture network system. The RQD value for each selected core run can be calculated as the percentage of the accumulative length (Rs) of the intact core portion that is longer than 10 cm to the selected core run length (RT). The following formula expresses RQD.
RQD = R s R T × 100 %
The lower the RQD, the higher the density of the fracture network system. This study calculated RQD values for all double-packer test sections and then used them to correlate with the flow dimension n values. The purpose of this analysis is to examine whether RQD tends to be small when the flow dimension n is higher, where the degree of density of the fracture network system is dense. In addition, this study also explores the proportion of RQD distributions with higher flow dimensions among different rock types (e.g., metamorphic and sedimentary rocks) for understanding which rock type has a higher density of fracture network system in the study area.

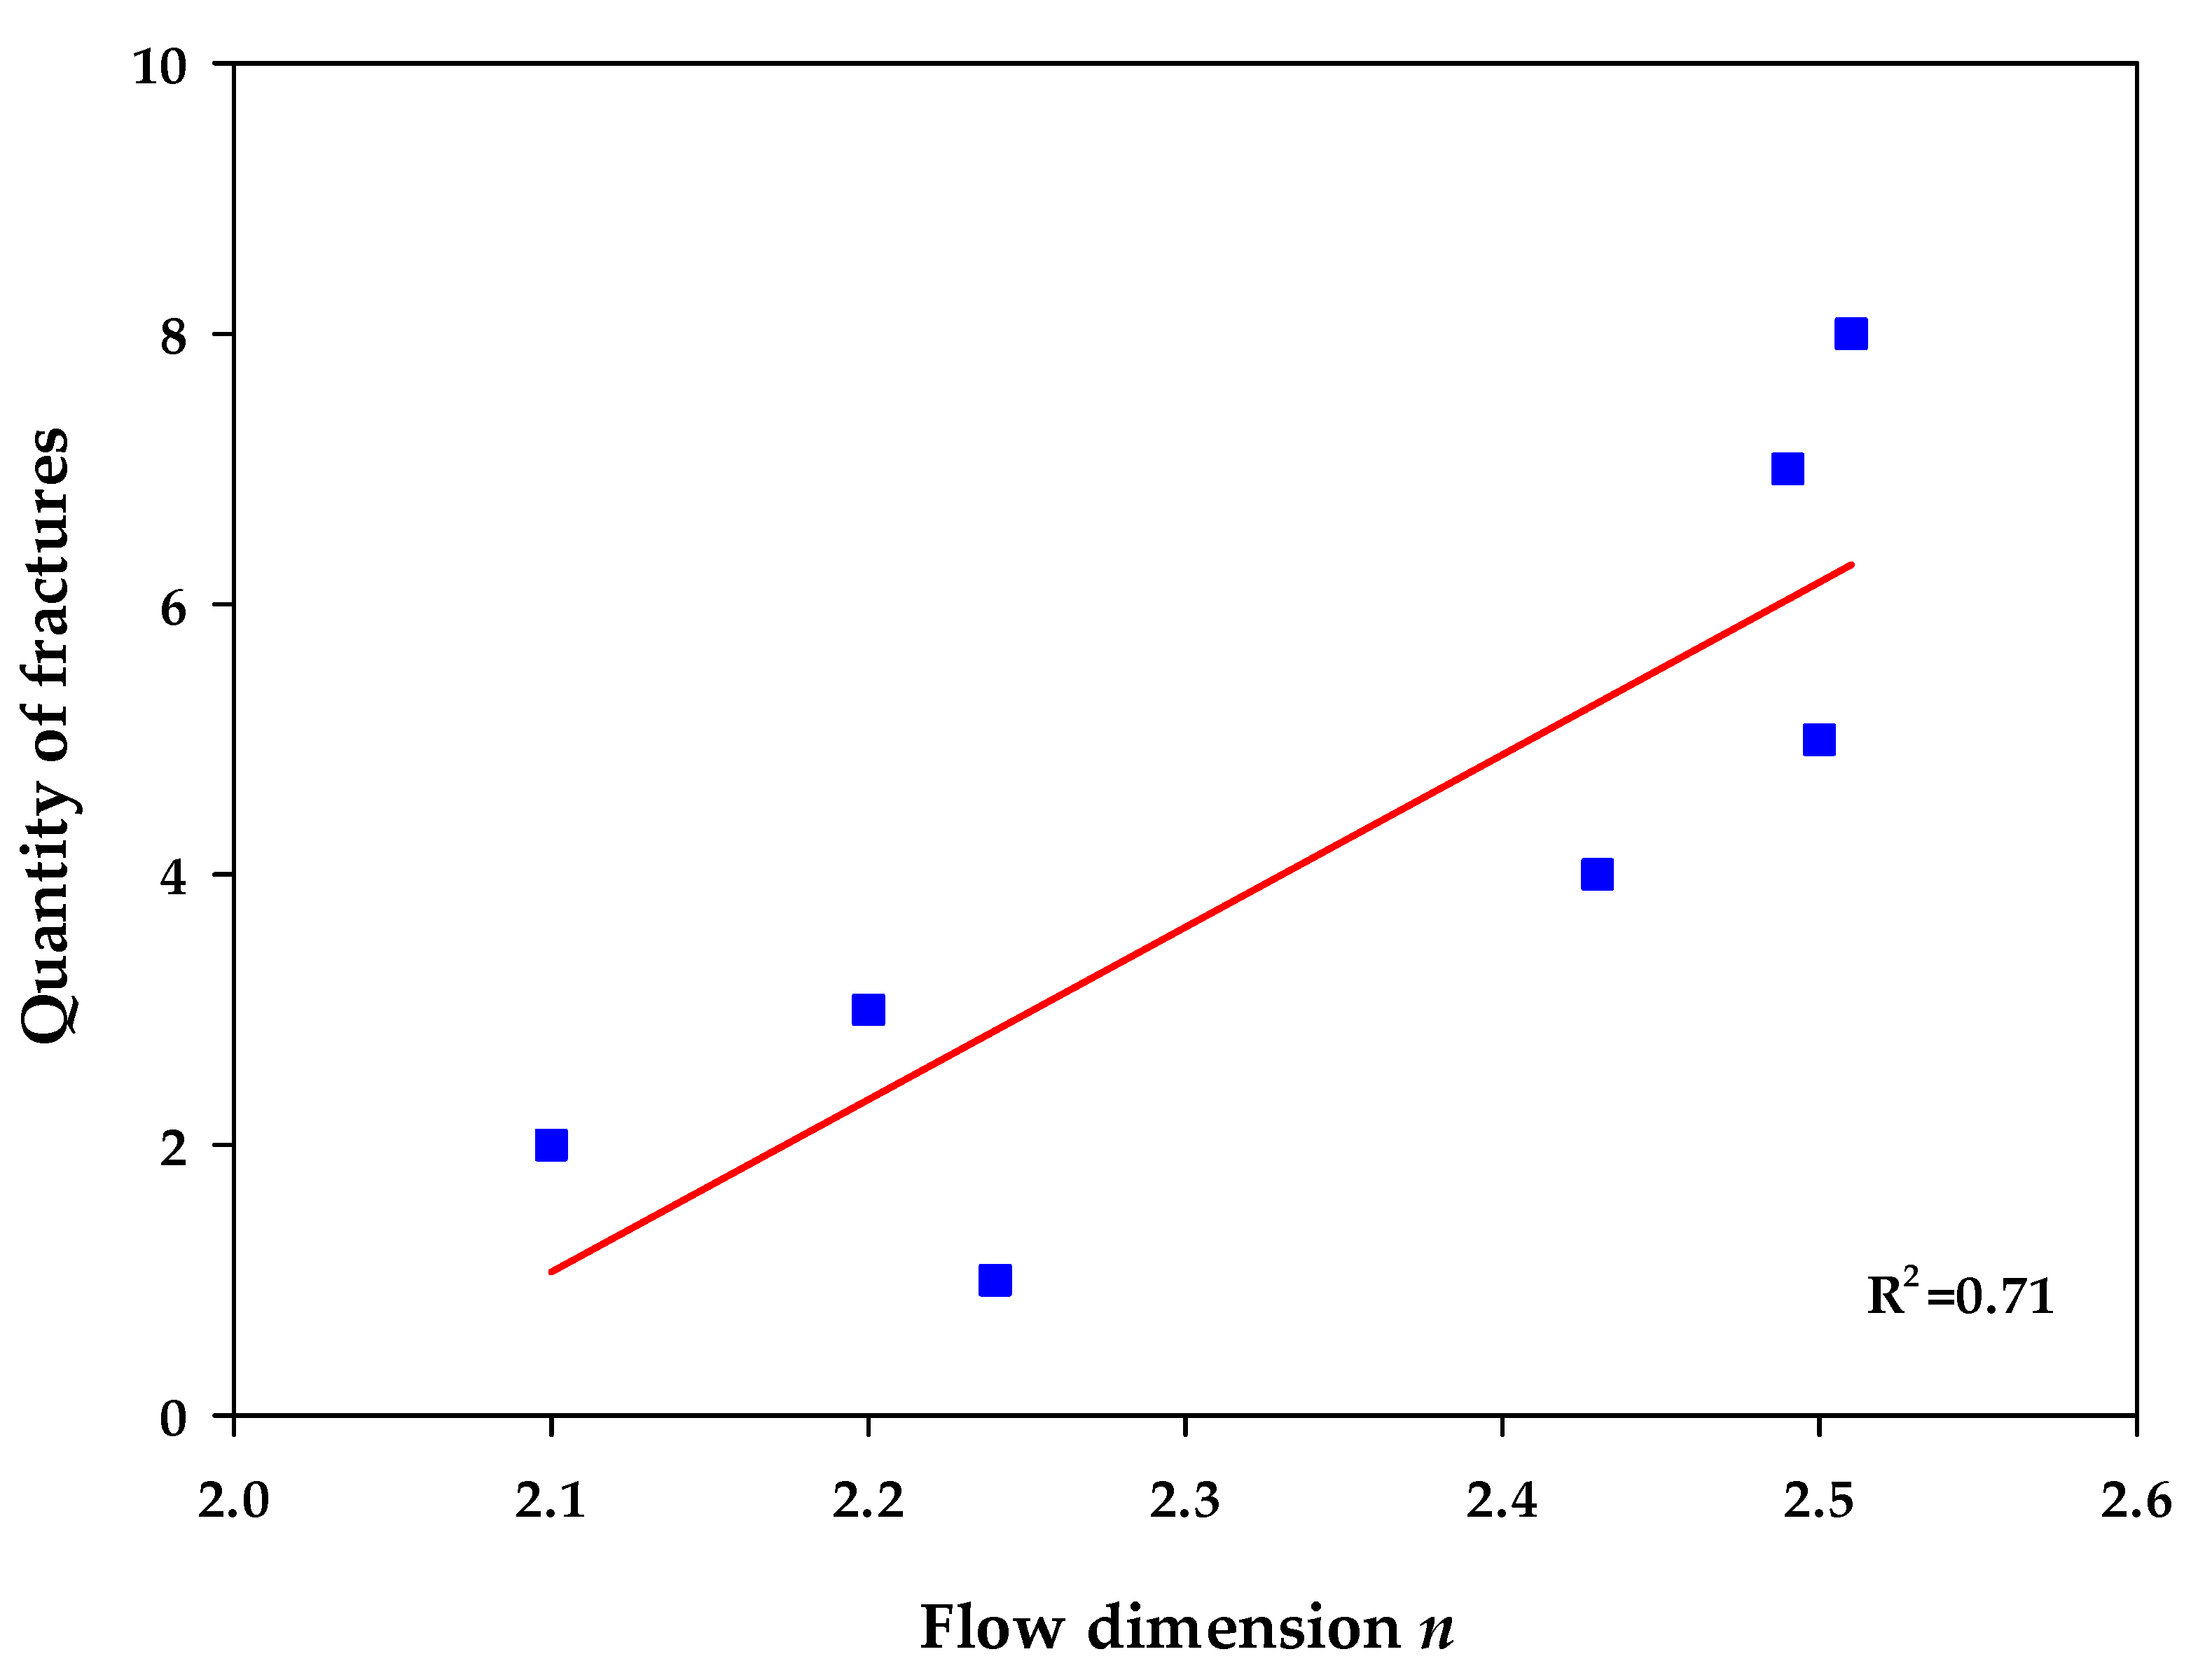
2.2.2. Fracture Aperture (FA) and Density (FD)

The fracture aperture (FA) and fracture density (FD) are two important parameters for describing the complex structure of fractured rock mass, and they also represent important indicators for the degree of fragmentation of rock mass. Therefore, for each double-packer test section, FA and FD in the test section were calculated by the post-processing program (RGLDIP) of the borehole televiewer, and the result was used to represent the degree of rock mass network density indirectly.
Because Taiwan is located at the junction of plates, the plate movement frequently occurs, making discontinuities quite developed. If the infilling material in discontinuities is impermeable such as gouge infill, this may lead to a decrease in the permeability of the fractured rock mass. Such an effect may affect the development of a relationship between FA (or FD) and the flow dimension n. Thus, if gouge was present in the fracture fill among the analyzed samples, corresponding samples were excluded from the correlation analysis.
Regarding FD calculation, the number of fractures, excluding the fractures with infilling of the gouge, in each double-packer test section was first counted. Subsequently, the total number was divided by the length of the test section. The fracture amount per unit length of the test interval was used as the fracture density (FD) of a test interval. As for the computation of FA for each test interval, FA can be calculated by accumulating the width of all fractures within the interval. However, due to the limited accuracy of RGLDIP in calibrating the fracture width, the fracture width smaller than 0.3 cm is not easy to obtain. For those less than 0.3 cm, the fracture width is assumed to be 0.3 cm used in the analysis.

2.2.3. Hydraulic Conductivity

Hydraulic conductivity, also known as the coefficient of permeability, is mainly used to measure the ability of fluid passing through the formation. The higher the hydraulic conductivity, the better the transmission ability of groundwater in the fractured rock mass. Factors that generally control the hydraulic conductivity of fractured rock mass rely on fracture characteristics, such as fracture density, fracture spacing, size of fracture opening, and fracture connectivity [1,33]. The flow pattern of groundwater in fractured rock mass may also indirectly indicate the degree of development of the network density of fractured rock mass. Based on the above hypothesis, flow dimension n may be represented by the magnitude of hydraulic conductivity. In this study, the relationship between the flow dimension n value and its corresponding hydraulic conductivity is statistically analyzed as a validation process. Moreover, the correlation result can be utilized to investigate whether or not the flow dimension n can reflect the groundwater potential around a borehole site.

2.2.4. The Ratio of Kf/Km

Studies on fracture/matrix permeability ratio (Kf/Km) were first introduced in the field of petroleum. Graham and Richardson’s [34] study mentioned that there was a positive correlation between oil production and pressurized injection volume, and the increase in the fracture width could increase the fracture/matrix permeability ratio, which indirectly increased the amount of injection water in the process of recovering oil. The concept of Kf/Km was also discussed in some subsequent studies to investigate the relationship between oil and gas imbibition of naturally fractured rock formations and pressurized water injection through different test methods and scales [35,36,37,38]. The same concept even extended to topics such as pollutant transport tracking and control [39] and the selection of groundwater flow models [40]. Understanding the ratio of Kf/Km is also a key task for evaluating the hydrogeological characteristics of a fractured rock mass. The ratio may indirectly explain fracture network patterns. Taylor et al. [41] investigated the Kf/Km ratio of the fractured rock aquifer system using finite element numerical simulations. Their study concluded that the flow path is dominated by the matrix when the Kf/Km ratio is less than 103; the flow path is dominated by both matrix and fractures when the Kf/Km ratio ranges from the magnitudes between 103 and 104; the flow path is dominated by the fractures when the Kf/Km ratio is greater than 106.5. Later, the conclusion mentioned above was confirmed by the similar work done by Matthäi and Belayneh [42] and Bairos [43].
Furthermore, based on laboratory and in situ investigations for the hydraulic conductivity of fractured rock mass, hydraulic characteristics of the rock mass are closely related to geometric parameters of fractures. They can be deduced as a function of the geometric parameters [4,5,6,7,8,9,10,11,12,13,14,15,16,17,18,19,20,21,22,23,24,25,26,27,28,29,30,31,32,33,34,35,36,37,38,39,40,41,42,43,44,45,46,47,48,49]. Therefore, fracture models based on the geometric parameters have been gradually developed. There are four commonly used fracture models for simulating the groundwater flow behavior of fractured rock mass, namely the Parallel Plate Model, Dual-Porosity Model, Equivalent Porosity Model (EPM), and Discrete Fracture Network (DFN) Model [50]. In summary, by exploring the relative hydraulic characteristics of fractures and rock matrix, it is possible to classify a possible site descriptive model for an engineering site.
Based on the literature review discussed above, the ratio of Kf/Km was used as a hydrogeological index for exploring fracture network systems and validating results of the flow dimension n. The existing double-packer hydraulic test data with Baker’s generalized radial flow model (double porosity model) [23] were reanalyzed, to obtain hydraulic conductivity in the fractures (Kf) and the matrix (Km), respectively. Regarding the selection of the block-geometry functions in the double-porosity model, the slab-shaped block function with fracture skin was adopted.
While performing data analyses, the parameters of the model that need to be prepared are the (1) matrix hydraulic conductivity (Km), (2) matrix specific storage (Ssm), (3) fracture hydraulic conductivity (Kf), (4) fracture specific storage (Ssf), (5) aperture (b), (6) thickness of slab H (H = (1.5 − b)/2), and (7) flow dimension (n). Km was determined in the laboratory from rock specimen analysis. The value of aperture b was obtained from an image of the borehole televiewer with a post-processing program that could digitalize the width of fracture displayed in the borehole image. Flow dimension n can be determined from Equation (3). Ssf referred to the table of specific storage coefficients for different geologic materials suggested by Batu [51], as shown in Table 1. The minimum value of fissured rock, which is 3.28 × 10 6 (1/m), was used as the model input. Ssm was calculated by the formula (Ssm = ρg(α + neβ), in which ρ (= 999 kg/m3) is water density); g (= 9.8 m/s2) is gravity (the compressibility of water (β = 4.4 × 10 10 m.s2/kg); α is the compressibility of aquifer material referred to the table of compressibility of aquifer material for different geologic materials (Table 2) suggested by Freeze and Cherrt [52]. The minimum value of sound rock in Table 2, which is 1.0 × 10 10 (m2/N), was used as the model input; ne is porosity measured from the laboratory porosity test.
While performing the analysis using Baker’s generalized double-porosity model, the parameters such as Km, Ssm, Ssf, H, b, and n were fixed, and then the fracture hydraulic conductivity Kf was iteratively solved. Once Kf was determined, the ratio of Kf/Km was computed. This result was able to evaluate the relation between Kf/Km and groundwater flow behavior of fractured rock mass. Finally, the Kf/Km ratio of each double-packer hydraulic test section correlated with the corresponding n value determined from Baker’s generalized radial flow model, as depicted in Section 2.1. The constructed relation can be used for the validation.

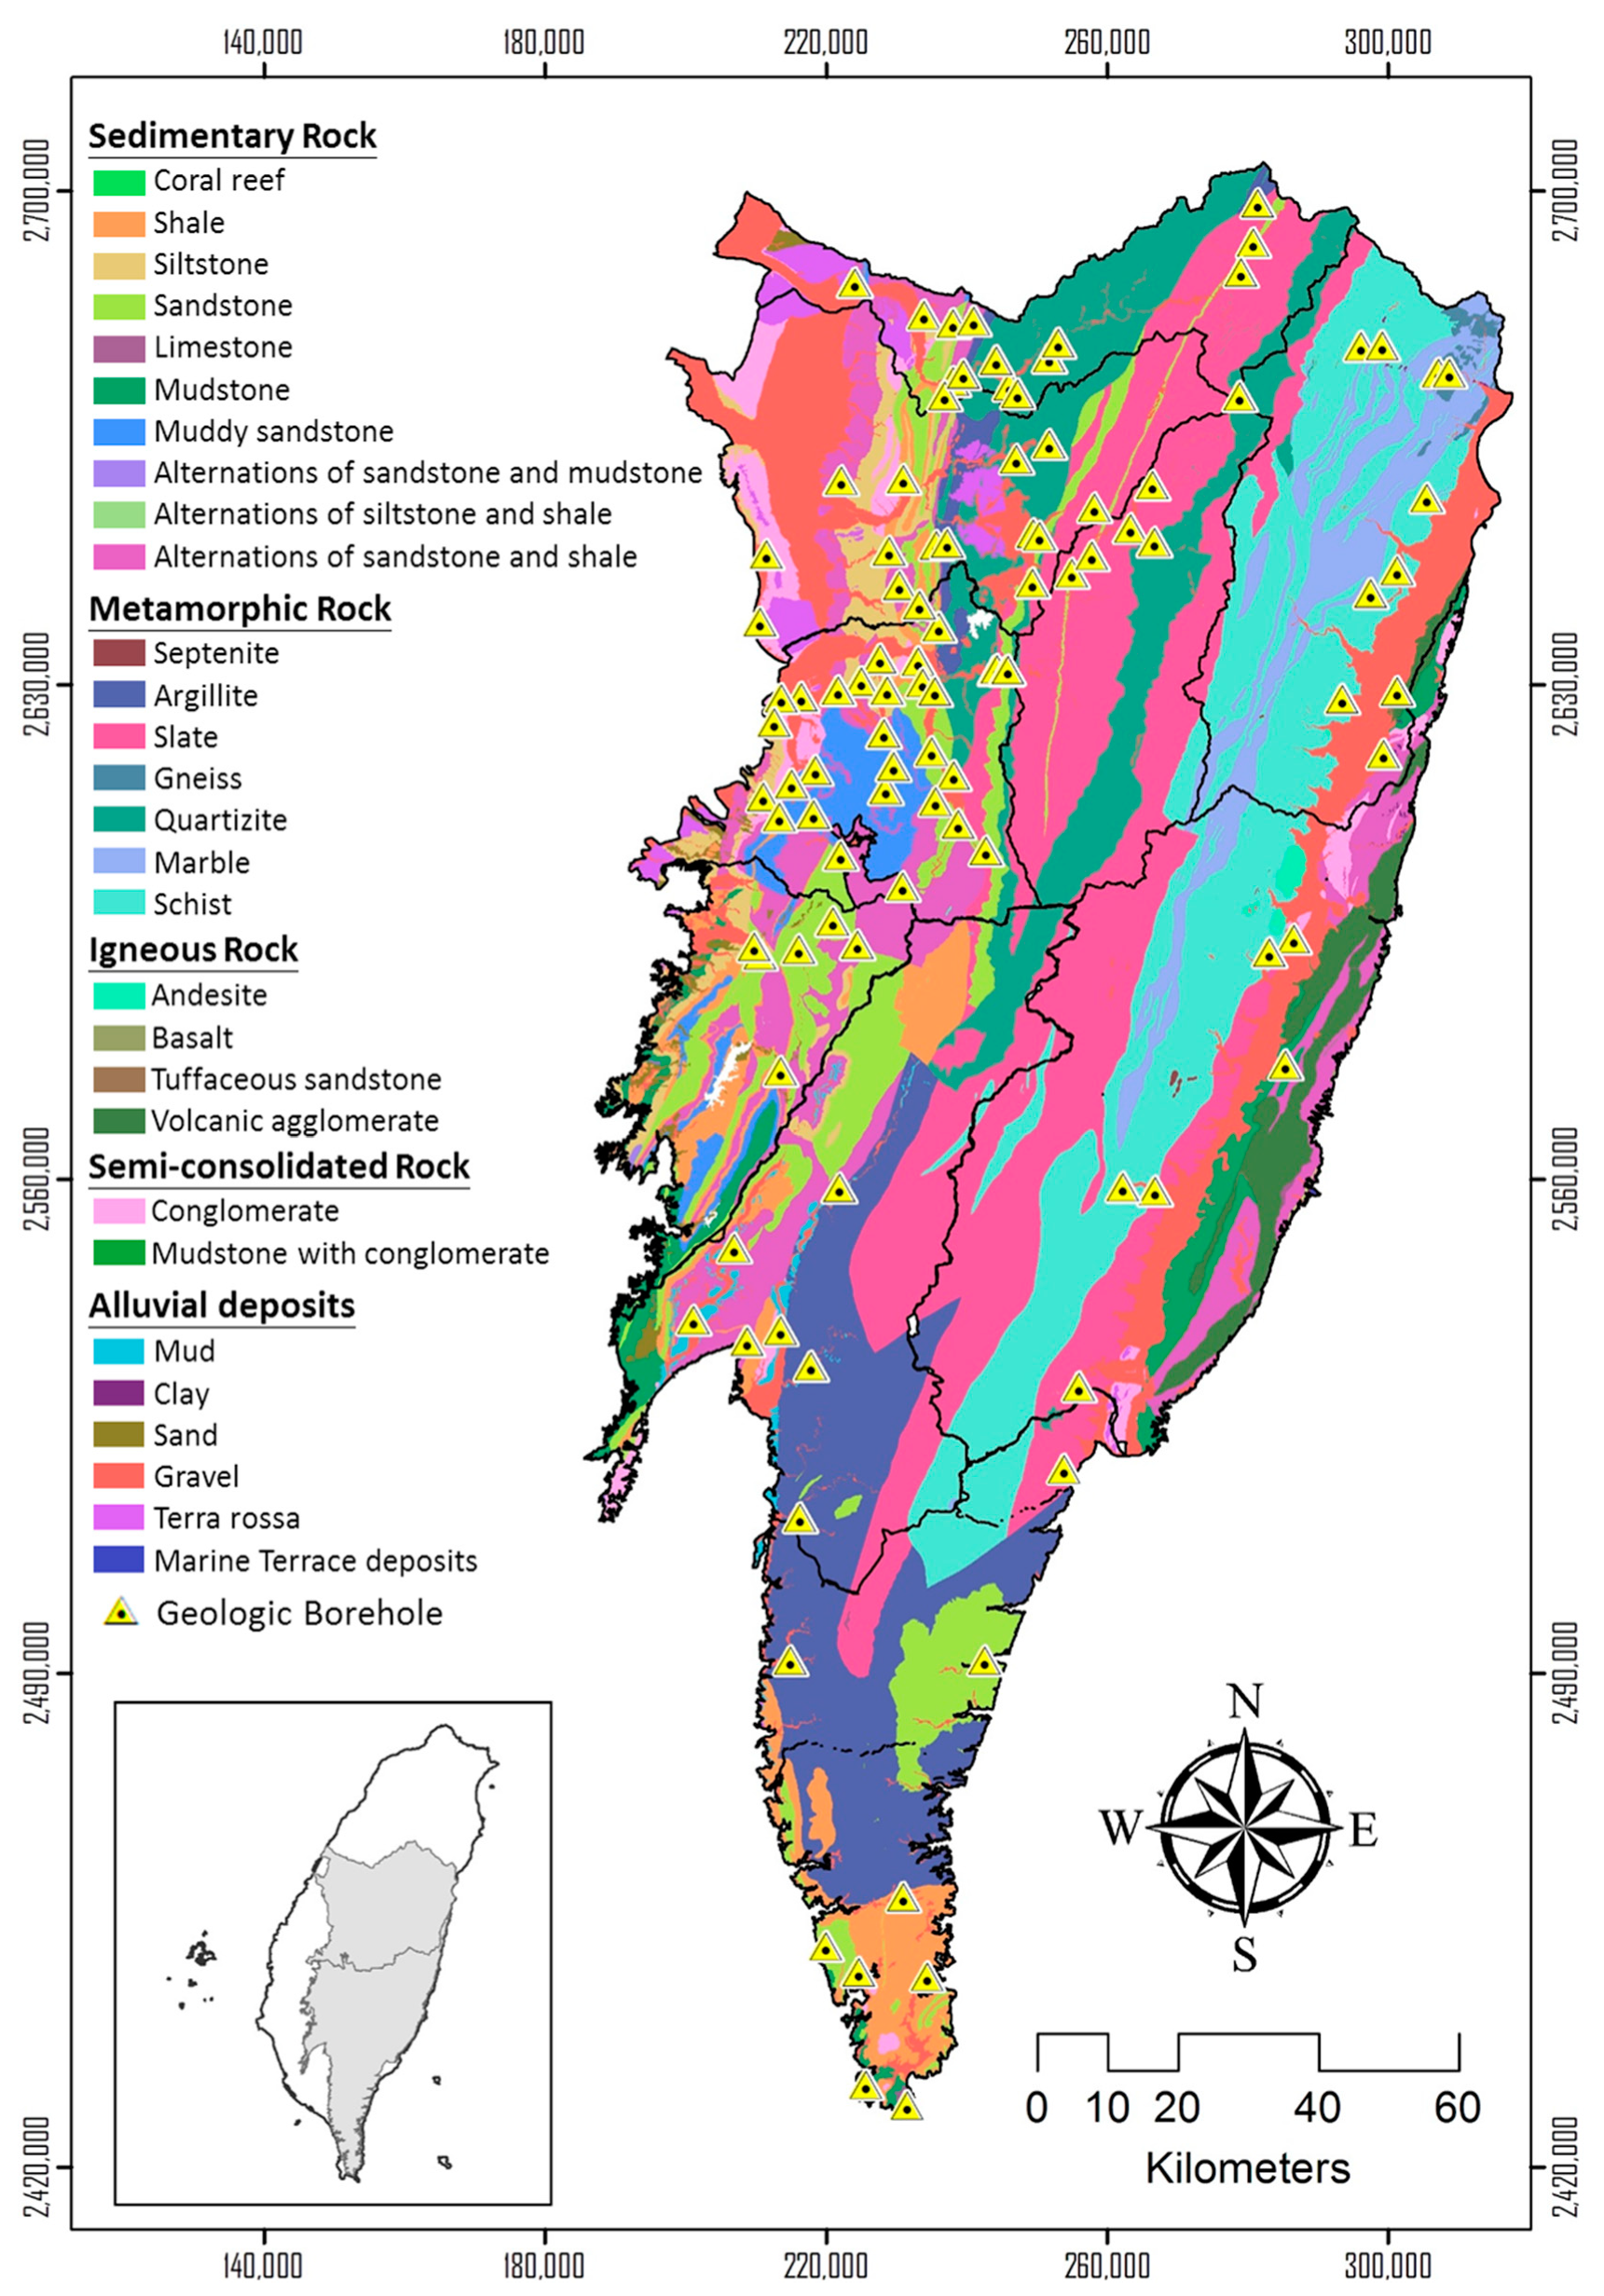
3. Study Area and Data Used

Taiwan’s orogenic movement is developed due to the mutual extrusion of the Eurasian Plate and the Philippine Sea Plate, resulting in a large mountain area in Taiwan. The mountainous area accounts for about 70% of the total area of Taiwan. Complex fracture network systems can be found everywhere in the mountain’s rock formations. In this study, the central and southern mountainous areas of Taiwan were selected as the area for data collection and testing of the proposed method. Figure 1 shows the locations of this study area and geologic boreholes that produced the raw data for this research. The lithology of each geological borehole is also presented in Figure 1 [53].
The geological environment of the study area is highly variable and covers a wide range of stratigraphic ages, from Eocene strata to modern alluvium. The stratigraphic age is gradually younger from east to west of Taiwan. According to the lithology data of the boreholes, the main lithology types include sandstone, mudstone, shale, volcanic agglomerate, sandstone interbedded with shale, quartzite, argillite, schist, marble, slate, gneiss, and schist. The prevalent lithologies from east to west are metamorphic rock, sedimentary rock, semi-consolidated rock, and alluvial deposits in the order. Most of the strata in the mountainous area are composed of regolith layers and underlying fractured rock masses. The upper regolith porous media and underlying bedrock fractures are mostly interconnected to create unconfined aquifer systems in the study area. Fracture network properties in the fractured bedrock layers dominate their groundwater flow behaviors.
Field investigation results of hydraulic conductivity from major geological formations indicated the hydraulic conductivity ranged from the magnitudes between 10–4 and 10–10 m/s. The variability of hydraulic conductivity is great, but the characteristics of fractures are the most critical factors in controlling the hydraulic conductivity of the formation. Borehole image data from borehole televiewers showed that the fracture network density for some of the metamorphic rocks are denser than that for sedimentary rocks, and the hydraulic conductivity of the metamorphic rocks has a tendency to be higher. In addition, the proportion of highly permeable sections (hydraulic conductivity is greater than 1.0 × 10⁻⁵ m/s) in each river basin showed that the proportion ranged from 7% to 30%, with considerable variation. In comparison, the proportion of highly permeable sections in the basins belonging to the central part of the Taiwan mountain area is slightly lower than that in the basins of the southern part of the Taiwan mountain area.
According to the objectives of this study, the field data of the “Groundwater Resources Investigation in Mountainous Areas” project initiated by the Central Geological Survey of Taiwan were collected from 104 drilling boreholes and seven types of hydrogeological tests after drilling. The data related to this study include drill core photos, core logging, borehole images, and double-packer hydraulic tests. The first three data types for each borehole were mainly utilized as necessary information to calculate the three hydrogeological indices (including RQD, FA, and FD). The raw data of double-packer hydraulic tests were used as the essential information for interpreting the hydrogeological index of hydraulic conductivity and as input data for studies of groundwater flow dimension n and fracture/matrix permeability ratio (Kf/Km). Figure 2 shows the water injection process of a constant-head double-packer hydraulic test, where the black line represents the change of rock mass inflow with time, and the other lines stand for the changes of different water pressure gauges with time (Pg, pressure on the ground; Pu, pressure over the upper packer; Pc, pressure between two packers; and Pd, pressure below the lower packer). Because the water injection process lasted for at least two hours until achieving a stable injection rate, hydraulic responses with time due to fracture geometries were collected. Such collected data were supposed to reveal a fracture network density pattern around a double-packer test section. The result of this analysis can then be integrated with the data of hydrological and geological parameters of the test section for correlation analysis.

4. Results and Discussion

4.1. Validation Using Various Hydrogeological Indices

To confirm whether the flow dimension n value can be used as a basis for interpreting the fracture network patterns, this study proposes five hydrogeological indices (i.e., RQD, FA, FD, hydraulic conductivity, and Kf/Km ratio) to verify the rationality and credibility of the proposed method. The following verification results for five hydrogeological indices are described as follows.
(A)
RQD
RQD is mainly used to measure the degree of fracturing in strata. Theoretically, the lower the RQD, the more broken the rock mass, and the higher the fracture network density. Therefore, by examining a relationship strength between the flow dimension n and RQD, the feasibility of the n-value to interpret the fracture network density around a borehole was conducted. In this study, RQD is divided into four levels, which are RQD < 25%, 25–50%, 50–75%, and >75%, respectively, representing the degree of rock mass fragmentation from high to low. The flow dimension n value between 1 (flow geometry: linear flow) and 3 (flow geometry: spherical flow) is divided into five classes: 3.0–2.75 (spherical flow), 2.75–2.25 (spherical–cylinder flow), 2.25–1.75 (cylinder flow), 1.75–1.25 (cylinder–linear flow), and 1.25–1 (linear flow), which respectively represent five different levels of fracture network density, namely high, medium–high, medium, medium–low, and low. Further, the data points whose n values are in the medium–high level of fracture network density (n > 2.25) were selected, and the RQD of each data point was examined to see if it shows a tendency to be smaller. The same analysis was performed for the data points with the highest level (n > 2.75).
Figure 3 and Figure 4 show the corresponding RQD distribution results when the fracture network density belongs to the medium–high grade (n > 2.25) and the high grade (n > 2.75), respectively. Approximately eighty percent of the data points for each of the two fracture network classes are distributed among the grades with the smaller RQD classes in the levels of RQD < 25% and RQD = 25%–50% representing high fractured rock mass, while fewer data points are attributed in relatively intact rocks in the level of RQD > 75%. The overall result is in line with the expectation of this study. Regarding data points with relatively high RQD but appearing at the high n-value level, the main reason is that the RQD calculated from the drill core, which is a small scale, may be different from that computed from the adjacent region of the drill hole, which is a large scale. As a result, the connectivity of the fracture network around the borehole is not the same as that seen in the drilling core samples. Although a few results are not expected, most of the data show that RQD is highly correlated with n. Therefore, it is feasible to further explain the fracture network density around the borehole from the flow dimension n values.
In addition, Figure 3 and Figure 4 also show the amount of data occupied by sedimentary rocks and metamorphic rocks for each RQD class, so as to understand which lithological fracture network is relatively developed in the study area. The results show that about 95% of the metamorphic rocks are within the classes of RQD < 25% and RQD = 25%–50%, while the sedimentary rocks are relatively less in the range of 75% to 80%. From the above statistical results, it can be concluded that metamorphic rocks are more likely to have high fracture density than sedimentary rocks in the mountainous areas of Central and Southern Taiwan, which is probably due to the fact that the distribution of metamorphic rocks in Taiwan is more frequently affected by orogeny and earthquake. Therefore, the fracture network density of metamorphic rocks tends to be higher than that of sedimentary rocks.
(B)
FA
Before establishing a correlation between FA and n, it is necessary to select relevant data from the existing data based on the theory of flow dimension n. According to this theory, the value of n is mainly controlled by water-conducting fractures. However, not all the data collected meet this condition. To reduce the influence of the verification caused by non-conductible fractures, this study excluded data samples with the following two conditions: (1) the lithology of test sections without fracture characteristics (e.g., semi-consolidated rock formation); (2) the geological structure that hinders the flow of groundwater (e.g., high-angle fractures, fractures containing fractured shear mud, and shear fracture zones) of test sections. After filtering out the unqualified data, a total of 129 test data that met the conditions were included for correlation analysis. Subsequently, the accumulated FA value for each double-packer test section with a fixed packer length of 1.5 m was calculated, and then the accumulated FA value and its corresponding n value were arranged in order according to the width from small to large. The arranged samples were grouped into fixed-width intervals. The average width (FAave) of all samples in each interval was calculated, and the average n value (nave) of the samples in each interval was obtained (Table 3). Finally, the correlation analysis between FAave and nave value was conducted.
Figure 5 shows that FAave for each grouped interval is between 0.6 and 10.9 cm and its corresponding nave is between 2.05 and 2.72. nave increases with the increase of FAave, showing a positive correlation. This correlation result indicated that the fracture width influences the magnitude of flow dimension n. This hydrogeologic index FA verified the feasibility for interpreting potential fracture network density based on the result of flow dimension n.
(C)
FD
Before establishing a correlation between FD and n, raw data selection also plays a vital role in obtaining a good correlation. The selection of the data was divided into two stages. The first stage was to apply the same screening method as FA. Each data sample with the existence of water-conducting fractures in each test section was selected. A total of 129 data points were chosen at this stage. However, these data need to be further filtered, due to the fracture width’s effect on groundwater flow characteristics. For example, six fractures are presented in both double-packer test sections, as illustrated in Figure 6. Nevertheless, the width of the fractures may be quite different. Due to this discrepancy, the groundwater flow characteristics of the two test sections may be different. This hypothesis was confirmed from different flow dimension n values at both sides of Figure 6. The n value at the left-hand side of Figure 6 is 2.33; the other one is 1.59. Therefore, 129 data points of the first stage need to be rechecked, to avoid the influence of fracture width.
Among 129 samples, this study looked for samples in which the width of each fracture in each test section was less than 1 cm. Finally, 67 samples were selected for analysis. The samples were grouped into seven fracture density values from one to eight, excluding the value of seven. The corresponding average n value for each FD value was computed as shown in Table 3. The average n value for the seven groups ranged from 2.1 to 2.51. The correlation analysis between FD and n was performed as shown in Figure 7. The outcome indicated a positive relationship between the average n value and FD. Among them, the average n value of eight fractures was 2.51. The result shows that when the n value in a test section presents to be higher, a higher FD value appears in the test section. This finding implies that the fracture network density tends to be denser.
(D)
Hydraulic conductivity (K)
The density of the fracture network may be correlated with the magnitude of the hydraulic conductivity. This study attempts to use it as one of the hydrogeological indicators to verify the concept of flow dimension n. To understand that the density of the fracture network is consistent with the groundwater transmit capacity or groundwater potential, this study performed a correlation analysis between the n value and the hydraulic conductivity. Based on 80 sets of single-packer hydraulic test data with the theory in Section 2.1, n and K values of the stratum to which the 80 drilling sites belong were obtained. Subsequently, the n and K data were grouped according to their respective numerical values. The flow dimension n value is divided into five different levels of fracture network density: high (3.00 < n < 2.75), medium–high (2.75 < n < 2.25), medium (2.25 < n < 1.75), medium–low (1.75 < n < 1.25), and low (1.25 < n < 1.00). The hydraulic conductivity coefficient is further divided into four levels (H, M, L, and P) with reference to Struckmeire and Margat’s [54] water supply potential table (Table 4). Finally, this study integrated the classification results of n and K and counted the number of fracture network density levels in each level of hydraulic conductivity, as shown in Table 5.
According to the statistical results in the proportion of various hydraulic conductivity levels at the same fracture network density level, a high proportion appears in low hydraulic conductivity, as the fracture network density tends to be lower and vice versa. Thus, the flow dimension n in interpreting fracture network density can also be confirmed by the indicator of K. In addition, Table 5 shows that the main fracture network density of the study area is medium, accounting for about 50%, followed by medium and high density. This finding also indicated the characteristics of geological fragmentation in Taiwan’s mountainous areas.
(E)
Kf/Km ratio
This study attempts to integrate the analysis results of flow dimension n and Kf/Km ratio to understand whether the higher the n value (fracture network density is high), the higher the Kf/Km ratio (fractures dominate the groundwater flow behavior), so as to establish a relationship between them. A two-stage data-selection process was applied based on the target and purpose of obtaining a well correlation. The first stage was to exclude data samples of geological structures that do not have the characteristics of fractures and obstruct the flow of groundwater in each double-packer test section. Through this screening mechanism, a total of 88 data samples were chosen at this stage. The second stage was to exclude data samples for which a high Kf/Km ratio did not accompany a value with high n. According to the concept of flow dimension n, the high n value is expected to have a higher fracture density network, resulting in the appearance of a high Kf/Km ratio (Fractures dominate the groundwater system). However, among 88 data points, few data samples were found to be a reverse trend. For example, a high n value was accompanied by a low Kf/Km ratio.
Figure 8 shows a schematic diagram of two rock mass structures with high fracture network density (high n value). Figure 8a illustrates the rock mass structure with high fracture network density that is consistent with the hypothesis of the flow dimension n theory. The groundwater flow pattern is dominated by fractures, thus obtaining a high Kf/Km ratio. Figure 8b depicts a rock mass structure with high fracture network density that is inconsistent with the hypothesis of the flow dimension n theory. The groundwater flow pattern is dominated by the equivalent porous medium, thus obtaining a lower Kf/Km ratio.
Among 88 data obtained in the first stage, 10 data have high n values (n tends to be 3), but small Kf/Km ratios. These data should belong to the fractured rock mass in the bottom of Figure 8. By exploring the composition and structure of these samples, they are mostly accompanied by sedimentary rocks, and the hydraulic conductivity of their parent rock is relatively large. In addition, because the rock mass is relatively fragmented, the flow dimension n value is close to 3, indicating that the test section’s groundwater flow transmitting ability is quite well. However, the cause of good transmitting ability does not come from the fracture’s rock mass structure dominating the groundwater flow. This rock mass structure is like a porous medium, which cannot show the difference between fracture and bedrock permeability coefficient. Thus, it is inconsistent with the fractured rock mass structure to be explored in this study. After eliminating the test data that are inconsistent with the theory, a total of 78 eligible data were analyzed for the correlation between n value and Kf/Km ratio.
Among 78 samples, the log(Kf/Km) ratio for each double-packer test section was calculated by the procedure stated in Section 2.2.4. Each calculated log(Kf/Km) ratio and its corresponding n value were arranged, in order, according to the log(Kf/Km) ratio from small to large. The arranged samples were grouped into a fixed ratio interval. The average log(Kf/Km) ratio of all samples in each interval was calculated, and the average n value of the samples in each interval was obtained. Table 6 shows that the average log(Kf/Km) ratio for each grouped interval is between 0.4 and 6.53, and its corresponding average n value is between 1.96 and 2.56. Finally, the correlation analysis between the average log(Kf/Km) ratio and average n value was conducted, as shown in Figure 9. The average n value increases with the average log(Kf/Km) ratio, showing a positive correlation. This correlation result indicates that the magnitude of flow dimension n is related to the log(Kf/Km) ratio. This hydrogeological index Kf/Km verifies the feasibility for interpreting potential fracture network density from flow dimension n. Moreover, this result can be used to interpret whether the fractured rock mass structure is the structure where the fractures dominate the groundwater flow.

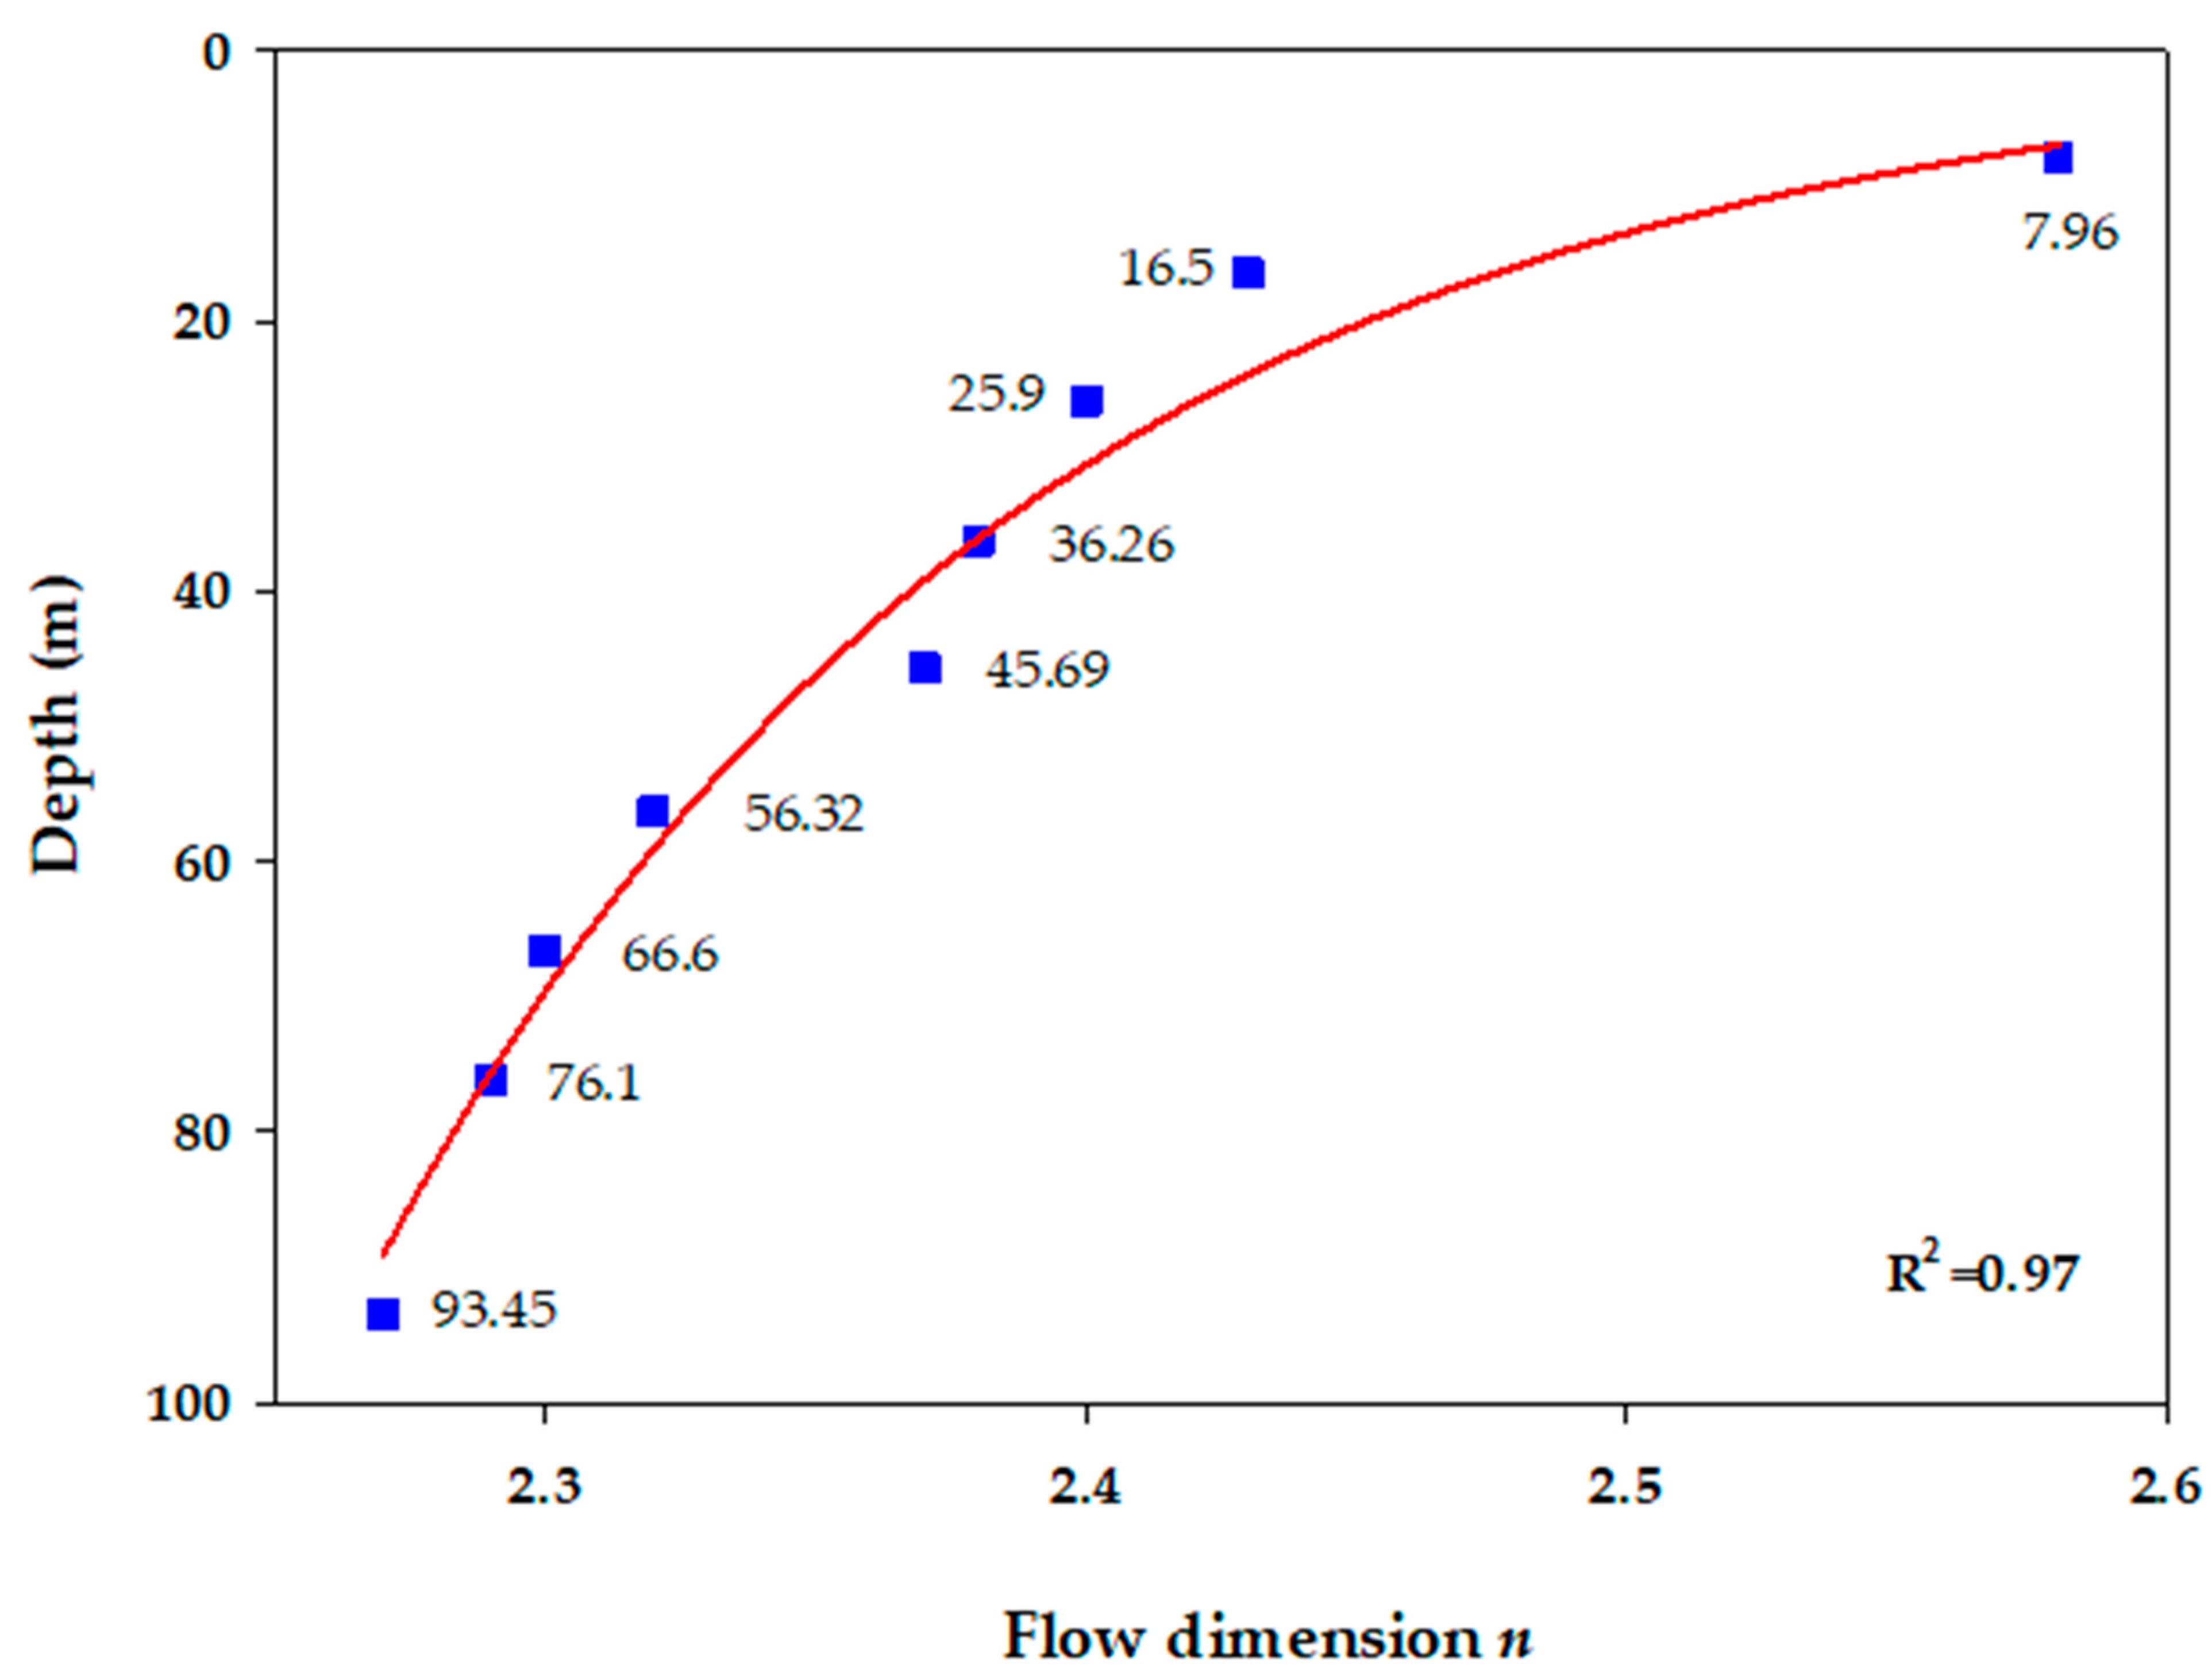
4.2. Relationship between n and Depth

The analysis results of the flow dimension n were used not only to explain the fracture network density around a borehole, but also to understand the variation of the fracture network density with depth in the mountainous area of Taiwan as a practical study. This result provides essential reference information for the development and design of rock engineering in mountainous areas. For example, in view of the problem of the development depth of mountainous groundwater resources that have more economic development benefits, the depth range of the fracture network with higher density in the drilling can be used to provide a reference for the development depth position.
Regarding the relationship between the depth factor and the density of fractured rock masses at the sites in Taiwan’s mountainous areas, this study analyzed 262 sets of double-packer hydraulic test data and obtained the flow dimension n value for each test data by Barker’s general radial flow model [23]. Subsequently, the test depth for each double-packer test section and its corresponding n value were arranged in order according to the depth from the ground to 100 m or the drilling depth of each borehole. The arranged samples were grouped into fixed depth intervals. The average depth of all samples in each interval was calculated, and the average n value of the samples in each interval was obtained as shown in Table 7. Finally, the correlation analysis between average depth and n value was conducted.
Figure 10 shows that the average depth for each grouped interval is between 7.96 and 93.459 m, and its corresponding nave is between 2.27 and 2.58. The average n value decreases with the increase of depth, showing an exponential relationship. The average n value of the first depth interval (0–10 m) nearest to the surface is 2.58, which is the highest n value and belongs to the medium–high level of fracture network density; the average n value of the deepest interval (80–100 m) is 2.27, which is the lowest n value and belongs to the medium level of fracture network density. From the perspective of the entire depth profile, the fracture network density in the shallow area is higher and more developed than that in the deep area. There is an apparent trend of decreasing from the top to bottom of a borehole, which the geostress may cause. Because of this effect, the porosity and amount of fractures may decrease with depth, and, thus, the density of the rock fracture network may decrease. Especially for open fractures, such as exfoliation joins and microcracks presented commonly in all rock types, they decrease their fracture aperture and density with depth [55,56,57]. Thus, the hydraulic conductivity may be reduced due to the structural change of deeper strata, which is detrimental to groundwater resources development in the mountainous areas of Central and Southern Taiwan.

4.3. Relationship between n and Lithology

In total, 253 out of 262 flow dimension data for the lithologies of consolidated rock formations were selected to understand a relationship between flow dimension n and lithology in the mountainous areas of Central and Southern Taiwan. Based on the results, the geometries of groundwater flow in different lithological formations were disclosed to describe their fracture network density. Such information can be used to provide a reference for the subsequent selection of hydrogeological analysis models.
Table 8 is the summary of the flow dimension n values for a variety of lithologies, mainly showing the range of flow dimension n values and the pattern of groundwater flow that may appear in each type of lithologies. This table also summarizes the difference in the flow dimension n values between the two main types of lithologies, including sedimentary rocks and metamorphic rocks, as well as the difference in the n values between the sub-lithology of each main rock type.
The sub-lithology of the sedimentary rock at the test sites of this study includes sandstone, sandstone interbedded with shale, shale, argillaceous sandstone, sandy shale, and mudstone. The average n values range from 1.53 to 3. The flow patterns include linear–cylindrical combined flow, cylindrical flow, cylindrical–spherical combined flow, and spherical flow. The sandstone is the lithology with the largest number of samples among the sedimentary rock types, but the n values of the samples vary widely from 1.13 to 3. Although the lithologies are both classified as sandstone, the fracture condition of rock masses is different, which may affect the groundwater flow pattern and cause the n value to vary significantly. The flow pattern of the overall sandstone test sections is a combination of cylindrical–spherical flow, and the fracture degree of the fractured rock mass is medium to high.
Regarding the results of metamorphic rock types, the analyzed sub-lithology includes schist, slate, gneiss, quartzite, argillite, and marble, which are mainly distributed in the east and west flanks of the Central Mountain Range and between the Coastal Mountains. The average flow dimension n values range from 2.14 to 2.83, and the flow patterns include cylindrical flow, cylindrical–spherical combined flow, and spherical flow. Among them, slate, quartzite, argillite, and schist are the lithologies analyzed more in the metamorphic category in this study area, and the results are representative. According to the statistics, most of the groundwater flow patterns in most test sections are mainly cylindrical flow and cylindrical–spherical combined flow. The fracture degree of the fractured rock mass is a medium and medium–high degree of fragmentation.
The results of all statistical analyses from various lithologies show that significant differences in the degree of fracture and geometry of the fractured rock masses have been found. The main reason comes from the geological complexity of Taiwan, coupled with the active orogenic movement. Thus, samples with the same lithology often have a large difference in the n value of flow dimension due to the effect on the rock structure.

4.4. Relationship between Kf/Km and Lithology

The Kf/Km ratio is not only used as a hydrogeological index for the validation of this study, but also can be used to understand the difference between fractured and intact rock permeability coefficients of different lithologies in the study area. This result is useful for understanding which medium controls the flow of groundwater. Moreover, it may help determine an appropriate groundwater flow model of the existing geological environment, such as the Dual-Porosity Model, Equivalent Pore Model, or Discrete Fracture Network Model.
According to the results of Kf/Km in Section 4.1, this study further explored the range of Kf/Km ratio distribution between sedimentary and metamorphic lithologies in Central and Southern Taiwan, as shown in Figure 11. The log(Kf/Km) ratios for 88 data samples are between 0 and 7, and about 60% of the log(Kf/Km) ratios are between 3 and 5. Figure 11 also shows the respective proportions of sedimentary and metamorphic rock types within the same ratio class. The percentage of each rock type in each ratio class shows that about 76% of the metamorphic rock types have log(Kf/Km) ratios between 4 and 6, while the sedimentary rocks have a relatively small percentage of 24%, and the remaining ones are mostly between 1 and 3. In other words, the metamorphic rocks in Southern and Central Taiwan have a higher chance of having high permeability ratios than the sedimentary rocks, and fractures dominate the groundwater flow.

5. Conclusions

In the design and planning of groundwater-related projects, hydraulic test data are usually used to obtain hydraulic conductivity. This study used the existing hydraulic test data in the mountainous area of Taiwan, for the application of fracture network system identification. The main conclusions can be summarized as follows:
  • Constant-head hydraulic test data combined with Baker’s general radial flow model successfully carried out the disclosure of flow dimension n. The disclosure of the n parameter was used to describe the geometry of the groundwater flow in the fractured rock mass and to estimate its fracture network density around each test section. The related results have preliminarily established an economical and effective method of discovering fracture network patterns.
  • Five proposed hydrogeological indices, namely RQD, FA, FD, hydraulic conductivity, and Kf/Km ratio, were used to investigate the correlation between n and each index. The results show that, the larger the n value, the smaller the RQD, the higher the FD, the larger the FA, the larger the hydraulic conductivity, and the greater the Kf/Km ratio. All hydrogeological indices have high correlations with the flow dimension n values. Based on the successful verifications, the proposed method for the interpretation of fracture network patterns is feasible.
  • The results of the flow-dimension n values have two other additional contributions to the study area: (a) The relation between n and depth showed that a higher n value appears at the shallower depth, which is based on the reference of 100 m borehole. This finding gives information about groundwater availability or a drilling depth for maximizing profits concerning the water supplies available; (b) the relation between n and lithology show that the n values of both sedimentary and metamorphic rocks vary considerably. In addition, the average n value of flow dimension of metamorphic rocks is slightly larger than that of sedimentary rocks, which means that the fracture network of fractured rocks is denser than that of sedimentary rocks.
  • Finally, based on the result of the Kf/Km ratio correlated with different lithologies, the metamorphic rocks in Southern and Central Taiwan have a higher chance of having high permeability ratios than the sedimentary rocks. In other words, the metamorphic rocks are fragmented relative to sedimentary rocks, and the groundwater flow is dominated by fractures.

Author Contributions

Conceptualization, supervision, project administration, and funding acquisition, S.-M.H.; methodology, formal analysis, and investigation, S.-M.H., C.-M.C. and H.-L.L.; resources, C.-C.K.; writing—original draft preparation, S.-M.H.; writing—review and editing, C.-Y.K.; visualization, S.-M.H., C.-Y.K. and C.-C.K. All authors have read and agreed to the published version of the manuscript.

Funding

This work was partially supported by the Ministry of Science and Technology of Taiwan (MOST 108-2116-M-019-003-).

Acknowledgments

The authors express their gratitude to the Central Geological Survey, Ministry of Economic Affairs (MOEA) of Taiwan, for offering hydrogeological raw data used in this study.

Conflicts of Interest

The authors declare no conflict of interest.

References

  1. Hsu, S.-M.; Hsu, J.-P.; Ke, C.-C.; Lin, Y.-T.; Huang, C.-C. Rock mass permeability classification schemes to facilitate groundwater availability assessment in mountainous areas: A case study in Jhuoshuei river basin of Taiwan. Geosci. J. 2020, 24, 209–224. [Google Scholar] [CrossRef]
  2. Hsu, S.M.; Ke, C.C.; Lin, Y.T.; Huang, C.C.; Wang, Y.S. Unravelling preferential flow paths and estimating groundwater potential in a fractured metamorphic aquifer in Taiwan by using borehole logs and hybrid DFN/EPM model. Environ. Earth Sci. 2019, 78. [Google Scholar] [CrossRef]
  3. Selroos, J.-O.; Follin, S. Overview of hydrogeological site-descriptive modeling conducted for the proposed high-level nuclear waste repository site at Forsmark, Sweden. Hydrogeol. J. 2014, 22, 295–298. [Google Scholar] [CrossRef]
  4. Tsang, C.-F.; Neretnieks, I.; Tsang, Y. Hydrologic issues associated with nuclear waste repositories. Water Resour. Res. 2015, 51, 6923–6972. [Google Scholar] [CrossRef] [Green Version]
  5. Cherry, J.A.; Parker, B.L.; Keller, C. A New Depth-Discrete Multilevel Monitoring Approach for Fractured Rock. Groundwater Monit. Remediat. 2007, 27, 57–70. [Google Scholar] [CrossRef]
  6. Becker, M.W.; Shapiro, A.M. Tracer transport in fractured crystalline rock: Evidence of nondiffusive breakthrough tailing. Water Resour. Res. 2000, 36, 1677–1686. [Google Scholar] [CrossRef] [Green Version]
  7. Maliva, R.G. Aquifer Characterization Techniques; Springer: Berlin, Germany, 2016. [Google Scholar]
  8. Lo, H.-C.; Chen, P.-J.; Chou, P.-Y.; Hsu, S.-M. The combined use of heat-pulse flowmeter logging and packer testing for transmissive fracture recognition. J. Appl. Geophys. 2014, 105, 248–258. [Google Scholar] [CrossRef]
  9. Yihdego, Y. Hydraulic In Situ Testing for Mining and Engineering Design: Packer Test Procedure, Preparation, Analysis and Interpretation. Geotech. Geol. Eng. 2016, 35, 29–44. [Google Scholar] [CrossRef]
  10. Klepikova, M.V.; Le Borgne, T.; Bour, O.; Davy, P. A methodology for using borehole temperature-depth profiles under ambient, single and cross-borehole pumping conditions to estimate fracture hydraulic properties. J. Hydrol. 2011. [Google Scholar] [CrossRef]
  11. Read, T.; Bour, O.; Bense, V.; Le Borgne, T.; Goderniaux, P.; Klepikova, M.V.; Hochreutener, R.; Lavenant, N.; Boschero, V. Characterizing groundwater flow and heat transport in fractured rock using fiber-optic distributed temperature sensing. Geophys. Res. Lett. 2013, 40, 2055–2059. [Google Scholar] [CrossRef] [Green Version]
  12. Vitale, M.; Selker, F.; Selker, J.; Young, P. Downhole Distributed Temperature Sensing in Fractured Rock. J. Nev. Water Resour. Assoc. 2017. [Google Scholar] [CrossRef]
  13. Serzu, M.H.; Kozak, E.T.; Lodha, G.S.; Everitt, R.A.; Woodcock, D.R. Use of borehole radar techniques to characterize fractured granitic bedrock at AECL’s Underground Research Laboratory. J. Appl. Geophys. 2004, 55, 137–150. [Google Scholar] [CrossRef]
  14. Shakas, A.; Linde, N.; Baron, L.; Bochet, O.; Bour, O.; Le Borgne, T. Hydrogeophysical characterization of transport processes in fractured rock by combining push-pull and single-hole ground penetrating radar experiments. Water Resour. Res. 2016, 52, 938–953. [Google Scholar] [CrossRef] [Green Version]
  15. Berg, S.J.; Illman, W.A. Field study of subsurface heterogeneity with steady-state hydraulic tomography. Ground Water 2013, 51, 29–40. [Google Scholar] [CrossRef] [PubMed]
  16. Illman, W.A. Hydraulic tomography offers improved imaging of heterogeneity in fractured rocks. Ground Water 2014, 52, 659–684. [Google Scholar] [CrossRef] [PubMed]
  17. Ellefsen, K.J.; Hsieh, P.A.; Shapiro, A.M. Crosswell seismic investigation of hydraulically conductive, fractured bedrock near Mirror Lake, New Hampshire. J. Appl. Geophys. 2002, 50, 299–317. [Google Scholar] [CrossRef]
  18. Day-Lewis, F.D.; Slater, L.D.; Robinson, J.; Johnson, C.D.; Terry, N.; Werkema, D. An overview of geophysical technologies appropriate for characterization and monitoring at fractured-rock sites. J. Environ. Manag. 2017, 204, 709–720. [Google Scholar] [CrossRef]
  19. Hatfield, K.; Annable, M.; Cho, J.; Rao, P.S.; Klammler, H. A direct passive method for measuring water and contaminant fluxes in porous media. J. Contam. Hydrol. 2004, 75, 155–181. [Google Scholar] [CrossRef]
  20. Annable, M.D.; Hatfield, K.; Cho, J.; Klammler, H.; Parker, B.L.; Cherry, J.A.; Rao, P.S. Field-scale evaluation of the passive flux meter for simultaneous measurement of groundwater and contaminant fluxes. Environ. Sci. Technol. 2005, 39, 7194–7201. [Google Scholar] [CrossRef]
  21. Dougherty, J.; Macbeth, T.; MacDonald, B.; Truesdale, R.; Newman, M.; Cho, J.; Annable, M.; Cutt, D.; Mishkin, K.; Brooks, M. Comparative Evaluation of Contaminant Mass Flux and Groundwater Flux Measurements in Fractured Rock Using Passive Flux Meters.; U.S. Environmental Protection Agency: Washington, DC, USA, 2018. [Google Scholar]
  22. Central Geological Survey of Taiwan. Groundwater Resources Investigation Program for Mountainous Region of Central Taiwan (1/4); Ministry of Economic Affairs: Taipei, Taiwan, 2010. [Google Scholar]
  23. Barker, J.A. A generalized radial flow model for hydraulic tests in fractured rock. Water Resour. Res. 1988, 24, 1796–1804. [Google Scholar] [CrossRef] [Green Version]
  24. Black, J.H. Hydrogeology of Fractured Rocks—A Question of Uncertainty about Geometry. Hydrogeol. J. 1994, 2, 56–70. [Google Scholar] [CrossRef]
  25. Theis, C.V. The relation between the lowering of the Piezometric surface and the rate and duration of discharge of a well using groundwater storage. Trans. Am. Geophys. Union 1935, 16. [Google Scholar] [CrossRef]
  26. Doe, T.W.; Geier, J. Interpretation of Fracture System Geometry Using Well Test Data; Swedish Nuclear Fuel and Waste Management, Co.: Stockholm, Sweden, 1990. [Google Scholar]
  27. Lods, G.; Gouze, P. WTFM, software for well test analysis in fractured media combining fractional flow with double porosity and leakance approaches. Comput. Geosci. 2004, 30, 937–947. [Google Scholar] [CrossRef]
  28. Verbovsek, T. Influences of aquifer properties on flow dimensions in dolomites. Ground Water 2009, 47, 660–668. [Google Scholar] [CrossRef] [PubMed]
  29. Kuusela-Lahtinen, A.; Poteri, A. Interpretation of Flow Dimensions from Constant Pressure Injection Test; Posiva Oy: Eurajoki, Finland, 2010. [Google Scholar]
  30. Central Geological Survey of Taiwan. Ground-Water Resources Investigation Program for Mountainous Region of Central Taiwan (4/4); Ministry of Economic Affairs: Taipei, Taiwan, 2013. [Google Scholar]
  31. Central Geological Survey of Taiwan. Ground-Water Resources Investigation Program for Mountainous Region of Southern Taiwan (4/4); Ministry of Economic Affairs: Taipei, Taiwan, 2017. [Google Scholar]
  32. Deere, D.; Hendron, A.; Patton, F.; Cording, E. Design of surface and near-surface construction in rock. In Proceedings of the 8th US symposium on rock mechanics (USRMS), Minneapolis, MN, USA, 15–17 September 1966. [Google Scholar]
  33. Singhal, B.B.S.; Gupta, R.P. Applied Hydrogeology of Fractured Rocks; Springer Science & Business Media: New York, NY, USA, 2010. [Google Scholar]
  34. Graham, J.W.; Richardson, J.G. Theory and Application of Imbibition Phenomena in Recovery of Oil. J. Pet. Technol. 1959, 11, 65–69. [Google Scholar] [CrossRef]
  35. Streltsova, T.D. Well Pressure Behavior of a Naturally Fractured Reservoir. Soc. Pet. Eng. J. 1983, 23, 769–780. [Google Scholar] [CrossRef]
  36. Hughes, R.G.; Brigham, W.E.; Castanier, L.M. CT Measurements of Two-Phase Flow in Fractured Porous Media; DOE/BC/14899-45; USDOE Assistant Secretary for Fossil Energy: Washington, DC, USA, 1997. [Google Scholar]
  37. Graue, A.; Nesse, K.; Baldwin, B.; Spinler, E.; Tobola, D. Impact of fracture permeability on oil recovery in moderately water-wet fractured chalk reservoirs. In Proceedings of the SPE/DOE Thirteenth Symposium on Improved Oil Recovery, Tulsa, Oklahoma, 13–17 April 2002. [Google Scholar]
  38. Kahrobaei, S.; Farajzadeh, R.; Suicmez, V.S.; Bruining, J. Gravity-Enhanced Transfer between Fracture and Matrix in Solvent-Based Enhanced Oil Recovery. Ind. Eng. Chem. Res. 2012, 51, 14555–14565. [Google Scholar] [CrossRef] [Green Version]
  39. Chacon, A. Effect of Pressure Depletion on Hydrocarbon Recovery in Naturally Fractured Reservoirs. Ph.D. Thesis, University of Oklahoma, Norman, OK, USA, 2006. [Google Scholar]
  40. Eikemo, B.; Lie, K.; Eigestad, G.; Dahle, H.J.A.W.R. A discontinuous galerkin method for transport in fractured media using unstructured triangular grids. Adv. Water Resour. 2009, 32, 493–506. [Google Scholar] [CrossRef]
  41. Taylor, W.L.; Pollard, D.D.; Aydin, A. Fluid flow in discrete joint sets: Field observations and numerical simulations. J. Geophys. Res. Solid Earth 1999, 104, 28983–29006. [Google Scholar] [CrossRef]
  42. Matthäi, S.K.; Belayneh, M. Fluid flow partitioning between fractures and a permeable rock matrix. Geophys. Res. Lett. 2004, 31. [Google Scholar] [CrossRef]
  43. Bairos, K. Insights from use of a 3-D Discrete-Fracture Network Numerical Model for Hydraulic Test Analysis. Master’s Thesis, University of Guelph, Guelph, ON, Canada, 2012. [Google Scholar]
  44. Snow, D.T. Anisotropie Permeability of Fractured Media. Water Resour. Res. 1969, 5, 1273–1289. [Google Scholar] [CrossRef]
  45. Wang, J.S.Y.; Trautz, R.C.; Cook, P.J.; Finsterle, S.; James, A.L.; Birkholzer, J. Field tests and model analyses of seepage into drift. J. Contam. Hydrol. 1999, 38, 323–347. [Google Scholar] [CrossRef]
  46. McLaren, R.G.; Forsyth, P.A.; Sudicky, E.A.; VanderKwaak, J.E.; Schwartz, F.W.; Kessler, J.H. Flow and transport in fractured tuff at Yucca Mountain: Numerical experiments on fast preferential flow mechanisms. J. Contam. Hydrol. 2000, 43, 211–238. [Google Scholar] [CrossRef]
  47. Vilks, P.; Baik, M.-H. Laboratory migration experiments with radionuclides and natural colloids in a granite fracture. J. Contam. Hydrol. 2001, 47, 197–210. [Google Scholar] [CrossRef]
  48. Martinez-Landa, L.; Carrera, J. An analysis of hydraulic conductivity scale effects in granite (Full-scale Engineered Barrier Experiment (FEBEX), Grimsel, Switzerland). Water Resour. Res. 2005, 41. [Google Scholar] [CrossRef]
  49. Le Borgne, T.; Bour, O.; Riley, M.S.; Gouze, P.; Pezard, P.A.; Belghoul, A.; Lods, G.; Le Provost, R.; Greswell, R.B.; Ellis, P.A.; et al. comparison of alternative methodologies for identifying and characterizing preferential flow paths in heterogeneous aquifers. J. Hydrol. 2007, 345, 134–148. [Google Scholar] [CrossRef]
  50. NASEM. Characterization, Modeling, Monitoring, and Remediation of Fractured Rock; The National Academies Press: Washington, DC, USA, 2015; p. 181. [Google Scholar]
  51. Batu, V. Aquifer Hydraulics: A Comprehensive Guide to Hydrogeologic Data Analysis; Wiley: Hoboken, NJ, USA, 1998. [Google Scholar]
  52. Freeze, R.A.; Cherry, J.A. Groundwater; Prentice-Hall: Upper Saddle River, NJ, USA, 1979. [Google Scholar]
  53. Central Geological Survey of Taiwan. Geological Map of Taiwan Scale 1:50,000; Ministry of Economic Affairs: Taipei, Taiwan, 2020. [Google Scholar]
  54. Struckmeier, W.F.; Margat, J. Hydrogeological Maps: A Guide and a Standard Legend; Verlag Heinz Heise: Hannover, Germany, 1995. [Google Scholar]
  55. Gorbatsevich, F.F. Decompaction mechanism of deep crystalline rocks under stress relief. Tectonophysics 2003, 370, 121–128. [Google Scholar] [CrossRef]
  56. Ziegler, M.; Loew, S.; Bahat, D. Growth of exfoliation joins and near–surface stress orientations inferred from fractographic markings observed in the upper Aar valley (Swiss Alps). Tectonophysics 2014, 626, 1–20. [Google Scholar] [CrossRef]
  57. Freire-Lista, D.M.; Fort, R. Exfoliation microcracks in building granite. Implications for anisotropy. Eng. Geol. 2017, 220, 85–93. [Google Scholar] [CrossRef] [Green Version]
Figure 1. Locations of the study area and geologic boreholes [30,31,53].
Applsci 11 02127 g001
Figure 2. The process of a double-packer constant head hydraulic test at the interval of 22.3–23.7 m in a specific borehole.
Applsci 11 02127 g002
Figure 3. Quantity distribution of different rock-quality designation (RQD) levels for the samples of n > 2.25.
Applsci 11 02127 g003
Figure 4. Quantity distribution of different RQD levels for the samples of n > 2.75.
Applsci 11 02127 g004
Figure 5. Relationship between n and FA.
Applsci 11 02127 g005
Figure 6. Schematics of different fracture width patterns in a fixed test interval.
Applsci 11 02127 g006
Figure 7. Relationship between n and FD.
Applsci 11 02127 g007
Figure 8. Schematic diagram of two types of rock mass structures with high fracture network density ((a) high Kf/Km ratio and (b) low Kf/Km ratio).
Applsci 11 02127 g008
Figure 9. Relationship between n and Kf/Km.
Applsci 11 02127 g009
Figure 10. Relationship between n and depth factor.
Applsci 11 02127 g010
Figure 11. Histogram of log(Kf/Km) for two types of lithology (sedimentary and metamorphic rock).
Applsci 11 02127 g011
Table 1. Specific storage for different materials [51].
MaterialSs (m −1)
Plastic clay 2.56 × 10 3 2.03 × 10 2
Stiff clay 1.28 × 10 3 2.56 × 10 3
Medium hard clay 9.18 × 10 4 1.28 × 10 3
Loose sand 4.92 × 10 4 1.02 × 10 3
Dense sand 1.28 × 10 4 2.03 × 10 4
Dense sandy gravel 4.92 × 10 5 1.02 × 10 4
Rock, fissured 3.28 × 10 6 6.90 × 10 5
Rock, sound< 3.28 × 10 6
Table 2. Compressibility for different aquifer materials [52].
MaterialCompressibility, α (m2/N or Pa−1)
Clay 1.0 × 10 8 to 1.0 × 10 6
Sand 1.0 × 10 9 to 1.0 × 10 7
Gravel 1.0 × 10 10 to 1.0 × 10 8
Jointed rock 1.0 × 10 10 to 1.0 × 10 8
Sound rock 1.0 × 10 11 to 1.0 × 10 9
Table 3. Results for grouping fracture aperture (FA) and fracture density (FD) data.
FAFD
Interval of Aperture (cm)Average Aperture (cm)Average Flow Dimension nQuantity of SamplesQuantity of Fractures per Test IntervalAverage Flow Dimension nQuantity of Samples
0∼10.632.051912.247
1∼21.332.22322.115
2∼32.392.261432.214
3∼43.552.452042.4313
4∼54.552.471552.57
5∼65.372.5972.495
6∼76.272.44782.516
7∼97.92.519
9∼109.62.573
>1010.92.7211
Table 4. Hydraulic conductivity classes (modified from Reference [54]).
Hydraulic Conductivity (m/s)Potential of Water SupplyLevel
>4 × 10⁻⁵Regional supplyH
2 × 10⁻⁶ ∼ 4 × 10⁻⁵Local supplyM
2 × 10⁻⁸ ∼ 4 × 10⁻⁶Partly local supplyL
<2 × 10⁻⁸Lack of groundwater resourcesP
Table 5. Integration of n and K classes.
Potential of Water Supply
Fracture Network Density
(Flow Dimension n)
H
(Regional Supply)
M
(Local Supply)
L
(Partly Local Supply)
P
(Lack of Groundwater Resources)
Overall
Quantity
(Proportion at the Same Class)
Low 00033
(n < 1.25)(0%)(0%)(0%)(100%)
Low to medium 015410
(1.25 < n < 1.75)(0%)(10%)(50%)(40%)
Medium 0824739
(1.75 < n < 2.25)(0%)(21%)(62%)(18%)
Medium to high 0109120
(2.25 < n < 2.75)(0%)(50%)(45%)(5%)
High34108
(2.75 < n)(38%)(50%)(13%)(0%)
Table 6. Results for grouping Kf/Km data.
Interval of log(Kf/Km)Average of log(Kf/Km)Average Flow Dimension nQuantity
0∼10.41.963
1∼21.722.065
2∼32.472.128
3∼43.512.2720
4∼54.472.4118
5∼65.482.5415
6∼76.532.569
Table 7. Results for grouping depth data.
Interval of Depth (m)Average Depth (m)Average Flow Dimension nQuantity
0∼107.962.589
10.1∼2016.52.4328
20.1∼3025.92.441
30.1∼4036.262.3832
40.1∼5045.692.3735
50.1∼6056.322.3225
60.1∼7066.62.332
70.1∼8076.12.2928
80.1∼10093.452.2732
Table 8. Flow dimension n for various lithologies.
LithologyQuantityRange of
Flow Dimension n
Average of
Flow Dimension n
Groundwater Flow Pattern
Sedimentary Rock
Sandstone871.11∼32.42Spherical–Radial combined flow
Sandstone interbedded with Shale361.3∼32.39Spherical–Radial combined flow
Shale171∼32.26Spherical–Radial Flow
Argillaceous
Sandstone
61.57∼32.31Spherical–Radial combined flow
Sandy Shale31.6∼2.011.85Radial Flow
Mudstone21.26∼1.81.53Linear–Radial combined flow
Overall Sedimentary Rock1511∼32.36Spherical–Radial combined flow
Metamorphic rock
Slates321.39∼32.38Spherical–Radial combined flow
Quartzite221.39∼32.33Spherical–Radial combined flow
Schists201.29∼32.14Radial Flow
Argillite191.8∼32.38Spherical–Radial combined flow
Marble61.98∼32.83Spherical Flow
Gneiss31.85∼32.44Spherical–Radial combined flow
Overall Metamorphic Rock1021.29∼32.38Spherical–Radial combined flow
Publisher’s Note: MDPI stays neutral with regard to jurisdictional claims in published maps and institutional affiliations.

