Abstract
In the field of surgery, bioresorbable magnesium is considered a promising candidate. Its low corrosion resistance, which is disadvantageous for technical application, is advantageous for surgery since the implant fully degrades in the presence of the water-based body fluids, and after a defined time the regenerating bone takes over its function again. Therefore, knowledge of the corrosion behavior over several months is essential. For this reason, an in vitro short-time testing method is developed to accelerate the corrosion progress by galvanostatic anodic polarization without influencing the macroscopic corrosion morphology. The initial corrosion rate of the magnesium alloy WE43 is calculated by detection of the hydrogen volume produced in an immersion test. In a corresponding experimental setup, a galvanostatic anodic polarization is applied with a three-electrode system. The application range for the polarization is determined based on the corrosion current density from potentiodynamic polarization. To correlate the initial corrosion rate, and accelerated dissolution rate, the corrosion morphologies of both test strategies are characterized by microscopy images, as well as energy dispersive X-ray spectroscopy and Fourier-transform infrared spectroscopy. The results demonstrate that the dissolution rate can be increased in the order of decades with the limitation of a changed corrosion morphology with increasing polarization. With this approach, it is possible to characterize and exclude new unsuitable magnesium alloys in a time-efficient manner before they are used in subsequent preclinical studies.
1. Introduction
The element magnesium (Mg) is involved in many biochemical mechanisms of the human body, including wound healing, hard and soft tissue regeneration, as well as protein synthesis [1,2,3]. It has also been shown that Mg is involved in processes that promote bone growth [4]. Due to its similar mechanical properties to human (cortical) bone and its biodegradable properties, magnesium is the focus of research for surgical applications such as reconstruction plates/screws and regeneration scaffolds [5,6]. Magnesium and its low corrosion resistance has proven to be of advantage since the implant fulfills its function over a defined period (functional phase) and fully degraded afterwards, making the usual implant removal with all its risks and costs obsolete [4,7].
For this application, however, exact knowledge of the duration of the functional phase must be provided so that the progressive reduction in mechanical stability does not lead to premature implant failure and thereby to a risk to human health [8]. Furthermore, magnesium corrosion is accompanied by hydrogen release and alkalization of the implant environment, possibly leading to gas cavity formation and worsening of the healing process [4]. There are various methods to evaluate the corrosion process and corrosion rate. A distinction must be made between an in vitro corrosion rate, determined in a preclinical trial, and an in vivo corrosion rate, determined in an animal experiment. Since animal experiments are ethically questionable, many studies focus on in vitro corrosion investigations [9,10,11], which can be divided into electrochemical [12,13,14] and immersion investigations [15,16,17]. In the field of electrochemical testing, potentiodynamic polarization (PDP) measurement is often used due to the short test duration. However, owing to the negative difference effect (NDE), it leads to inaccurate values of the corrosion rate. According to current studies, the applied anodic polarization leads to a cathodic activation of the sample resulting in a surface layer with a persistent cathodic effect reducing by a cathodic value the anodic current density falsifying the results [18,19,20]. Hence, PDP measurement should mainly be used to estimate the corrosion rate and for the qualitative comparison of different material conditions.
The current method to determine the in vitro corrosion rate and evaluate the corrosion behavior is the immersion test with detection of the hydrogen volume produced and or the mass loss [11,15,16,17]. The corrosion rate can be determined immediately via the mass loss; however, it does not allow in situ measurements, and the removal of the corrosion layer by—e.g., the carcinogenic chromic acid—is another disadvantage. In contrast, hydrogen detection allows an indirect calculation of the corrosion rate by using the reaction equation of Mg corrosion. It enables an in situ measurement [21], allowing the evaluation of a time-dependent corrosion behavior, which is of advantage compared to PDP. Due to the formation of an inhibiting corrosion layer, Mg alloys usually exhibit a time-dependent corrosion behavior. The uncorroded surface is more reactive, resulting in a high hydrogen evolution rate (HER). The arising corrosion layer is porous and allows the electrolyte to access the surface. With increasing immersion time, a thicker, more protective corrosion layer is formed, leading to a decrease in accessibility and thus to a decrease in HER [11,22,23]. This effect can be enhanced by alloying elements that change the nature of the corrosion layer [24]. An adverse effect can be observed due to corrosion pit formation. The accumulation of alloying elements leads to micro-galvanic effects resulting in locally enhanced dissolution and hydrogen formation. Since the formation and the growth of the corrosion pits is a stochastic process, the probability of their occurrence increases with increasing immersion time [22]. Due to the time-dependent corrosion behavior and the long intended lifetime in the human body, a corresponding long immersion time is necessary [4]. The relatively short durability of the current corrosion media leads to periodic renewal. On the one hand, the medium exchange can influence the corrosion process, on the other hand, it results in high testing efforts and costs.
The present study investigates a short-time testing method to accelerate the corrosion process without influencing the macroscopic corrosion morphology. For this purpose, a modification of the common Mg alloy WE43 (yttrium, neodymium, zirconium) is used. This alloy has a suitable property profile of corrosion resistance and biocompatibility [10,25]. It should be noted that alloy WE43 is studied as an example and the method to be developed should be applicable to all other magnesium alloys. In the first step, the initial corrosion rate is determined in immersion tests by detecting the hydrogen volume. Based on PDP measurements, an application range for galvanostatic anodic polarization is evaluated so that in the second step, immersion tests with polarization are carried out to accelerate the dissolution rate. These investigations are accompanied by a microstructural analysis of the corrosion morphology. The short-time testing method aims to generate a mathematical correlation between the polarization current density and the dissolution rate, allowing an estimation of longer immersion times and an exclusion of unsuitable Mg alloys before preclinical examination.
2. Materials and Methods
Extruded rod material of the magnesium alloy WE43 (yttrium 3.62–3.78 wt %, neodymium 2.74–2.91 wt %, zirconium 0.24–0.28 wt %; Meotec GmbH, Aachen, Germany) with an initial diameter of 9.5 mm is used. The rod material is separated into cylinders and embedded with a non-conductive cold embedding agent. The samples are polished to 1 µm with water-free diamond suspension. A drilling in the back side of the embedding agent allows the samples to be electrically connected. This procedure is used for both microstructural and corrosion investigations. The microstructure, as well as the elemental distribution, are characterized using a focused ion beam scanning electron microscope (FIB-SEM, Crossbeam XB 550L, Carl Zeiss AG, Oberkochen, Germany) with an integrated energy dispersive X-ray spectroscopy (EDS) detector. The different magnifications are investigated at a working distance of 2.7 mm and acceleration voltages of 5 and 15 kV.
2.1. Corrosion Investigations
For all investigations, the same experimental setup is used, it consists of a self-developed corrosion cell, which is continuously supplied with an electrolyte via a peristaltic pump. The electrolyte is kept at a temperature of 36.5 °C by a thermostat. The electrolyte used is a minimum essential medium (MEM, Nr. 31095029, Life Technologies, Carlsbad, CA, USA) with an addition of 1% glutamine. This composition is comparable to the physiological human blood plasma (Table 1), hence, to the in vivo situation, and could be evaluated as suitable in previous studies [10,26].

Table 1.
Composition of the electrolyte used (modified minimum essential medium (MEMm)) in comparison to human blood plasma. Values are taken from the product data sheets and from [27].
The addition of 1% penicillin/streptomycin and 1% fungizone prevents early contamination by bacteria and fungi. Since electrochemical measurements are used, the experimental setup (apart from the electrical components) is located in a Faraday cage, minimizing external sources of interference (electric field and electromagnetic wave). Through a screw fixing, the embedded samples are pressed against an opening in the bottom plate of the corrosion cell so that the magnesium samples are in direct contact with the electrolyte and electrically connected via the drilling in the back side. The corrosion cell has one port, each for a graphite counter electrode and an Ag/AgCl reference electrode, including the Haber-Luggin capillary. For the experiments without electrochemical measuring technique, these ports are closed. A PCI4300 potentiostat (Gamry Instruments Inc, Warminster, PA, USA) is used for the experiments. A burette with a collecting funnel is placed over the sample to measure the volume of hydrogen produced. The medium-volume-to-area ratio of the corrosion cell is 176.4 mL cm−2 and is, therefore, sufficient according to Kirkland et al. [28]. Besides, the peristaltic pump ensures a continuous exchange of the medium to avoid saturation effects (Figure 1).
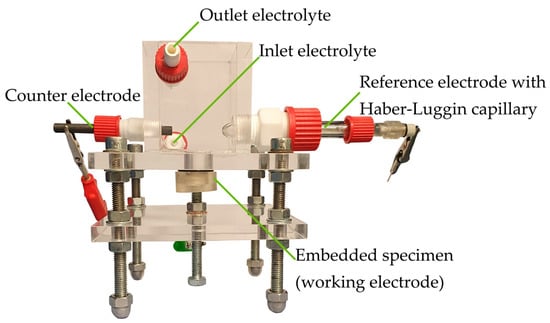
Figure 1.
General experimental setup for corrosion investigations. Illustration with counter and reference electrode, these ports are closed for immersion tests without galvanostatic polarization.
2.1.1. Potentiodynamic Polarization
Potentiodynamic polarization (PDP) measurements are performed in a potential interval from 250 mV in the cathodic to 700 mV in the anodic range relative to the open circuit potential (OCP). A scan rate of 0.8 mV s−1 is used to increase the potential. The measurements are started after reaching the OCP. After the test has been carried out, the actual corroded area is determined by a light microscope, and these values are used to calculate the current densities i. The experiments are evaluated by the software Echem Analyst (Gamry Instruments Inc, Warminster, PA, USA) using Tafel extrapolation of the cathodic branch to determine the corrosion current density icorr and Faraday’s law to estimate the corrosion rate Furthermore, the Tafel curves are used for the dimensioning of the immersion tests with galvanostatic anodic polarization.
2.1.2. Immersion Tests without Galvanostatic Polarization
Immersion tests are carried out to evaluate the unaccelerated corrosion behavior and to determine the initial corrosion rate . Achieving a constant corrosion rate is a key requirement for the development of the method. An immersion time of 48 h is used. On the one hand, this ensures that the criterion of a constant corrosion rate is achieved and, on the other hand, that the durability of the corrosion medium is not exceeded. By avoiding a medium exchange, an influence on the corrosion rate is to be prevented. The volume of hydrogen produced is measured at defined intervals via the attached burette. The macroscopic corrosion morphology is examined with a light microscope (Axio Imager M1m, Carl Zeiss AG, Oberkochen, Germany) and the microscopic morphology using a SEM (Mira 3 XMU, Tescan GmbH, Dortmund, Germany), as well as the corrosion products by EDS. A working distance of 15–25 mm and an acceleration voltage of 10 kV is used for the different magnifications. To determine the organic compounds in the corrosion layer, Fourier-transform infrared spectroscopy (FTIR) scans are carried out. These are performed using the infrared spectroscope IRTracer-100 (Shimadzu Corporation, Kyoto, Japan) equipped with an ATR-Ge module (attenuated total reflection, germanium) in a wavenumber range from 4000 to 400 cm−1 with a resolution of 2 cm−1. For the investigations, 20 scans are performed and averaged. Before each scan, a background scan is performed to take the environmental conditions into account. The evaluation of the scans, and a possible correction of the baseline drift, is done with the software LabSolutionsIR.
2.1.3. Immersion Tests with Galvanostatic Polarization
To increase the dissolution rate, immersion tests with galvanostatic anodic polarization are performed. The procedure is analogous to the unaccelerated immersion tests. The dimensioning of the polarization steps is based on the results of the PDP measurements and varies between 0.5 and 20 mA cm−2. To avoid overlapping effects, the polarization starts when the OCP has reached a constant value. The intervals for the hydrogen volume detection are adapted to the respective polarization step, and thus to the hydrogen evolution rate (HER).
3. Results
3.1. Microstructure—Initial Condition
Figure 2a,b show characteristic scanning electron microscope (SEM) images of the microstructure in its initial condition. Over the entire area, precipitates of alloying elements of various shapes and sizes are distributed. Most of the precipitates have a circular or stick-like shape, but no uniform orientation of the sticks is discernible. The size ranges from a few 100 nm to about 1 µm. Furthermore, the precipitates are hardly distinguishable from each other in terms of their contrast. The energy dispersive X-ray spectroscopy (EDS) mappings (Figure 2c–f) confirm the assumption that these are enrichments of the alloying elements and areas with a lower magnesium content. Yttrium- and neodymium-rich precipitates are mainly present. Zirconium can also be detected in some cases. The mappings also show that yttrium and neodymium are detected simultaneously in the magnesium-poor regions and that these must therefore be intermetallic compounds of both elements resulting in the homogeneous contrast despite the density differences. Due to the small precipitates size, a quantitative determination of the compounds is not possible.
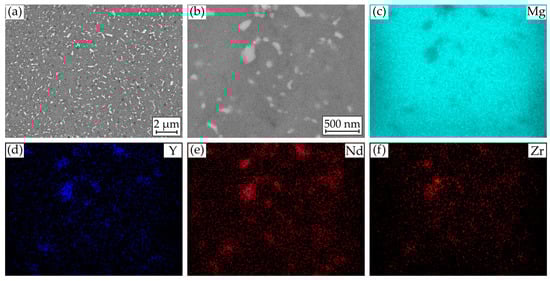
Figure 2.
Results of microstructural investigations on Mg WE43: (a) SEM image of cross section; (b) SEM image for EDS mapping of (c) Mg; (d) Y; (e) Nd; and (f) Zr.
3.2. Corrosion Investigations
3.2.1. Potentiodynamic Polarization
The results of the potentiodynamic polarization (PDP) measurement are shown in Figure 3, as well as the determined corrosion current densities icorr and estimated corrosion rates in Table 2. The current density |i| is plotted over the potential E versus an Ag/AgCl electrode. Qualitatively, the three measurements performed are comparable, whereas the open circuit potential (OCP) varies slightly by 80 mV. Since the following tests are carried out with a galvanostatic polarization, slight fluctuations in the potential are not crucial. Close to the OCP, the anodic branch seems to flatten out but then changes to a higher slope accompanied by increased noise. As the potential increases further, the active area flattens out. Due to the asymmetry of both branches, the corrosion current densities were estimated by Tafel extrapolation of the cathodic branch. The values are used to estimate the corrosion rate applying Faraday’s law. The mean corrosion current density and corrosion rate are icorr,mean = 16.48 ± 6.38 µA cm−2 and corr,e,mean = (6.55 ± 2.53) ∙ 101 mg cm−2 a−1 and exhibit the typical high standard deviations (SD) for this testing type. Taking the anodic branch into account, it allows an estimation of the application range for galvanostatic anodic polarization. For the following measurements, 0.5, 1, 2, and 20 mA cm−2 are used.
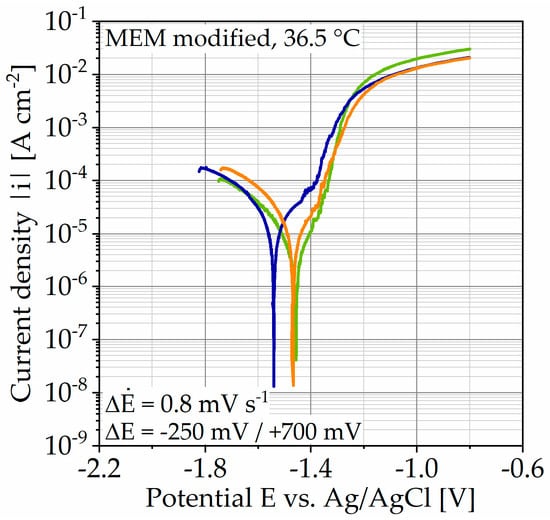
Figure 3.
Results of potentiodynamic polarization measurements on Mg WE43 in a modified minimum essential medium at 36.5 °C.
Table 2.
Summarized results of potentiodynamic polarization measurements on Mg WE43 in a modified minimum essential medium at 36.5 °C; * mean value ± SD.
3.2.2. Immersion Tests
Figure 4 shows the results of immersion tests without polarization plotted with the specific hydrogen volume over the immersion time t. It shows the individual data points, as well as two regression lines for each test. Since the data are measured manually, there are gaps in the data shown by dotted lines. The curves exhibit an almost linear behavior at the beginning of the immersion, after 5–11 h, it turns into another linear region of the lower slope.
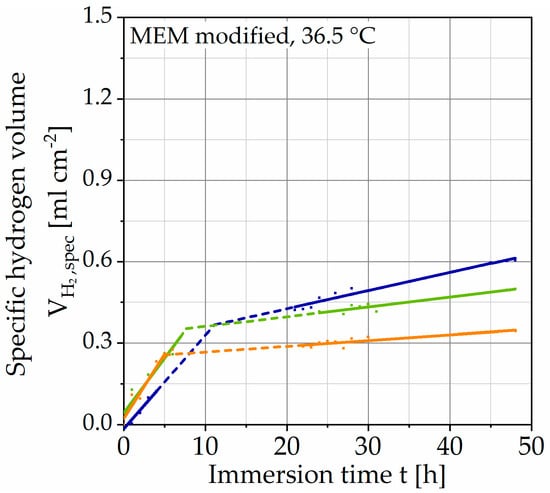
Figure 4.
Results of immersion tests without galvanostatic polarization on Mg WE43 in a modified minimum essential medium at 36.5 °C (immersion time of 48 h).
Since no data points are available for the transition, it must be understood mathematically as the intersection of both straight lines. It can be presumed that the hydrogen evolution, in reality, assumes a degressive course. For the method to be developed, the transition between both regions and the data gaps are of minor importance since a constant corrosion rate was set as a criterion. Nevertheless, the curves show a qualitatively similar behavior, exhibiting passivation. The corrosion rate of the respective tests is determined by the slope of the straight line (after the transition). This choice is justified by the larger proportion of the test duration. The mean value is corr,mean = 3.44 ∙ 101 mg cm−2 a−1 (Table 3) with a standard deviation of 1.60 ∙ 101 mg cm−2 a−1. The results of the immersion tests with galvanostatic polarization are shown in the same way in Figure 5.
Table 3.
Summarized results of immersion tests on Mg WE43 in a modified minimum essential medium at 36.5 °C.
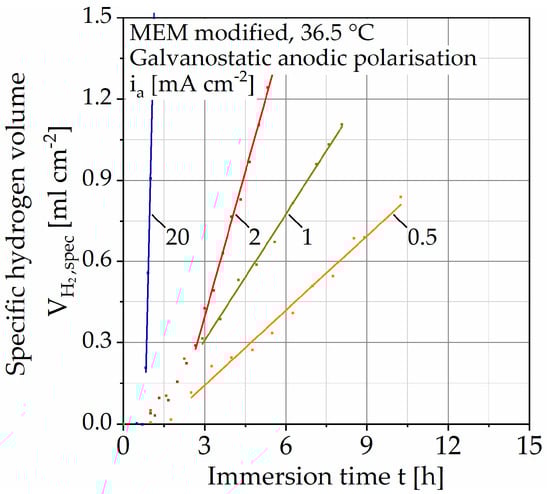
Figure 5.
Results of immersion tests with galvanostatic polarization on Mg WE43 in a modified minimum essential medium at 36.5 °C.
Due to the different immersion times, the scaling of the abscissa is changed, and the results are shown without the unaccelerated tests. Compared to the tests without polarization, no change in the slope of the regression line is observed. After reaching a constant OCP, the curves first assume a progressive course before changing into a linear one. The dissolution rate diss is calculated analogously to the unaccelerated immersion tests (Table 3). Through anodic polarization, the dissolution rate can be increased by up to three decades in several steps. The coefficient of determination (COD, Table 3) R2 increases with increasing polarization up to a maximum of R2 = 99.932% (for ia = 20 mA cm−2).
3.3. Microstructure—Corrosion Condition
Selected light and electron microscopic images, as well as EDS, and Fourier-transform infrared spectroscopy (FTIR) scans, are examined to evaluate both test strategies. Figure 6 shows an overview image of a sample without polarization (icorr) and one for each polarization step. For the experiments without polarization, a relatively uniform corrosion layer is obtained whereby the edge areas of the embedded sample are less affected.
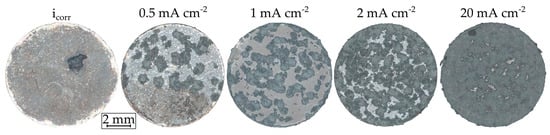
Figure 6.
Light microscopic images of Mg WE43 after immersion in a modified minimum essential medium at 36.5 °C with and without galvanostatic anodic polarization.
Exemplary for the unaccelerated tests, Figure 7a shows a SEM image of the corrosion layer, exhibiting a uniform, cracked corrosion morphology typical for magnesium. Brighter circular and stick-like inclusions can be seen in the layer, indicating enrichments by the alloying elements. Circular and spherical formations are also deposited on the layer, arranging themselves in circles of different diameters around the sphere.
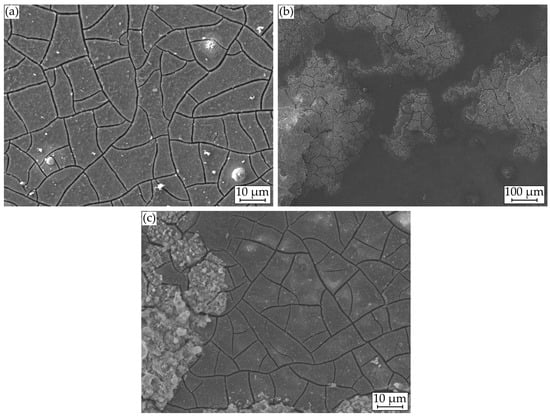
Figure 7.
Microstructural investigations on Mg WE43 after immersion in a modified minimum essential medium at 36.5 °C: (a) 48 h at icorr; (b) and (c) with galvanostatic polarization at ia = 1 mA cm−2.
For the analysis of these formations, Figure 8a displays a SEM image with plotted EDS points, Figure 9a shows the corresponding atomic percentages of the elements magnesium (Mg), oxygen (O), phosphorus (P), calcium (Ca), and carbon (C) and an analysis of the molecular compounds in Figure 9b. These figures illustrate that for the deposits, compared to the homogeneous corrosion layer, the percentage of O, Ca, and P increases, and the percentage of Mg decreases. Figure 8b shows a FTIR scan after unaccelerated corrosion and, as an example, after accelerated corrosion (ia = 0.5 mA cm−2) with the absorbance A plotted over the wavenumber . In general, the peaks occurring at 1500, 1401, 1030, 851, and 556 cm−1 are similar for both testing strategies, except a broader activity between 3630 and 2460 cm−1 occurring only for accelerated corrosion. The deposit’s morphology cannot be found in the experiments with polarization. Figure 8b shows a different structure without a circular or spherical formation. Rather it can be described as a volcanic structure. Besides the large uniform corrosion layer in Figure 6 (icorr), a corrosion pit is recognizable. This could also be observed for the other samples of the immersion tests without polarization. For the accelerated immersion tests, the number of locally intensified corrosion increases with increasing anodic current density. Figure 7b,c show exemplary SEM images of the corrosion morphology for a current density of ia = 1 mA cm−2. Between the corrosion pits (Figure 7b), areas with a homogeneous corrosion morphology are visible (Figure 7c), comparable to the unaccelerated tests (Figure 7a). Furthermore, the degree of degradation decreases with increasing distance to the center of the corrosion pits.
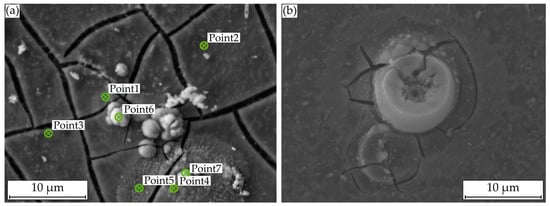
Figure 8.
Microstructural investigations on Mg WE43 after immersion in a modified minimum essential medium at 36.5 °C: (a) SEM image for EDS point analysis after 48 h at icorr; (b) with galvanostatic polarization at ia = 0.5 mA cm−2.
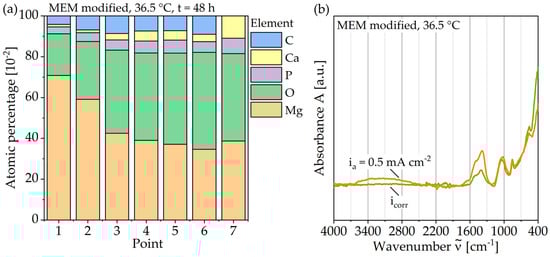
Figure 9.
Composition of the corrosion layer of Mg WE43 after immersion in a modified minimum essential medium at 36.5 °C: (a) Results of EDS point analysis after 48 h at icorr; (b) FTIR traces after 48 hours’ immersion at icorr and with galvanostatic polarization at ia = 0.5 mA cm−2.
4. Discussion
The initial microstructure exhibits a high number of evenly distributed precipitates of alloying elements. These occur as intermetallic compounds inhomogeneous in size and shape (Figure 2). Besides the α-Mg matrix, the microstructure consists of a second phase Mg12(RE), accumulating at the grain boundaries, a stick-like β-phase within the matrix (Mg14Nd2Y), as well as yttrium-rich (MgY, Mg14Y5, Mg24Y5), neodymium-rich (Mg41Nd5, Mg12Nd), and zirconium-rich precipitates [23,29,30]. In general, rare earth elements are considered to have a passivating effect on the corrosion behavior of magnesium (Mg) alloys [5]. However, inhomogeneous microstructures tend to cause corrosion pits due to micro-galvanic effects [31]. For alloy WE43, this is mainly favored by the accumulation of yttrium- and zirconium-rich precipitates [30]. To what extent both effects influence each other and which one dominates will be explained in the following discussion.
Potentiodynamic polarization (PDP) allows a first estimation of the corrosion rate corr,e and a qualitative corrosion behavior. The determined corrosion current densities icorr and the estimated corrosion rate (Table 2) are comparable to those found in the literature [23,29,32]. The qualitative course of the anodic branch demonstrates moderate polarizability (Figure 3). Furthermore, the flattening near the open circuit potential (OCP) indicates the formation of a passive layer, which disrupts as the potential increases accompanied by increased noise and passes into the pronounced active area with strong anodic dissolution. Consequently, the course of the anodic branch supports the thesis of a passivating corrosion behavior [32]. Based on the corrosion current density, as well as the anodic branch, four polarization steps are chosen for the immersion tests with galvanostatic polarization (0.5, 1, 2, and 20 mA cm−2).
To compare both test strategies, the results of unaccelerated corrosion are discussed first. The course of the hydrogen evolution exhibits a reduction of the slope and suggests a passivating corrosion behavior of the alloy Mg WE43 (Figure 4). In general, the course is comparable to other studies that investigated Mg WE43 [9,11]. In a study by Jung et al., a qualitatively and quantitatively similar course was observed on the same alloy composition [10]. Here, the course between the two regression lines becomes clearer. Considering the corrosion morphology, an accumulation of brighter areas in the corrosion layer is recognizable, indicating the inclusion of alloying elements with higher density (Figure 7). These inclusions are accompanied by a slight change in the Pilling–Bedworth ratio (PBR) and lead to higher oxide layer stability [33]. This value describes the ratio of the molar volumes of the metallic element and the respective oxide and is PBR = 0.81 for magnesium/magnesium oxide. According to the definition, values PBR < 1 lead to cracking of the oxide layer and do not provide sufficient protection of the subjacent substrate material [24]. The layer’s cracking can also be observed in the electron microscopic images. Nevertheless, the course of hydrogen evolution and the inclusion of alloying elements in the corrosion layer suggest a change in PBR, and consequently, an increase in the layer stability [33]. Besides the extensive homogeneous corrosion morphology, the samples of unaccelerated corrosion show locally intensified corrosion (Figure 6). According to current literature, these are due to increased accumulations of the alloying elements yttrium and zirconium [11,33]. By measuring the Volta potential, Coy et al. were able to detect significant differences between the zirconium-rich (about +170 mV) as well as the yttrium-rich precipitates (about +50 mV) and the α-Mg matrix, whereas the second phase and β-phase showed negligible differences (+25 and +15 mV, respectively) [30]. Based on these potential differences, it can be assumed that micro-galvanic corrosion is mainly driven by zirconium-rich precipitates.
In comparison, the hydrogen evolution of accelerated corrosion does not show any change in slope and thus no passivation tendency (Figure 5). This is associated with the increased number of corrosion pits with increasing polarization current density (Figure 6). It can be assumed that the increase in hydrogen evolution due to galvanostatic polarization is driven by the number of corrosion pits on the inhomogeneous microstructure. This theory is in accordance with the areal homogeneous corrosion morphology between the corrosion pits (Figure 7c). Furthermore, anodically controlled corrosion causes a higher coefficient of determination of the regression lines (Table 3). The composition of the corrosion layer, as well as the deposit’s morphology of the unaccelerated tests (Figure 9), is consistent with the current literature [11,34]. In addition to the characteristic components Mg and oxygen (O), the layer contains the elements phosphorus (P), calcium (Ca), and carbon (C), whereby the proportion of the latter increases for the circular deposits. To determine the chemical compounds, the peaks of the Fourier-transform infrared spectroscopy (FTIR) scans are considered (Figure 9). The activity at 1030 cm−1 can be attributed to phosphate ions (PO43−), whereas the double peak at 1500 and 1401 cm−1 and the peak at 851 cm−1 are due to stretching and bending of carbonate ions (CO3−) [9,22]. Consequently, the formation of a poorly crystalline carbonate-enriched apatite layer is assumed [22]. The classification of the activity at 556 cm−1 is more difficult. Based on the current literature, it indicates the presence of hydroxide groups (OH−) [35] or also of phosphate compounds [22,34]. Similarly, the broad activity between 3630 and 2460 cm−1, occurring only for the accelerated immersion tests, indicates the presence of OH− [34,35]. Furthermore, no circular or spherical deposits are observable for the accelerated tests, only volcano-like deposits can be found (Figure 8). The deposition of phosphate and carbonate compounds seems to be a time-dependent process [11,22]; hence, they cannot be found due to the shortened duration of the accelerated tests. Accordingly, the corrosion layer consists mainly of the characteristic magnesium oxides. It is questionable to what extent the time-dependent deposition of phosphates and carbonates affects the actual corrosion process and the mechanical stability and whether application-oriented acceleration by galvanostatic polarization is possible. To quantify this, Figure 10 shows the calculated dissolution rates diss (Table 3) plotted against the current density i in a double-logarithmic representation.
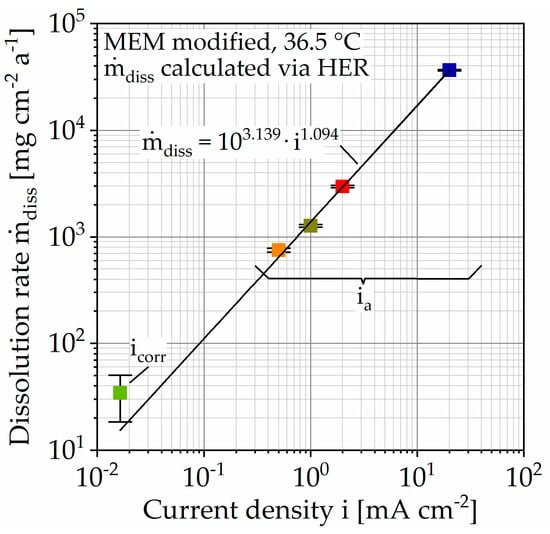
Figure 10.
Summarized results of immersion tests on Mg WE43 in a modified minimum essential medium at 36.5 °C. Dissolution rates calculated via hydrogen evolution rate (HER) of immersion tests.
In addition, the respective standard deviations are shown (Table 3), resulting for the unaccelerated corrosion rate from the three tests carried out and for the accelerated tests from the coefficient of determination (COD) R2 of the regression lines. The data points lie in good approximation (R2 = 99.886%) on a straight line, described by the following Equation (1)
For this alloy, the dissolution rate is controllable by using galvanostatic anodic polarization under the test conditions described. The extent to which the corrosion morphology, deviating with increasing polarization, influences the mechanical stability in the functional phase of the implant remains open for the moment. With the assumption of equal absolute mass loss (mcorr(t0) = mdiss(ta) with t0 >> ta), Equation (1) was converted. Thereby, Equation (2) gives a relationship between the required current density i, the unaccelerated corrosion rate corr, the immersion time to be simulated t0, and the shortened immersion time ta. It can be calculated which current density is necessary to reproduce the mass loss of a longer immersion time (of several weeks) by choosing a shortened immersion time (e.g., a few days). Thereby, the experimental effort to determine the initial corrosion rate is negligible compared to the immersion times to be simulated.
It should be noted that Equation (2) assumes constant unaccelerated corrosion rate corr and accelerated dissolution rates diss. For the immersion tests without polarization, this is assumed in good approximation (see Figure 4). Since the tests with polarization (see Figure 5) did not show any time-dependent hydrogen evolution rate (HER), this assumption is also correct. For long-term immersion tests (of several weeks) with time-dependent corrosion behavior, the variation of the current density is also conceivable. Calculation of the current density via a weighted mean corrosion rate is as well possible.
5. Conclusions
In this study, the magnesium alloy WE43 was used to investigate the feasibility of galvanostatic anodic polarization for accelerating the corrosion process. The corrosion behavior with and without polarization was investigated in instrumented immersion tests, and the resulting corrosion morphologies were examined. Based on the investigations, the following conclusions can be drawn:
Due to the inhomogeneous microstructure with zirconium- and yttrium-rich intermetallic precipitations, the alloy used tends to corrosion pits, increasing in occurrence by the application of galvanostatic anodic polarization. Inclusions and depositions of phosphates and carbonates form on the corrosion layer. This process appears to be time-dependent and is therefore difficult to reproduce in a short-time test. Regardless of these limitations, a mathematical relationship between polarization current density and dissolution rate as well as a simplified model for the simulation of extended immersion periods have been established. In good approximation, the model assumes constant corrosion rates. For longer immersion times, with varying corrosion rates, as experience shows, an adjustment of the model is necessary and possible.
In further investigations, the influence of the corrosion pits on the mechanical fatigue properties, and thus on the functional phase of the bioresorbable implants, will be investigated. For this purpose, three-dimensional test specimens, as well as longer immersion times, will be used. The precise corrosion mechanism responsible for the mentioned pitting will be determined so that the short-time testing method can be optimized and validated.
Author Contributions
Conceptualization, methodology, formal analysis, investigation, data curation, visualization, writing—original draft preparation, project administration, N.W.; Writing—review and editing, supervision, F.W. Both authors have read and agreed to the published version of the manuscript.
Funding
The authors thank the German Research Foundation (Deutsche Forschungsgemeinschaft, DFG) for its financial support within the research project “Development and validation of an in vitro short-time testing method for the prediction of the in vivo behavior of absorbable metallic implant materials” (SM 214/4-1, WA 1672/40-1) and the research partners from University Medical Center Hamburg-Eppendorf (UKE) for the excellent cooperation.
Institutional Review Board Statement
Not applicable.
Informed Consent Statement
Not applicable.
Data Availability Statement
Not applicable.
Acknowledgments
The authors thank the German Research Foundation (Deutsche Forschungsgemeinschaft, DFG) for the contribution of the “Focused ion beam scanning electron microscope” (INST 212/402-1 FUGG) and Macias Barrientos (WPT) for her support in the preparation of FIB-SEM images.
Conflicts of Interest
The authors declare no conflict of interest.
References
- Wolf, F.I.; Cittadini, A. Chemistry and biochemistry of magnesium. Mol. Asp. Med. 2003, 24, 3–9. [Google Scholar] [CrossRef]
- Jahnen-Dechent, W.; Ketteler, M. Magnesium basics. Clin. Kidney J. 2012, 5, i3–i14. [Google Scholar] [CrossRef] [PubMed]
- Saris, N.E.; Mervaala, E.; Karppanen, H.; Khawaja, J.A.; Lewenstam, A. Magnesium: An updated on physiological, clinical and analytical aspects. Clin. Chim. Acta 2000, 294, 1–26. [Google Scholar] [CrossRef]
- Farraro, K.F.; Kim, K.E.; Woo, S.L.; Flowers, J.R.; McCullough, M.B. Revolutionizing orthopaedic biomaterials: The potential of biodegradable and bioresorbable magnesium-based materials for functional tissue engineering. J. Biomech. 2014, 47, 1979–1986. [Google Scholar] [CrossRef]
- Chen, Y.; Xu, Z.; Smith, C.; Sankar, J. Recent advances on the development of magnesium alloys for biodegradable implants. Acta Biomater. 2014, 10, 4561–4573. [Google Scholar] [CrossRef] [PubMed]
- Staiger, M.P.; Pietak, A.M.; Huadmai, J.; Dias, G. Magnesium and its alloys as orthopedic biomaterials: A review. Biomaterials 2006, 27, 1728–1734. [Google Scholar] [CrossRef]
- Song, A.; Atrens, A. Understanding Magnesium corrosion—A framework for improved alloy performance. Adv. Eng. Mater. 2003, 5, 837–858. [Google Scholar] [CrossRef]
- Singh Raman, R.K.; Jafari, S.; Harandi, S.E. Corrosion fatigue fracture of magnesium alloys in bioimplant applications: A review. Eng. Fract. Mech. 2015, 137, 97–108. [Google Scholar] [CrossRef]
- Ascencio, M.; Pekguleryuz, M.; Omanovic, S. Corrosion behavior of polypyrrole-coated WE43 Mg alloy in a modified body fluid solution. Corr. Sci. 2018, 133, 261–275. [Google Scholar] [CrossRef]
- Jung, O.; Porchetta, D.; Schroeder, M.-L.; Klein, M.; Wegner, N.; Walther, F.; Feyerabend, F.; Barbeck, M.; Kopp, A. In vivo simulation of magnesium degradability using a new fluid dynamic bench testing approach. Int. J. Mol. Sci. 2019, 20, 4859. [Google Scholar] [CrossRef] [PubMed]
- Öcal, E.B.; Esen, Z.; Aydinol, K.; Dericioglu, A.F. Comparison of the short and long-term degradation behaviors of as-cast pure Mg, AZ91 and WE43 alloys. Mater. Chem. Phys. 2020, 241, 122350. [Google Scholar] [CrossRef]
- Pardo, A.; Celiu Jr., S.; Mercino, R.; Arrabal, R.; Matykina, E. Electrochemical estimation of the corrosion rate of Magnesium/Aluminium alloys. Int. J. Corros. 2010, 2010, 1–8. [Google Scholar] [CrossRef]
- Curioni, M. The behaviour of magnesium during free corrosion and potentiodynamic polarization investigated by real-time hydrogen measurement and optical imaging. Electrochim. Acta 2014, 120, 284–292. [Google Scholar] [CrossRef]
- Curioni, M.; Scenini, F.; Monetta, T.; Bellucci, F. Correlation between electrochemical impedance measurements and corrosion rate of magnesium investigated by real-time hydrogen measurement and optical imaging. Electrochim. Acta 2015, 166, 372–384. [Google Scholar] [CrossRef]
- Shadanbaz, S.; Walker, J.; Staiger, M.P.; Dias, G.J.; Pietak, A. Growth of calcium phosphates on magnesium substrates for corrosion control in biomedical applications via immersion techniques. J. Biomed. Mater. Res. B Appl. Biomater. 2013, 101, 162–172. [Google Scholar] [CrossRef]
- Yang, G.F.; Kim, Y.C.; Han, H.S.; Lee, G.C.; Seok, H.K.; Lee, J.C. In vitro dynamic degradation behavior of new magnesium alloy for orthopedic applications. J. Biomed. Mater. Res. B Appl. Biomater. 2015, 103, 807–815. [Google Scholar] [CrossRef]
- Nidadavolu, E.P.S.; Feyerabend, F.; Ebel, T.; Willumeit-Romer, R.; Dahms, M. On the determination of magnesium degradation rates under physiological conditions. Materials 2016, 9, 627. [Google Scholar] [CrossRef]
- Frankel, G.S.; Fajardo, S.; Lynch, B.M. Introductory lecture on corrosion chemistry: A focus on anodic hydrogen evolution on Al and Mg. Faraday Discuss. 2015, 180, 11–33. [Google Scholar] [CrossRef]
- Höche, D.; Blawert, C.; Lamaka, S.V.; Scharnagl, N.; Mendis, C.; Zheludkevich, M.L. The effect of iron re-deposition on the corrosion of impurity-containing magnesium. Phys. Chem. Chem. Phys. 2016, 18, 1279–1291. [Google Scholar] [CrossRef]
- Birbilis, N.; King, A.D.; Thomas, S.; Frankel, G.S.; Scully, J.R. Evidence for enhanced catalytic activity of magnesium arising from anodic dissolution. Electrochim. Acta 2014, 132, 277–283. [Google Scholar] [CrossRef]
- Zheng, F.; Rassat, S.D.; Helderandt, D.J.; Caldwell, D.D.; Aardahl, C.L.; Autrey, T.; Linehan, J.C.; Rappe, K.G. Automated gas burette system for evolved hydrogen measurements. Rev. Sci. Instrum. 2008, 79, 084103. [Google Scholar] [CrossRef]
- Ascencio, M.; Pekguleryuz, M.; Omanovic, S. An investigations of the corrosion mechanisms of WE43 Mg alloy in a modified simulated body fluid solution: The influence of immersion time. Corros. Sci. 2014, 87, 489–503. [Google Scholar] [CrossRef]
- Esmaily, M.; Zeng, Z.; Mortazavi, A.N.; Gullino, A.; Choudhary, S.; Derra, T.; Benn, F.; D’Elia, F.; Müther, M.; Thomas, S.; et al. A detailed microstructural and corrosion analysis of magnesium alloy WE43 manufactured by selective laser melting. Addit. Manuf. 2020, 35, 101312. [Google Scholar] [CrossRef]
- Xu, C.; Gao, W. Pilling-Bedworth ratio for oxidation of alloys. Mater. Res. Innovat. 2000, 3, 231–235. [Google Scholar] [CrossRef]
- Hartjen, P.; Wegner, N.; Ahmadi, P.; Matthies, L.; Nada, O.; Fuest, S.; Yan, M.; Knipfer, C.; Gosau, M.; Walther, F.; et al. Toward tailoring the degradation rate of magnesium-based biomaterials for various medical applications: Assessing corrosion, cytocompatibility and immunological effects. Int. J. Mol. Sci. 2021, 22, 971. [Google Scholar] [CrossRef]
- Jung, O.; Smeets, R.; Hartjen, P.; Schnettler, R.; Feyerabend, F.; Klein, M.; Wegner, N.; Walther, F.; Stangier, D.; Henningsen, A.; et al. Improved in vitro test procedure for full assessment of the cytocompatibility of degradable magnesium based on ISO 10993-5/-12. Int. J. Mol. Sci. 2019, 20, 255. [Google Scholar] [CrossRef] [PubMed]
- Walker, J.; Shadanbaz, S.; Kirkland, N.T.; Stace, E.; Woodfield, T.; Staiger, M.P.; Dias, G.J. Magnesium alloys: Predicting in vivo corrosion with in vitro immersion testing. J. Biomed. Mater. Res. B Appl. Biomater. 2012, 100, 1134–1141. [Google Scholar] [CrossRef] [PubMed]
- Kirkland, N.T.; Birbilis, N.; Staiger, M.P. Assessing the corrosion of biodegradable magnesium implants: A critical review of current methodologies and their limitations. Acta Biomater. 2012, 8, 925–936. [Google Scholar] [CrossRef] [PubMed]
- Arrabal, R.; Matykina, E.; Viejo, F.; Skeldon, P.; Thompson, G.E. Corrosion resistance of WE43 and AZ91D magnesium alloys with phosphate PEO coating. Corros. Sci. 2008, 50, 1744–1752. [Google Scholar] [CrossRef]
- Coy, A.E.; Viejo, F.; Skeldon, P.; Thompson, G.E. Susceptibility of rare-earth-magnesium alloys to micro-galvanic corrosion. Corros. Sci. 2010, 52, 3896–3906. [Google Scholar] [CrossRef]
- Bahmani, A.; Arthanari, S.; Shin, K.S. Formulation of corrosion rate of magnesium alloys using microstructural parameters. J. Magnes. Alloys 2020, 8, 134–149. [Google Scholar] [CrossRef]
- Mraied, H.; Wang, W.; Cai, W. Influence of chemical heterogeneity and microstructure on the corrosion resistance of biodegradable WE43 magnesium alloys. J. Mater. Chem. B 2019, 7, 6399–6411. [Google Scholar] [CrossRef] [PubMed]
- Leleu, S.; Rives, B.; Bour, J.; Causse, N.; Pébére, N. On the stability of the oxides film formed on a magnesium alloy containing rare-earth elements. Electrochim. Acta 2018, 290, 586–594. [Google Scholar] [CrossRef]
- Li, L.; Cui, L.-Y.; Zeng, R.; Li, S. Corrosion resistance of glucose-induced hydrothermal calcium phosphate coating on pure magnesium. Appl. Surf. Sci. 2019, 456, 1066–1077. [Google Scholar] [CrossRef]
- Yan, W.; Lian, Y.-J.; Zhang, Z.-Y.; Zeng, M.-Q.; Zhang, Z.-Q.; Yin, Z.-Z.; Cui, L.-Y.; Zeng, R.-C. In vitro degradation of pure magnesium—The synergetic influences of glucose and albumin. Bioact. Mater. 2020, 5, 318–333. [Google Scholar] [CrossRef] [PubMed]
Publisher’s Note: MDPI stays neutral with regard to jurisdictional claims in published maps and institutional affiliations. |
© 2021 by the authors. Licensee MDPI, Basel, Switzerland. This article is an open access article distributed under the terms and conditions of the Creative Commons Attribution (CC BY) license (http://creativecommons.org/licenses/by/4.0/).