Article

Online Distributed Measurement of Dark I-V Curves in Photovoltaic Plants

by
José Ignacio Morales-Aragonés
1,
María del Carmen Alonso-García
2,
Sara Gallardo-Saavedra
1,
Víctor Alonso-Gómez
1,
José Lorenzo Balenzategui
2,
Alberto Redondo-Plaza
1 and
Luis Hernández-Callejo
1,*
1
Campus Universitario Duques de Soria, Universidad de Valladolid, 42004 Soria, Spain
2
Centro de Investigaciones Energéticas, Medioambientales y Tecnológicas (CIEMAT), Photovoltaic Solar Energy Unit, Energy Department, 28040 Madrid, Spain
*
Author to whom correspondence should be addressed.
Appl. Sci. 2021, 11(4), 1924; https://doi.org/10.3390/app11041924
Submission received: 20 January 2021 / Revised: 14 February 2021 / Accepted: 19 February 2021 / Published: 22 February 2021

Abstract

:
The inspection techniques for defects in photovoltaic modules are diverse. Among them, the inspection with measurements using current–voltage (I-V) curves is one of the most outstanding. I-V curves, which can be carried under illumination or in dark conditions, are widely used to detect certain defects in photovoltaic modules. In a traditional way, these measurements are carried out by disconnecting the photovoltaic module from the string inside the photovoltaic plant. In this work, the researchers propose a methodology to perform online dark I-V curves of modules in photovoltaic plants without the need of disconnecting them from the string. For this, a combination of electronic boards in the photovoltaic modules and a bidirectional inverter are employed. The results are highly promising, and this methodology could be widely used in upcoming photovoltaic plants.

1. Introduction

Solar photovoltaic (PV) energy is a reliable renewable energy source that has increased its cumulative installed capacity up to 633.7 GW by the end of 2019 [1,2]. This means an increase of 23% from the 516.8 GW achieved in 2018 and represents a progression by almost 400 times the installed capacity at the beginning of the century. In terms of annual installed capacity, the 116.9 GW installed in 2019 reflects a growth of 13% with respect to 2018, and it positions solar photovoltaic as the champion power generation source installed in 2019, with 48% of annual share [1]. The COVID-19 pandemic and its associated crisis slowed down the progression of PV solar energy in 2020. A recent study of the International Energy Agency analyzes different consequences of the pandemic and accordingly proposes several scenarios of possible energy futures. In all scenarios analyzed, renewable energies will grow rapidly, with solar in the lead of this new era of electricity generation [3].
Therefore, solar PV energy is a key factor in the diversification of energy sources that promotes a gradual decarbonation and encourages the large-scale implementation of energy models free of greenhouse gas emissions. The reason for the spectacular growth and prospect of this energy source lays in the constant development of the technology and its high reliability. This has made possible a drastic reduction of costs, which has favored its large-scale implementation. Moreover, PV applications have a variety of configurations and power levels, ranging from a few watts for consumer products or small home applications to large utility-scale power plants. These power plants have represented the largest share in the solar market in preceding years, with great expectations to keep this trend in next years [3]. In these high-power applications, the long-term reliability of the plant results in the recovery of the investment and the profit of the plant. In order to ensure this long-term reliability and a return on investment, the components of a PV plant, and the plant itself, are subjected to careful control procedures before, during, and after their construction. There exists a large collection of quality control mechanisms and international standards to asseverate the guaranty of the PV systems, being one of most widely used the ones issued by Technical Committee 82 of the International Electrotechnical Commission [4].
Ensuring energy production is a key factor in warranting plant profitability, and this has forced the design of increasingly intelligent and advanced operation and maintenance (O&M) strategies [5,6,7,8]. The maintenance operation included in most O&M PV power plant contracts can be divided into Preventive, Corrective, and Predictive. While corrective maintenance is performed after some failure has been detected, preventive and predictive seek to anticipate the fault. Both need specialized personnel to perform the tasks and to analyze the data, and the second one requires “intelligent” equipment for the monitoring that can supply information about the state of the plant, allowing the evaluation of subtle trends that could be unnoticed in regular inspections.
Among the advanced operation and maintenance techniques that provide information about the PV modules, infrared thermography (IRT), electroluminescence (EL), and string current–voltage (I-V) curve measurement can be highlighted.
IRT has been widely used to detect failures in PV modules and plants [9,10,11,12,13,14,15]. It has the advantage of being non-intrusive, and it can be done while the plant is in operation. EL, on the other hand, is an excellent technique for the detection of failures such as cracks, interconnection defects, broken cell fingers, or other cell and string issues [16,17]. It can be used at the laboratory level in PV modules [18,19] or in PV plants where bigger areas can be analyzed with ground-mounted or aerial equipment [20]. To perform EL analysis, it is necessary to forward bias the module or array. This implies disconnecting the module or array and the use of an electronic load or an external power supply to bias the module or string.
Finally, I-V curve measurement gives more comprehensive information about the state of a PV module or string. The main characteristic parameters of the device are obtained from the I-V curve. Some of them are inferred directly from the measurement and give information about the performance: short circuit current (Isc), open circuit voltage (Voc), and maximum power point (Pmax) with its associate current (Impp) and voltage (Vmpp). Others give information about the physical properties of the device under study, and they are obtained from the I-V curve by applying models. The most widely used are the double or single diode models [21,22,23], which supply the parameters: photogenerated current IL, series resistance Rs, shunt resistance Rsh, diode saturation current I0, and ideality factor m. By analyzing the magnitude and evolution of these parameters, the degradation of a PV device can be quantified. There are several techniques and devices used to measure the I-V curve of PV devices in the field. An excellent review can be found elsewhere [24]. In addition, some authors developed a mobile laboratory to perform I-V curve measurements of PV modules in the plant at standard test conditions according to IEC standard [25,26]. This has the advantage of ensuring uniform environmental conditions during the tests and it allows a precise quality control of selected PV modules throughout their shelf life.
The measurement of the I-V curve of PV modules or strings in a PV plant under illumination implies in most of the cases the disconnection of the module/array in order to sweep the operating point from Isc to Voc. This has the drawback, on the one hand, of requiring the disconnection of the plant and thus production, and on the other, the high voltages and/or currents when strings are measured, which forces taking rigorous personal security measures. In recent times, electronic boards to be installed in photovoltaic modules and inverters have been developed, from which it is possible to make I-V traces without disconnecting the photovoltaic modules. For example, in [27], the authors present two I-V tracing strategies at the photovoltaic module level without the need to disconnect them. One strategy uses electronic boards at the photovoltaic module level, while the second strategy combines electronic boards at the photovoltaic module level together with an electronic string card (common for all photovoltaic modules). In both cases, the measures are of high quality, and the strategies have low costs.
The measurement at dark conditions has the clear advantage that it is performed when the plant is not in operation. While the normal operating mode of a plant or PV modules is under illumination, the dark curve gives very important information about the characteristics of the device, and it allows analyzing various failure modes. It has been used for many years to determine solar cell parameters [21,28,29] and as a diagnosis to detect certain defects such as mismatch, handling, soldering, or lamination problems in module manufacturing [30]. More recent works propose the use of a dark I-V curve alone or in combination with a light I-V curve for the identification of several failure modes. In [31], complementary analysis of dark and light current voltage characteristic is used to characterize failure modes such as degradation of the electrical circuit of the PV module, mechanical damage to the solar cells, and potential-induced degradation (PID). In [32], the analysis of a dark I-V curve to in situ monitor the degradation of PV modules undergoing thermal cycling and mechanical loading stress testing is proposed. The same group proposes an extension of their method to analyze in situ the temperature dependence of power loss estimations in PID experiments [33].
In this paper, we go a step further and propose the use of the developed technology to measure online distributed dark I-V curves of the PV modules in the plant. The online measurement refers to the acquisition without the need to disconnect the PV module from the string to which it is connected. It is a distributed strategy, since all the electronics required for the I-V measurement are located in the PV modules. Therefore, the proposed strategy implies the automatic acquisition of dark I-V curves by the developed electronic device, which is included in the PV modules, without the need for the onsite disconnection of any component in the plant. This is especially interesting for PV plant operators, who can obtain the dark I-V curves of the modules, which give relevant information of the individual modules, as has been outlined (characteristics of the device, to analyze various failure modes, to determine solar cell parameters, for monitoring the degradation of modules,, to diagnosis or characterize certain defects and failure modes) with the advantage of online measures, significantly reducing the onsite workforce, acquisition time, and costs. The paper has been structured as follows: it starts with an introduction to the research in Section 1, followed by the materials and method presented in Section 2, the results and their discussion in Section 3, and the main conclusions in Section 4.

2. Materials and Method

This section presents the materials and method used in the research performed. It has been divided in five subsections. The first one revises the dark I-V curves, highlighting their importance in PV inspections; the second and the third subsections explain the bidirectional inverter and the electronic board used in the research, respectively. Both have been developed by this research group. In the fourth subsection, the main characteristics of the PV modules tested are detailed. Finally, subsection five describes the methodology followed in the research proposed in this article.

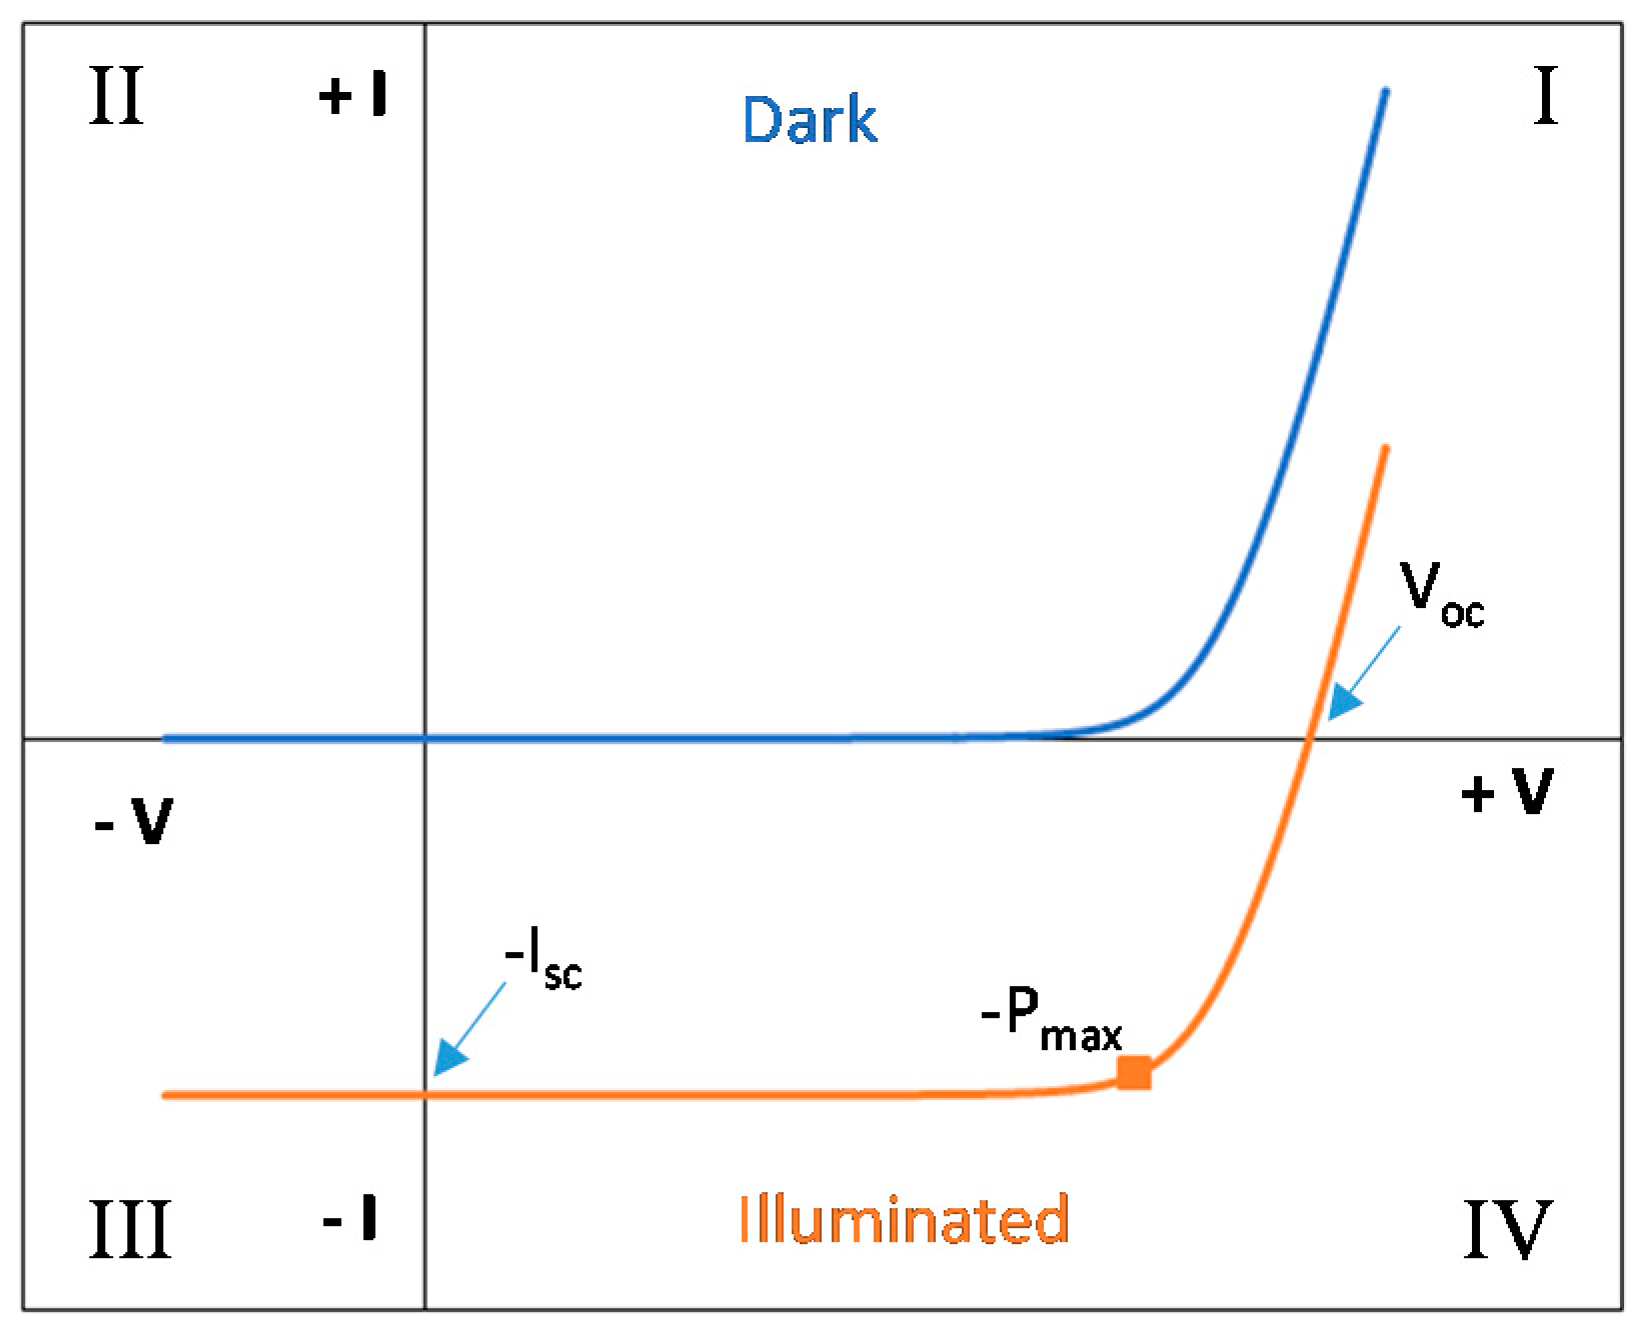
2.1. Dark I-V Curves

Solar PV cells convert sunlight into electricity. All potential combinations of current and voltage pairs of points of the PV device under certain conditions of irradiance and temperature are represented in an I-V curve. There are different models that describe the electrical behavior of the I-V curve of a PV device. The one exponential model is widely used and it includes the series and shunt resistances, as detailed in the following Equation (1) [10,21]. Figure 1 shows the equivalent circuit of the one-diode model of a PV cell under illumination conditions (a) and dark conditions (b).
I = I L I 0 exp V + I R s n v t 1 V + I R s R s h
In Equation (1), IL is the photogenerated current, I0 is the saturation current of the diode, n is the diode ideality factor, Rs is the series resistance, Rsh is the shunt resistance, and vt is the thermal voltage (K T/e) with k as the Boltzmann constant, e as the electron charge, and T as the temperature in Kelvin. In the dark conditions model circuit, as the photogenerated current IL due to illumination is zero, the current generator is missing. In Figure 2, there is a common I-V curve under illumination represented in the fourth quadrant, which overlaps the dark diode current with the photogenerated current due to illumination and the dark I-V curve in the first quadrant. The main characteristic points of the curve in illumination are marked in this figure. The criteria that have been considered in this research are that the current is negative when the PV device is generating power (fourth quadrant).
As it has been remarked in the introduction, the measurement at dark conditions has the clear advantage that it is performed when the plant is not in operation, giving very important information about the characteristics of the device. It allows analyzing various failure modes, determining solar cell parameters, and monitoring the degradation of modules and it is used as a diagnosis to detect or characterize certain defects and failure modes. The application of the model of Equation (1) with the calculation of the parameters for the dark I-V curve can give information about the changes of a PV module performance, indicating that some failure or degradation has occurred. To illustrate how the variation of the parameters affect the dark I-V curve, Figure 3a,b show the changes in the dark I-V curve of a standard PV cell in which each one of the model parameters of Equation (1) has been changed one at a time. Parameters are expressed in relation to the area for being more comparable, so current is presented in mA/cm2, and J0 represents the diode saturation current density. The reference curve corresponds to a standard cell with the following parameters: J0 = 1.5 ∗ 10−9 A/cm2, n = 1.5, Rs = 0.6 Ω cm2, and Rsh = 60.000 Ω cm2. From these initial values, parameters have been changed to simulate worse device behavior by increasing Rs, J0, and n, and decreasing Rsh. The graph has been split into two parts to better appreciate the modifications that the change of each parameter introduces in the I-V curve. For the case of variations in “n” and Rsh, the graph is presented in logarithm scale to better distinguish its influence and the voltage area in which these changes produce their effect.
The variations of the curves presented in Figure 3 can be indicative of certain degradation modes. For example, the degradation of the electrical circuit of a PV module usually contributes to the increasing of series resistance [31], which is appreciated in the high-voltage area of the I-V curve. Mechanical damage would contribute also to the increase of series resistance, but it will also increase recombination and shunt losses [31], as appreciated by the changes in J0 and Rsh. Shunting losses are visible in the low-voltage region. These types of analysis through the dark I-V curve have been shown to be especially interesting to detect degradation provoked by PID [31,34,35].
An additional way to evaluate the performance of a PV device through the dark I-V curve is by obtaining the parameters of the dark curve equivalent to the illuminated one by transposing the dark I-V curve to the short circuit current of the illuminated one and calculating the fill factor dark (FFD) [31,34,35]. A decrease in this FFD implies degradation in the performance of the PV device.
In a common arrangement, it is necessary to forward bias the module with an external power supply in order to perform dark I-V curves. As a novel approach, a power inverter with bidirectional power flow capability has been used in this work for biasing the modules instead of the external power supply by applying the procedure explained in the following subsections [36].

2.2. Power Inverter with Bidirectional Power Flow Capability

Nowadays, common solar inverters used in PV plants only have the capability to invert the electricity produced in the solar panels to lately be injected to the grid. However, the use of a power inverter with bidirectional power flow capability is proposed in recent research [36] as a novel system that extremely facilitates the operation and maintenance of PV plants, allowing the on-site outdoor EL and IRT inspections [10]. In this scenario, this device is suitable for the acquisition of dark I-V curves, as permits the current injection to the modules (I quadrant).
The 3 kW bidirectional inverter pilot presented in [36] has been used in this research. In the DC input side, the PV string voltage can be set between 330 and 550 V. The bidirectional inverter allows fixing ten different levels of current injection to the string of modules, from 10% of Isc to 100% of Isc in steps of 10% of Isc. For the dark I-V curves tracing presented in this paper, the bidirectional inverter has been set to 100% of Isc, and the electronic board is in charge of tracing the curve, as it is explained in the following section. Although the leakage current is dependent on the voltage, the temperature, and the humidity conditions, at low temperatures (< 25°C), the influence of the voltage in the leakage current is minor [37]. Therefore, achieving slightly higher values of voltage in defective modules during outdoor dark I-V curve measurement, in which the temperature is low and the acquisition time is rapid (40 ms) should not affect the leakage current. As well, the authors in [38] proved how injecting current for long periods does not degrade the panel. Hence, the degradation of the panels should be insignificant during a 40 ms measurement. That is why the maximum limit of 100% of Isc has been selected, obtaining complete dark I-V curves. However, the maximum current limit can be set in the bidirectional inverter if desired in any specific case.
This bidirectional inverter allows EL to be done at night in individual modules or in the string with this system, without the need for an external source. The current set point, sent from the computer to the inverter, is controlled by means of the PV side voltage. Figure 4 shows the power inverter with bidirectional power flow capability used in on-site measurements.

2.3. Electronic Board Integrated in Photovoltaic Modules

For the local measurements over each PV module, an electronic board has been designed to be installed within the module connecting box. In order to obtain a full I-V curve of the PV module under dark conditions, it is necessary to sweep the forward current injected from the bidirectional inverter explained above between zero and its maximum value (100% of Isc). This way, a set of module current values and their corresponding voltage values can be measured and stored as points of the I-V curve.
It is possible to perform this sweep controlling the current supplied by the bidirectional inverter, but if a good resolution in the current values is needed, it will require a precise regulation of string voltages of some hundreds of volts, increasing the complexity of the bidirectional inverter, and in addition, a communications system between the inverter and the module electronics will be required to synchronize the sweep with the measurements. For these reasons, we have opted for a local sweeping electronics integrated in the PV module.
Figure 5 shows the schematic of the PV module electronic board. An 8-bit microcontroller is the heart of the circuit as it stores and executes the firmware for generating all the necessary signals that perform the I-V tracing process. For the measurement of current and voltage values, two of the microcontroller pins (labelled as V and I in Figure 5) can be configured as analog inputs for an internal analog-to-digital converter (ADC) of 10-bits. The module voltage analog input (V) is fed from the positive module terminal through a voltage divider. The resistive values of the voltage divider are much greater than the PV module Rsh; therefore, they do not alter the module parallel resistance. This divider reduces the module voltage for a full-scale matching with the positive reference of the ADC (5 V). Consequently, the resolution of the 10-bits ADC is 5 mV (5 V/1024), which corresponds with the full scale of the I-V curve measurement, which results in a resolution of 50 mV (50V/1024) in voltage measurements.
The module current is measured with an AMR (Anisotropic Magnetoresistance) sensor (Is), which outputs a voltage proportional to the current with a 5 volts swing for a current value from zero to 5 Amps, so it can be connected directly to the 10 bit ADC input (I). This setup allows for a current resolution of 5 mA (5 Amps/1024). The MOSFET transistor M1 will be responsible for the local current sweeping process. The M1 gate is driven directly by the microcontroller pin (Cm), which is configured as an analog output from an internal digital-to-analog converter (DAC). For a smooth and as linear as possible sweep, a closed control loop has been implemented in firmware, where the current and voltage values sampled by the ADC are used as a feedback for adjusting the gate voltage of M1. This strategy allows for the tuning of the control loop by simply changing some parameters in the firmware (as delay or gain).
The power supply for the entire system is provided by the voltage module established when the forward current from the bidirectional inverter flows along the string, via a DC/DC converter that outputs the 5 volts needed by the electronics. Since during the I-V tracing, the current sweep forces the module to different operating points, including the zero voltage, a power supply holding circuit has been implemented in order to keep the supply voltage at the input of the DC/DC converter high enough during the time that the I-V tracing is performed. This circuit is composed by the capacitor (C) and the diode (D) in such a way that capacitor (C) is charged up to the module voltage when the circuit is idle. When during an I-V tracing the module voltage drops, the diode (D) is reverse biased, avoiding the capacitor discharge over the module, and this capacitor can then supply the energy to the circuit until the I-V tracing is finished.
For the experiments, the communications with the microcontroller for tracing demand or data download have been implemented using the serial port integrated in it, which is connected to an external computer that send the commands for starting the measurements and receives the numerical data of the I-V curves.
The process applied for I-V curve tracing is based on these consecutive steps:
  • First, in dark conditions, the Isc current is driven from the bidirectional inverter towards the modules string in a forward biased way (opposite of the current flow in production while in daylight). This establishes a voltage in the module terminals, and the circuit is powered up.
  • When the I-V tracing is demanded from the external computer via a serial port, the MOSFET M1 is closed, subtracting all the current from the module, thus driving the module to zero voltage.
  • The current sweep and the current and voltage measurements are started simultaneously. The MOSFET is pushed from its initial closed state to an open state; then, the module voltage returns to its maximum, and the I-V tracing is finished. The maximum current value is the one fixed initially in the bidirectional inverter (Isc).
  • The microcontroller sends the data corresponding to the I-V curve to the external computer, and the circuit returns to the idle mode.
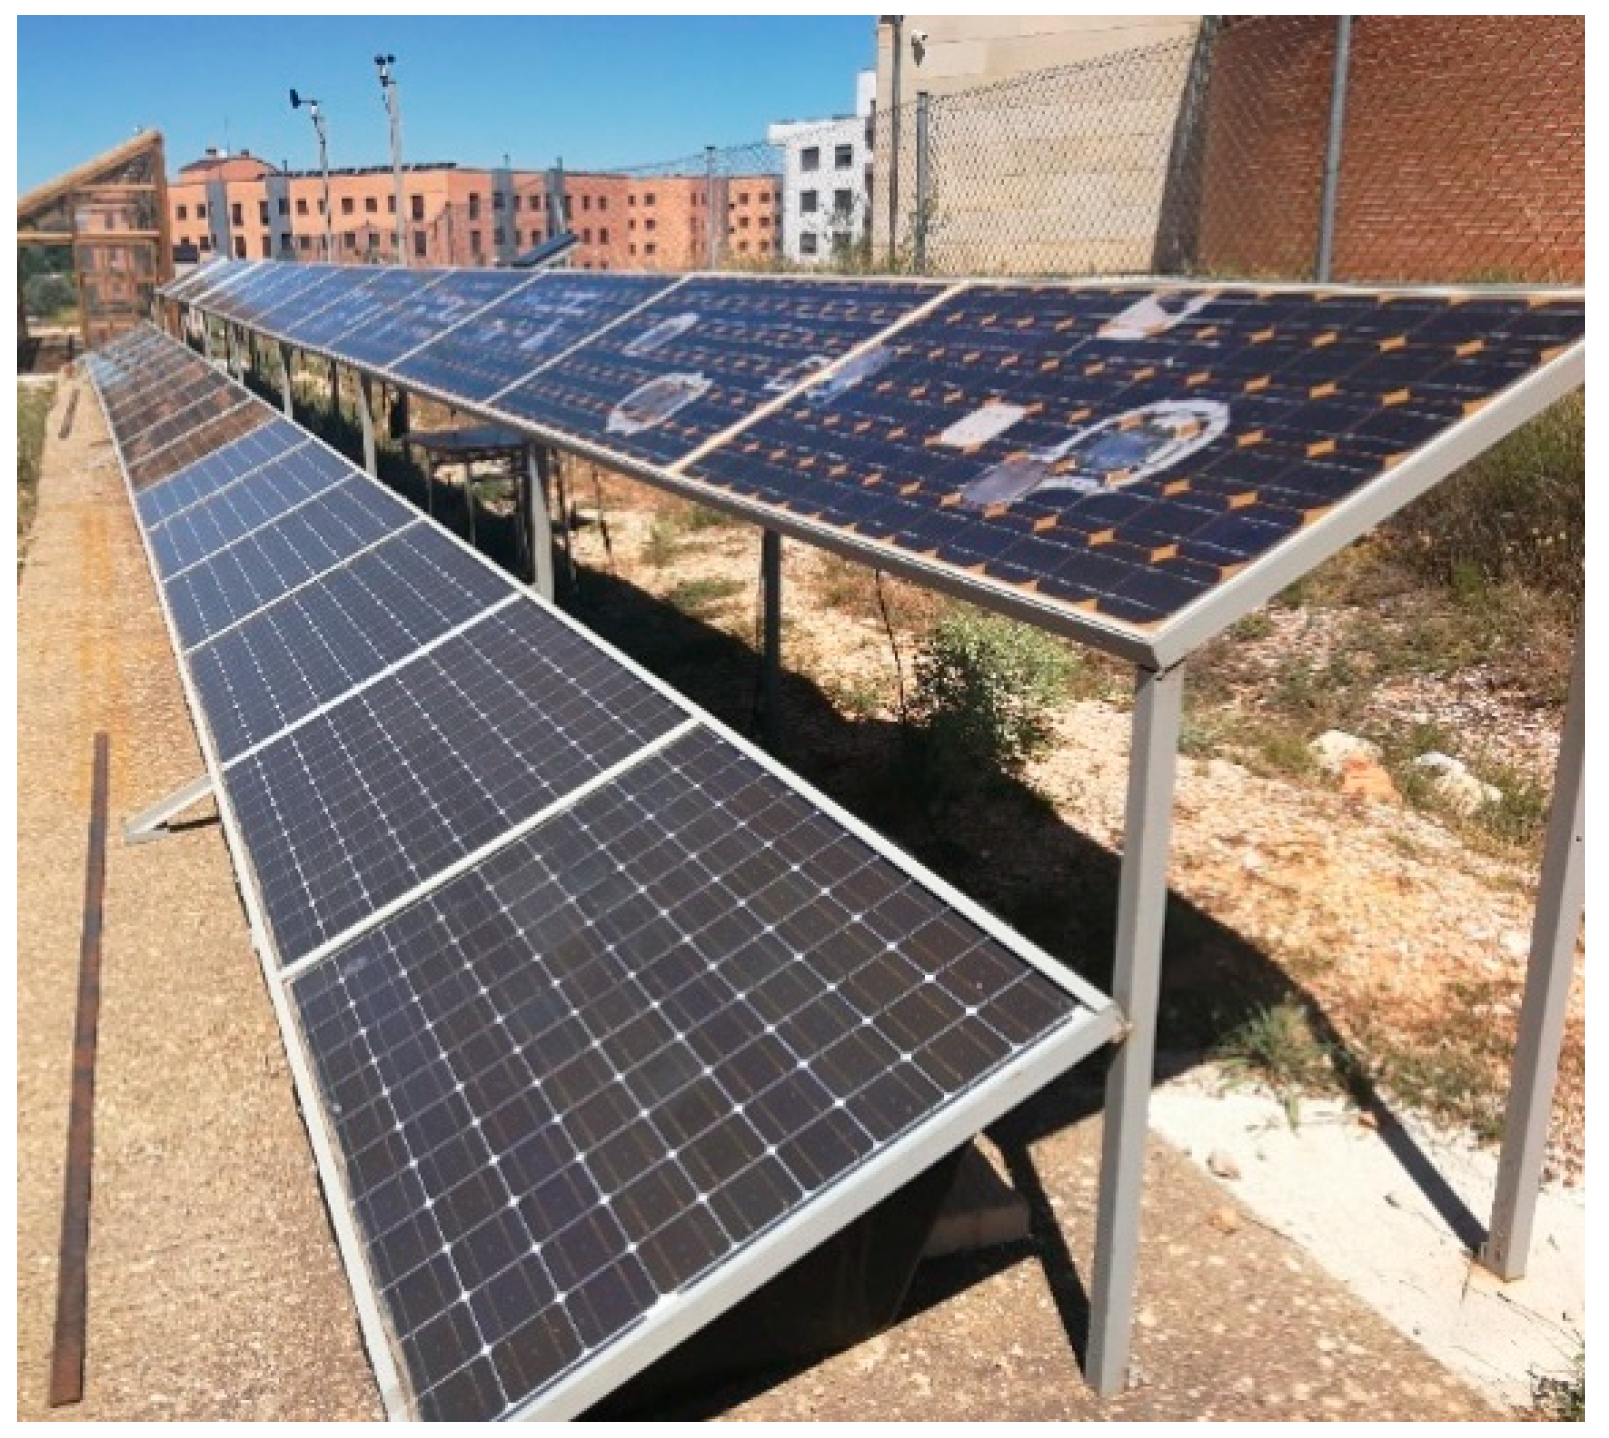
2.4. Tested Modules

On-site outdoor tests have been performed in the PV installation in the School of Forestry, Agronomic, and Bioenergy Industry Engineering (EIFAB) of the University of Valladolid, in Soria, Spain. It is shown in the upper row of PV modules in Figure 6. It is composed by eleven mono-crystalline PV modules with different kinds of defects. Their main characteristics are presented in Table 1. The area of each cell is 156.25 cm2.

2.5. Method

As it has been introduced, the objective of the research presented in this paper is the use of the developed electronic board integrated in photovoltaic modules presented in Section 2.3 to measure the online distributed dark I-V curves of the PV modules in the plant. To obtain and validate the dark I-V curves, the followed methodology has been used: firstly, the dark I-V curves of all the modules presented are measured with the developed device, and secondly, the main parameters of the curves are extracted to draw some conclusions on the state of the analyzed PV modules.
I-V curve measurements are carried out after sunset. It is not necessary to cover the panels, since the influence of the moon is completely negligible, 3.916 ∗ 10−3 W/m2 (perigee, perihelion) for a full moon [37]. For the I-V curves acquisition, 100% of the Isc setpoint is selected in a computer connected to the bidirectional inverter, which gives the order. The eleven PV modules under analysis are all connected in series to the bidirectional inverter (which is unique for the entire string). To make the dark I-V curve measurements, each module has one electronic board integrated (the developed card presented). In order, one of the cards makes a short circuit in the module, so that the rest of the modules of the string remain connected in series to the inverter while the card makes the dark I-V curve of that first module. When the acquisition of the curve ends, the card re-integrates the first module measured in the string. Successively, the measurements of all the modules are made. The time it takes to acquire the I-V curve of each module is 40 ms. A better definition, reliability, and low disturbance in the low-current region of the I-V curve can be obtained, if required, by the acquisition of several I-V curves and averaging [39], but at the expense of a longer time of exploration. For installations with a large number of PV modules, a balance between total time of measurement and curve definition should be considered.
Ambient and module temperatures in the I-V curve acquisition moment have been measured and will be presented within the results. The temperatures were measured using an external PT1000 temperature probe, as this electronic board prototype does not have any temperature nor irradiance sensor incorporated. The temperature probe has been attached to a healthy cell in the middle of the PV module. A schema of the system is presented in Figure 7, showing the global operating diagram, where it is possible to see the bidirectional inverter, as well as the electronic boards installed in each photovoltaic module. The injection of current in dark conditions will allow the realization of the dark I-V curve.
Once the dark I-V curves are captured, the main parameters of the one exponential model (single-diode model) of each module are obtained using the 2/3 Diode Fit software [40] with the objective of drawing some conclusions on the state of the analyzed PV modules. The free software 2/3 Diode Fit permits calculating model parameters for PV devices using a 1-diode model, 2-diode model, and other more complex options. The software provides initial guesses of the parameters, calculating the slopes and applying conditions in the areas in which each parameter has more influence. From these starting parameters, optimized ones are obtained through an iterative procedure, in which it is possible to select the precision and stopping criteria. The algorithm to calculate the I-V curve is described in detail in [41], and all program functionalities and a comprehensive explanation of the equations and options available can be found in the program manual available at [40]. As it has been detailed, these parameters are extremely useful for analyzing the appearance of different failure modes, monitoring the degradation of modules, and detecting or characterizing certain defects, among others.

3. Results and Discussion

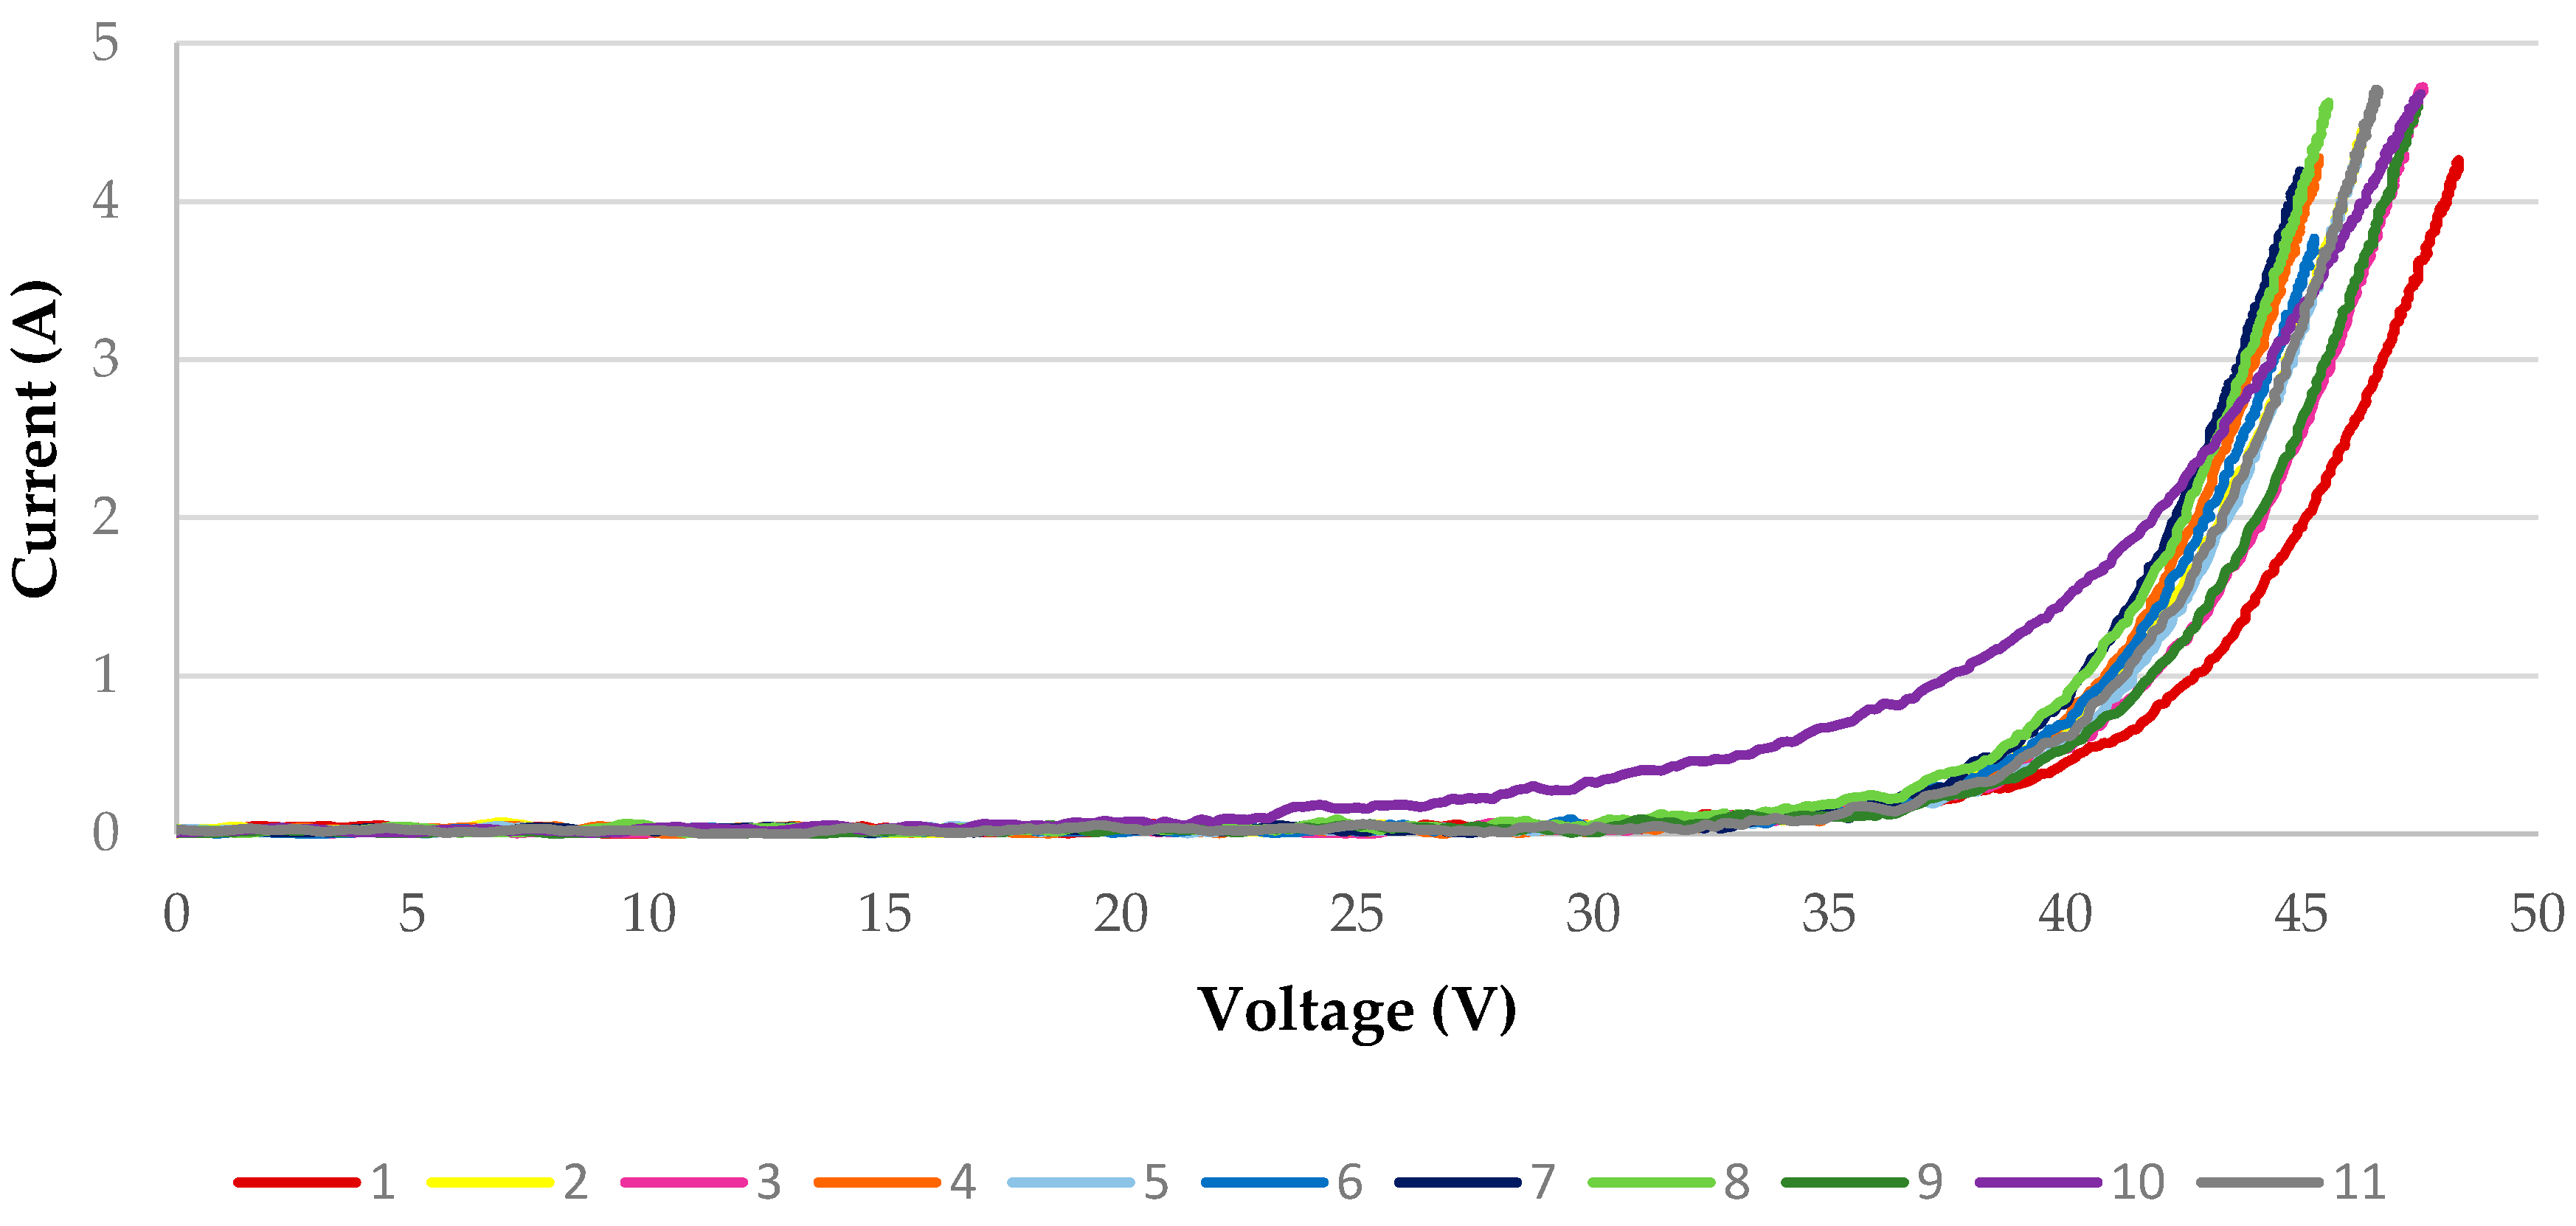
3.1. Dark I-V Curves Onsite Measurements

The following Table 2 shows the ambient temperature and the temperature of the photovoltaic cell for the measurements performed.
Figure 8 shows the I-V curves in darkness for all photovoltaic modules. These measurements have been taken at the temperature values indicated in Table 2. Each I-V curve has been presented at the cell temperature at which it has been captured. Conversion to 25 °C cell temperature has not been performed, as PV modules with different kinds of defects have been used, and the nominal conversion parameters (alpha, beta, and gamma) could have changed over the years associated with the degradation of the modules.

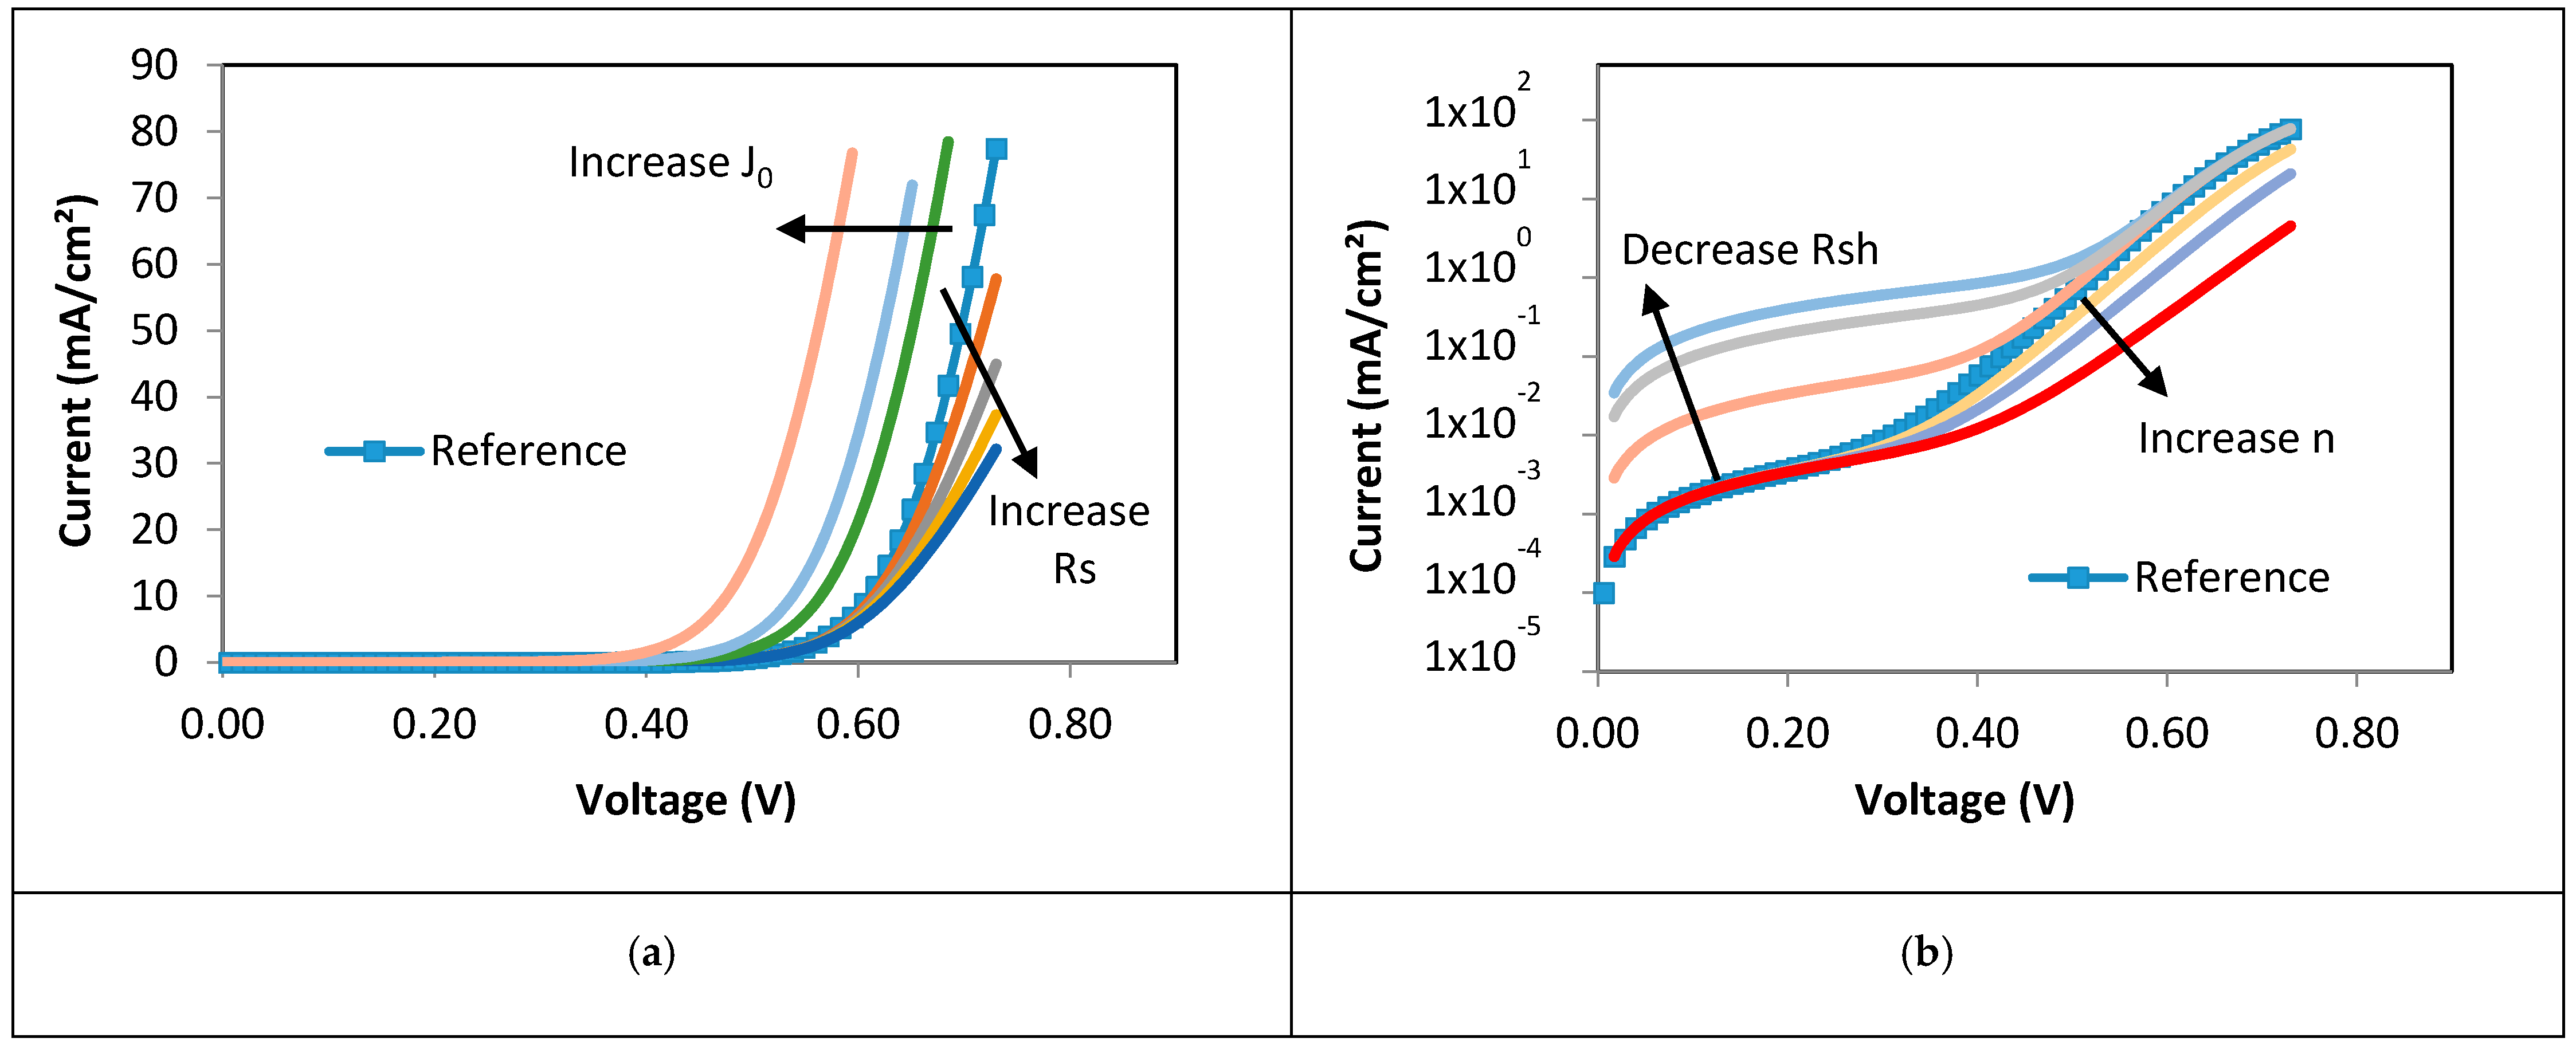
3.2. Extraction of Solar Module Parameters from the Measured Dark I-V Curves

Once the dark I-V curves onsite measurements have been presented, the main parameters of the one exponential model (single-diode model) of each module are obtained using the 2/3 Diode Fit software. These results are presented in Table 3. In order to have comparative results between the different modules, parameters are presented in relation to the area. With the objective of drawing some conclusions on the state of the analyzed PV modules and for comparison purposes, all dark I-V curves have been presented in the same graph in Figure 8 and are analyzed together with their main parameters in this subsection.
First, it can be observed from Figure 8 is that there is one curve—number 10 from module 10—that has different characteristics from the rest. This is reflected in the extremely high value of the saturation current that, combined with the high value of the diode factor, dominates the rest of the model parameters.
For the curves that belong to the same module type (1, 2, 3, 4, 5, 7, 8, and 9), some differences can also be appreciated. If we fix a current equivalent to Isc, we find that different voltages are found for the I-V characteristics. Given that all the curves are measured at approximately the same temperature, these variations would indicate different degradation in these modules. Furthermore, changes in the slope in the high-voltage area indicate changes in series resistance (higher slope, lower series resistance). It has to be taken into account that these modules have a lot of damages, some of them appreciated by the naked eye (see the upper row of modules in Figure 6), and various degradation modes are mixed, influencing the measured dark I-V curves. Higher series resistance modules indicate degradation in the module electrical circuit (modules 1, 3, and 7). High series resistance, combined with lower shunt resistance and diode saturation current could inform about mechanical damage [31] (for example, module 3).
It is also observed that some modules, especially those numbered 7, 8, and 2 present a very low value of shunt resistance (see Table 3). This low value of shunt resistance is also found in the other EOPLLY module (165W type), and in the number 10 module, which presents high degradation in all parameters. These low values of shunt resistance would imply shunting loses in the module. The combination of a lower Rsh and higher J0 in modules 2 and 8 would indicate that the recombination losses are also enhanced in these modules.
With reference to the I-V curves presented, other interesting ideas can be pointed out. Differences between curves (in the 35–50 V range) are a consequence of the combination of parameters that can have opposite effects (for example, J0 and n), so it is very difficult to grasp differences among the degradation states of several modules by solely comparing their I-V curves in a certain moment (except for cases as that of module 10), one to each other. In this case, the rightmost curve corresponds to module 1 (J0 = 7.87 × 10⁻⁹ A/cm2 and n = 1.73), while the leftmost is of module 7 (J0 = 3.98 × 10⁻¹² A/cm2 and n = 1.04). The important point is also to compare the I-V curves of the same module in different periods along its life, because a check of possible shifts or changes in the curves or in the extracted parameters along time could reveal degradation processes being started or affecting the performance of the module.

4. Conclusions

This work demonstrates the possibility of tracing dark I-V curves in the modules of a PV plant without disconnecting them from the string. This is a breakthrough, as the dark I-V curve gives important information about the PV device and certain defects. These measures have been possible thanks to the combination of a bidirectional inverter and the developed electronic boards installed at the PV module level.
The results of the measurements have been satisfactory, and this allows obtaining the values of Rs and Rsh, among others, of the different PV modules of a plant online, without disconnection. The values obtained for Rs and Rsh, adjusted with the 2/3 Diode Fit software perfectly fit to the PV module installed.
With regard to future work, the authors will research the combination of dark and light I-V curve measurements. All measurements will be carried out without disconnection in the PV plant when combined with the bidirectional inverter. In addition, these measures will be managed and controlled through a low-cost communications system based on power line communications. In addition, with the measurements carried out, this research group will work with models based on artificial intelligence to locate defects in modules and cells, with the aim of keeping the performance of the photovoltaic plant high. Advances in O&M are key for this research team. Models based on artificial intelligence will work with images (electroluminescence and thermography) and I-V curves (light and dark).

Author Contributions

Conceptualization, L.H-C. and J.I.M.-A.; methodology, L.H-C., J.I.M.-A., S.G-S., M.d.C.A.-G., V.A-G., and J.L.B.; software, J.I.M.-A. and A.R-P.; validation, L.H-C., J.I.M.-A., S.G-S., M.d.C.A.-G., V.A-G., and J.L.B.; formal analysis, L.H-C. and J.I.M.-A.; investigation, L.H-C., J.I.M.-A., S.G-S., M.d.C.A.-G., and V.A-G.; resources, L.H-C. and V.A-G.; data curation, J.I.M.-A., S.G-S., M.d.C.A.-G., and A.R-P.; writing—original draft preparation, L.H-C., J.I.M.-A., S.G-S., M.d.C.A.-G., and J.L.B.; writing—review and editing, L.H-C., J.I.M.-A., S.G-S., M.d.C.A.-G., V.A-G., J.L.B., and A.R-P.; visualization, L.H-C., J.I.M.-A., S.G-S., M.d.C.A.-G., and V.A-G.; supervision, L.H-C., M.d.C.A.-G., and V.A-G.; project administration, L.H-C.; funding acquisition, L.H-C. and V.A-G. All authors have read and agreed to the published version of the manuscript.

Funding

This research was funded by the “Ministerio de Industria, Economía y Competitividad” grant number “RTC-2017-6712-3” with name “Desarrollo de herramientas Optimizadas de operaCión y manTenimientO pRedictivo de Plantas fotovoltaicas—DOCTOR-PV”.

Data Availability Statement

To request the data, please, contact the corresponding author

Conflicts of Interest

The authors declare no conflict of interest.

References

  1. Solar Power Europe Global Market Outlook For Solar Power/2020–2024. Available online: www.solarpowereurope.org (accessed on 15 July 2020).
  2. International Energy Agency. Photovoltaic Power Systems. In Snapshot of Global PV Markets 2020; International Energy Agency: Paris, France, 2020. [Google Scholar]
  3. International Energy Agency. World Energy Outlook 2020. Executive Summary; International Energy Agency: Paris, France, 2020. [Google Scholar]
  4. International Electrotechnical Comission. International Electrotechnical Comission. Working Group 2: Solar Photovoltaic Energy Systems; International Electrotechnical Comission: Geneva, Switzerland, 2010. [Google Scholar]
  5. Klise, G.T.; Balfour, J.R.; Keating, T.J. Solar PV O&M Standards and Best Practices—Existing Gaps and Improvement Efforts; Sandia National Lab. (SNL-NM): Albuquerque, NM, USA, 2014. [Google Scholar]
  6. Hill, R.R.; Klise, G.; Balfour, J.R. Precursor Report of Data Needs and Recommended Practices for PV Plant Availability, Operations and Maintenance Reporting; Sandia National Laboratories: Albuquerque, NM, USA, 2015. [Google Scholar]
  7. National Renewable Energy Laboratory (NREL). Best Practices for Operation and Maintenance of Photovoltaic and Energy Storage Systems, 3rd ed.; National Renewable Energy Laboratory (NREL): Golden, CO, USA, 2018. [Google Scholar]
  8. Solar Power Europe. Operation & Maintenance Best Practice Guidelines/Version 4.0; SolarPower Europe: Brussels, Belgium, 2019. [Google Scholar]
  9. Tsanakas, J.A.; Ha, L.; Buerhop, C. Faults and infrared thermographic diagnosis in operating c-Si photovoltaic modules: A review of research and future challenges. Renew. Sustain. Energy Rev. 2016, 62, 695–709. [Google Scholar] [CrossRef]
  10. Gallardo-Saavedra, S.; Hernández-Callejo, L.; Alonso-García, M.D.C.; Muñoz-Cruzado-Alba, J.; Ballestín-Fuertes, J. Infrared thermography for the detection and characterization of photovoltaic defects: Comparison between illumination and dark conditions. Sensors 2020, 20, 4395. [Google Scholar] [CrossRef] [PubMed]
  11. Roumpakias, E.; Bouroutzikas, F.; Stamatelos, A. On-site Inspection of PV Panels, Aided by Infrared Thermography. Adv. Appl. Sci. 2016, 1, 53–62. [Google Scholar] [CrossRef]
  12. Teubner, J.; Buerhop, C.; Pickel, T.; Hauch, J.; Camus, C.; Brabec, C.J. Quantitative assessment of the power loss of silicon PV modules by IR thermography and its dependence on data-filtering criteria. Prog. Photovolt. Res. Appl. 2019, 27, 856–868. [Google Scholar] [CrossRef]
  13. Dunderdale, C.; Brettenny, W.; Clohessy, C.; van Dyk, E.E. Photovoltaic defect classification through thermal infrared imaging using a machine learning approach. Prog. Photovolt. Res. Appl. 2020, 28, 177–188. [Google Scholar] [CrossRef]
  14. Jahn, U.; Herz, M.; Rheinland, T. Review on Infrared (IR) and Electroluminescence (EL) Imaging for Photovoltaic Field Applications; International Energy Agency: Paris, France, 2018. [Google Scholar]
  15. Muttillo, M.; Nardi, I.; Stornelli, V.; de Rubeis, T.; Pasqualoni, G.; Ambrosini, D. On field infrared thermography sensing for PV system efficiency assessment: Results and comparison with electrical models. Sensors 2020, 20, 1055. [Google Scholar] [CrossRef] [PubMed] [Green Version]
  16. Köntges, M.; Kurtz, S.; Packard, C.; Jahn, U.; Berger, K.A.; Kato, K.; Friesen, T.; Liu, H.; Van Iseghem, M. Review of Failures of Photovoltaic Modules; International Energy Agency: Paris, France, 2014. [Google Scholar]
  17. Berardone, I.; Lopez Garcia, J.; Paggi, M. Quantitative analysis of electroluminescence and infrared thermal images for aged monocrystalline silicon photovoltaic modules. In Proceedings of the 2017 IEEE 44th Photovoltaic Specialist Conference (PVSC), Washington, DC, USA, 25–30 June 2017; IEEE: Piscataway, NJ, USA, 2018; pp. 402–407. [Google Scholar]
  18. Köntges, M.; Siebert, M.; Hinken, D. Quantitative analysis of PV-modules by electroluminescence images for quality control. In Proceedings of the 24th European Photovoltaic Solar Energy Conference, Hamburg, Germany, 21–25 September 2009; pp. 3226–3231. [Google Scholar]
  19. Santos, J.D.; Valverde, A.; Alonso-García, M.C. Quantitative Analysis of Electroluminescence Imaging of a pv module with different mismatch levels. In Proceedings of the 36th European Photovoltaic Solar Energy Conference and Exhibition, Marseille, France, 9–13 September 2019; pp. 1127–1133. [Google Scholar]
  20. Koch, S.; Weber, T.; Sobottka, C.; Fladung, A.; Clemens, P.; Berghold, J.; Koch, S.; Weber, T.; Sobottka, C.; Fladung, A.; et al. Outdoor Electroluminescence Imaging of Crystalline Photovoltaic Modules: Comparative Study Between Manual Ground-Level Inspections and Drone-Based Aerial Surveys. In Proceedings of the 32nd European Photovoltaic Solar Energy Conference and Exhibition, Munich, Germany, 20–24 June 2016; pp. 1736–1740. [Google Scholar]
  21. Wolf, M.; Rauschenbach, H. Series resistance effects on solar cell measurements. Adv. Energy Convers. 1963, 3, 455–479. [Google Scholar] [CrossRef]
  22. Celik, A.N.; Acikgoz, N. Modelling and experimental verification of the operating current of mono-crystalline photovoltaic modules using four- and five-parameter models. Appl. Energy 2007, 84, 1–15. [Google Scholar] [CrossRef]
  23. Ciulla, G.; Lo Brano, V.; Di Dio, V.; Cipriani, G. A comparison of different one-diode models for the representation of I-V characteristic of a PV cell. Renew. Sustain. Energy Rev. 2014, 32, 684–696. [Google Scholar] [CrossRef]
  24. Zhu, Y.; Xiao, W. A comprehensive review of topologies for photovoltaic I–V curve tracer. Sol. Energy 2020, 196, 346–357. [Google Scholar] [CrossRef]
  25. Pérez, L.; Coello, J.; Domínguez, F.; Navarrete, M. Development and implementation of a mobile laboratory—PV mobile Lab quality assurance of photovoltaic modules “on site”. In Proceedings of the 28th European Photovoltaic Solar Energy Conference and Exhibition, Paris, France, 30 September–4 October 2013; pp. 3500–3504. [Google Scholar]
  26. Coello, J.; Pérez, L.; Domínguez, F.; Navarrete, M. On-site quality control of photovoltaic modules with the PV MOBILE LAB. Energy Procedia 2014, 57, 89–98. [Google Scholar] [CrossRef] [Green Version]
  27. Morales-Aragonés, J.I.; Hernández-Callejo, L.; Gallardo-Saavedra, S.; Alonso-Gómez, V.; Sánchez-Pacheco, F.J.; González-Rebollo, M.A.; Martínez-Sacristán, O.; Muñoz-García, M.A.; Alonso-García, M.C. Low cost electronics for online I-V tracing at photovoltaic module level: Development of two strategies and comparison between them. Electronics 2021. under review. [Google Scholar]
  28. Bouzidi, K.; Chegaar, M.; Aillerie, M. Solar cells parameters evaluation from dark I-V characteristics. Energy Procedia 2012, 18, 1601–1610. [Google Scholar] [CrossRef]
  29. Martil, I.; Gonzalez Diaz, G. Determination of the dark and illuminated characteristic parameters of a solar cell from I-V characteristics. Eur. J. Phys. 1992, 13, 193–197. [Google Scholar] [CrossRef]
  30. King, D.L.; Hansen, B.R.; Kratochvil, J.A.; Quintana, M.A. Dark current-voltage measurements on photovoltaic modules as a diagnostic or manufacturing tool. In Proceedings of the Conference Record of the IEEE Photovoltaic Specialists Conference, Anaheim, CA, USA, 29 September–3 October 1997; pp. 1125–1128. [Google Scholar]
  31. Spataru, S.V.; Sera, D.; Hacke, P.; Kerekes, T.; Teodorescu, R. Fault identification in crystalline silicon PV modules by complementary analysis of the light and dark current–voltage characteristics. In Proceedings of the Progress in Photovoltaics: Research and Applications, 29th EU PVSEC, Amsterdam, The Netherlands, 2014; Volume 24, pp. 517–532. [Google Scholar]
  32. Spataru, S.; Hacke, P.; Sera, D. In-Situ Measurement of Power Loss for Crystalline Silicon Modules Undergoing Thermal Cycling and Mechanical Loading Stress Testing; National Renewable Energy Laboratory (NREL): Golden, CO, USA, 2015. [Google Scholar]
  33. Spataru, S.; Hacke, P.; Sera, D.; Packard, C.; Kerekes, T.; Teodorescu, R. Temperature-dependency analysis and correction methods of in situ power-loss estimation for crystalline silicon modules undergoing potential-induced degradation stress testing. Prog. Photovolt. Res. Appl. 2015, 23, 1536–1549. [Google Scholar] [CrossRef]
  34. Alonso-Garcia, M.C.; Hacke, P.; Glynn, S.; Muzzillo, C.P.; Mansfield, L.M. Analysis of Potential-Induced Degradation in Cu (In, Ga) Se2 Samples. IEEE J. Photovolt. 2019, 9, 331–338. [Google Scholar] [CrossRef]
  35. Oh, W.; Bae, S.; Kim, D.; Park, N. Initial detection of potential-induced degradation using dark I–V characteristics of crystalline silicon photovoltaic modules in the outdoors. Microelectron. Reliab. 2018, 88–90, 998–1002. [Google Scholar] [CrossRef]
  36. Ballestín-Fuertes, J.; Muñoz-Cruzado-Alba, J.; Sanz-Osorio, J.F.; Hernández-Callejo, L.; Alonso-Gómez, V.; Morales-Aragones, I.; Gallardo-Saavedra, S.; Martínez-Sacristan, O.; Moretón-Fernández, Á. Novel Utility-Scale Photovoltaic Plant Electroluminescence Maintenance Technique by Means of Bidirectional Power Inverter Controller. Appl. Sci. 2020, 10, 3084. [Google Scholar] [CrossRef]
  37. Miller, S.D.; Turner, R.E. A dynamic lunar spectral irradiance data set for NPOESS/VIIRS day/night band night time environmental applications. IEEE Trans. Geosci. Remote Sens. 2009, 47, 2316–2329. [Google Scholar] [CrossRef]
  38. Moretón, A.; Gallardo, S.; Jiménez, M.M.; Alonso, V.; Hernández, L.; Morales, J.I.; Martínez, O.; González, M.A.; Jiménez, J. Influence of large periods of dc current injection in c-si photovoltaic panels. In Proceedings of the 36th European Photovoltaic Solar Energy Conference and Exhibition (PVSEC2019), Marseille, France, 9–13 September 2019; pp. 107–108. [Google Scholar]
  39. Balenzategui, J.L.; Cuenca, J.; Rodríguez-Outón, I.; Chenlo, F. Intercomparison and Validation of Solar Cell I-V Characteristic Measurement Procedures. In Proceedings of the 27th European Photovoltaic Solar Energy Conference and Exhibition, Frankfurt, Germany, 24–28 September 2012; pp. 1471–1476. [Google Scholar]
  40. Suckow, S. 2/3-Diode Fit. Available online: http://nanohub.org/resources/14300 (accessed on 15 August 2020).
  41. Suckow, S.; Pletzer, T.M.; Kurz, H. Fast and reliable calculation of the two-diode model without simplification. Prog. Photovolt. Res. Appl. 2014, 22, 494–501. [Google Scholar] [CrossRef]
Figure 1. One-diode model of a photovoltaic (PV) cell under illumination conditions (a) and dark conditions (b), including the series and shunt resistances.
Applsci 11 01924 g001
Figure 2. Illuminated and dark current–voltage (I-V) curves with their characteristic points.
Applsci 11 01924 g002
Figure 3. Simulated dark I-V curves by introducing changes in one of the exponential parameters. Reference curve: J0 = 1.5 × 10⁻⁹ A/cm2, n = 1.5, Rs = 0.6 Ω cm2, and Rsh = 60.000 Ω cm2, (a) increase in Rs from 0.6 to 2.5 Ω cm2 and J0 from 1.5 × 10⁻⁹ to 5 × 10⁻⁸ A/cm2; (b) increase in n from 1.5 to 1.9 and decrease in Rsh from 60,000 to 500 Ω cm2. Graph (b) is presented in logarithm scale.
Applsci 11 01924 g003
Figure 4. Bidirectional power inverter of the Campus Duques de Soria of the University of Valladolid.
Applsci 11 01924 g004
Figure 5. Schematic of the module electronic board (a) and a real picture of the card (b).
Applsci 11 01924 g005
Figure 6. Photovoltaic (PV) installation in Campus Duques de Soria.
Applsci 11 01924 g006
Figure 7. Global operating diagram of the system.
Applsci 11 01924 g007
Figure 8. Dark I-V curves of the eleven modules measured with the developed device at the PV installation in Campus Duques de Soria.
Applsci 11 01924 g008
Table 1. Main characteristics of the PV modules tested.
Module NumberModule ModelCellsPower (P) [W]Voc [V]Vmpp [V]Isc [A]Impp [A]
1, 2, 3, 4, 5, 7, 8 and 9EOPLLY72 cells (125 mm × 125 mm)17544.3536.265.454.83
6EOPLLY16543.9235.645.234.63
10EGNG18044.435.45.355.08
11SKY GLOBAL17542.635.55.524.93
Table 2. Ambient and cell temperatures of each module at the I-V curve measurement.
Module NumberAmbient Temperature [°C]Cell Temperature [°C]
114.514.7
214.414.7
314.414.5
414.414.7
514.615.4
615.316.2
714.616.7
814.816.1
814.717.0
914.816.5
1015.016.9
1115.021.5
Table 3. Absolute and referred to unit area main parameters of the one exponential model (single-diode model) of each module obtained using the 2/3 Diode Fit software. The values referred to unit area correspond to the cell current density J0 [A/cm2] and cell shunt Rsh [kΩ·cm2] and series Rs [Ω cm2] resistances. The absolute values of current and resistance included in the table correspond to the module parameters, and they have been obtained from the cell values referred to unit area.
Module NumberJ0 [A/cm2]I0 [A]nRsh [kΩ cm2]Rsh [kΩ]Rs [Ω·cm2]Rs [Ω]
17.87 × 10–91.23 × 1061.7324.7911.421.170.54
24.22 × 10–96.60 × 1071.613.751.730.510.24
33.64 × 10–105.69 × 10–81.3812.335.681.290.59
42.83 × 10–114.42 × 10–91.179.564.410.990.46
52.15 × 10–93.36 × 10–71.557.723.560.490.23
67.57 × 10–101.18 × 10–71.414.151.911.000.46
73.98 × 10–126.22 × 10–101.042.641.211.450.67
83.68 × 10–95.75 × 10–71.562.020.930.340.16
94.00 × 10–96.25 × 10–71.6389.4741.230.540.25
107.49 × 10–61.17 × 10–33.052.150.990.860.40
113.91 × 10–96.11 × 10–71.5760.5727.910.470.22
Publisher’s Note: MDPI stays neutral with regard to jurisdictional claims in published maps and institutional affiliations.

