Abstract
Although values of arch stiffness index (ASI) have been used to evaluate arch structure and injury susceptibility, investigations are limited regarding the influence of ASI on biomechanical characteristics during gait termination, which involves a challenging balance transition from walking to standing. This study aimed to explore plantar pressure distribution and lower extremity joint kinematic differences between individuals with both a stiff and flexible arch (SA and FA, respectively) during planned and unplanned gait termination (PGT and UGT, respectively). Following the calculation of ASI, sixty-five asymptomatic male subjects were classified and participated in two types of gait termination tests to acquire kinematic and plantar pressure data. Parameters were compared between SA and FA using a two-way ANOVA during PGT and UGT, respectively. UGT was found to have a larger range of motion on the hip joint in the sagittal plane and the knee joint in the transverse plane when compared with PGT. The differences in the kinematic characteristics of the lower limb joints caused by the difference in arch stiffness are mainly concentrated in the ankle and metatarsophalangeal joints. Plantar pressure data, represented by the maximum pressure, showed significant differences in the forefoot and rearfoot areas. These results suggest that ASI could change freedom of motion of the lower limb joints, and UGT tends to conduct a compensatory adjustment for the lower extremity kinetic chain. An understanding of the biomechanical characteristics of arch structures may provide additional insights into foot function and injury prediction during gait termination.
1. Introduction
With a transformation of locomotor habits related to terrestrial bipedality, foot structure and function have altered during evolution and transition from ape-like species to human species [1]. Among the changes observed, a representative change in the human species is the addition of a medial longitudinal arch protected by plantar tensile elements. In the course of human movements such as running and jumping, the foot arch implements the effective transmission of force between the lower limbs and the ground through the synergy between the facet joints [2,3]. During the stance phase, the arch deforms to absorb the impact load as elastic strain energy. Arch stiffness is changed by the windlass mechanism during the terminal phase, and the passive elastic rebound of the plantar fascia produces positive work to improve the efficiency of ambulation [4,5]. When performing a gait termination task, compared with steady-state gait, the impact load on the arch may further increase [6,7]. This is especially true during unplanned gait termination, and due to unknown stimulus, the initial dynamic balance of the body will be disrupted. The human body needs to increase the braking force and reduce the push-off force in a short period, thereby creating a sufficient net braking impulse to form a modified body balance perspective [8,9].
Improving our insight into complex human locomotion of the lower limb requires sophisticated gait analysis using a biomechanical approach. Morphologically related foot parameters have been widely investigated in biomechanical research [6]. High arches and low arches have been classified as abnormal foot configurations formed by extreme arch structures, which are commonly associated with a higher risk of sport injuries [10,11]. In addition to arch height, arch stiffness is also considered as one of the important parameters for evaluating arch shape [12]. By comparing arch height change between sitting and standing conditions, the arch stiffness index (ASI) can effectively be calculated and is a reflection of the arch’s dynamic loading adaptability [13]. Combining the relationship between medial–lateral ground reaction forces and chronic running injuries, arch stiffness has been reported as a criterion to assess injury susceptibility [14]. It has been widely recognized that more flexible arches tend to splay during the stance phase, and shift load from the midfoot to forefoot and rearfoot concurrently along the longitudinal axis of the foot [14]. However, other studies have noted that flexible arches exhibited a smaller and larger proportion of total plantar impulse in the forefoot and rearfoot than stiff arches, respectively, in both walking and running [3,14]. The unidirectional impulse transmission on the plantar longitudinal axis could be related to the fact that in the asymmetric and irregular triangular truss model formed by the plantar fascia and the arch bones, the shorter proximal side attached to the calcaneal tuberosities would suffer more impulses during arch compression [15,16].
Although previous studies have attempted to elucidate the biomechanical characteristic differences with different arch heights [6,10,11,17,18], few studies have investigated lower extremity kinetics and kinematics based on different arch stiffnesses while performing gait stopping tasks. Based on the research interest in morphology-related arch function, the purpose of this study was to analyze the biomechanical characteristic differences including lower limb joint angles and plantar pressure between stiff arches and flexible arches during gait termination. We hypothesized that the lower limb joint motions, especially for the ankle and metatarsophalangeal (MTP), would vary significantly between planned and unplanned gait termination (PGT and UGT). We also hypothesized that participants would exhibit substantial asymmetrical lower-limb biomechanical characteristics due to the stiffness of the foot arch.
2. Materials and Methods
2.1. Subjects
Prior to the commencement of the experiment, the sample size was calculated utilizing G*Power version 3.1 software (Franz Faul, Christian-Albrechts-Universität Kiel, Kiel, Germany). Sixty-five subjects were recruited to participate in the study, with ages of 24.3 ± 0.7 years, heights of 179.5 ± 5.1 cm, weights of 72.6 ± 6.5 kg, and BMIs of 22.5 ± 1.8 kg/m2. All participants had to meet the following requirements: (i) each subject was a physically active male adult; (ii) the right-side leg was the dominant leg; (iii) there were no foot deformities or medical problems that might potentially affect gait performance; (iv) there was no hearing disorder; (v) there had been no history of disorders or injuries to the lower limbs in the first half of the year preceding data collection. Prior to data collection, subjects were fully familiarized with the experimental protocol and procedure. The Ethics Committee of the Research Institute in Ningbo University approved the study, and written informed consent was obtained from all subjects preceding participation.
2.2. Experimental Protocol and Procedure
2.2.1. Static Foot Structure Measurements
Prior to the dynamic gait task measurements, three-dimensional (3D) foot morphology images of all participants during standing and sitting conditions were collected using the Easy-Foot-Scan apparatus (OrthoBaltic, Kaunas, Lithuania), following a previously established protocol [3].
Based on the 3D foot image during standing and sitting conditions obtained from foot morphological scanning, the variables of foot structure including instep height and ball of the foot length were calculated by AutoCAD software (Autodesk, San Rafael, CA, USA). The ASI was calculated using the following formula, assuming a 40% alteration in load from sitting to standing positions [13]:
Arch Height Index (AHI) = Instep Height/Ball of the Foot Length
Arch Stiffness Index (ASI) = 0.4 × Body Weight/(AHISitting − AHIStanding)
Previous research with similar demographics to those in the current study suggests that 1448 is the median ASI [3]. Therefore, participants in the current study were categorized into one of two groups: stiff arches (SA, ASI > 1448) and flexible arches (FA, ASI < 1448). According to this categorization methodology, 31 participants had SAs and 34 had FAs.
2.2.2. Dynamic Gait Task Measurements
Once participants completed static foot structure measurements, a 5-min warm-up and laboratory environment familiarization were conducted before dynamic gait task measurements. Recordings were made in a standard laboratory room with normal indoor temperature and lighting design. A global reference system conforming to the standards of the International Society of Biomechanics was adopted [19]. All participants were instructed to perform two kinds of gait termination tests, including planned and unplanned gait termination. They were asked to walk barefoot at a self-selected speed along a 15 m walkway which contained a 2 m Footscan plantar pressure plate system (RSscan International, Olen, Belgium) in the center of the lab. Then, participants were instructed to stop walking, immediately, if they received an auditory signal delivered when their left foot first stepped onto the pressure plate and to remain still until told to move again. Otherwise, they needed a planned stop at the end of the pressure plate. The recording procedure of the dynamic plantar loading patterns followed a previously established protocol [3,6]. The auditory signals were initiated using a bell. Twenty-five percent of gait trials in each block included the ringing signal, while the remaining 75% did not. This was done so that participants were not able to anticipate sensory cues. There was a 2 min rest interval between both trials to minimize the effects of fatigue influencing the results of the experiment. Each subject was required to provide ten successful gait trial datasets, including five planned gait termination trials and five unplanned gait termination trials.
A three-dimensional motion capture system (Vicon Motion System Ltd., Oxford, UK) with 8 infrared cameras was used to capture the kinematic data of the dominant lower extremity joints using a frequency of 200 Hz. Twenty-five reflective markers (diameter: 9.0 mm) were placed to define the pelvis, thigh, shank, forefoot, and rearfoot segments (Figure 1) [20]. The MTP joint was defined as the angle between the forefoot and rearfoot anatomical coordinate systems, referring to the definition approach by Roy et al. [21]. The rotation axis was defined as the intermediate point between the first and fifth metatarsal heads and the connection between the markers of the first and fifth distal metatarsals [20,21].
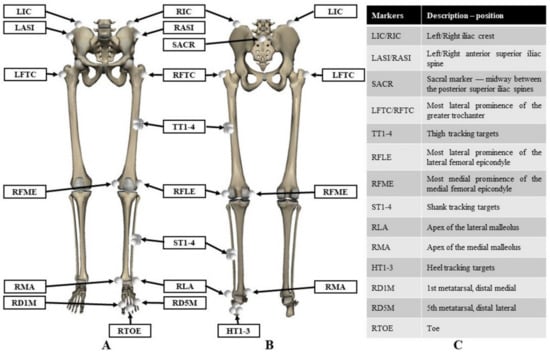
Figure 1.
Illustration of reflective markers attached to the lower limbs. (A) Front view; (B) rear view; (C) marker description.
2.3. Data Acquisition
For each gait trial, eight anatomical regions were artificially divided by the Footscan® 7.0 (RsScan International, Olen, Belgium), including 1st Metatarsal (M1), 2nd Metatarsals (M2), 3rd Metatarsal (M3), 4th Metatarsal (M4), 5th Metatarsal (M5), Midfoot (MF), Medial Hindfoot (MH) and Lateral Hindfoot (LH). Maximum pressure was measured to evaluate the differences in plantar pressure distribution characteristics between SA and FA during PGT and UGT. The period of collecting and analyzing the two types of gait termination trials was the stance phase of the braking leg (right leg) during the stopping process.
Visual 3D (C-Motion Inc., Germantown, MD, USA) was used to calculate variables in the sagittal, frontal, and transverse planes of the hip, knee, ankle, and MTP joints using C3D format files created by Vicon Nexus Software (Vicon Motion System Ltd., Oxford, UK). The trajectories of reflective markers were de-noised using a second-order low-pass Butterworth filter with a cut-off frequency of 6 Hz. An inverse kinematics algorithm was performed in Visual 3D software to calculate the joint angles. The ranges of motion (ROMs) of four joints were obtained from the maximum and minimum joint angles on the 3D movement.
2.4. Statistical Analysis
A two-way analysis of variance (ANOVA) was applied for analyzing the main differences of the lower limb kinematics data and plantar pressure data between SA and FA during PGT and UGT. The fixed factors for the study were arch stiffness (SA vs. FA) and terminational pattern (PGT vs. UGT). Primary dependent variables were kinematic parameters including the angles of the hip, knee, ankle, and MTP joints in the sagittal, frontal, and transverse planes, and maximum pressure. All experimental data were normally distributed based on Shapiro–Wilk test analysis. The significance level was set at 0.05 for all statistical tests. Data are presented as means and standard deviations (SD). All statistical procedures were performed using SPSS 25.0 (SPSS Inc., Chicago, IL, USA).
3. Results
3.1. Kinematics
Lower extremity joint kinematic patterns of the hip, knee, ankle, and MTP joints were plotted against the percentage of stance for the PGT and UGT from subjects with SA/FA conditions (Figure 2). The lower extremity joint ROMs during two types of gait terminations are shown in Table 1.
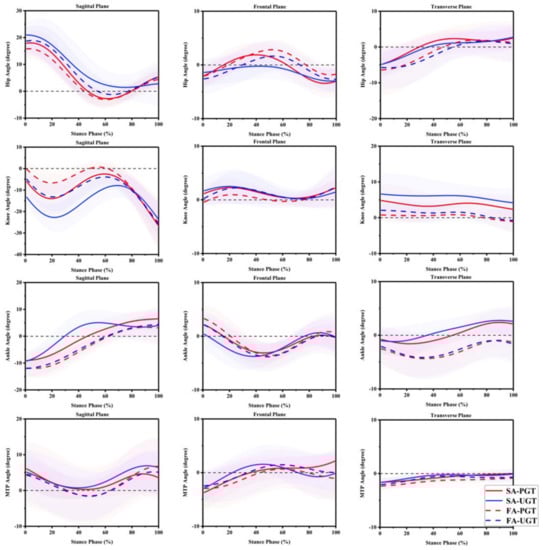
Figure 2.
Joint angles curves of the hip, knee, ankle, and metatarsophalangeal (MTP) joints in sagittal, frontal, and transverse planes during gait terminations. SA: stiff arch; FA: flexible arch; PGT: planned gait termination; UGT: unplanned gait termination.

Table 1.
Lower extremity joints’ range of motion (ROM) from subjects with different arch stiffnesses during two types of gait terminations.
As shown in Table 1, for the hip joint, ROMs were significantly larger (p = 0.001) during UGT compared with PGT in the sagittal plane. In the frontal plane, significant decreases in ROMs existed in UGT, relative to PGT (p < 0.001). Significantly greater ROMs (p < 0.001) were found in UGT compared with PGT in the transverse plane of the knee joint. In the sagittal plane of the ankle joint, larger ROMs were also found in UGT in comparison with PGT under both arch stiffness conditions (p = 0.005). Significant decreases in ROMs in the frontal plane existed in PGT compared to UGT (p = 0.005). However, no significant difference was found between UGT and PGT in the three planes of the MTP joint.
For the hip angles, in the sagittal plane, subjects with SA showed a greater ROM compared with subjects with FA (p = 0.002). SA subjects showed a significantly smaller ROM in the frontal plane compared with FA in both gait termination patterns (p = 0.020).
For the frontal plane, larger ROMs were found from subjects with FA in the knee joint compared with subjects with SA (p < 0.001). For the ankle angles, in the sagittal plane, subjects with SA showed larger ROMs (p < 0.001). In the frontal plane, FA showed larger ROMs (p = 0.044). For the MTP joint, ROMs were significantly larger (p < 0.001) in SA compared with FA in the frontal plane.
3.2. Plantar Pressure
Plantar pressure was collected in this study to evaluate the kinetic characteristics of gait terminations with different arch stiffnesses. The comparison of the maximum pressures in eight anatomical regions are shown in Figure 3.
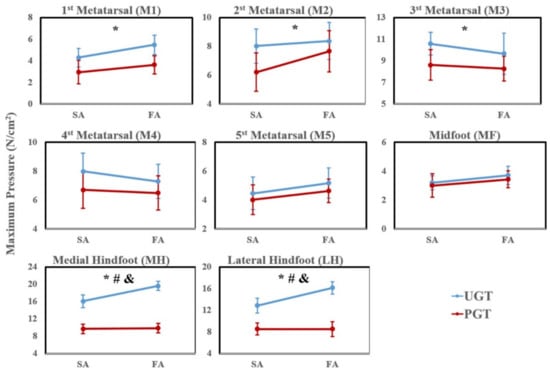
Figure 3.
The plantar pressure during planned and unplanned gait termination in stiff arches and flexible arches. Notes: * means the main effect of terminational pattern; # means the main effect of arch stiffness; & means interaction.
The maximum pressure of UGT was significantly higher in the M1 (p = 0.002), M2 (p = 0.008), HM (p < 0.001), and HL (p < 0.001) compared to PGT. Conversely, the maximum pressures in M3 (p = 0.01) were significantly smaller in UGT compared with PGT.
The maximum pressure from subjects with stiff arches was significantly smaller than with flexible arches in MH and LH (p = 0.037 and p = 0.009).
Significant statistical interaction was only found in the maximum pressures of the heel region including HM and HL, which showed an interaction (F = 9.223, p = 0.003; F = 7.911, p = 0.006) for this parameter.
4. Discussion
To systematically investigate foot pathological conditions, objective biomechanical analyses of foot morphological characteristics and motion-sensitive information responses to different arch types are needed. The purpose of this study was to analyze differences in PGT and UGT with different arch stiffnesses while comparing biomechanical parameters. Consistent with our hypothesis, different arch stiffnesses showed significant differences in ROMs on multiple planes of lower limb joints during PGT and UGT. Moreover, the plantar pressure data, represented by the maximum pressure, also showed significant differences in the forefoot and rearfoot areas.
Gait termination patterns have a certain impact on joint ROMs. Compared with PGT, subjects showed a significantly larger ROM in the hip joint in the sagittal plane and knee joint in the transverse plane during UGT. Combined with related kinetic data [8,22], Sarah et al. [23] demonstrated that UGT with self-selected walking speed and PGT with fast walking speed have similar biomechanical characteristics. This may be a reaction that allows the body to absorb the sudden increases in ground reaction forces and control the movement of the center of mass [23]. However, relative to PGT, significant decreases in hip ROM existed in UGT because of the decrease in maximum adduction angles. According to the results of a previous study [23], when the subjects performed gait termination without unexpected stimulus, they showed gait characteristic differences on spatiotemporal parameters such as slower velocity normalized by the Froude number and longer stop step length. In a relatively short termination time, the hip joints may not be able to show a larger magnitude of movement in the frontal plane due to anatomical structure [24]. Previous studies [23,25,26] stressed that the knee and hip joint angles are the prime variables of interest for stopping tasks. In the current study, however, subjects showed a greater ROM in the sagittal as well as frontal planes of the ankle joint during UGT, which is related to the larger plantarflexion angles and peak eversion during the process. Considering previously explored foot balance differences between two types of gait termination, this may result in gait imbalance and an increased risk of joint damage [27].
As a multi-segmental system, the movements of the hip, knee, and ankle joints are linked with the lower extremity kinetic chain [28]. However, the difference in the morphology of the arch has no significant effect on kinematic compensation of the relative proximal joints such as the hip and knee joints. The more flexible arch means that the foot can withstand a wider range of motion during gait (the propensity for FA to splay under loads) [14]. Kinematic results from the current study demonstrated that the MTP joints of subjects with FA showed a greater ROM in the sagittal plane during the termination of gait, although this was not significant (p > 0.05). In contrast, in the frontal plane, FA showed a significant increase in ROM, which may be a response to the comprehensive integration of the compensatory adjustment to compensate for the increase in the plantarflexion of the MTP joints and stabilize the joint [28]. Zifchock et al. [13] found that there was a weak significant correlation between the arch height and arch stiffness, with a flatter arch corresponding to a more flexible arch. At the same time, previous research [5] reported that, compared to the planus foot, the cavus foot had increased valgus and adduction in the forefoot. During the terminal stance, plantar aponeurosis is less able to be tensioned with MTP extension. The FA tends to reduce the height of the medial longitudinal arch due to bearing loads during gait termination, resulting in a deficient windlass mechanism [29].
The significant differences in dynamic plantar pressure distribution caused by the gait termination patterns are mainly concentrated in the forefoot and rearfoot areas. The M2 and M3 have less freedom of motion owing to being wedged to the cuneiform joints. This zone is not sufficient to dissipate the loads they receive, and this results in bearing relatively greater pressure [18]. Compared with PGT, there are not enough buffering processes in the face of unexpected stimuli during UGT. The subjects need to generate a net braking impulse in a short time [8]. During the terminal swing phase, the rearfoot (i.e., calcaneus) contacts initially with the ground and loads most of the body mass [30]. Excessive maximum pressure might be a potential risk factor for foot injuries such as stress fractures [3]. Structurally, the most significant diversity between FA and SA is the plantar contact area of the midfoot due to the difference in stiffness during the stance phase. At the same time, more rigid feet are less able to absorb impact during locomotion [31]. The decrease in the contact area is linked with larger loads in the forefoot as well as rearfoot [32], and our current results have also confirmed the above-mentioned observation, which might cause the increased risks of lower-limb overload injuries [18,33].
Several limitations in the present study should be considered. Firstly, all participants were physically active males, which was a result of the motivation to alleviate gender- and age-related differences of arch stiffness and locomotion functional [13,34]. Secondly, in this study, lower-limb joint kinetics and electromyography (EMG) data were not included, which may further help in explaining biomechanical characteristics during gait termination [23,26,35,36]. Future studies should focus on the above-mentioned aspects during gait termination based on morphology-related arch functions.
5. Conclusions
In conclusion, this is the first study to synchronously collect lower limb joint kinematics and plantar pressures to compare biomechanical characteristics from subjects with SA and FA during PGT and UGT. Compared with PGT, UGT tends to regard the joints of the lower limbs as a multi-segmental system and conduct a comprehensive integration of the compensatory adjustment during stabilization. The kinematic differences caused by arch stiffness may be due to the insufficient windlass mechanism. The plantar pressure data, represented by maximum pressure, showed significant differences in the forefoot and rearfoot areas. These results add additional insights into foot function and predisposition for injury during planned and unplanned gait terminations.
Author Contributions
Conceptualization, X.C. and Y.G.; methodology, X.C., Z.L. and Y.G.; software, X.C. and Y.G.; validation, X.C., Z.L. and B.I.; investigation, Y.G., J.S.B. and B.I.; writing—original draft preparation, X.C., Z.L. and B.I.; writing—review and editing, J.S.B. and Y.G.; All authors have read and agreed to the published version of the manuscript.
Funding
This study was funded by the by National Natural Science Foundation of China (No.81772423), NSFC-RSE Joint Project (81911530253), National Key R&D Program of China (2020YFF0304600) and K. C. Wong Magna Fund in Ningbo University.
Institutional Review Board Statement
The study was conducted according to the guidelines of the Declaration of Helsinki, and approved by the Ethics Committee of Ningbo University (code: RAGH20181218; date: 18 December 2018).
Informed Consent Statement
Informed consent was obtained from all subjects involved in the study.
Data Availability Statement
Data is contained within the article.
Conflicts of Interest
The authors declare no conflict of interest.
References
- McKeon, P.O.; Hertel, J.; Bramble, D.; Davis, I. The foot core system: A new paradigm for understanding intrinsic foot mus-cle function. Br. J. Sports Med. 2015, 49, 290. [Google Scholar] [CrossRef]
- Lynn, S.K.; Padilla, R.A.; Tsang, K.K. Differences in static- and dynamic-balance task performance after 4 weeks of intrin-sic-foot-muscle training: The short-foot exercise versus the towel-curl exercise. J. Sport Rehabil. 2012, 21, 327–333. [Google Scholar] [CrossRef] [PubMed]
- Cen, X.; Xu, D.; Baker, J.S.; Gu, Y. Association of Arch Stiffness with Plantar Impulse Distribution during Walking, Running, and Gait Termination. Int. J. Environ. Res. Public Health 2020, 17, 2090. [Google Scholar] [CrossRef] [PubMed]
- Kelly, L.A.; Cresswell, A.G.; Racinais, S.; Whiteley, R.; Lichtwark, G. Intrinsic foot muscles have the capacity to control de-formation of the longitudinal arch. J. R. Soc. Interface 2014, 11, 20131188. [Google Scholar] [CrossRef]
- Kruger, K.M.; Graf, A.; Flanagan, A.; McHenry, B.D.; Altiok, H.; Smith, P.A.; Harris, G.F.; Krzak, J.J. Segmental foot and an-kle kinematic differences between rectus, planus, and cavus foot types. J. Biomech. 2019, 94, 180–186. [Google Scholar] [CrossRef]
- Cen, X.; Xu, D.; Baker, J.S.; Gu, Y. Effect of additional body weight on arch index and dynamic plantar pressure distribution during walking and gait termination. PeerJ 2020, 8, e8998. [Google Scholar] [CrossRef] [PubMed]
- Sparrow, W.A.; Tirosh, O. Gait termination: A review of experimental methods and the effects of ageing and gait patholo-gies. Gait Posture 2005, 22, 362–371. [Google Scholar] [CrossRef] [PubMed]
- Bishop, M.D.; Brunt, D.; Pathare, N.; Patel, B. The interaction between leading and trailing limbs during stopping in hu-mans. Neurosci. Lett. 2002, 323, 1–4. [Google Scholar] [CrossRef]
- Jaeger, R.; Vanitchatchavan, P. Ground reaction forces during termination of human gait. J. Biomech. 1992, 25, 1233–1236. [Google Scholar] [CrossRef]
- Chuckpaiwong, B.; Nunley, J.A.; Mall, N.A.; Queen, R.M. The effect of foot type on in-shoe plantar pressure during walking and running. Gait Posture 2008, 28, 405–411. [Google Scholar] [CrossRef]
- Williams, D.S., III; McClay, I.S.; Hamill, J. Arch structure and injury patterns in runners. Clin. Biomech. 2001, 16, 341–347. [Google Scholar] [CrossRef]
- Zhao, X.; Tsujimoto, T.; Kim, B.; Katayama, Y.; Tanaka, K. Association of Foot Structure with the Strength of Muscles that Move the Ankle and Physical Performance. J. Foot Ankle Surg. 2018, 57, 1143–1147. [Google Scholar] [CrossRef]
- Zifchock, R.A.; Davis, I.; Hillstrom, H.; Song, J. The effect of gender, age, and lateral dominance on arch height and arch stiffness. Foot Ankle Int. 2006, 27, 367–372. [Google Scholar] [CrossRef]
- Zifchock, R.; Parker, R.; Wan, W.; Neary, M.; Song, J.; Hillstrom, H. The relationship between foot arch flexibility and medi-al-lateral ground reaction force distribution. Gait Posture 2019, 69, 46–49. [Google Scholar] [CrossRef] [PubMed]
- Dawe, E.J.C.; Davis, J. (vi) Anatomy and biomechanics of the foot and ankle. Orthop. Trauma 2011, 25, 279–286. [Google Scholar] [CrossRef]
- Sarrafian, S.K. Functional characteristics of the foot and plantar aponeurosis under tibiotalar loading. Foot Ankle 1987, 8, 4–18. [Google Scholar] [CrossRef]
- Sun, P.C.; Shih, S.L.; Chen, Y.L.; Hsu, Y.C.; Yang, R.C.; Chen, C.S. Biomechanical analysis of foot with different foot arch heights: A finite element analysis. Comput. Methods Biomech. Biomed. Eng. 2012, 15, 563–569. [Google Scholar] [CrossRef]
- Fernández-Seguín, L.M.; Diaz Mancha, J.A.; Sánchez Rodríguez, R.; Escamilla Martínez, E.; Gómez Martín, B.; Ramos Ortega, J. Comparison of plantar pressures and contact area between normal and cavus foot. Gait Posture 2014, 39, 789–792. [Google Scholar] [CrossRef] [PubMed]
- Wu, G.; Cavanagh, P.R. ISB recommendations for standardization in the reporting of kinematic data. J. Biomech. 1995, 28, 1257–1261. [Google Scholar] [CrossRef]
- Zhu, Z.; Fu, W.; Shao, E.; Li, L.; Song, L.; Wang, W.; Liu, Y. Acute Effects of Midsole Bending Stiffness on Lower Extremity Biomechanics during Layup Jumps. Appl. Sci. 2020, 10, 397. [Google Scholar] [CrossRef]
- Roy, J.P.; Stefanyshyn, D.J. Shoe midsole longitudinal bending stiffness and running economy, joint energy, and EMG. Med. Sci. Sports Exerc. 2006, 38, 562–569. [Google Scholar] [CrossRef]
- Bishop, M.; Brunt, D.; Pathare, N.; Patel, B. The effect of velocity on the strategies used during gait termination. Gait Posture 2004, 20, 134–139. [Google Scholar] [CrossRef]
- Ridge, S.T.; Henley, J.; Manal, K.; Miller, F.; Richards, J.G. Biomechanical analysis of gait termination in 11–17year old youth at preferred and fast walking speeds. Hum. Mov. Sci. 2016, 49, 178–185. [Google Scholar] [CrossRef] [PubMed]
- Yu, P.; Gong, Z.; Meng, Y.; Baker, J.S.; István, B.; Gu, Y. The Acute Influence of Running-Induced Fatigue on the Performance and Biomechanics of a Countermovement Jump. Appl. Sci. 2020, 10, 4319. [Google Scholar] [CrossRef]
- Serrao, M.; Conte, C.; Casali, C.; Ranavolo, A.; Mari, S.; Di Fabio, R.; Perrotta, A.; Coppola, G.; Padua, L.; Monamì, S.; et al. Sudden Stopping in Patients with Cerebellar Ataxia. Cerebellum 2013, 12, 607–616. [Google Scholar] [CrossRef] [PubMed]
- Ridge, S.T.; Henley, J.; Manal, K.; Miller, F.; Richards, J.G. Kinematic and kinetic analysis of planned and unplanned gait termination in children. Gait Posture 2013, 37, 178–182. [Google Scholar] [CrossRef][Green Version]
- Cen, X.; Jiang, X.; Gu, Y. Do different muscle strength levels affect stability during unplanned gait termination? Acta Bioeng. Biomech. 2019, 21, 27–35. [Google Scholar] [CrossRef]
- Zhang, Y.; Baker, J.S.; Ren, X.; Feng, N.; Gu, Y. Metatarsal strapping tightness effect to vertical jump performance. Hum. Mov. Sci. 2015, 41, 255–264. [Google Scholar] [CrossRef] [PubMed][Green Version]
- Mootanah, R.; Song, J.; Lenhoff, M.W.; Hafer, J.F.; Backus, S.I.; Gagnon, D.; Deland, J.T.; Hillstrom, H.J. Foot Type Biome-chanics Part 2: Are structure and anthropometrics related to function? Gait Posture 2013, 37, 452–456. [Google Scholar] [CrossRef] [PubMed]
- Hotfiel, T.; Carl, H.D.; Wendler, F.; Jendrissek, A.; Heiß, R.; Swoboda, B. Plantar pressures increase with raising body weight: A standardised approach with paired sample using neutral shoes. J. Back Musculoskelet. Rehabil. 2017, 30, 583–589. [Google Scholar] [CrossRef]
- Williams, D.S.; McClay, I.S.; Hamill, J.; Buchanan, T.S. Lower extremity kinematic and kinetic differences in runners with high and low arches. J. Appl. Biomech. 2001, 17, 153–163. [Google Scholar] [CrossRef]
- Gravante, G.; Pomara, F.; Russo, G.; Amato, G.; Cappello, F.; Ridola, C. Plantar pressure distribution analysis in normal weight young women and men with normal and claw feet: A cross-sectional study. Clin. Anat. 2005, 18, 245–250. [Google Scholar] [CrossRef] [PubMed]
- Zhang, B.; Lu, Q. A Current Review of Foot Disorder and Plantar Pressure Alternation in the Elderly. Phys. Act. Health 2020, 4, 95–106. [Google Scholar] [CrossRef]
- Zhao, X.; Gu, Y.; Yu, J.; Ma, Y.; Zhou, Z. The Influence of Gender, Age, and Body Mass Index on Arch Height and Arch Stiff-ness. J. Foot Ankle Surg. 2020, 59, 298–302. [Google Scholar] [CrossRef] [PubMed]
- Tirosh, O.; Sparrow, W.A. Age and walking speed effects on muscle recruitment in gait termination. Gait Posture 2005, 21, 279–288. [Google Scholar] [CrossRef]
- Gu, Y.; Zhang, Y.; Shen, W. Lower extremities kinematics variety of young women jogging with different heel height. IJBET 2013, 12, 240–251. [Google Scholar] [CrossRef]
Publisher’s Note: MDPI stays neutral with regard to jurisdictional claims in published maps and institutional affiliations. |
© 2021 by the authors. Licensee MDPI, Basel, Switzerland. This article is an open access article distributed under the terms and conditions of the Creative Commons Attribution (CC BY) license (http://creativecommons.org/licenses/by/4.0/).