Abstract
This study investigated the correlation between bone characteristics, the design of orthodontic mini-implants, the pull-out force, and primary stability. This experimental in vitro study has examined commercial orthodontic mini-implants of different sizes and designs, produced by two manufacturers: Tomas-pin SD (Dentaurum, Ispringen, Germany) and Perfect Anchor (Hubit, Seoul, Korea). The total number of 40 mini-implants were tested. There are two properties that are common to all tested implants—one is the material of which they are made (titanium alloy Ti-6Al-4V), and the other is the method of their insertion. The main difference between the mini-implants, which is why they have been selected as the subject of research in the first place, is reflected in their geometry or design. Regardless of the type of implant, the average pull-out forces were found to be higher for a cortical bone thickness (CBTC) of 0.62–0.67 mm on average, compared to the CBTC < 0.62 mm, where the measured force averages were found to be lower. The analysis of variance tested the impact of the mini-implant geometry on the pull-out force and proved that there is a statistically significant impact (p < 0.015) of all three analyzed geometric factors on the pull-out force of the implant. The design of the mini-implant affects its primary stability. The design of the mini-implant affects the pulling force. The bone quality at the implant insertion point is important for primary stability; thus, the increase in the cortical bone thickness increases the value of the pulling force significantly.
1. Introduction
The introduction of mini-implants into orthodontics stands out as one of the most significant changes in clinical work [1]. On the market, many types of implants are available, having similar characteristics, made of an alloy titanium and vanadium or aluminium. Most common is the mini-screw system. From a clinical point of view, the screw consists of three parts: the head, which can have a different shape; the transgingival part; and the threaded body, which is mainly in form of a cylinder, cone, or a combination of the two. These implants provide the clinical practitioners with solid control of 3D tooth displacement [2], which is why their application is ever-increasing. In the current practice of using mini-implants, the preference is given to a smaller diameter and lower profile of the head for better hygiene and greater comfort for the patient. In essence, these are self-tapping bone screws with a diameter of 1.5–2.5 mm and a length of 6–10 mm, with different lengths of the transmucosal neck (1.5–2.5 mm) which compensate for the thickness of the mucosa. The head can have classic twist slots, cross-placed slots 0.021 × 0.025, or a ball. A chain or loop of a Ni–Ti tension spring is applied to the ball, and a wire is applied to the slot.
Stability of orthodontic mini-implants is generally defined by two major components [3]: primary stability achieved by mechanical bonding between the bone and the mini-implants; and secondary stability achieved through continuous bone remodeling around the implant, thus leading to osseointegration [4].
Primary stability of a mini-implant depends on a number of factors, primarily including the place where the implant itself is inserted, its proximity to the root, geometric design of the mini-implant, soft tissue condition, operating techniques, and the strength and the duration of the applied orthodontic forces. Friberg et al. [5] were among the pioneers who dealt with this specific group of parameters. Many authors after them have also used these parameters to describe the factor of primary stability [6,7,8]. The length of the mini-implant is determined by cortical bone thickness (CBTC) and quality, implant insertion angle, thickness of transmucosal tissues, and by properties of other surrounding anatomical structures [9,10]. Experimental studies performed on a synthetic bone show that the geometrical design characteristics of mini-implants, featured through the so-called thread shape factor (TSF), play a key role in maintaining primary stability [11,12].
Once the implant is inserted into the bone, a number of specific corresponding measurement methods are used in order to evaluate its primary stability. These methods distinguish between non-invasive clinical tests (insertion torque, radiography, periotest, etc.) and invasive research methods (pull-out test and removal torque testing) [13].
Many in vitro studies have used wood, polyvinyl chloride, and pig bone as the test sample materials [13,14,15]. The thickness of the pig bone cortex is similar to the thickness of the human maxillary and mandibular cortexes [16]. The specific purpose of this study was to identify the correlation between the bone properties, the geometrical design of commercial orthodontic mini-implants, pull-out forces, and primary stability.
2. Materials and Methods
This experimental in vitro study examined three types of orthodontic mini-implants of different sizes and designs, produced by two manufacturers: Tomas-pin SD (Dentaurum, Ispringen, Germany) and Perfect Anchor (Hubit, Seoul, Korea). A total number of 40 mini-implants were tested (20 Tomas-pin mini-implants with a thread diameter of 1.6 mm and a thread length of 6 mm, and 20 Perfect Anchor mini-implants, of which 10 had a thread diameter of 1.4 mm and thread length of 8 mm, while 10 had a thread diameter of 1.6 mm and a thread length of 8 mm, according to the manufacturers’ specifications).
There are two properties that are common to all tested implants—one is the material of which they are made (titanium alloy Ti-6Al-4V) and the other is the method of their insertion. The main difference between the mini-implants, which is why they have been selected as the subject of research in the first place, is reflected in their geometry or design. The implants differed in terms of length, diameter, body shape, head shape, and thread properties (Figure 1).
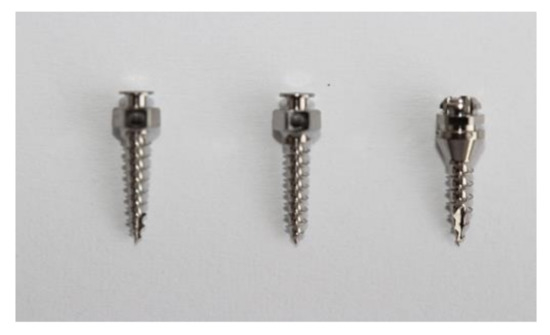
Figure 1.
Mini-implants (right-to-left: Perfect Anchor 1.4 × 8 mm, 1.6 × 8 mm, and Tomas-pin 1.6 × 6 mm, respectively).
Fresh pork ribs were used as the test model in this experiment. The total number of ribs corresponded to the total number of implants tested.
The process of preparing the ribs included their scaling and cleaning by way of complete removal of soft tissues mechanically. The ribs were neither cut nor treated with any chemical agents, all with the aim of preserving the original bone structure, which would not be altered in any way.
The study included four stages: (i) mini-implant geometry analysis; (ii) bone scanning; (iii) implant insertion; and (iv) pull-out test.
The geometrical design analysis of orthodontic mini-implants included a series of measurement that covered the following parameters: thread length, pitch, thread bearing depth, multi-point thread diameters, and multi-point screw diameters based on which the degree of taper has been determined on the threaded section.
Measurements of these parameters were performed with a Zeiss-ZKM 01-250 C universal two-coordinate measuring microscope (Figure 2).
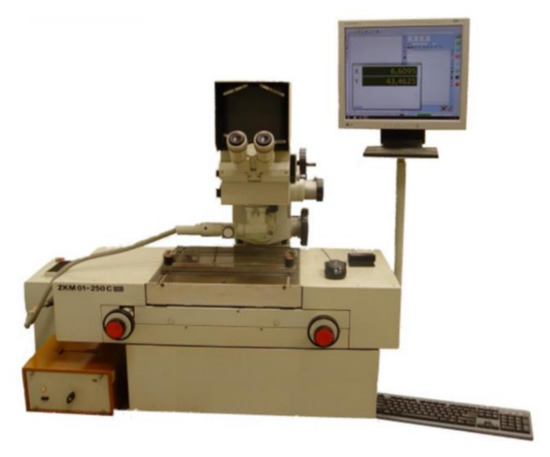
Figure 2.
Zeiss measuring microscope—ZKM 01-250 C.
On the basis of the identified dimensions of the above parameters, the so-called thread shape factor (TSF) and the degree of thread taper were established (Figure 3 and Table 1).

Figure 3.
Geometric parameters of the mini-implant threading: Perfect Anchor (a); Tomas-pin (b).

Table 1.
Values of geometric parameters of mini-implants established by measurement.
Cortical bone thickness (CBTC) measurements were performed at the mini-implant insertion point by using Cone-Beam computed tomography.
Images of the prepared samples were taken by facescan on a GALILEOS Comfort plus device (Sirona Dental System GmbH Fabrikstrage 31 D-64625 Behshein, Germany) (Figure 4a). The frame exposure parameters used were 98 kV and 10 mAs, exposure field 15 × 15 cm, exposure time 12 s.
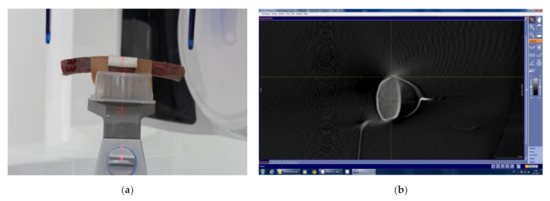
Figure 4.
Sample positioned for scanning, implant insertion point placed at the center of the region of interest (a); measurements of pork rib cortical bone thickness (CBTC) by Galileos Implant Program (GALILEOS Implant Viewer) (b).
CBTC measurements were performed by using the GALILEOS Implant Viewer, which allows different measurements of anatomical structures (bone density, length, and width of anatomical structures, etc.). Measurements of the pig rib CBTC were taken in a sagittal cross-section, at an angle of 90° to the wire (Figure 4b).
This test was performed on a pig rib bone, with the aim of determining the load-bearing capacity of the bone–implant interface or the value of force that would result in extraction of the implant from the bone–implant interface.
Prior to performing an experimental analysis of the mini-implant primary stability, it was necessary to prepare the sample adequately. Once the bone scan was completed, the bone was placed on a steel attachment pad designed for the purpose of this experiment. The attachment pad was designed in such a way so as to transfer the pull-out force from the clamp to the implant as directly as possible.
The lower part of the profile contained four openings, designed for four connecting screws through which the rib was fixed to the lower part of the profile by its lower, non-operating surface. Once the bone was fixed to the lower part of the steel profile, the mini-implant insertion was initiated. The upper part of the attachment pad was positioned on the operating surface section of the pig rib bone, and then the orthodontic mini-implant was inserted into the bone through the attachment pad opening, into a previously marked spot in the middle part of the bone. The mini-implant was manually placed at an angle of 90°, by using an instrument designed for such purposes, as instructed in the user manual supplied by the manufacturer (Figure 5a).
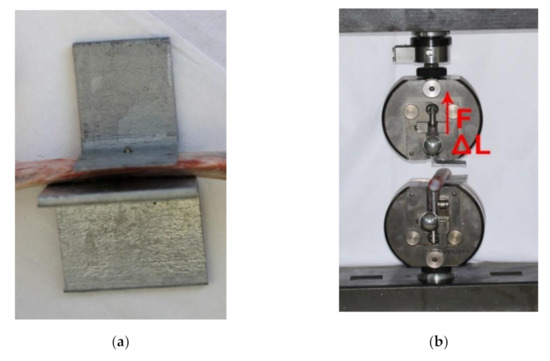
Figure 5.
Sample prepared to perform the pull-out testing (a). Direction of force (F) and displacement (ΔL) at implant–bone interface (b).
To carry out the experimental pull-out testing trials, we used a universal material testing machine [17,18] (Zwick GmbH & Co., Ulm, Germany model 143501 together with an HBM U2A force transducer), including the attachment pads used during the testing (Figure 5b).
3. Results
Statistical data processing was performed by using the IBM SPSS Statistics V21 software. Normality of the frequency distribution was tested by using the Kolmogorov–Smirnov and the Shapiro–Wilk tests, while the homogeneity of sample variances was tested by the Levene test. Subsequent (post-hoc) comparisons of the samples were made by using the Scheffe test.
Table 2 and Figure 6 show the descriptive statistical values of the pulling forces (F) applied in order to pull out the mini-implants for each sub-sample in the course of expe- rimental procedure.

Table 2.
Descriptive statistical values of the pulling force by implant type and cortical thickness.
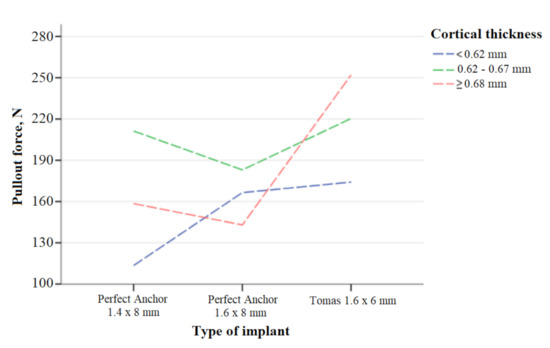
Figure 6.
Statistical values of the pulling force by implant type and cortical thickness.
Table 3 and Table 4 show the results of comparisons made between the samples by using the Scheffe test.

Table 3.
Multiple post-hoc comparisons (Scheffe test)—type of implant.

Table 4.
Multiple post-hoc comparisons (Scheffe test)—cortical thickness.
Table 5 shows the average values of the standard deviation of depth, pitch, and TSF by type of mini-implant, while Table 6 presents the results of the variance analysis for the TSF shape factor, depth, and pitch.

Table 5.
Depth, pitch and TSF average values and standard deviations by type of mini-implant.

Table 6.
Results of the variance analysis for the TSF shape factor, depth, and pitch.
4. Discussion
This study was focused on the impact of bone quality and the impact of mini-implant design (its length, diameter, and threading) on primary stability.
The highest average pull-out force (FMean = 252.12 N) was found in a Tomas-pin mini-implant with a 1.6 mm-diameter and 6 mm-length at CBTC ≥0.68 mm, while the lowest average pullout force (FMean = 113.50 N) was found in a Perfect Anchor mini-implant with a 1.4 mm-diameter and 8 mm-length at CBTC <0.62 mm.
Regardless of the type of implant, the average pullout forces were found to be higher for the CBTC between 0.62–0.67 mm on average, compared to the CBTC <0.62 mm, where the measured force averages were found to be lower. A number of other studies also lead to similar conclusions; namely, the success of a mini-implant depends largely on the cortical bone thickness (CBTC) [19,20].
Experiments performed on animals have shown that a mini-implant’s stability is determined by the quality and quantity of the bone into which the implant is inserted [9,16].
A visual observation made in our study showed that slightly larger differences occurred in averages at the same CBTC with the Perfect Anchor 1.4 mm × 8 mm implant. It could be said that the higher pulling force is more inherent to the thicker cortex, and vice versa. However, in cases where the CBTC is ≥0.68 mm, such regularity (the greater the CBTC, the higher the pulling force) was inherent only to the Tomas-pin 1.6 mm × 6 mm implant, while the Perfect Anchor 1.6 mm × 8 mm and 1.4 mm × 8 mm implants showed no such noticeable regularity. The Perfect Anchor 1.6 mm × 8 mm implant had a lower average value at CBTC ≥0.68 mm compared to CBTC 0.62–0.67 mm and CBTC <0.62 mm, while the Perfect Anchor 1.4 mm × 8 mm implant had a higher average value of the pullout force at CBTC ≥0.68 mm compared to CBTC <0.62 mm, although as a result it had a lower pullout force compared to the CBTC 0.62–0.67 mm.
An analysis of the standard deviation values associated with the pullout forces of the three types of mini-implants at different CBTC values (Table 2) showed that variations of the pullout forces were more often present at CBTC ≥0.68 mm compared to other CBTC values, regardless of the type of mini-implant.
Table 3 shows the post-hoc results of the Scheffe test of later comparisons made between the types of mini-implants. A statistically significant difference in the average values of the pullout force was confirmed between the Perfect Anchor 1.4 mm × 8 mm implant and the Tomas-pin 1.6 mm × 6 mm implant (p < 0.020), and between the Perfect Anchor 1.6 mm × 8 mm implant and the Tomas-pin 1.6 mm × 6 mm implant (p < 0.028), whereas the difference was not found to be statistically significant between the Perfect Anchor 1.4 mm × 8 mm implant and the Perfect Anchor 1.6 mm × 8 mm implant (p < 0.991).
We can see from Table 4 that the existence of a statistically significant difference of the average values of the pullout force was confirmed between the CBTC <0.62 mm and the CBTC 0.62–0.67 mm (p < 0.029), and between the CBTC <0.62 mm and the CBTC ≥0.68 mm (p < 0.014), whereas no statistically significant difference was confirmed between the CBTC samples ≥0.68 mm and the CBTC samples 0.62–0.67 mm (p < 0.972).
In our research, we have paid special attention to the design of the mini-implants tested. Through a great number of studies, various authors have examined the effects that the length of mini-implants can have on their long-term stability. Some authors have found that their stability is greater the deeper the implant is inserted into the bone, which at the same time requires the use of longer implants, but on the other hand these authors also indicate that the greater length requires a higher insertion torque, which can result in the occurrence of micro-cracks in the bone, which will eventually result in implant fall-out or failure [1,16]. On the other hand, some studies [21,22] indicate that the length of implants is not of relevance for their stability. Additionally, in one study [20] a group of authors compared mechanical stability and clinical applications between two different mini-implant designs—a newly invented design of orthodontic mini-implants (3 mm diameter and 2 mm length) and a commercially available design of mini-implants (1.5 mm diameter and 6 mm length), where they found that primary stability of the newly invented design of implants was considerably greater compared to the one found in the commercially available design of mini-implants.
The use of the newly invented implant design, due to their small length, was supported by the fact that the vast majority of studies have shown that primary stability depends not so much on the length of the implant, but depends more on the surface to which the implant is applied, and on the implant–bone interface itself, which is in turn largely influenced by the implant design.
The implant design includes the following features: body shape (cylindrical, or tapered), individual implant lengths and diameters, thread depths, thread and taper angles, and thread pitch (Table 1).
Prior to comparing the differences detected in the geometry of the tested implants (tapers k, pitch p, and inner diameters d1), it is important to mention that we have come across a rather unexpected piece of information specified in the user manual supplied by the manufacturer. Specifically, after analyzing the geometry of the Korean implants (Perfect Anchor), we found that the length and diameter of the implants do not match the information presented in the user manual supplied by the manufacturer. Instead of the specified 8 mm, the length of the threaded section of the Korean screw was actually 7.7 mm. Additionally, the diameter of all Korean screws was 1.6 mm, although the diameter of ten of them was supposed be 1.4 mm, as it was specified on the original product packaging. This information explains the fact that no significant statistical differences were observed in terms of the pull-out test results in the group of the Korean implants. As far as the Dentaurum Tomas-pin implants were concerned, the length and diameter corresponded to the information presented in the user manual supplied by the manufacturer.
A comparative analysis of the thread profile bearing depth and thread pitch of the mini-implants showed an observable difference between all three types of implants. For a better understanding of this relationship and its impact on primary stability, the so-called thread shape factor (TSF) plays an important role used for evaluation of the load-bearing capacity of the implant–bone interface [12]. Simply put, TSF represents the ratio between the mean thread bearing depth and the pitch. An analysis of the values presented in Table 5 showed that the highest TSF ratio is associated with the Perfect Anchor 1.4 mm × 8 mm mini-implant (TSF = 0.380), which is followed by the Perfect Anchor 1.6 mm × 8 mm implant (TSF = 0.340), while the lowest TSF ratio is associated with the Tomas-pin 1.6 mm × 6 mm implant (TSF = 0.270).
The analysis of variance was used to test the impact of the mini-implant geometry on the pullout force, and proved that there was a statistically significant impact (p < 0.015) of all three analyzed geometric factors on the pullout force of the implant, which is presented in Table 6.
Our study shows that the implant with the highest average pitch value was found to have the highest average pullout force (Tomas-pin 1.6 mm × 6 mm), while the implant with the lowest average pitch value (Perfect Anchor 1.4 mm × 8 mm) was found to have the lowest average pullout force.
Reducing the diameter of the mini-implant increases the likelihood of it loosening and cracking, and ultimately increases the risk of it falling out [23,24]. Studies [25,26,27,28,29] have also indicated that in addition to the mini-implant design, its primary stability also depends on the bone quality and quantity at the point of its insertion.
The tests conducted show that there is a significant influence of the thread core diameter and the thread core taper on the stability of the implant with the same nominal diameter (1.6 mm). Thus, a Tomas-pin with larger core diameters and a larger half angle of thread taper showed the higher values pullout forces in the pull-out test compared to the Perfect Anchor, although it had a shorter threaded section.
This conclusion can be brought into connection with research undertaken as part of a study [20] performed on shorter but thicker screws compared with the screws of standard dimensions, which ultimately showed the advantage of non-standard (shorter and thicker) screws.
After completing our study, we have moved a few steps closer to the view taken by a group of authors in their research [16], who indicated that the design of a mini-implant, i.e., its diameter and geometry, have a much greater impact on primary stability than the length itself.
5. Conclusions
- -
- The design of a mini-implant affects its primary stability.
- -
- The design of a mini-implant affects the pulling force.
- -
- The bone quality at the implant insertion point is important for primary stability; thus, the increase in the cortical bone thickness increases the value of the pulling force significantly.
Author Contributions
Conceptualization, L.R.-V. and E.M.; methodology, L.R.-V.; investigation, E.M. and M.G.; data curation, L.R.-V., E.M. and N.P.; software, V.H. and M.D.; visualization, N.P., V.H. and M.D.; writing—original draft preparation, L.R.-V.; writing—review and editing, E.M. and N.P. All authors have read and agreed to the published version of the manuscript.
Funding
This research received no external funding.
Institutional Review Board Statement
Ethical review and approval were waived for this study, because there was no animal sacrifice. Animal bones (pig ribs) from the food industry were used.
Informed Consent Statement
Not applicable.
Data Availability Statement
The data underlying this study will be available on reasonable request to the corresponding author.
Acknowledgments
We wish to express our gratitude to the Faculty of Dentistry with Clinics and the Faculty of Mechanical Engineering of the University of Sarajevo for providing laboratory measuring equipment and assistance in the implementation of the research.
Conflicts of Interest
The authors declare no conflict of interest.
References
- Petrey, J.S.; Saunders, M.M.; Kluemper, G.T.; Cunningham, L.L.; Beeman, C.S. Temporary anchorage device insertion variables: Effects on retention. Angle Orthod. 2010, 80, 634–641. [Google Scholar] [CrossRef] [PubMed]
- Kyung, H.M.; Park, H.S.; Bae, S.M.; Sung, J.; Kim, I.B. Development of orthodontic miniscrew implants for intraoral anchorage. J. Clin. Orthod. 2003, 6, 321–329. [Google Scholar]
- Paik, C.H.; Park, I.K.; Woo, Y.; Kim, T.W. Orthodontic Miniscrew Implants; Mosby: New York, NY, USA, 2009. [Google Scholar]
- Hong, C.; Truong, P.; Song, H.N.; Wu, B.M.; Moon, W. Mechanical stability assessment of novel orthodontic mini-implant designs: Part 2. Angle Orthod. 2011, 81, 1001–1009. [Google Scholar] [CrossRef] [PubMed]
- Friberg, B.; Sennerby, L.; Roos, J.; Lekholm, U. Identification of bone quality in conjunction with insertion of titanium implants. A pilot study in jaw autopsy specimens. Clin. Oral Implant. Res. 1995, 6, 213–219. [Google Scholar] [CrossRef]
- Erverdi, N.; Acar, A. Zygomatic anchorage for en masse retraction in the treatment of severe Class II division 1. Angle Orthod. 2005, 75, 483–490. [Google Scholar]
- Motoyoshi, M.; Hirabayashi, M.; Uemura, M.; Shimizu, N. Recommended placement torque when tightening an orthodontic mini-implant. Clin. Oral Implant. Res. 2006, 17, 109–114. [Google Scholar] [CrossRef]
- Lim, S. Insertion torque of orthodontic miniscrews according to changes in shape, diameter and length. Angle Orthod. 2008, 78, 234–240. [Google Scholar] [CrossRef]
- Reynders, R.; Ronchi, L.; Bipat, S. Mini-Implants in orthodontics: A systematic review of the literature. Am. J. Orthod. Dentofac. Orthop. 2009, 135, 564.e1–564.e19. [Google Scholar] [CrossRef]
- Melsen, B. Mini-Implants: Where are we? J. Clin. Orthod. 2005, 39, 539–547. [Google Scholar]
- Chapman, J.R.; Harrington, R.M.; Lee, K.M.; Anderson, P.A.; Tencer, A.F.; Kowalski, D. Factors affecting the pullout strength of cancellous bone screws. J. Biomech. Eng. 1996, 118, 391–398. [Google Scholar] [CrossRef]
- Migliorati, M.; Signori, A.; Silvestrini-Biavati, A. Temporary anchorage device stability: An evaluation of thread shape factor. Eur. J. Orthod. 2012, 34, 582–586. [Google Scholar] [CrossRef] [PubMed]
- Chen, Y.; Kyung, H.M.; Gao, L.; Yu, W.-J.; Bae, E.-J.; Kim, S.-M. Mechanical properties of selfdrilling orthodontic micro-implants with different diameters. Angle Orthod. 2010, 80, 821–827. [Google Scholar] [CrossRef] [PubMed]
- Heidemann, W.; Gerlach, K.L.; Grőbel, K.H.; Koőllner, H.G. Drill free screws: A new form of osteosynthesis screw. J. Cranio Maxillofac. Surg. 1998, 26, 163–168. [Google Scholar] [CrossRef]
- Meredith, N.; Shagaldi, F.; Alleyne, D.; Sennerby, L.; Cawley, P. The application of resonance frequency measurements to study the stability of titanium implants during healing in the rabbit tibia. Clin. Oral Implant. Res. 1997, 8, 234–243. [Google Scholar] [CrossRef]
- Wilmes, B.; Ottenstreuer, S.; Su, Y.Y.; Drescher, D. Impact of implant design on primary stability of orthodontic mini-implants. J. Orofac. Orthop. 2008, 69, 42–50. [Google Scholar] [CrossRef]
- Mešić, E.; Avdić, V.; Pervan, N.; Repčić, N. Finite element analysis and experimental testing of stiffness of the Sarafix external fixator. Procedia Eng. 2015, 100, 1598–1607. [Google Scholar]
- Mešić, E.; Avdić, V.; Pervan, N. Numerical and experimental stress analysis of an external fixation system. Folia Med. Fac. Med. Univ. Saraev. 2015, 50, 74–80. [Google Scholar]
- Park, H.S.; Lee, Y.J.; Jeong, S.J.; Kwon, T.G. Density of alveolar and basal bones of the maxilla and the mandible. Am. J. Orthod. Dentofac. Orthop. 2008, 133, 30–37. [Google Scholar] [CrossRef]
- Song, H.N.; Hong, C.; Banh, R.; Ohebsion, T.; Asatrian, G.; Leung, H.Y.; Wu, B.M.; Moon, W. Mechanical stability and clinical applicability assessment of novel orthodontic miniimplant design. Angle Orthod. 2013, 83, 832–841. [Google Scholar] [CrossRef]
- Antoszewska, J.; Papadopoulos, M.A.; Park, H.-S.; Ludwig, B. Five-Year experience with orthodontic miniscrew implants: A retrospective investigation of factors influencing success rates. Am. J. Orthod. Dentofac. Orthop. 2009, 136, 158.e1–158.e10. [Google Scholar] [CrossRef]
- Papageorgiou, S.N.; Zogakis, I.P.; Papadopoulos, M.A. Failure rates and associated risk factors of orthodontic miniscrew implants: A meta-analysis. Am. J. Orthod. Dentofac. Orthop. 2012, 142, 577–595. [Google Scholar] [CrossRef] [PubMed]
- Yano, S.; Motoyoshi, M.; Uemura, M.; Ono, A.; Shimizu, N. Tapered orthodontic miniscrews induce bone-screw cohesion following immediate loading. Eur. J. Orthod. 2006, 28, 541–546. [Google Scholar] [CrossRef] [PubMed][Green Version]
- Song, Y.Y.; Cha, J.Y.; Hwang, C.J. Mechanical characteristics of various orthodontic miniscrews in relation to artificial cortical bone thickness. Angle Orthod. 2007, 77, 979–985. [Google Scholar] [CrossRef] [PubMed]
- Walter, A.; Winsauer, H.; Marcé-Nogué, J.; Mojal, S.; Puigdollers, A. Design characteristics, primary stability and risk of fracture of orthodontic mini-implants: Pilot scan electron microscope and mechanical studies. Med. Oral Patol. Oral Cir. Bucal 2013, 18, e804–e810. [Google Scholar] [CrossRef] [PubMed]
- Motoyoshi, M.; Uemura, M.; Ono, A.; Okazaki, K.; Shigeeda, T.; Shimizu, N. Factors affecting the long-term stability of orthodontic mini-implants. Am. J. Orthod. Dentofac. Orthop. 2010, 137, 588.e1–588.e5. [Google Scholar] [CrossRef]
- Noyama, Y.; Nakano, T.; Ishimoto, T.; Sakai, T.; Yoshikawa, H. Design and optimization of the oriented groove on the hip implant surface to promote bone microstructure integrity. Bone 2013, 52, 659–667. [Google Scholar] [CrossRef]
- Matsugaki, A.; Aramoto, G.; Ninomiya, T.; Sawada, H.; Hata, S.; Nakano, T. Abnormal arrangement of a collagen/apatite extracellular matrix orthogonal to osteoblast alignment is constructed by a nanoscale periodic surface structure. Biomaterials 2015, 37, 134–143. [Google Scholar] [CrossRef]
- Nakanishi, Y.; Matsugaki, A.; Kawahara, K.; Ninomiya, T.; Sawada, H.; Nakano, T. Unique arrangement of bone matrix orthogonal to osteoblast alignment controlled by Tspan11-mediated focal adhesion assembly. Biomaterials 2019, 209, 103–110. [Google Scholar] [CrossRef]
Publisher’s Note: MDPI stays neutral with regard to jurisdictional claims in published maps and institutional affiliations. |
© 2021 by the authors. Licensee MDPI, Basel, Switzerland. This article is an open access article distributed under the terms and conditions of the Creative Commons Attribution (CC BY) license (http://creativecommons.org/licenses/by/4.0/).