Abstract
Rebars corrosion phenomena can modify the structural behaviour of reinforced concrete (RC) members and consequently the seismic performance of RC structures. Since many existing RC structures are affected by this phenomenon, the influence of the reinforcement corrosion on the seismic performance is still under examination, especially when the corrosive attack is localized in the dissipative areas of the plastic hinges. In this work, the effect of localized corrosion is numerically investigated, through the adoption of a suitable finite element model, object of validation with the outcomes of an experimental campaign carried out in the Laboratory of the University of Rome “Tor Vergata”, on un-corroded and corroded RC columns subjected to axial load and cyclic horizontal actions. Particular attention has been paid to the definition of the three-dimensional model and to the modelling of the corroded rebars and their corrosion morphology. Indeed, different modelling strategies are proposed with the aim to properly simulate the cyclic behaviour of the corroded columns. The main results show how more refined strategies taking into account the morphological aspects of the corrosion phenomenon produce a better fit with the experimental results for both Damage Control and Life Safety limit states performance.
1. Introduction
Reinforced concrete (RC) columns play a fundamental role on the seismic performance of the concrete structure, as they represent its main force-transmitting element. One of the major degradation causes of RC structures consists in the steel reinforcement corrosion, as witnessed by recent cases worldwide, especially when the corrosive attack is localized in the dissipative areas of the plastic hinge and pitting phenomena occur. Steel bars in concrete are naturally exposed to a high pH environment, which allows the formation of a protective passivating film. As a consequence of a decrease of the pH value or of a high concentration of chloride ions, this protective film can undergo to a disruption, causing the trigger of the corrosion process of the steel reinforcement. In presence of localized concentrations of chlorides, pitting corrosion of the steel bars occur, with a localized reduction of the bar section through pits, affecting its internal layers. These phenomena represent a cause of concern for several RC buildings, particularly when low strength concrete is used. Besides the obvious reduction of the resistant section, a reinforcement ductility reduction can take place [1,2]. The formation of expansive corrosion products induces concrete cracking and high stresses, affecting the bond behaviour between concrete and steel bars [3,4,5,6].
These phenomena can cause severe damages leading to structural unexpected crisis and to failure mechanisms of corroded structures very different from the ones of new or sound constructions.
Therefore, it is fundamental to examine the effect of the corrosion damage, for a proper assessment of the seismic capacity of RC columns. Since several RC structures have nowadays an age close to, or higher than, their design life, this aspect is becoming a worthy issue, with the need to be clearly underlined and codified, starting from the analysis of actual structural cases, experimental and theoretical research [7,8,9,10,11,12,13].
The interest in the evaluation of the influence of corrosion on the cyclic behaviour of RC column is witnessed by the many experimental studies available in literature, carried out for example on columns characterized by square [14,15,16,17,18] and circular [19] cross sections, and RC moment-resisting frame [20]. In general, the experimental studies show a reduction in ductility and load-bearing capacity of RC columns, with increasing corrosion of the steel rebars.
Consequently, in recent years, several modelling approaches for the numerical assessment of the cyclic behaviour of RC columns subjected to corrosion of steel reinforcement have been proposed, in order to progressively investigate the numerous involved parameters. In [21] fiber-based models carried out with Opensees are used to numerically predict the cyclic behaviour of RC hollow bridge piers with corroded rebars, showing a reduction of strength, secant stiffness and energy loss due to corrosion. In [22] a multi-layered shell Finite Element (FE) model based on the fixed crack approach is used to consider the corrosion effects on RC elements subjected to cyclic loadings, in order to calibrate correction coefficient for the ultimate rotational capacity prediction, also in presence of buckling. In [23] some of the authors proposed a three-dimensional (3D) FE model accounting for steel corrosion and interface decay, highlighting the onset of peculiar mechanism related to the buckling of the corroded rebars. A 3D non-linear FE approach is also used in [24], in which the behaviour of corroded RC columns under seismic loading is studied through a parametric numerical investigation on 240 RC columns, to assess the influence of the several involved parameters in the lateral load resistance and ultimate drift capacity. In [25] a FE model is developed and validated using the results obtained from three different sets of experimental tests available in literature and used to investigate the effect of localised and uneven distribution of corrosion on the cyclic response of RC columns, showing the pitting influence on the plastic hinge length.
However, according to recent guidelines [26], the prediction of the bearing capacity of RC elements affected by reinforcement corrosion can be made with simplified approaches, based on the reduction of the steel area. It is worth to highlight that these methodologies could be suitable for predicting the load bearing capacity of the RC element but could be misleading in the evaluation of the local and global ductility, significantly affected by corrosion.
Aim of the paper is the development of a numerical model for the evaluation of the influence of localized corrosion on the cyclic behaviour and failure modes of RC columns. The paper follows and completes previous research developed by some of the authors in experimental [15] and numerical [21] way, on the influence of the corrosion of the longitudinal rebars on the cyclic response of column specimens.
Indeed, a numerical model is developed, able to catch and highlight all the phenomena occurring in elements characterized by localised corrosion, under cyclic loads, paying much care in the definition of the 3D model and in the simulation of the rebar corrosion. To this aim, different modelling strategies (MS) are adopted, respectively based on: reduction of constitutive law by uniform or pitting corrosion; bar discretization and section reduction; bar discretization and morphology based constitutive law reduction. The described models are validated through a comparison with the results of experimental tests developed at the Laboratory of the University of Rome “Tor Vergata” on four full-scale square RC columns subjected to cyclic loads and characterised by localised rebar corrosion [27].
The reference experimental survey on the four full-scale RC columns, cast and tested under cyclic load is presented in Section 2. The column geometry, the details of the artificial corrosion process of the steel reinforcement, and the cyclic loading system are here presented. The main outcomes of the performed tests are outlined, in terms of effective corrosion amount and morphology evaluated after the tests and in terms of load-horizontal displacements graphs. Section 3 is devoted to the description of the developed numerical models, with particular reference to the definition of the geometry of the specimen, boundary conditions, material properties (concrete and steel reinforcement) and load patterns. As previously described, different strategies are proposed and compared for the modelling of the corroded reinforcement. The section ends with a description of the modelling of the bond between reinforcement and concrete and of the expectations about results, on the basis of the visual inspection and morphological study of the reinforcement. In Section 4 the results of the performed numerical analysis are shown, with reference to un-corroded and corroded elements, to outline the pros and cons of the different modelling strategies to study the effect of non-uniform steel rebars corrosion on the cyclic behaviour of RC columns. Finally, in Section 5 the main findings are summarized, underlining the sharp effect of localised corrosion on the structural behaviour and failure mode of RC columns and the importance to perform cyclic analysis for existing structures subjected to decay phenomena.
2. Reference Experimental Survey
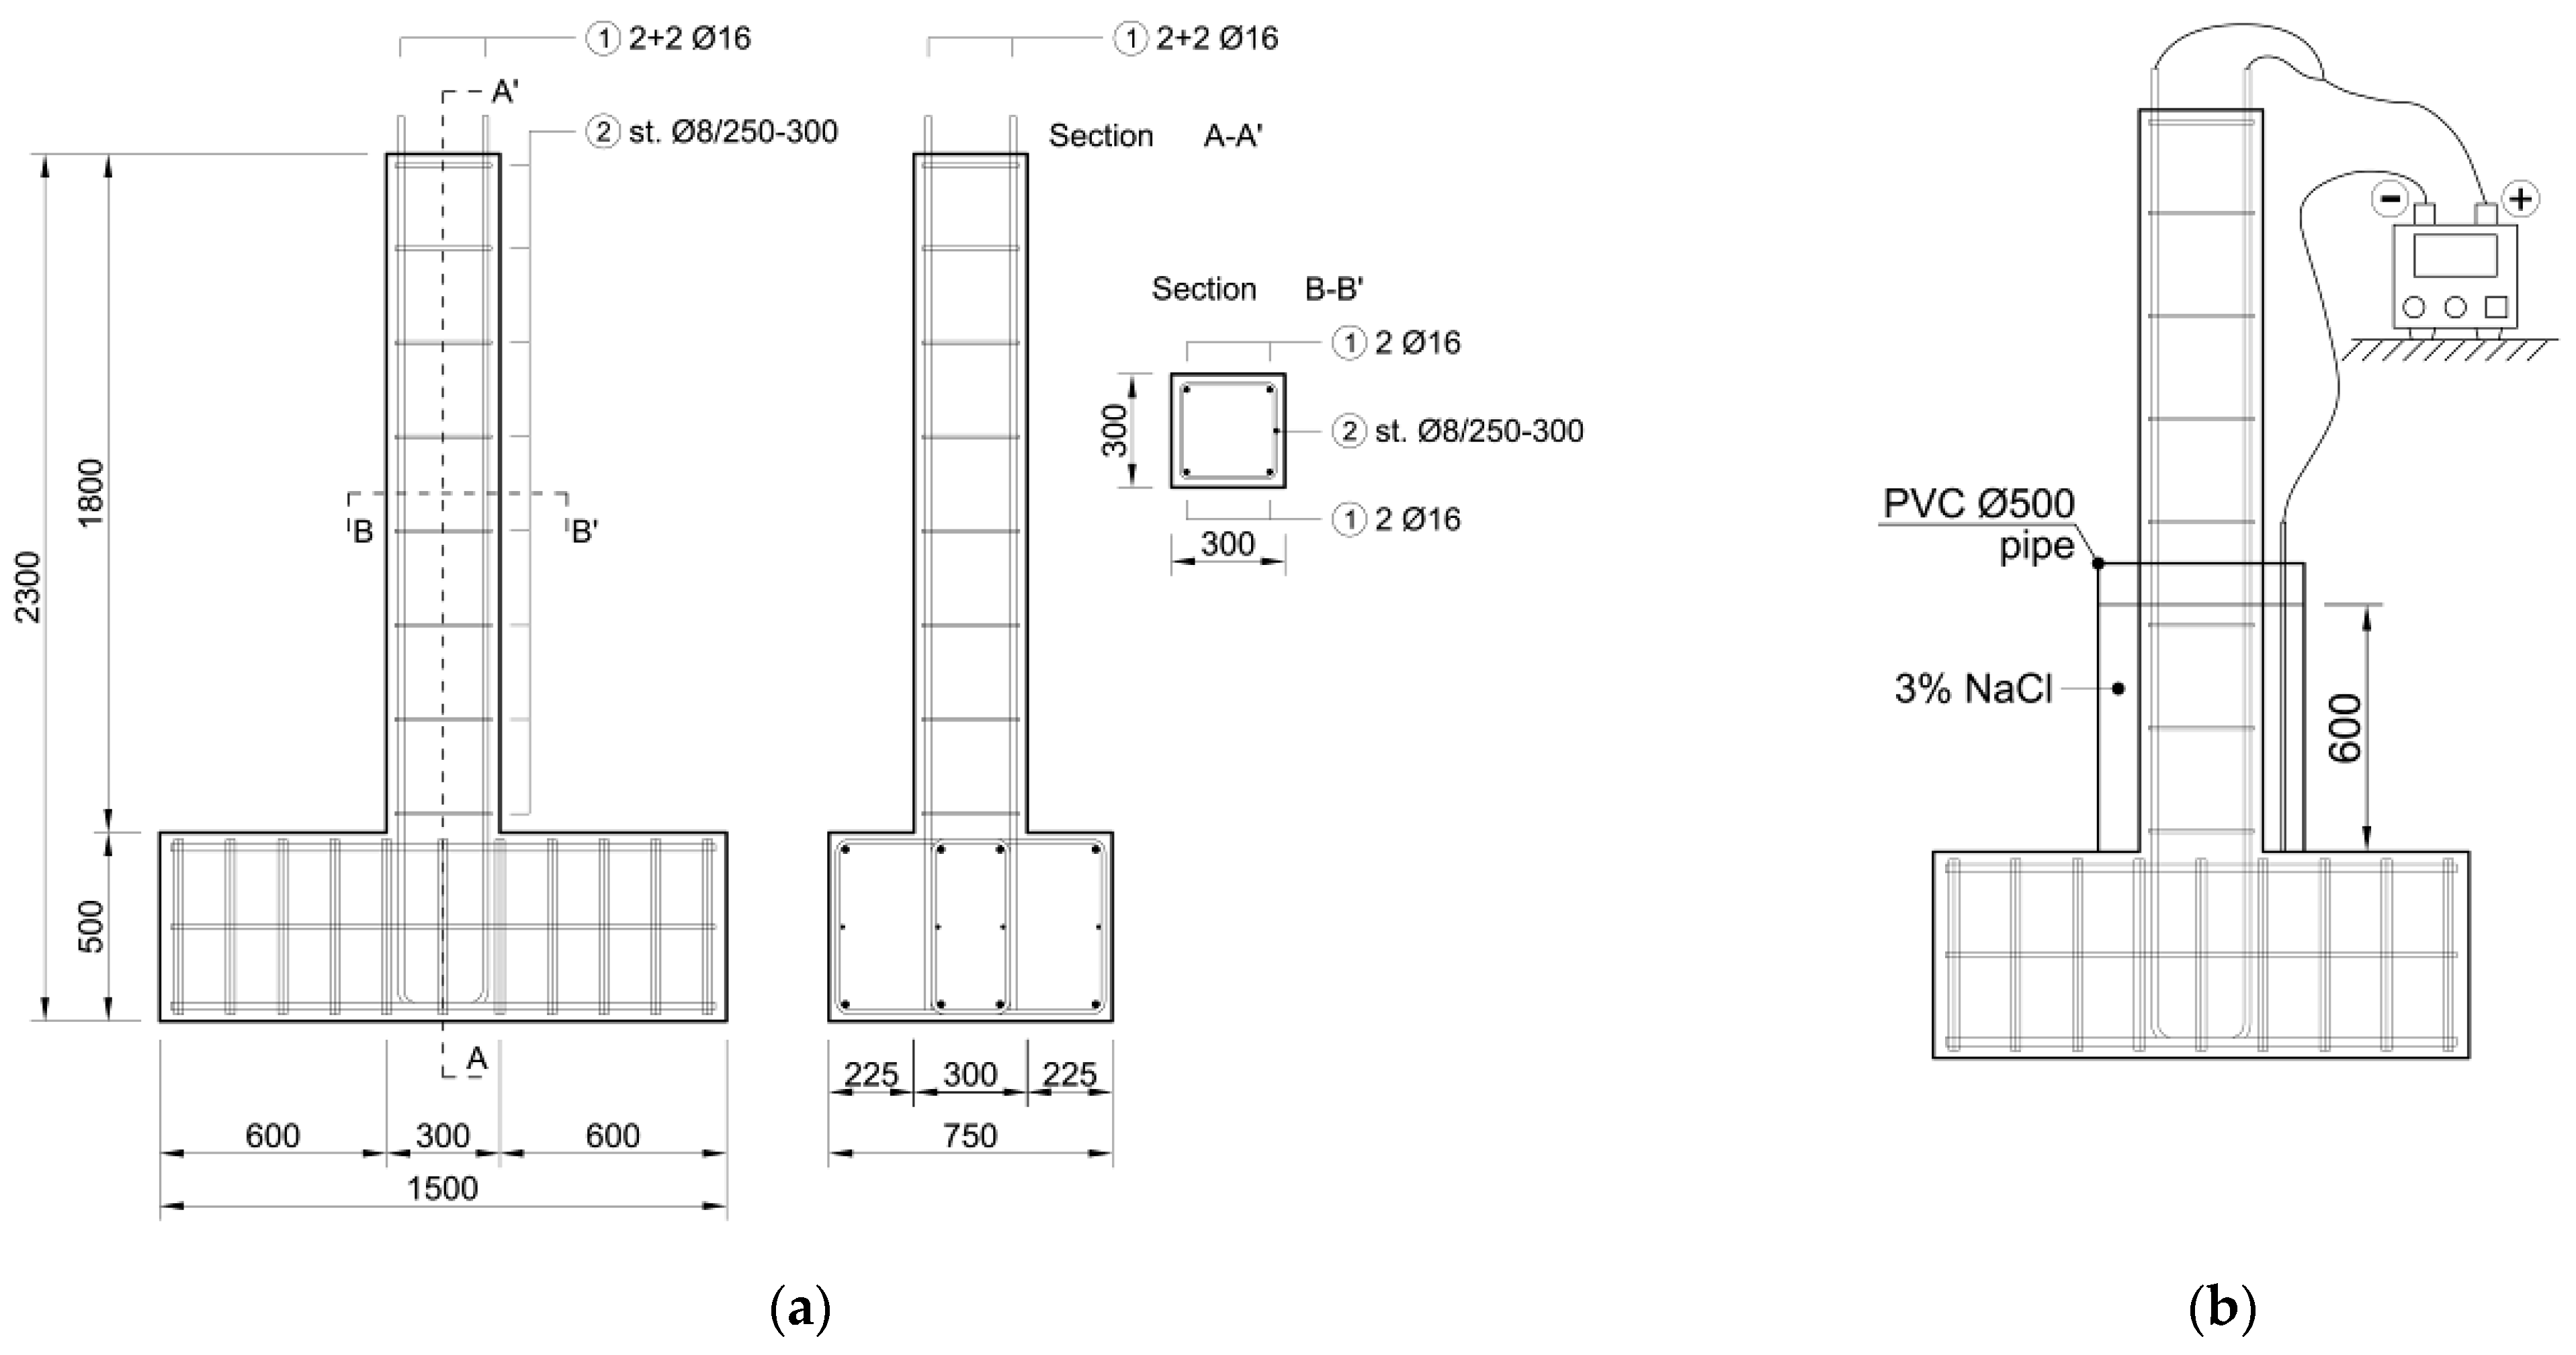
The reference experimental survey was performed at the Laboratory of the University of Rome “Tor Vergata”, where four RC columns were cast and tested [27]. The specimens, with a height of 1800 mm and a 300 mm × 300 mm square section, were reinforced with four Φ16 mm longitudinal bars (Figure 1a). Two spacing values, equal to 250 mm and 300 mm, of the closed Φ8 mm stirrups were considered. The concrete cover was equal to 30 mm. The elements were cast on a 1500 mm × 750 mm × 500 mm foundation (Figure 1a).

Figure 1.
(a) Column geometry; (b) artificial corrosion process.
For each of the two considered stirrups spacing, one column was kept un-corroded for reference (A), while a second one was subjected to a process of artificial corrosion of the steel reinforcement (B) at the column base. A 3% saline solution was contained in a PVC Ø500 mm pipe, placed around the column and fixed to the foundation, up to a height of about 600 mm from the foundation extrados (Figure 1b). The longitudinal rebars were connected to the positive pole of the power supply (anode), while a Ø10 diameter steel bar, placed inside the PVC pipe, acted as the cathode. A current intensity equal to 0.05 A for each bar was adopted. Table 1 shows the layout of the experimental program.

Table 1.
Layout of experimental program.
The effective corrosion amount and morphology were evaluated after the tests, by extracting the steel rebars from the specimens B25 and B30, characterised by stirrup spacing of 250 mm and 300 mm, respectively. Both the longitudinal and transversal reinforcements were corroded, and a sharp localization of the corrosive attack took place. In particular, even if the mass loss was about 24% in both the specimens, deep pits were observed in the longitudinal bars up to a diameter reduction of more than 30% in the specimen B25, and up to 50% in the column B30. The corrosion morphology played a fundamental role in defining the failure mode, as highlighted in the following.
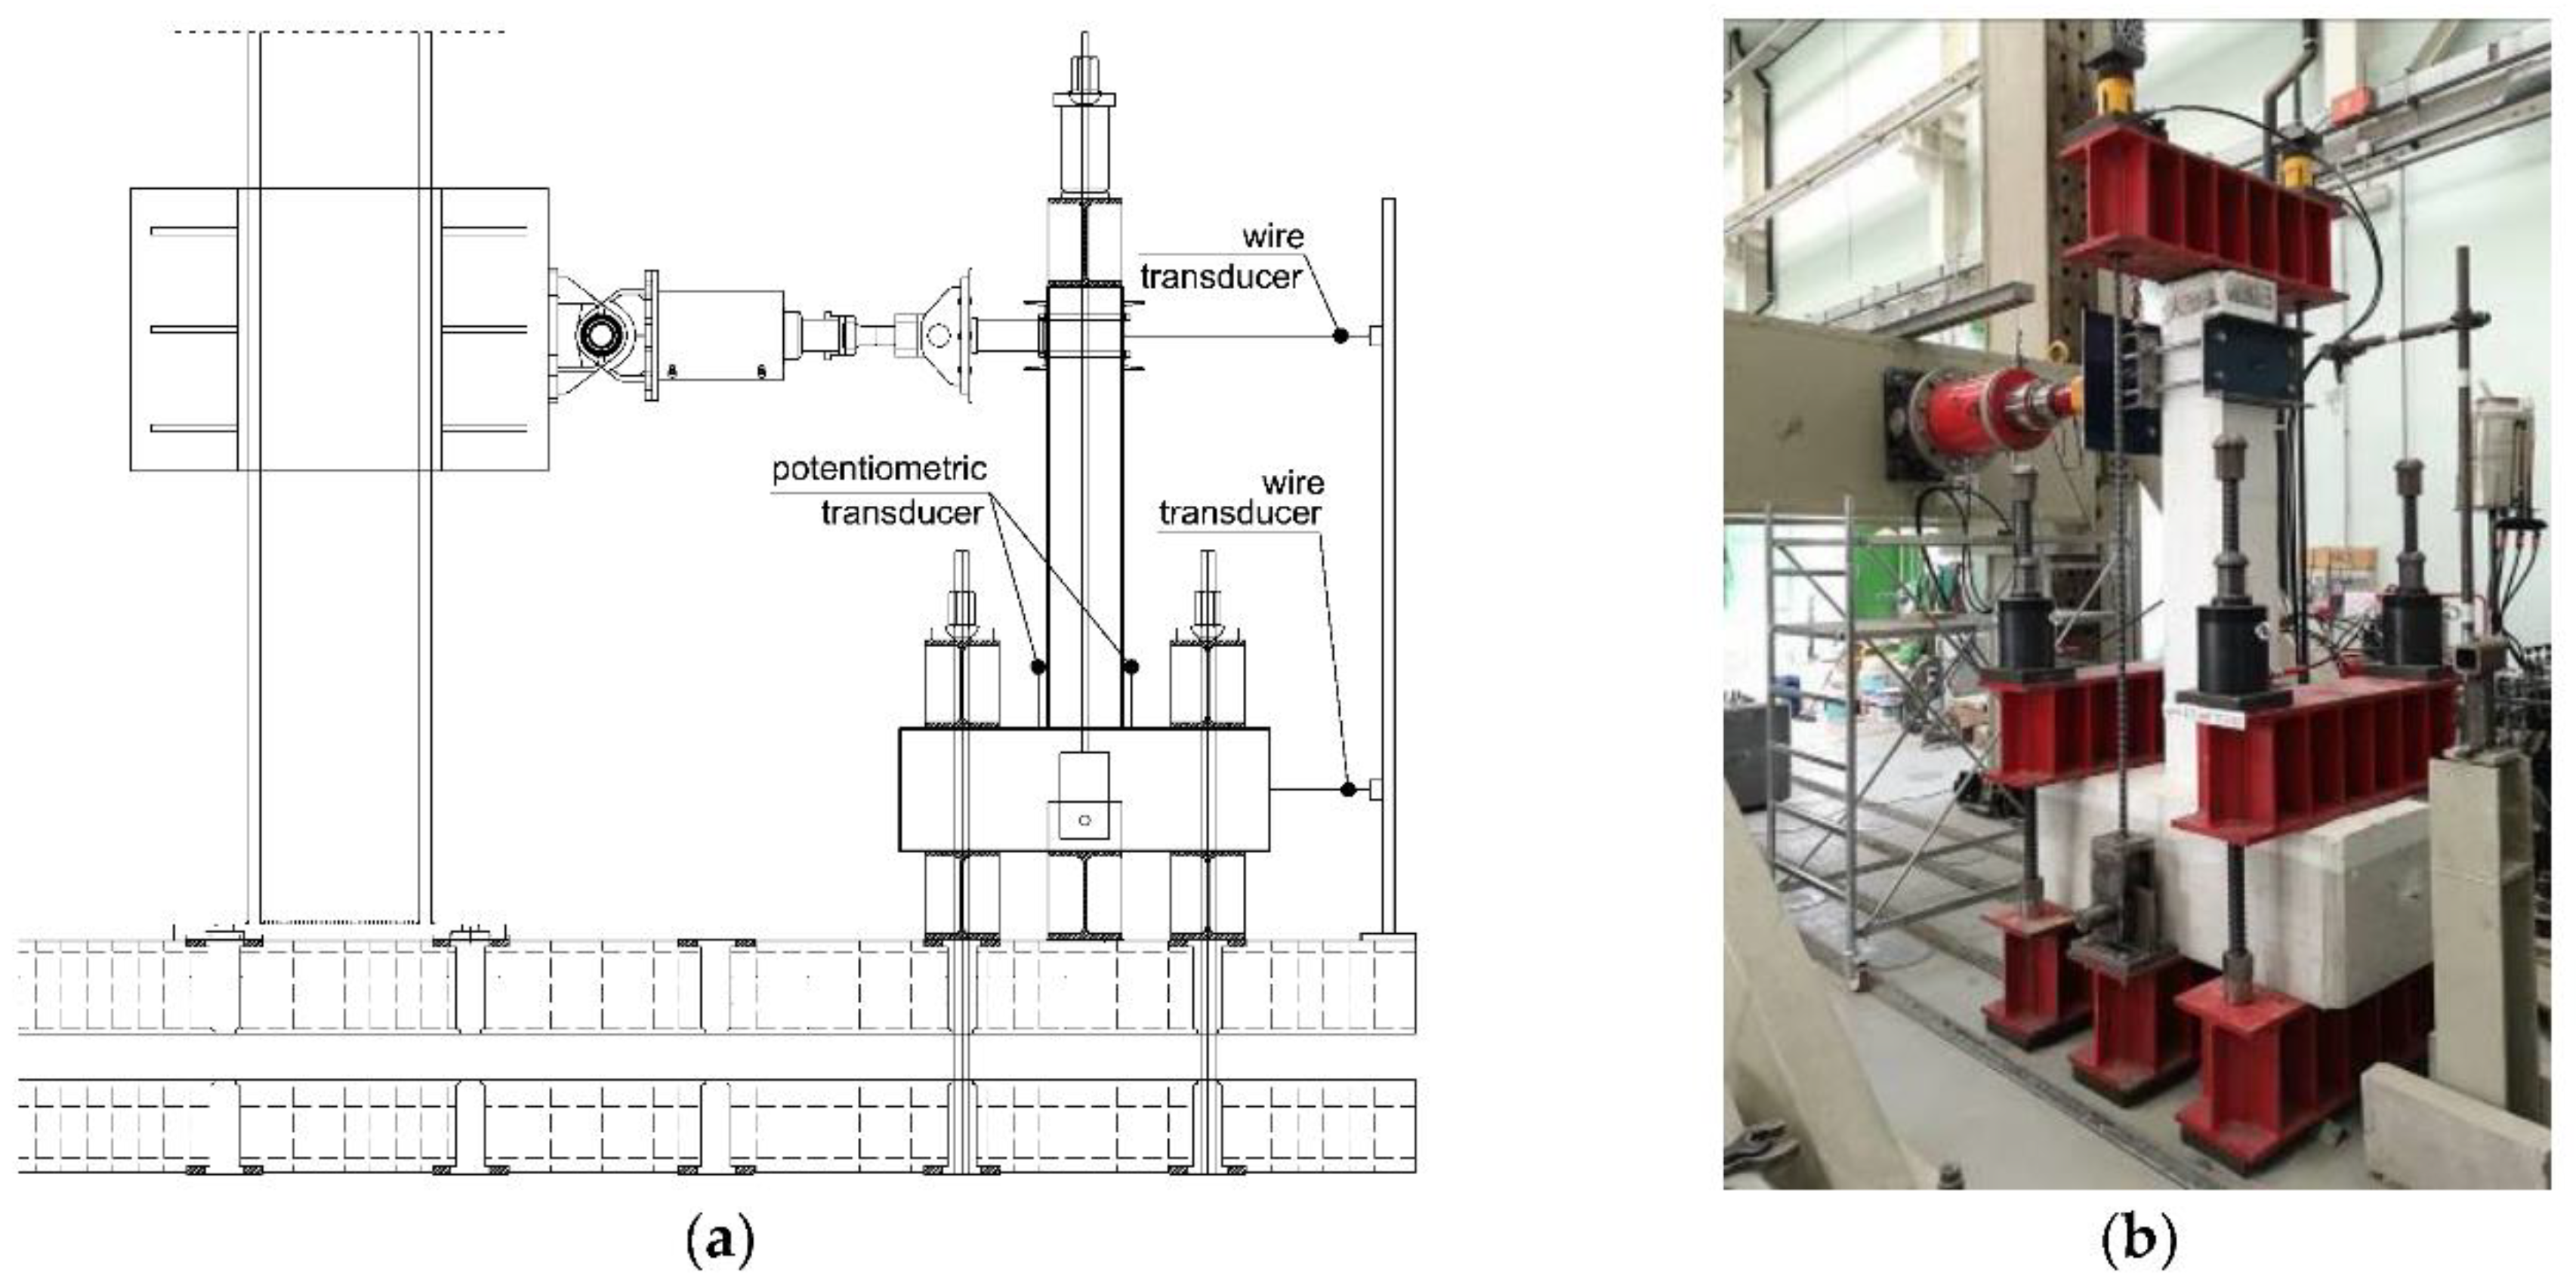
The test set-up is shown in Figure 2. An axial load equal to 300 kN was applied to the top column with a self-balanced system and with two high strength rebars, each one connected to a hydraulic jack. After the axial load application, a cyclic horizontal displacement history, with increasing amplitude, was imposed at a height h from the foundation extrados equal to 1.5 m, up to the failure. To this aim, an electro-mechanical jack was fixed to the load frame of the laboratory and linked to the column employing a hinged bar system, in which a load cell was placed. The loading history consisted of three complete cycles, for different values of the column drift, defined as the ratio between the horizontal displacement δ at the load application point and the height h.

Figure 2.
(a) Scheme of Test set-up; (b) test set-up.
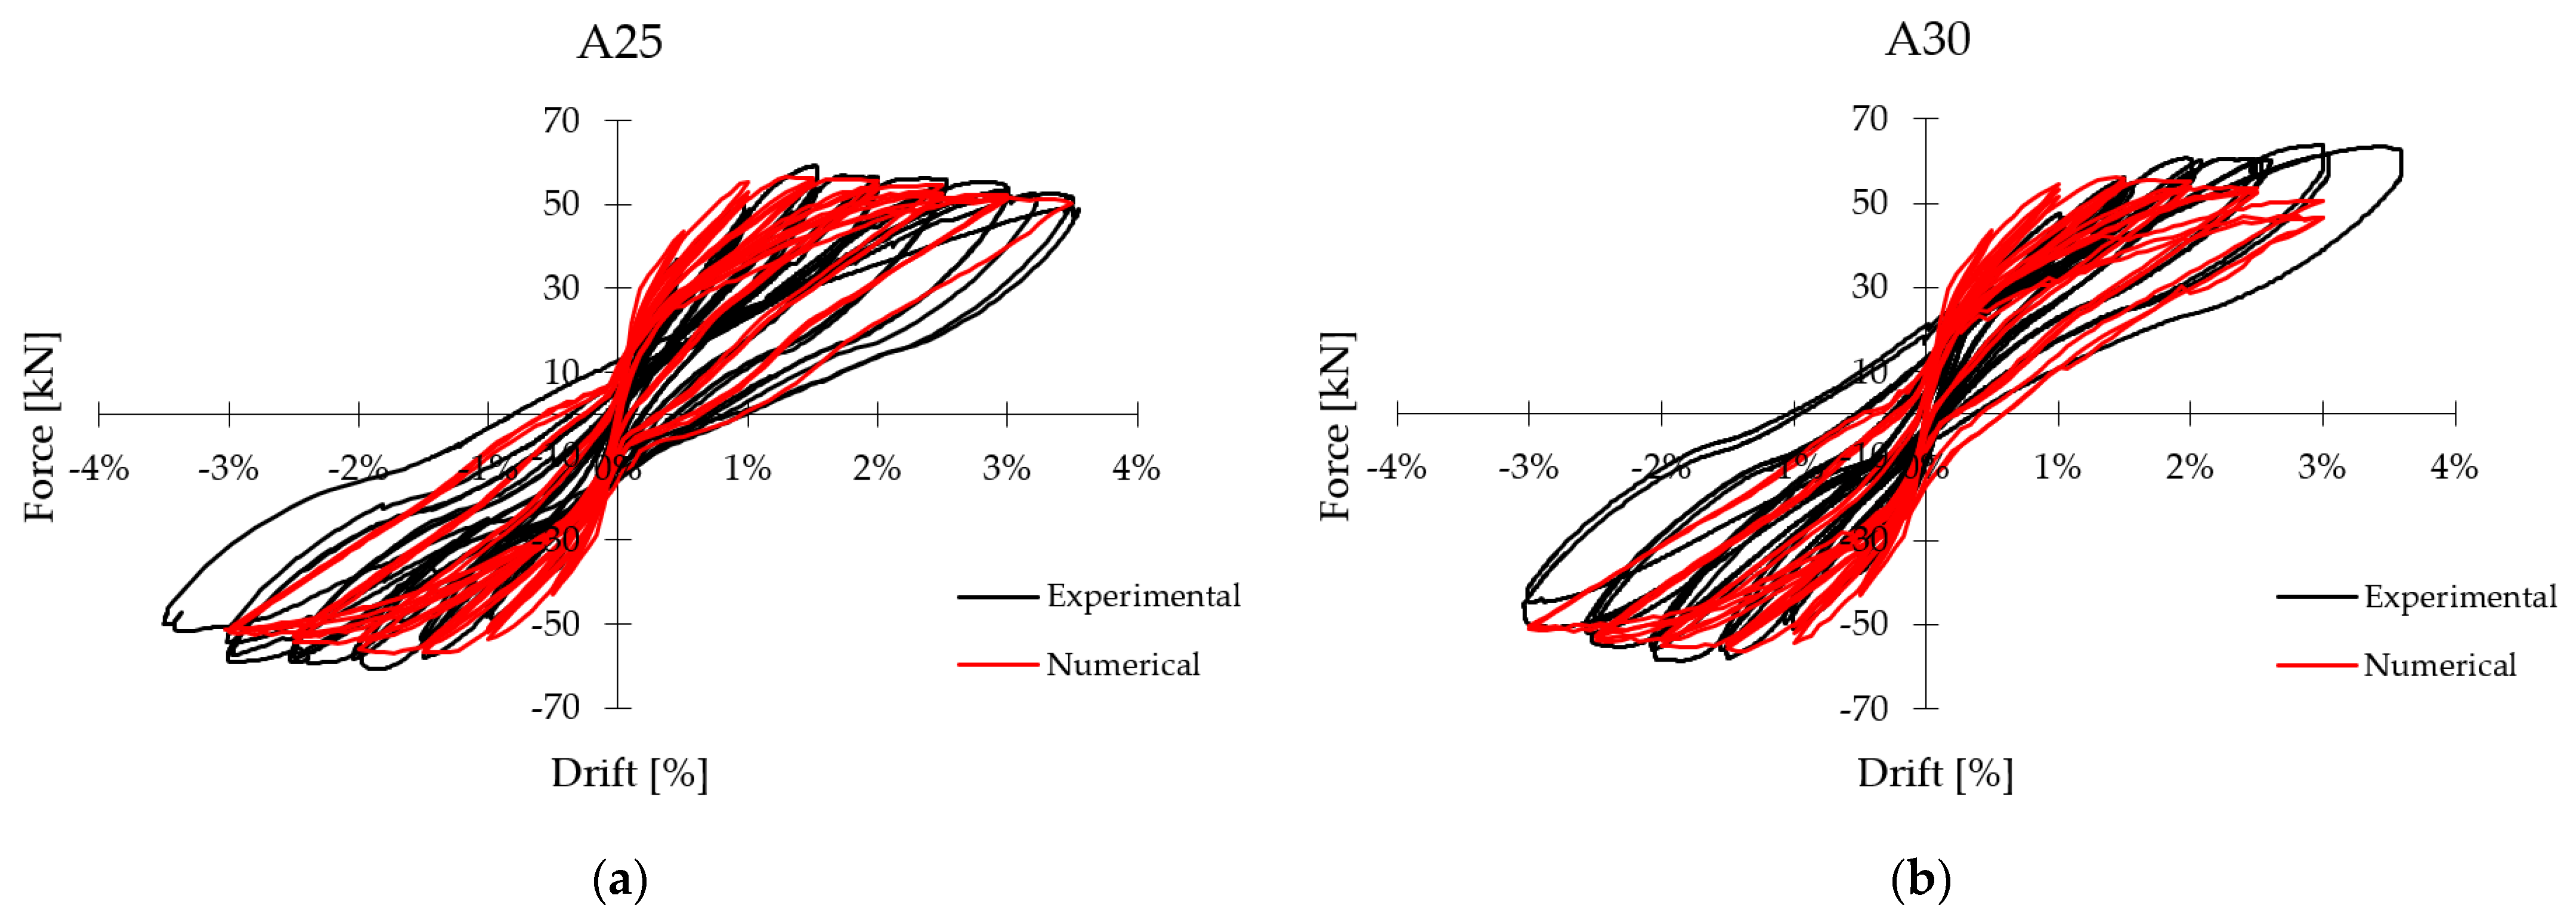
The experimental results in terms of load-horizontal displacements are summarised in Figure 3a, with reference to the columns A25 and B25, and in Figure 3b for specimens A30 and B30. In both cases, a decrease of the maximum load of about 30% was measured. A great influence of the corrosion can be observed in the shape of the cycle and then in the ductile behaviour of the elements. Mainly with reference to specimen B30 (sharply affected by very localised corrosion), the pinching effect can be clearly appreciated, due to the onset of brittle mechanisms. Further details can be found in [27].
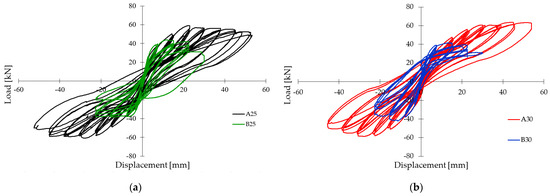
Figure 3.
Experimental test results; (a) un-corroded A25-corroded B25 specimens; (b) un-corroded A30-corroded B30 specimens.
3. FEM Model
Non-linear numerical analyses are performed with the FEM code DIANA 10.5 (2021), to obtain a reliable predictive model for the cyclic behaviour of corroded RC columns. In this section, the geometry of the specimen, the boundary conditions, the material properties and the load patterns, all assumed in agreement with the experimental tests, are presented.
3.1. Geometry, Element Assumption and Analysis
The numerical model is shown in Figure 4a. The considered reference system is superimposed in the same figure. Concrete elements are modeled with the eight-node structural solid element. Through a mesh generator, a desired element size of 50 mm for the column concrete core and the concrete cover is considered, while a size of 100 mm is set for the foundation concrete. The longitudinal reinforcement is modeled as truss bond-slip reinforcement, while the columns transverse reinforcement and the foundation reinforcement are modeled as embedded reinforcement. The “element by element” discretization method is used for reinforcement. In Figure 4b the casting position of the corroded reinforcements, together with the load direction x, is shown.
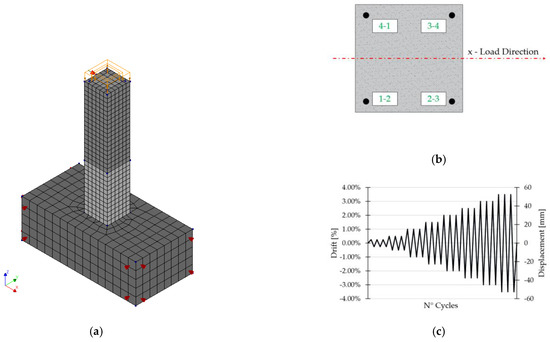
Figure 4.
(a) Numerical model, (b) Column base cross-section and corroded bars casting position, (c) Displacement history adopted in the non-linear analyses.
Regarding the boundary conditions, translational restraints in the orthogonal direction to the base and side faces of the foundation are applied, to simulate the foundation clamping provided during the experimental test. A translational restraint at the column top and along the load direction is modeled to perform a displacement control non-linear cyclic analysis. Therefore, a tying constraint for the nodes of the cross-section at the load height is applied to impose the equality of the x-component of the displacement.
The non-linear structural analyses are performed by applying in a first phase the axial load of 300 kN at the top of the column, then the displacement histories shown in Figure 4c is applied in accordance with experimental tests (up to 3.5% Drift for un-corroded specimens and up to 1.5% drift for corroded specimens). The structural non-linear analyses are performed using a regular Newton-Raphson iterative method for the solution of the non-linear equation set (imposing 20 maximum number of iterations for step) with a convergence norm based on displacement and force (convergence tolerance is assumed equal to 0.01).
3.2. Concrete Modelling
The concrete elements are modeled through the Total Strain Crack Model (TSCM) theory [28,29], considering a rotating cracks orientation. The compressive behaviour of concrete is modeled according to the parabolic curve, based on the fracture energy [30,31]. The compressive strength was assumed equal to 20 MPa, in agreement with the experimental test results. The concrete Elastic Modulus and the compressive fracture energy are derived from the compressive strength as indicated in [32]. The concrete stress confinement was considered by adopting the model proposed in [29], through a pre-strain concept in which the lateral expansion effects are accounted for with an additional external loading on the elements. The concrete tensile behaviour is modeled with the exponential softening law. The tensile strength and the Mode-I fracture energy are calculated as a function of the compressive strength according to [32]. The crack bandwidth in agreement with [33] is evaluated as the cube root of the element’s volume. The cracking and spalling of the concrete cover due to corrosion products are considered by reducing the concrete cover compressive strength in accordance with [10], in which the model proposed by [28], based on the average tensile strain in the transverse direction, is used. As regards the cyclic behaviour, it is to remark that the TSCM is characterized by a secant unloading in both compression and tension [30], and then the contribution to the energy dissipation of the concrete could be slightly underestimated. Nevertheless, this model was chosen and adopted in the numerical simulation for its stability and reliability in non-linear analyses.
3.3. Steel Reinforcement Modelling
The steel reinforcement has been simulated with the isotropic non-linear constitutive model of Menegotto and Pinto [34]. The constitutive-model parameters were calibrated on the results of tensile tests on the reinforcements used in previous experimental tests made by some of the authors [15]. The model parameters for the un-corroded reinforcement are shown in Table 2. With reference to the corroded reinforcement, one of the goals of this work is to propose and compare different modelling strategies, presented below.
Table 2.
Un-corroded steel reinforcement Menegotto-Pinto parameters.
3.3.1. Corroded Rebars of the Experimental Test
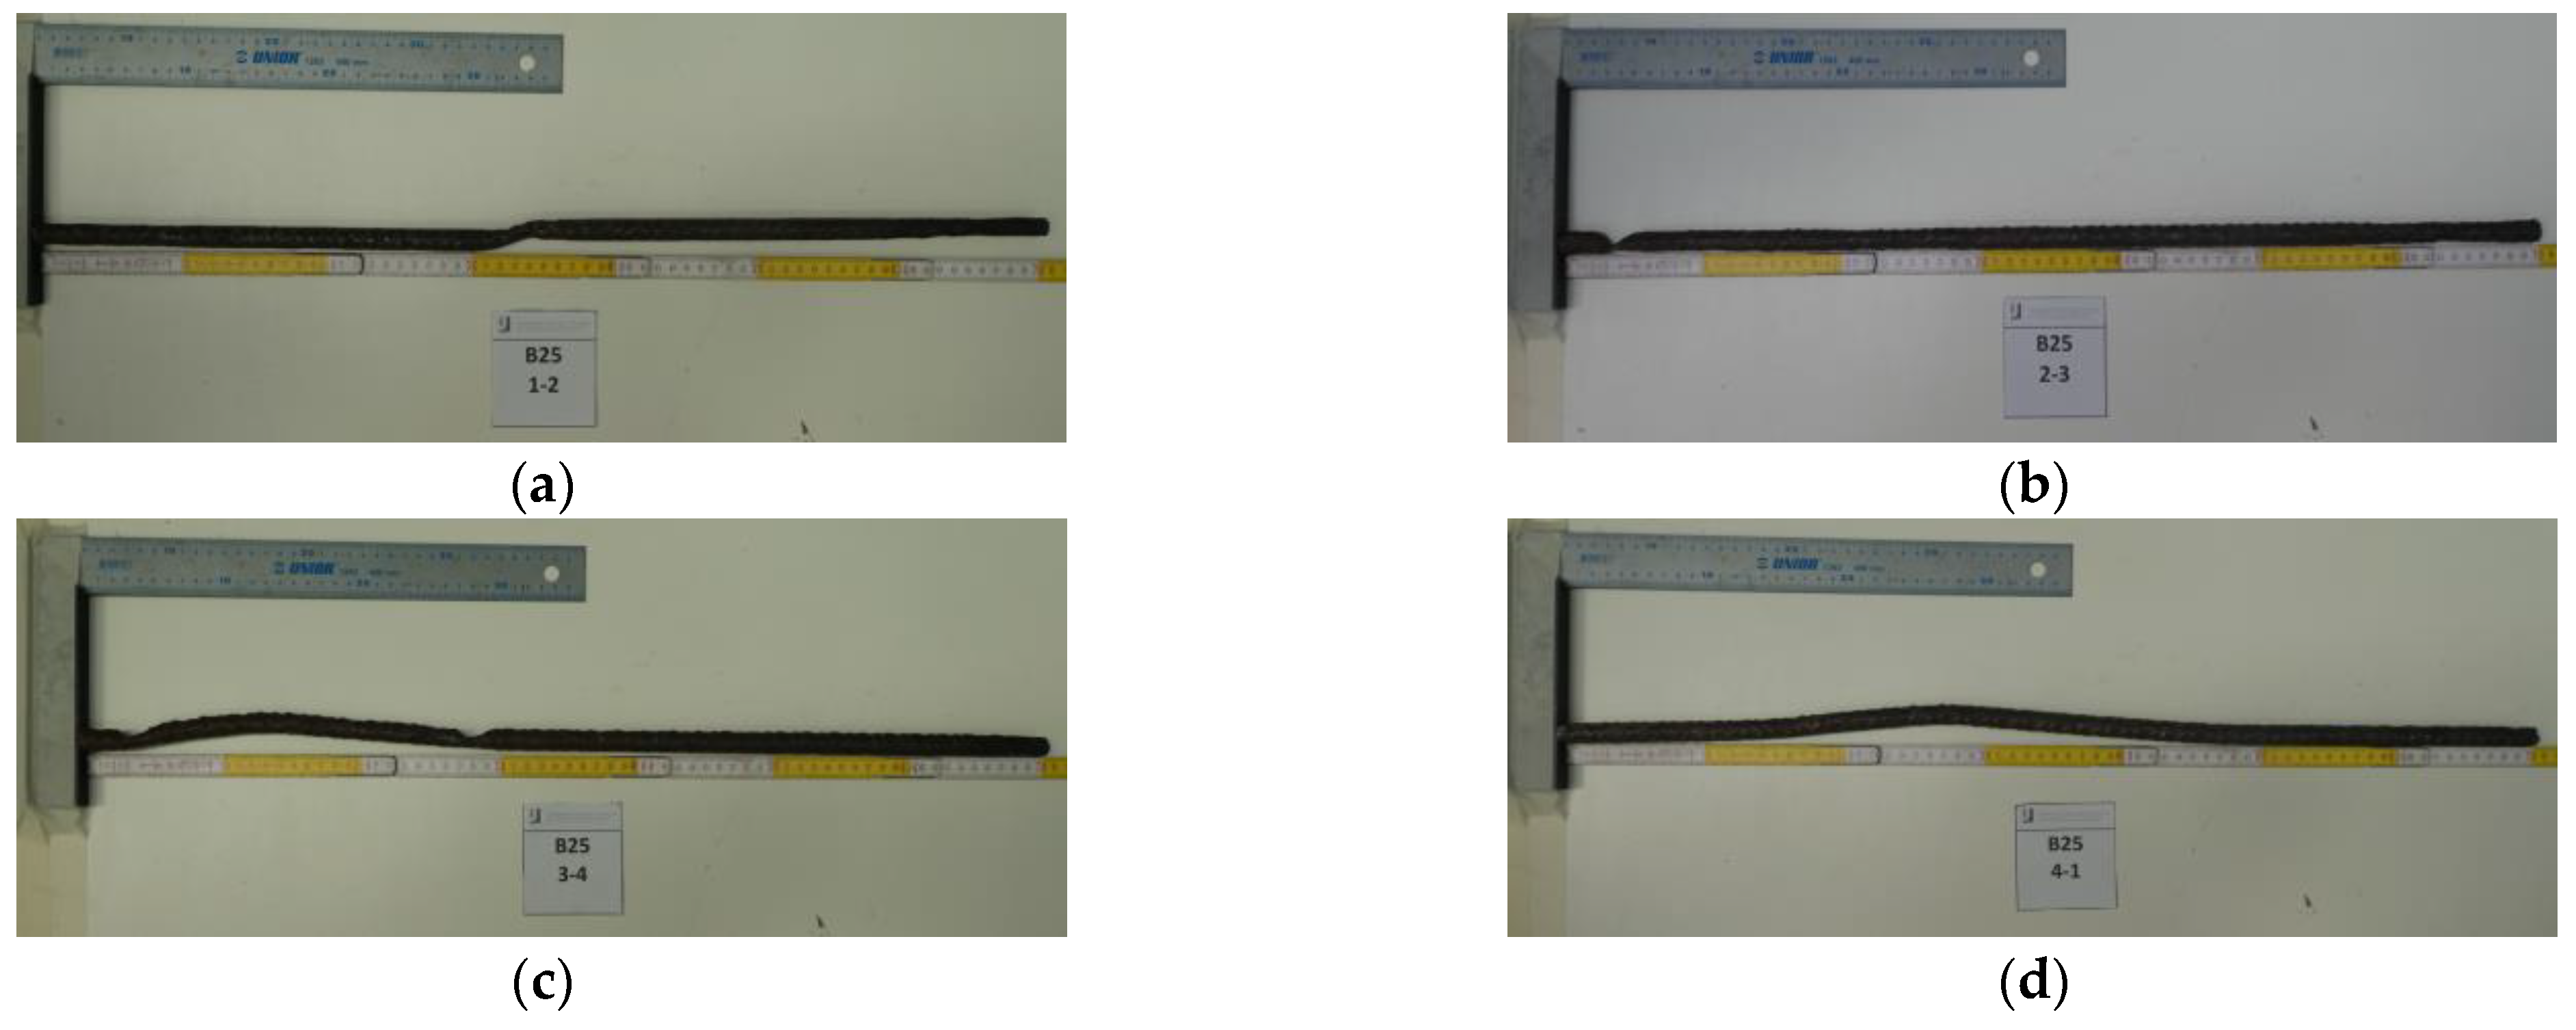
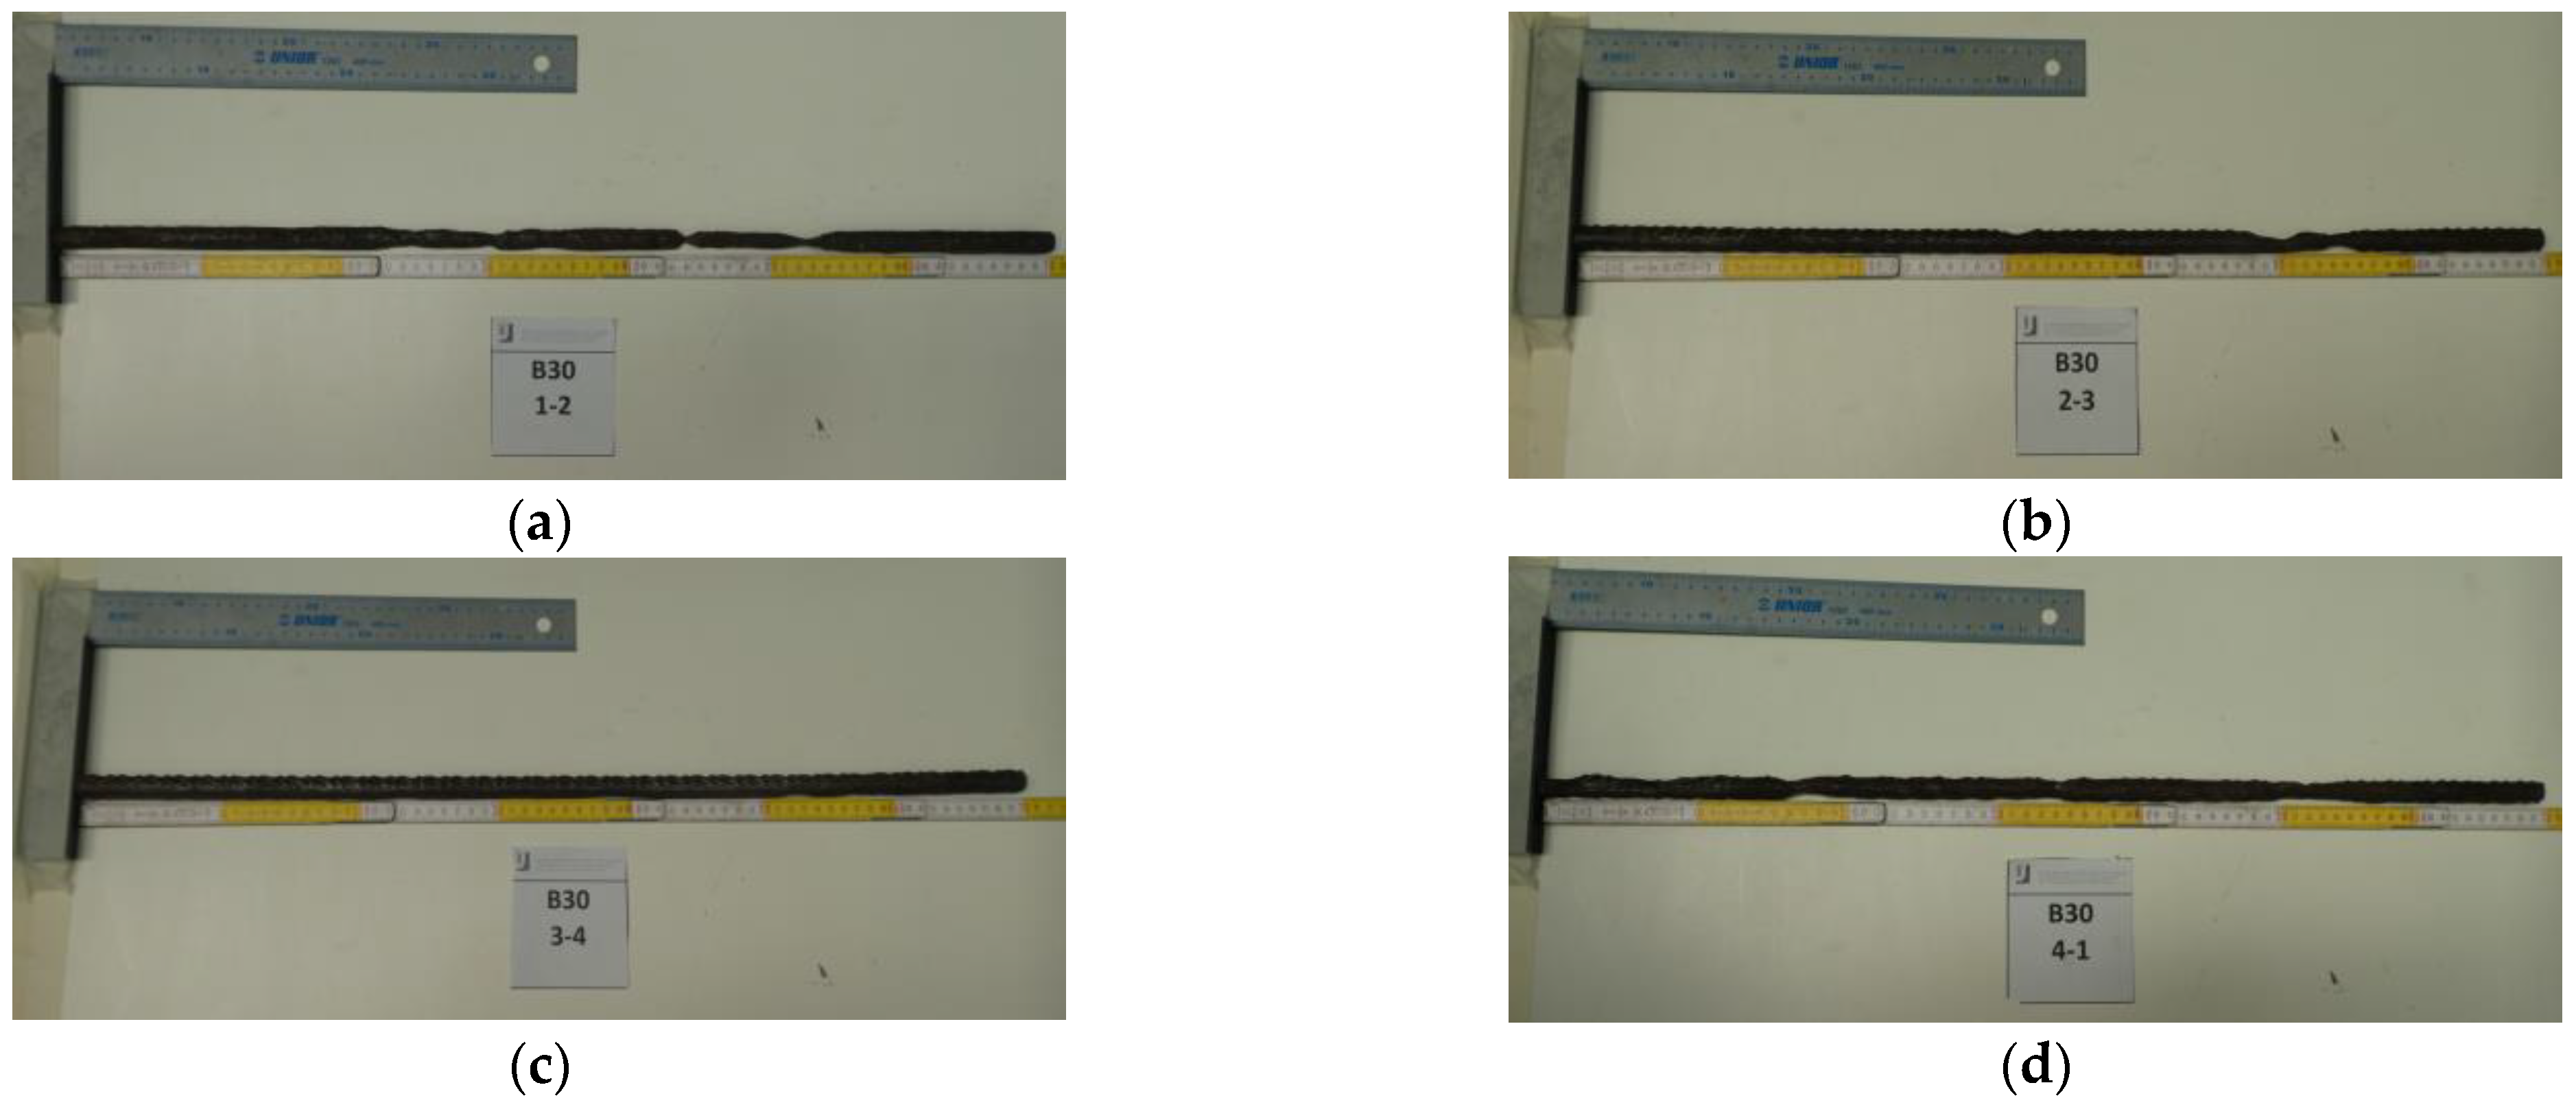
To better understand the effect of both corrosion localization and pitting phenomenon, particular attention was paid to the morphology of the corroded reinforcements. Following the experimental tests, the pieces of the bars subjected to artificial corrosion (i.e., those in the plastic hinge regions) were extracted from the concrete and cleaned of the excess rust to evaluate their mass loss and their corrosion morphology (Figure 5 and Figure 6 for the corroded specimens B25 and B30, respectively). The steel rebars are named according to Figure 4b.

Figure 5.
Corroded Rebars, Column B25. (a) Bar 1-2, (b) Bar 2-3, (c) Bar 3-4, (d) Bar 4-1.
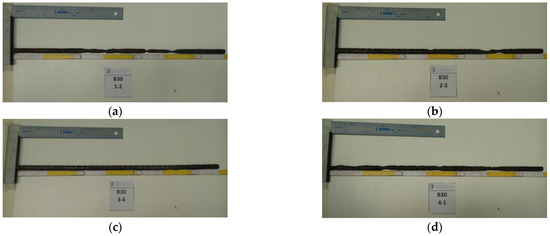
Figure 6.
Corroded Rebars, Column B30. (a) Bar 1-2, (b) Bar 2-3, (c) Bar 3-4, (d) Bar 4-1.
The average loss mass of each bar was calculated by weighing the specimens, as summarized in Table 3. It is worth noting that the asymmetrical cyclic behaviour of the column B30 (Figure 3b) is due to the difference in the mass loss values of the bars, strongly corroded on a side and moderately corroded on the other (Table 3 and Figure 4).
Table 3.
Weight and loss mass value of the corroded steel rebars.
Measurements of the bars’ cross-section minimum diameter, carried out repeatedly along the length of the bars, were performed. These measures are useful for the morphology evaluations, characterizing the modelling strategies 3 and 4 presented in this section.
3.3.2. Modelling Strategy 1: Reduction of Constitutive Law by Uniform Corrosion
The steel constitutive law is broken down according to [35], in which the degradation relationships for uniform corroded steel rebars are proposed. The reduction of the constitutive parameters occurs for each bar, as a function of the actual mass loss (Table 3). In this way, only the portions of the longitudinal reinforcements subjected to corrosion, i.e., the plastic hinge regions, are modeled with a reduced constitutive laws. Table 4 shows the mechanical parameters reduction for modelling strategy 1.
Table 4.
Mechanical parameter reduction for modelling strategies 1 and 2.
3.3.3. Modelling Strategy 2: Reduction of Constitutive Law by Pitting Corrosion
The second modelling strategy, in analogy with the first, provides for the reduction of the steel constitutive law, but in this case considering the phenomenon of pitting corrosion. Pitting causes localized section reductions in the bar through pits, affecting internal layers of the steel bar and further reducing the strength and ductility of the reinforcement. Again in [35], the degradation relationships for pitting corrosion from literature review data are presented. Table 4 shows the assumed mechanical properties according to modelling strategy 2 for both corroded specimens.
3.3.4. Modelling Strategy 3: Bar Discretization and Section Reduction
The “macro-morphology” of the reinforcing bars is considered in the third modelling strategy. In this case, the measurements of the minimum diameter along each corroded bar developed during the experimental tests, are exploited to discretize the bar in pieces over its corroded length. Therefore, an equivalent section is considered for each piece identified. It should be noted that the diameter measurement of bars deformed by test loads, due to yielding or distortion, is omitted from the discretization process. The longitudinal bar is then modeled through connected in series truss bond-slip reinforcement elements, to which a reduced section diameter is assigned. It is remarked that through this strategy no direct reductions are applied on the constitutive laws of the reinforcements.
3.3.5. Modelling Strategy 4: Bar Discretization and Morphology-Based Constitutive Law Reduction
Strategy 4 accounts for both the “macro-morphological” aspects, i.e., the variation of corrosion along with the reinforcement, and the “micro-morphological” aspects, i.e., pitting on the cross-section of the bar. The morphology of the bars’ cross-section is considered using the model proposed by Val and Melchers [36], summarized in Figure 7, in which the maximum penetration is linked to the net sectional area of the corroded bar, considering a hemispherical form of pits.
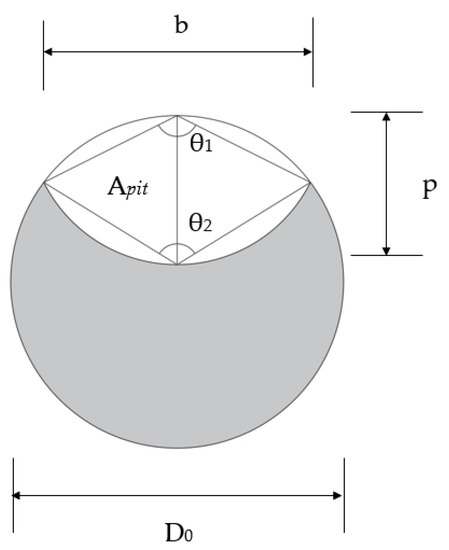
Figure 7.
Pit configuration, model by Val and Melchers [36].
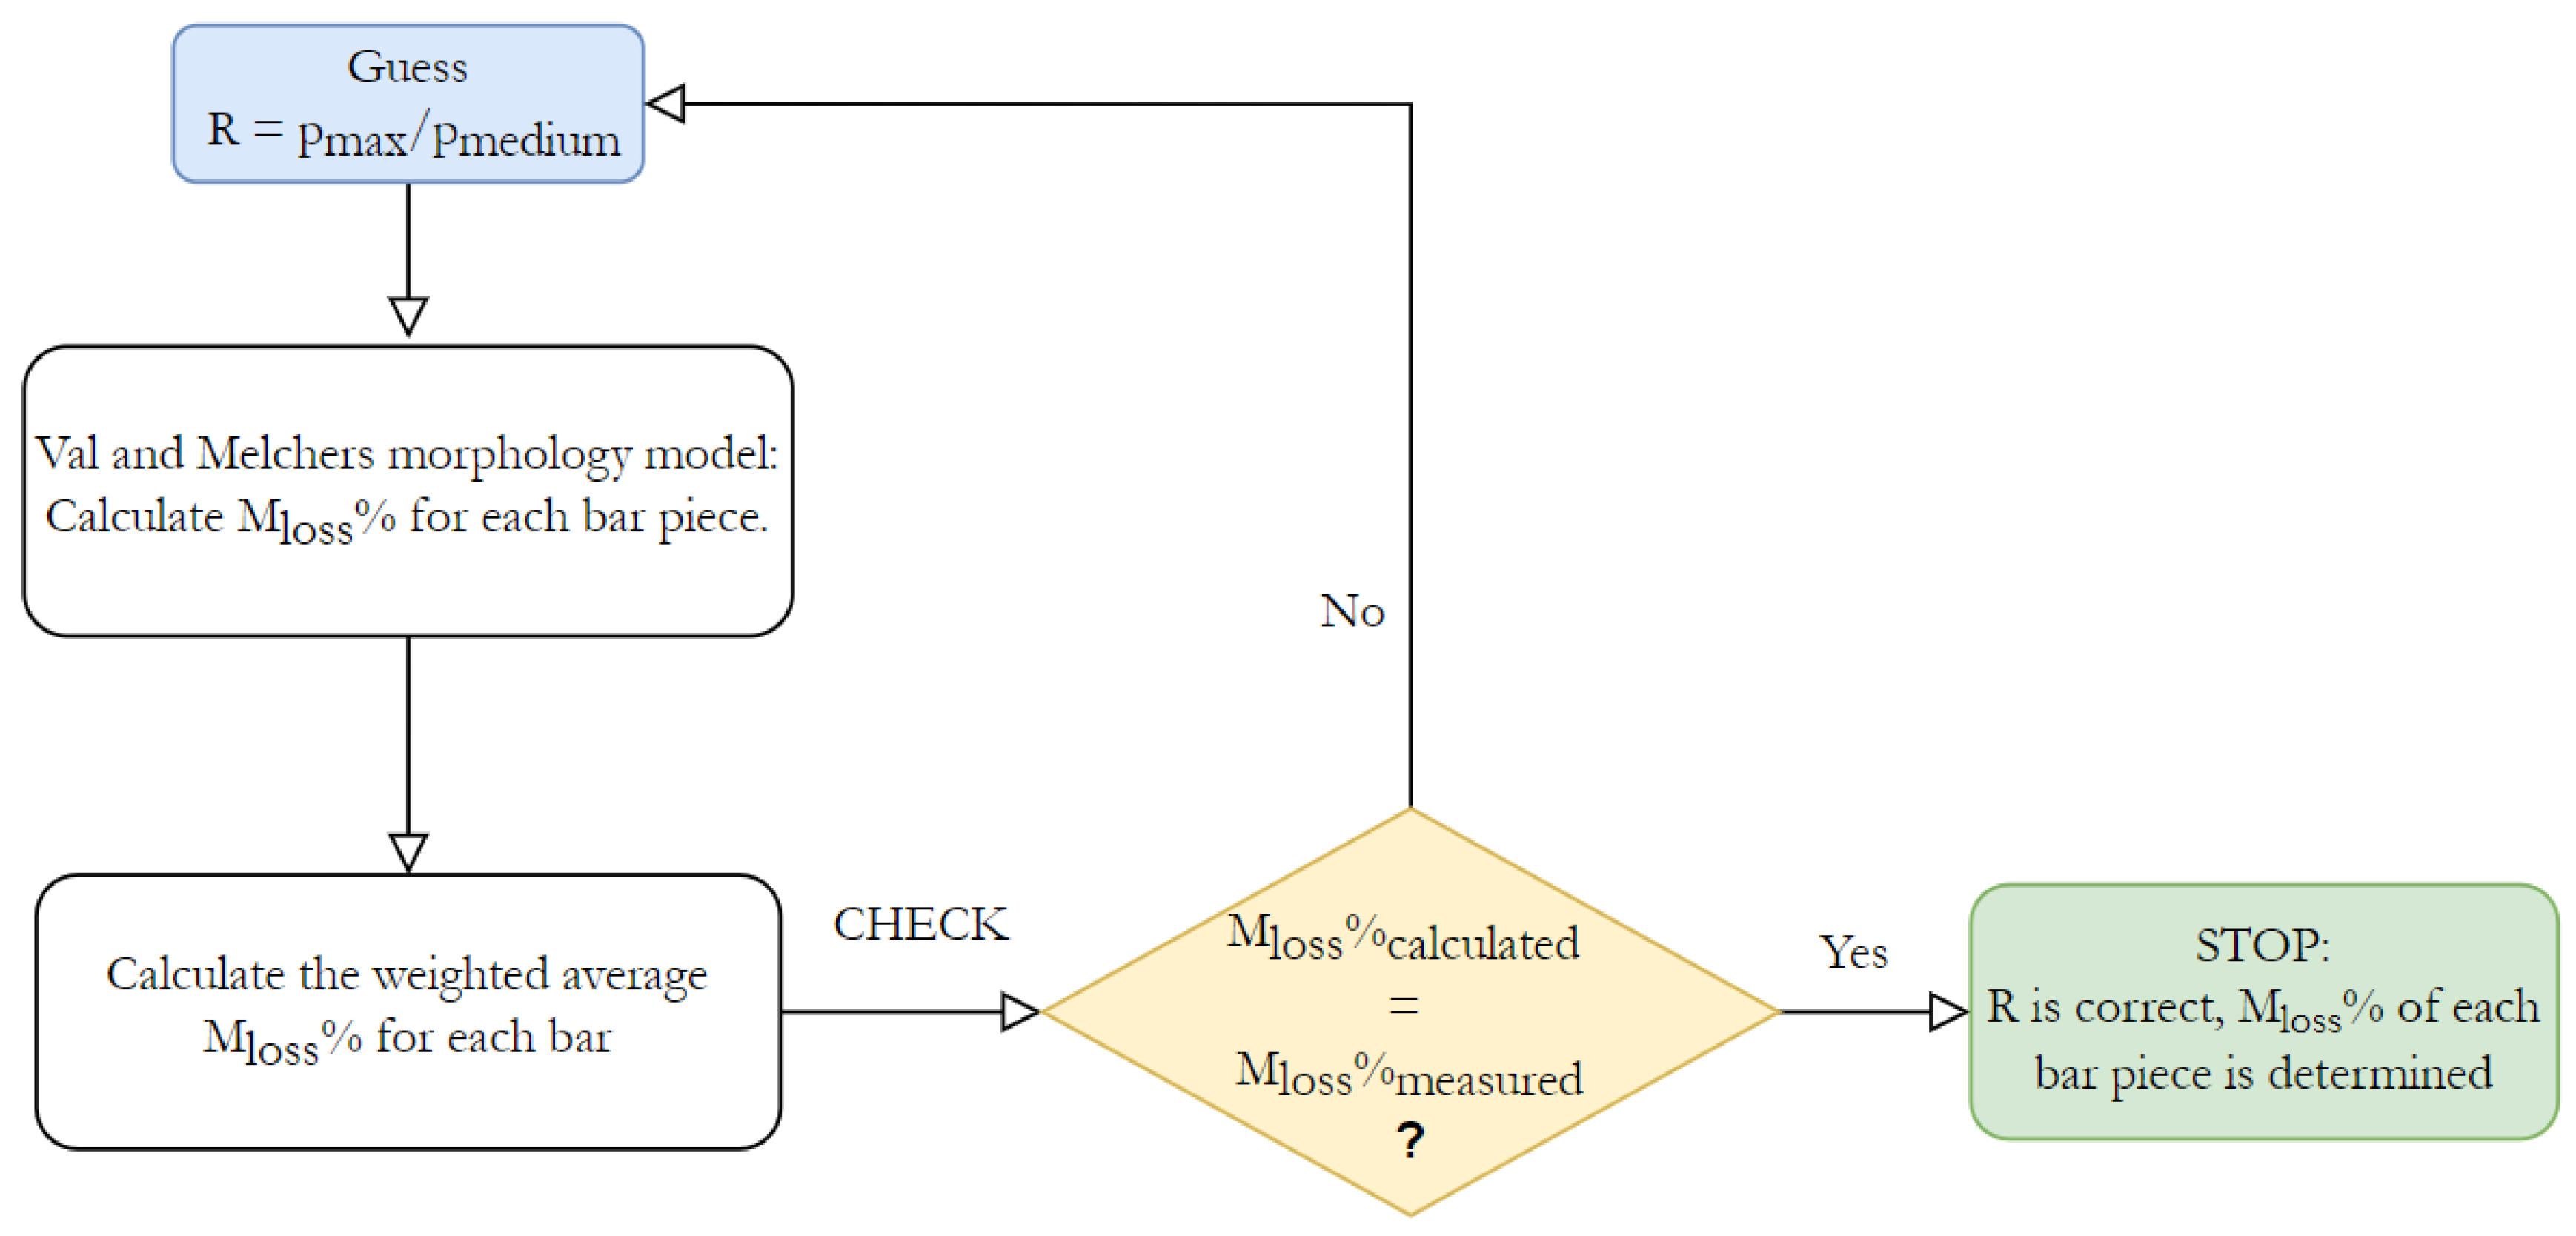
Then an inverse method was used to iteratively search the “pitting factor” R (i.e., maximum vs. average penetration ratio) of each bar (Figure 8). Firstly an initial guess value for the “pitting factor” is assumed and, considering the measured maximum penetration of the corroded sections of the bar, the mass loss value for each piece of the corroded bar is evaluated through the Val and Melchers model [36] with Equations (1)–(3). The “calculated mass loss” of each bar is evaluated as the weighted average on the length of each bar piece. If this parameter is equal to the experimental mass loss measured after the tests, the “pitting factor” is then determined. Otherwise, a new “pitting factor” guess value is set in the iterative procedure, until the satisfaction of the check test.
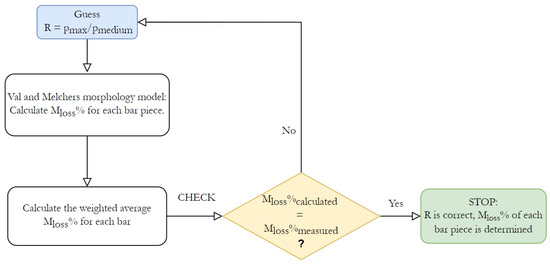
Figure 8.
Flow chart of the inverse method for morphology-based mass loss evaluation.
Following this procedure, the influence of the pitting phenomenon has been evaluated for each bar and then the loss mass value assigned to each section of the bar has been optimized according to the pitting factor. In order to significantly compare the numerical results, the same discretization along the bars adopted in the strategy 3 was also applied in this case. Table 5 and Table 6 summarize the results obtained with the methodology previously described for all corroded bars, relating to specimens B25 and B30 respectively.
Table 5.
Pitting factor and lost mass assumed for strategy 4, column B25.
Table 6.
Pitting factor and lost mass assumed for strategy 4, column B30.
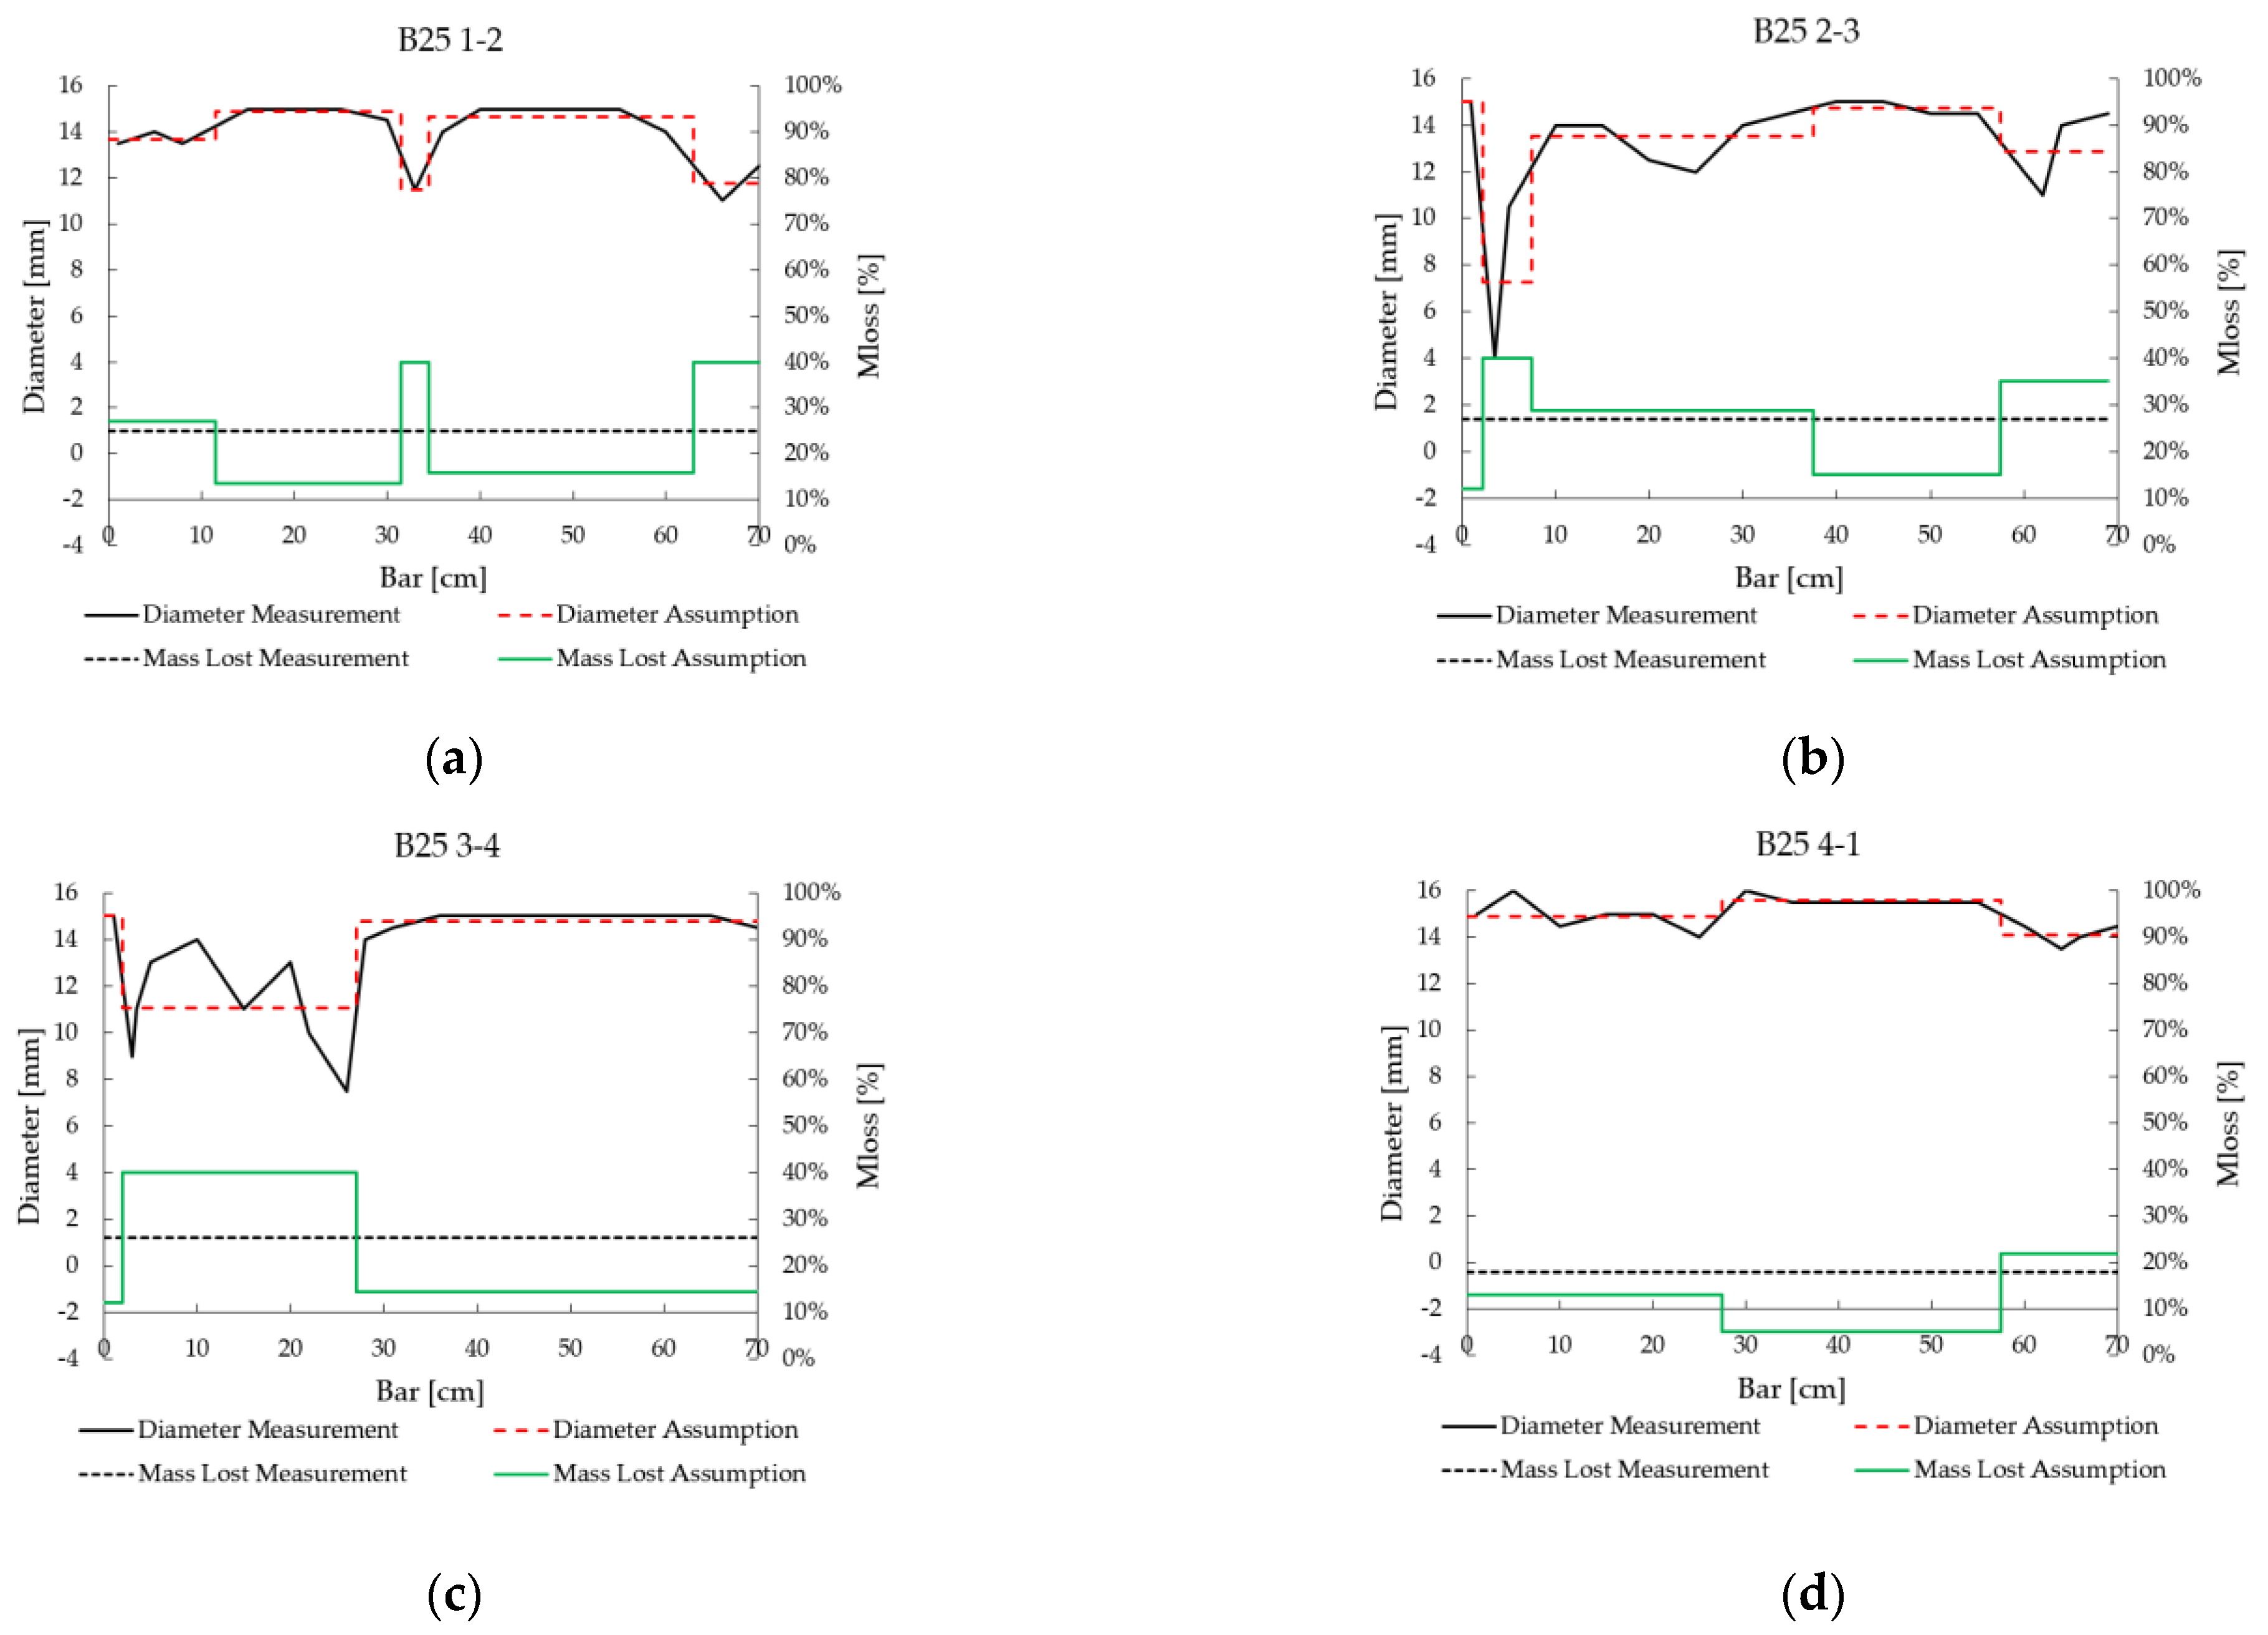
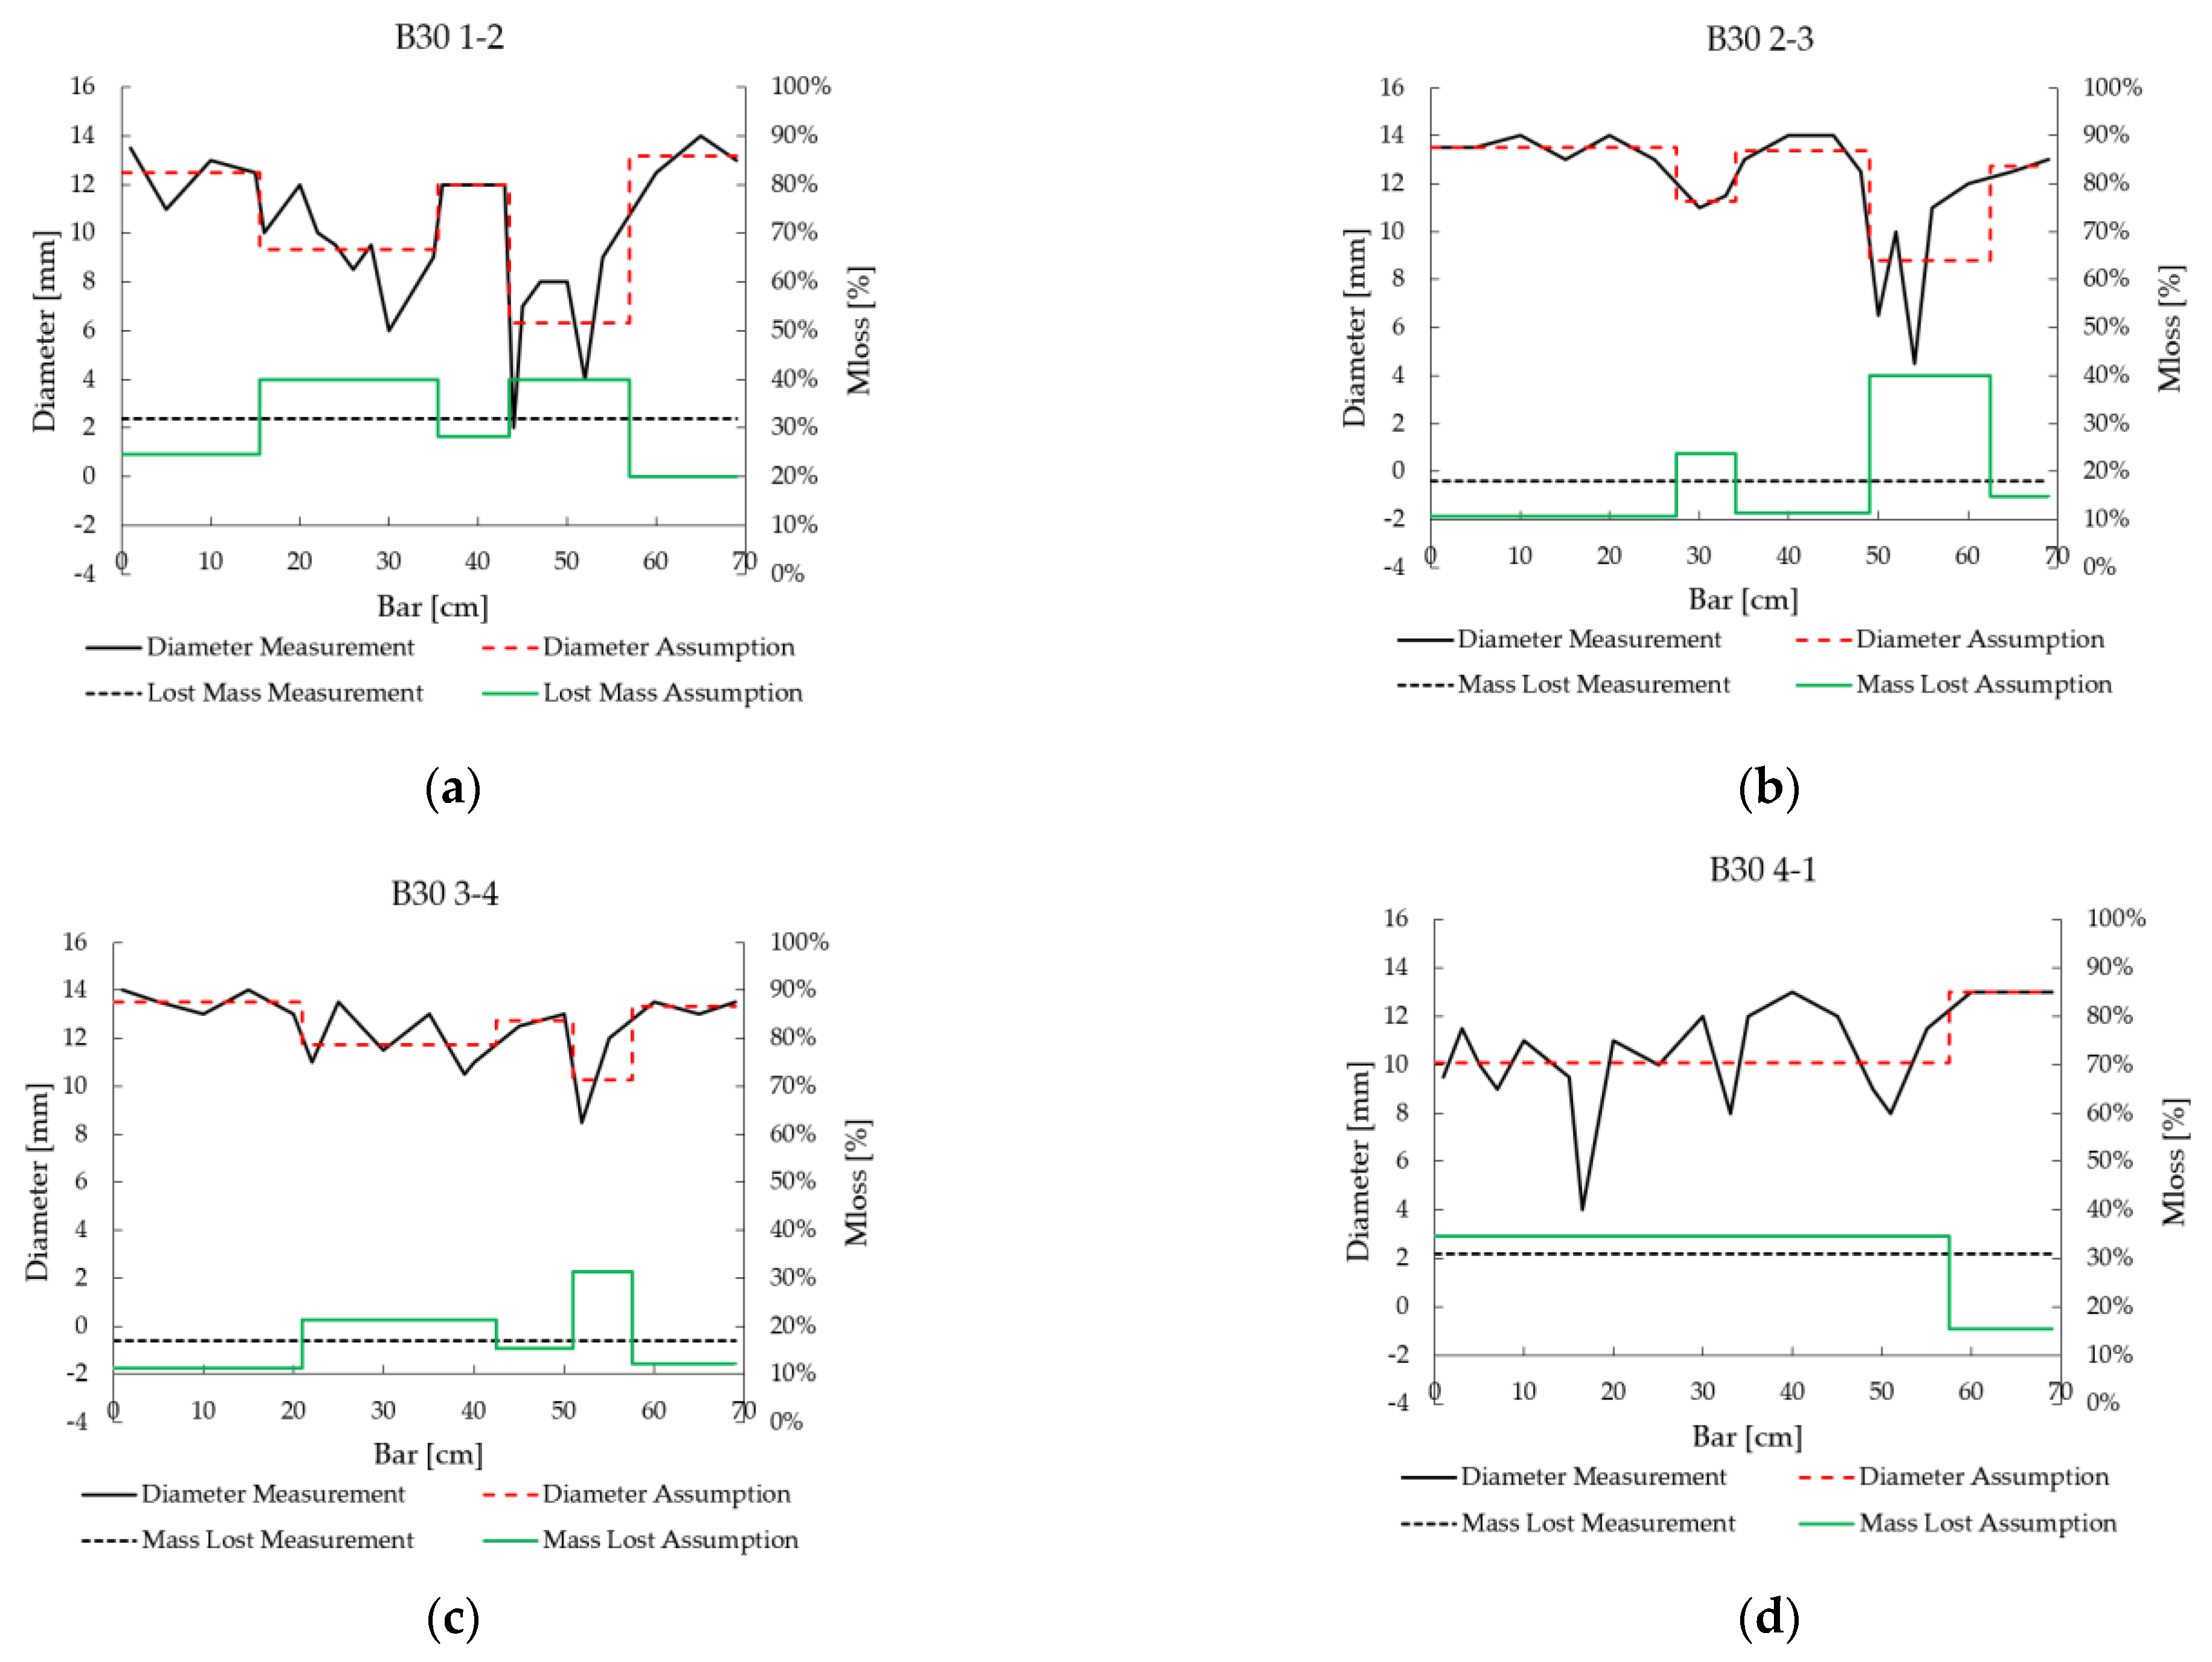
Figure 9 and Figure 10 resume the modelling assumptions made for the “macro-morphology” and “micro-morphology”, respectively. Indeed, the bars’ discretization is shown through the comparison between measured diameter and assumed diameter. Furthermore, the results of the morphology-based mass loss evaluation are reported through a comparison between the measured mass loss and the assumed mass loss. In these figures, the 0 cm progressive distances of the bar correspond to the column-foundation interface, while the progressive 70 cm corresponds to the top of the corroded bar piece. The longitudinal reinforcement is then modeled through connected in series truss bond-slip reinforcement elements, to which reduced constitutive laws are also set, according to [35] in the case of uniform corrosion, as a function of the calculated loss mass of each bar piece.
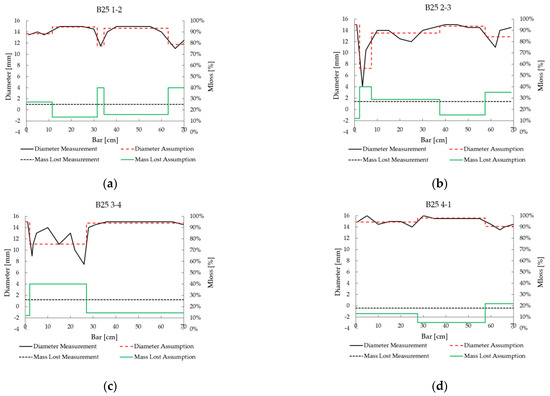
Figure 9.
Assumptions for corroded bars (modelling strategies 3 and 4) compared with original measurement, Specimen B25. (a) Bar 1-2, (b) Bar 2-3, (c) Bar 3-4, (d) Bar 4-1.
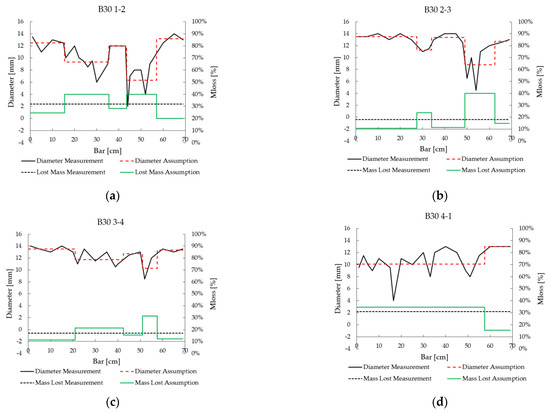
Figure 10.
Assumptions for corroded bars (modelling strategies 3 and 4) compared with original measurement, Specimen B30. (a) Bar 1-2, (b) Bar 2-3, (c) Bar 3-4, (d) Bar 4-1.
3.4. Bond Modelling
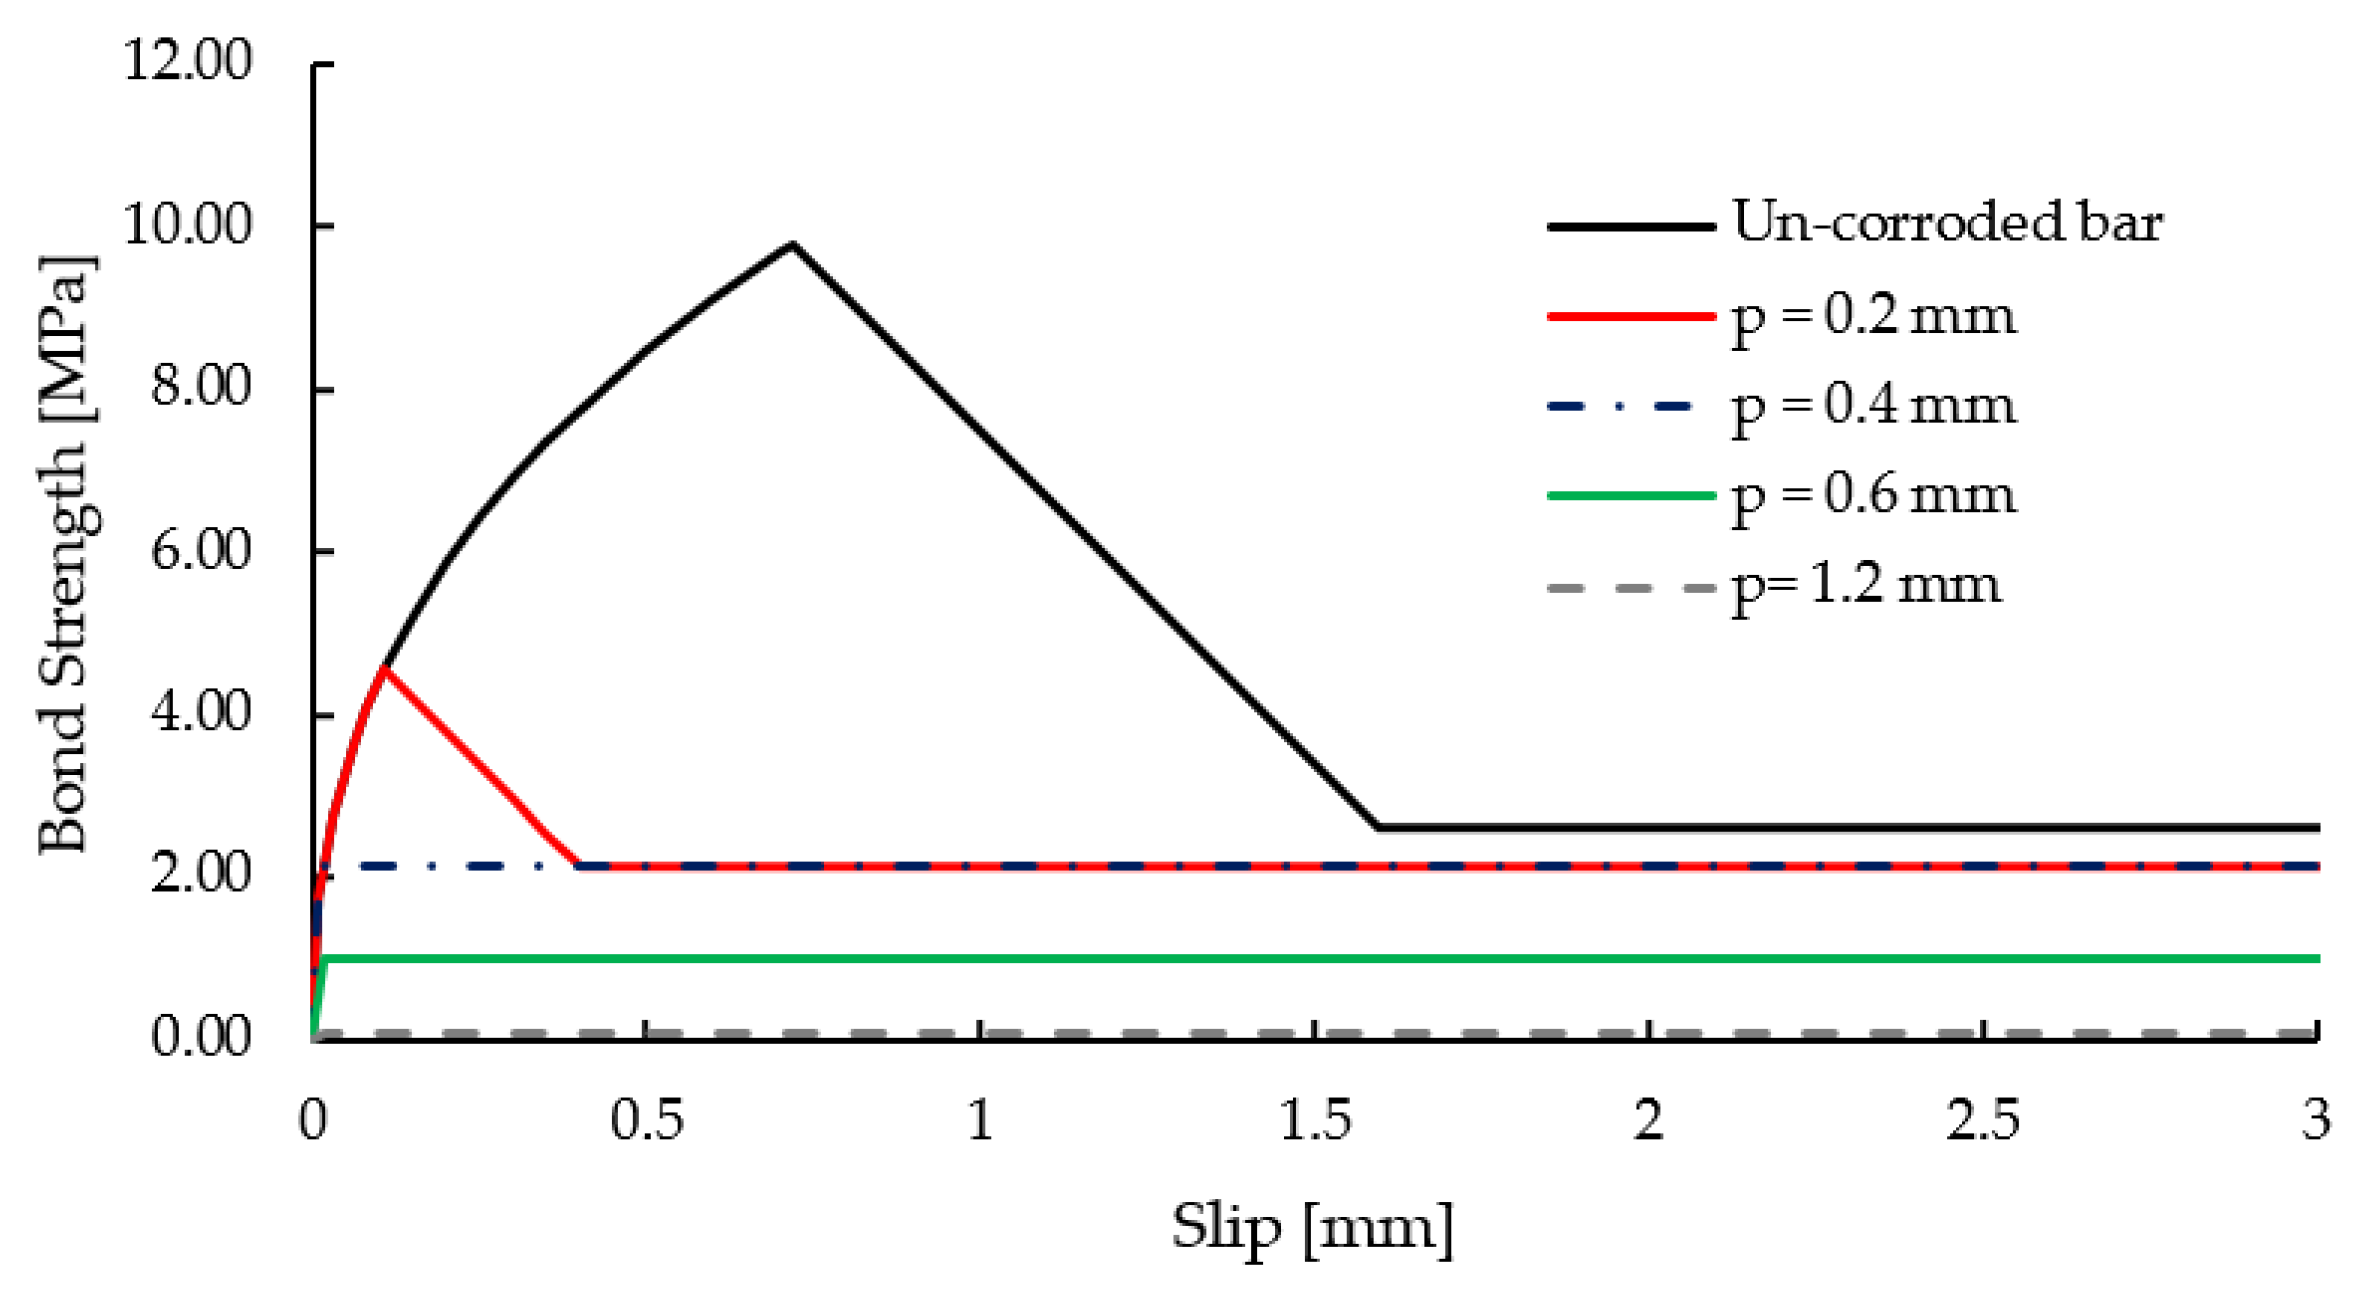
The bond between reinforcement and concrete is modeled according to [32], considering splitting failure and good bond conditions. The differences in the bond laws between the two un-corroded specimens are considered by the different confinement effects given by the stirrups. The expansion of corrosion oxides and the cracking of the concrete cover have a deterioration effect on the bond. Several experimental studies and analytical formulations are available in the literature for the evaluation of the bond between concrete and corroded bars [4,37,38,39]. In this paper, the law proposed by [40], based on regression analyses of experimental data is adopted for the bond degradation as a function of the corrosion penetration. The model accounts for the amount of transverse reinforcement and predicts the residual bond strength, in relationship to either corrosion penetration or surface crack width. These analyses refer to medium-low corrosion levels, i.e., corrosion penetration up to 0.5 mm. In fact, when the corrosion increases, the bond is reduced until the collaboration between steel and concrete is almost negligible. For this reason, beyond a penetration value equal to 1 mm, a perfect plastic frictional bond behaviour with a bond strength value equal to 0.1 MPa [41,42] is considered. In Figure 11 an example of the bond law reduction assumed for the bars of corroded specimens is presented. As regards the unloading/reloading behaviour, the model unloads with a linear stiffness, that is equal to the initial stiffness, until the opposite residual stress value is reached. This stress value is kept until the back-bone curve in the opposite direction can be picked up [30].
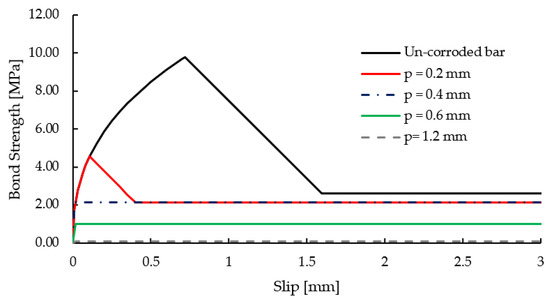
Figure 11.
Example of bond law reduction.
3.5. Expectations about Results
Based on the visual inspection of the reinforcement (Figure 5 and Figure 6) and of the pitting factors R identified through the morphological study described in the previous section (Table 5 and Table 6), it is highlighted that the pitting phenomenon is more pronounced for specimen B30. Vice versa specimen B25 shows a rather uniform corrosion morphology. Based on this evidence, the following authors’ expectations for the B25 specimen are made:
- Modelling strategy 1 could be suitable for capturing the ultimate behaviour of the specimen, while for the pre-yield behaviour there could be some differences with the real response, as an average loss mass value is considered and the influence of the corrosion localization is neglected.
- Modelling strategy 2 should underestimate the capacity of the specimen since the degradation relationships for pitting are too severe in the case of uniform corrosion, as for specimen B25.
- Modelling strategy 3 should improve the result of strategy 1 since the section reduction that is modeled is intrinsically a uniform reduction. Furthermore, considering the geometry of the bar along its length and the relative bond degradation, the stresses in the reinforcement and at the concrete interface should be better understood.
- Modelling strategy 4, which is assumed to be the most complete, should provide the best results, in fact, even if the morphological study did not show strong pitting phenomena, the reduction of the constitutive law is still more refined than the section reduction, as the microscopic effects of corrosion on the bars are considered.
Otherwise, for the B30:
- Modelling strategy 1 should overestimate the ultimate behaviour of the experimental test since medium-high pitting factors were detected for the specimen. Furthermore, it is believed that the results related to the post-cracking behaviour could not be able to provide reliable predictions, since average values of loss mass are used.
- Modelling strategy 2 should better fit the experimental response, with particular reference to the ultimate behaviour, since specific regressions for pitting corrosion are used.
- Modelling strategy 3 should not be suitable for pitting. In particular, the numerical solution could diverge from the real one as the pitting factor could be not representative of the actual condition. Indeed, since the assumption on the section reduction is intrinsically uniform and based on the minimum diameter, generally, the rebar area introduced in the numerical model could be lower than the actual one.
- Modelling strategy 4 should provide better results also in the case of pitting corrosion since the evaluation of the loss mass of each section of the bar is calibrated with the morphological model.
4. Results
4.1. Un-Corroded Specimens
The results of the non-linear numerical analyses, relating to the un-corroded specimens, are shown in Figure 12.
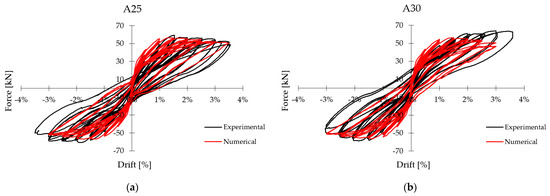
Figure 12.
Comparison between experimental and numerical response, un-corroded columns. (a) specimen B25, (b) specimen B30.
As regards column A25, the main results in terms of load capacity and drift at the maximum capacity are in perfect agreement with the experimental results, as shown in Table 7. For column A30, even if it was not possible to catch the slight asymmetry of the cyclic behaviour, the results of the numerical analyses, reported in Table 7, can be considered satisfactory. Overall, the force-drift cyclic curves obtained through the numerical model show a good fit with the experimental results. The goodness of the results in terms of capacity, displacement, and energy dissipation means that the numerical model is validated by the experimental test and that it represents a reliable base for evaluations regarding the modelling of corroded bars and their effect on the cyclic behaviour of the columns.
Table 7.
Main results of un-corroded specimens, experimental vs. numerical.
4.2. Corroded Specimen
In this section, the numerical results of corroded specimens, with reference to each of the considered modelling strategies, are reported and compared with the reference experimental tests (Section 2). In Table 8 and Table 9 the main results for the different modelling strategies are summarized respectively for columns B25 and B30, in terms of maximum load, drift at the maximum load, and percentage difference of the numerical load capacity with respect to the experimental one.
Table 8.
Main results of corroded specimens B25, experimental vs. numerical.
Table 9.
Main results of corroded specimens B30, experimental vs. numerical.
4.2.1. Modelling Strategy 1
It is worth reminding that in this strategy the constitutive laws of steel are reduced as a function of the loss mass, that was measured directly on the bars, following the experimental tests. The numerical results, compared with the experimental ones, are reported in Figure 13.

Figure 13.
Comparison between experimental and numerical response, corroded specimens, MS 1. (a) column B25, (b) column B30.
The cyclic behaviour, characterized by pinching, is well-caught thanks to the bond reduction, which in the loading and unloading phase reduces the collaboration between steel and concrete. The latter aspect, however, in a modelling strategy that does not consider the variation of the section along the bar, leads to excessive slip of the bars with the consequent over-estimation of the yield drift. The crack patterns obtained through numerical simulations are in good agreement with the experimental observations, with the formation of base cracks that open and close during the cycles as shown below. This crack is precisely due to the bond losses and reinforcement sliding, which also reduces the energy dissipation. Similar comments can be drawn for column B30: a good approximation of the ultimate load, but a poor prediction of the pre-yield behaviour are found. Furthermore, given the reduction of the mechanical properties due to uniform corrosion, an overestimation of the capacity was expected for the column with pitting phenomenon, as B30. As a matter of fact, this outcome is obtained in the negative load direction only. The main results for the numerical cyclic behaviour of modelling strategy 1 are reported in Table 8 and Table 9.
4.2.2. Modelling Strategy 2
In this case, the constitutive law of the reinforcement rebars was reduced with the pitting corrosion degradation relationship as a function of the mass lost by the reinforcement. The numerical cyclic responses for specimens B25 and B30 are reported in Figure 14a, b respectively. Results for B25, reported in Table 8, showed an incorrect prediction of the cyclic behaviour. Neither the ultimate behaviour nor the one preceding the reinforcement yielding are accurately captured and the cyclic dissipation is underestimated. All these results were expected since the reduction of the bond by pitting is too severe for a column that has shown signs of roughly uniform corrosion. The analyses for specimen B30 are not entirely satisfactory. In fact, for this column, which is most affected by pitting, a good fit with the ultimate behaviour was expected. Instead, the numerical result slightly underestimates the experimental one in the positive load direction, while in the negative direction a good fit is obtained. This result may be acceptable since the degradation relationships for pitting used in [35] are made by data regression on several experimental campaigns, therefore a slightly lower reliability of the results is attended when the bars are heavily corroded (i.e., positive load direction). As regards the cyclic behaviour, the same considerations made for specimen B25 apply. This outcome demonstrates/confirms that in case of localization of corrosion in the bar, assuming an average value of mass loss for the whole bar can be misleading and can lead to results different from the real behaviour in the pre-yielding stage.
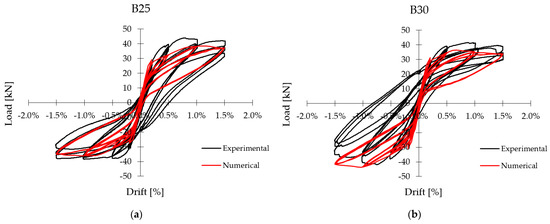
Figure 14.
Comparison between experimental and numerical response, corroded specimens, MS 2. (a) Column B25, (b) Column B30.
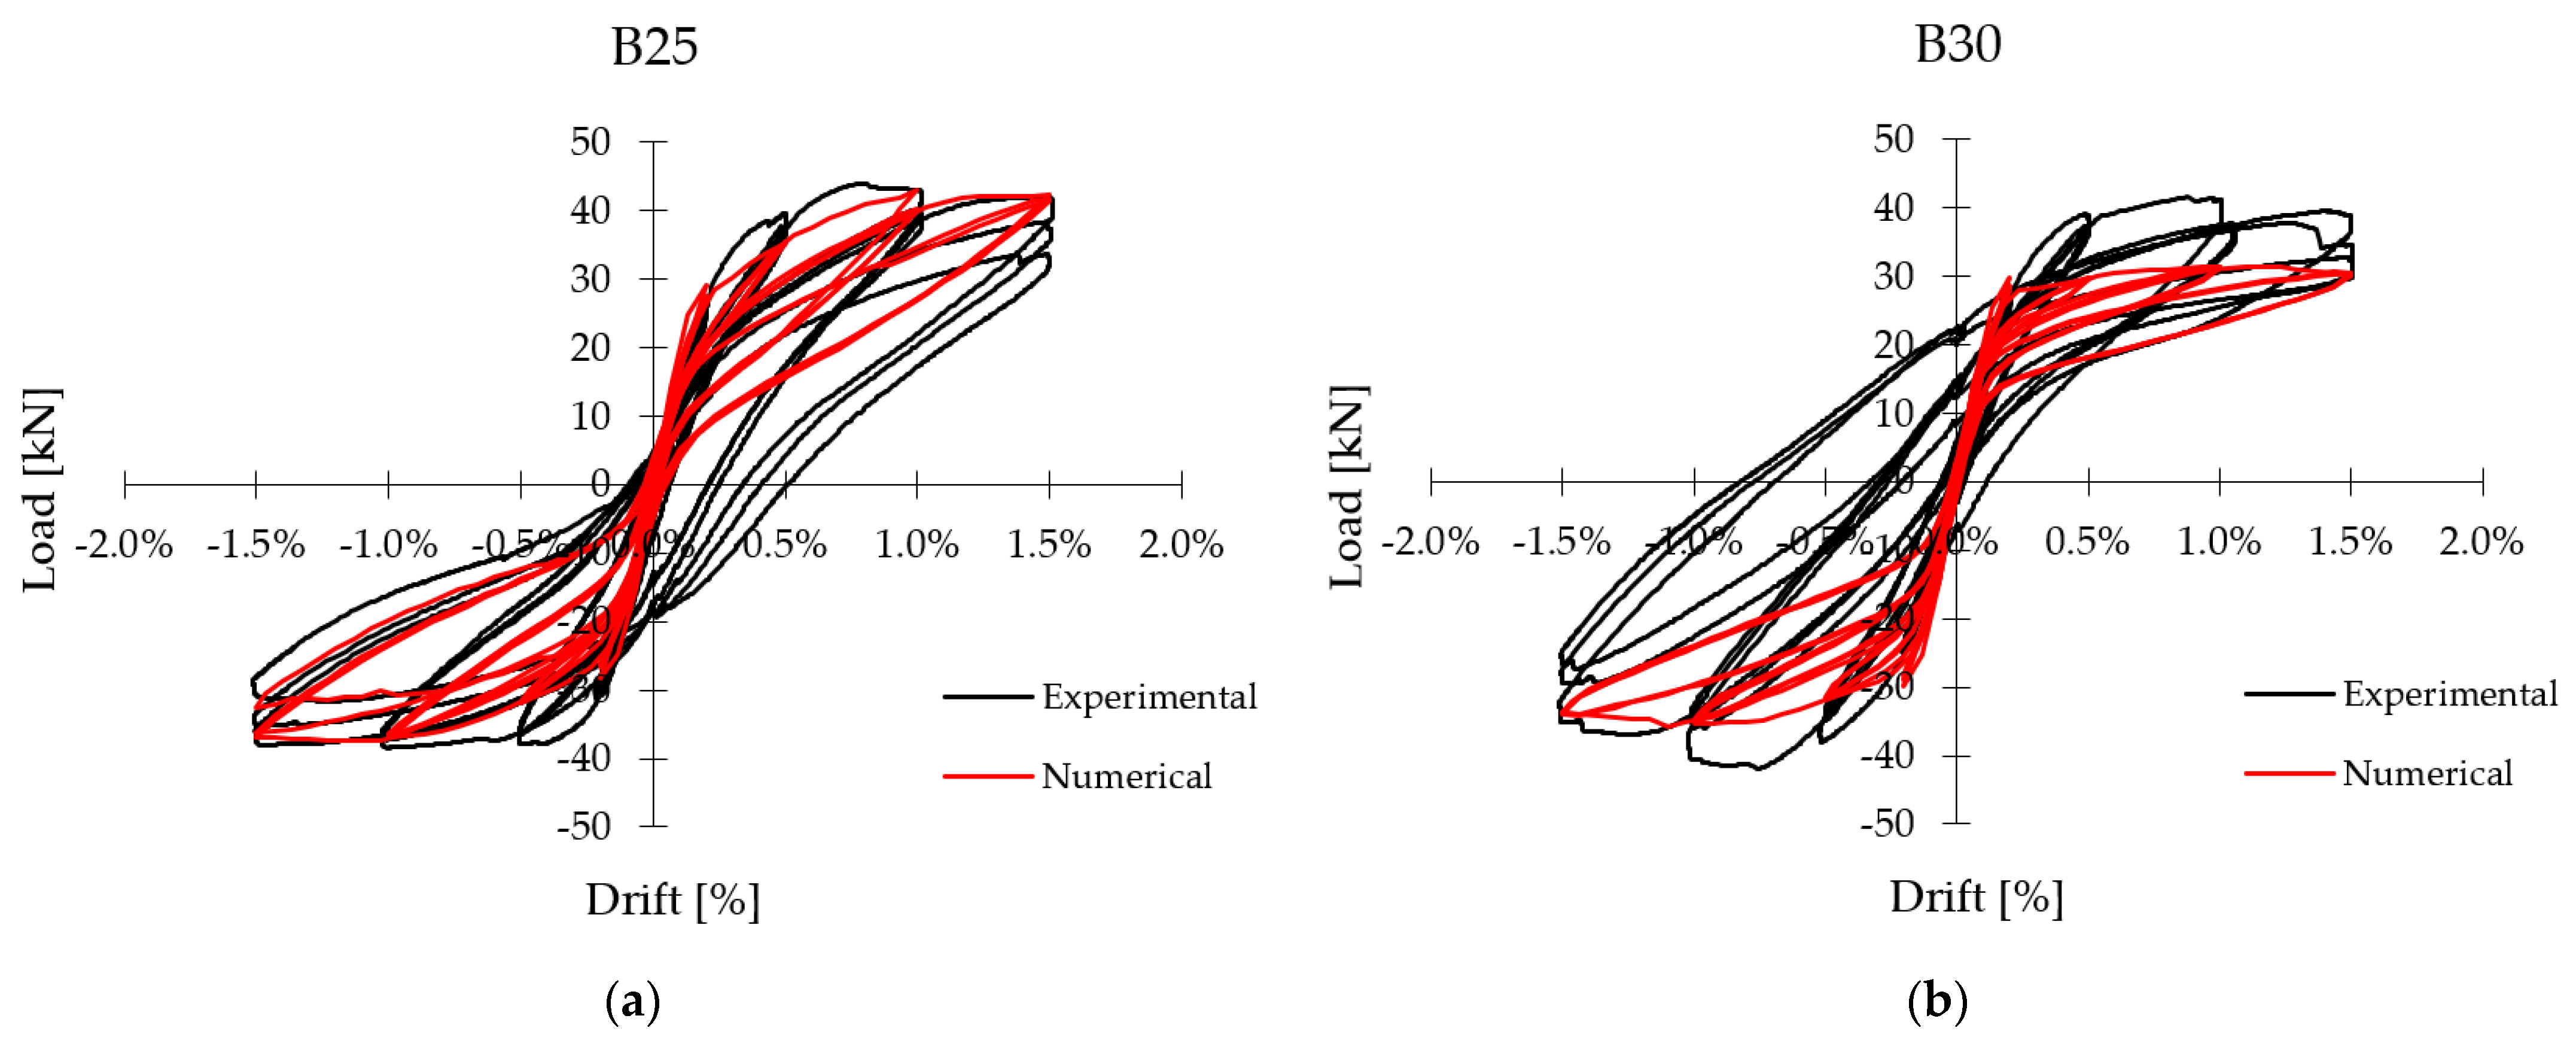
4.2.3. Modelling Strategy 3
In this strategy, every single corroded bar was modeled with connected in series truss bond-slip elements, having attributed to each one an equivalent section based on the measurements performed directly on the bar. The numerically predicted behaviours for specimens B25 and B30 are reported in Figure 15. The main results are listed in Table 8 and Table 9 respectively.

Figure 15.
Comparison between experimental and numerical response, corroded columns, MS 3. (a) Column B25, (b) Column B30.
It can be noted that for specimen B25 the results of the numerical analyses improve if compared to the two previous modelling strategies. A better fit of the post cracking behaviour is identified. Indeed, if the bar is discretized in pieces and constitutive law and bond law are assigned to each part, the stresses in the bar and at the interface with the concrete are better predicted. Furthermore also cyclic dissipation and crack patterns are better described than in previous strategies.
As expected, the result of specimen B30 excessively underestimates the observed experimental response. This outcome was predictable since the section reduction was based on the minimum measured diameter, neglecting the actual pitting morphology (Figure 7). In any case, the results of the numerical analysis, even if they are not able to validate this model for the pitting, confirm that column B30 is affected by the pitting phenomenon and what emerged from the morphological analysis reported in Section 3.
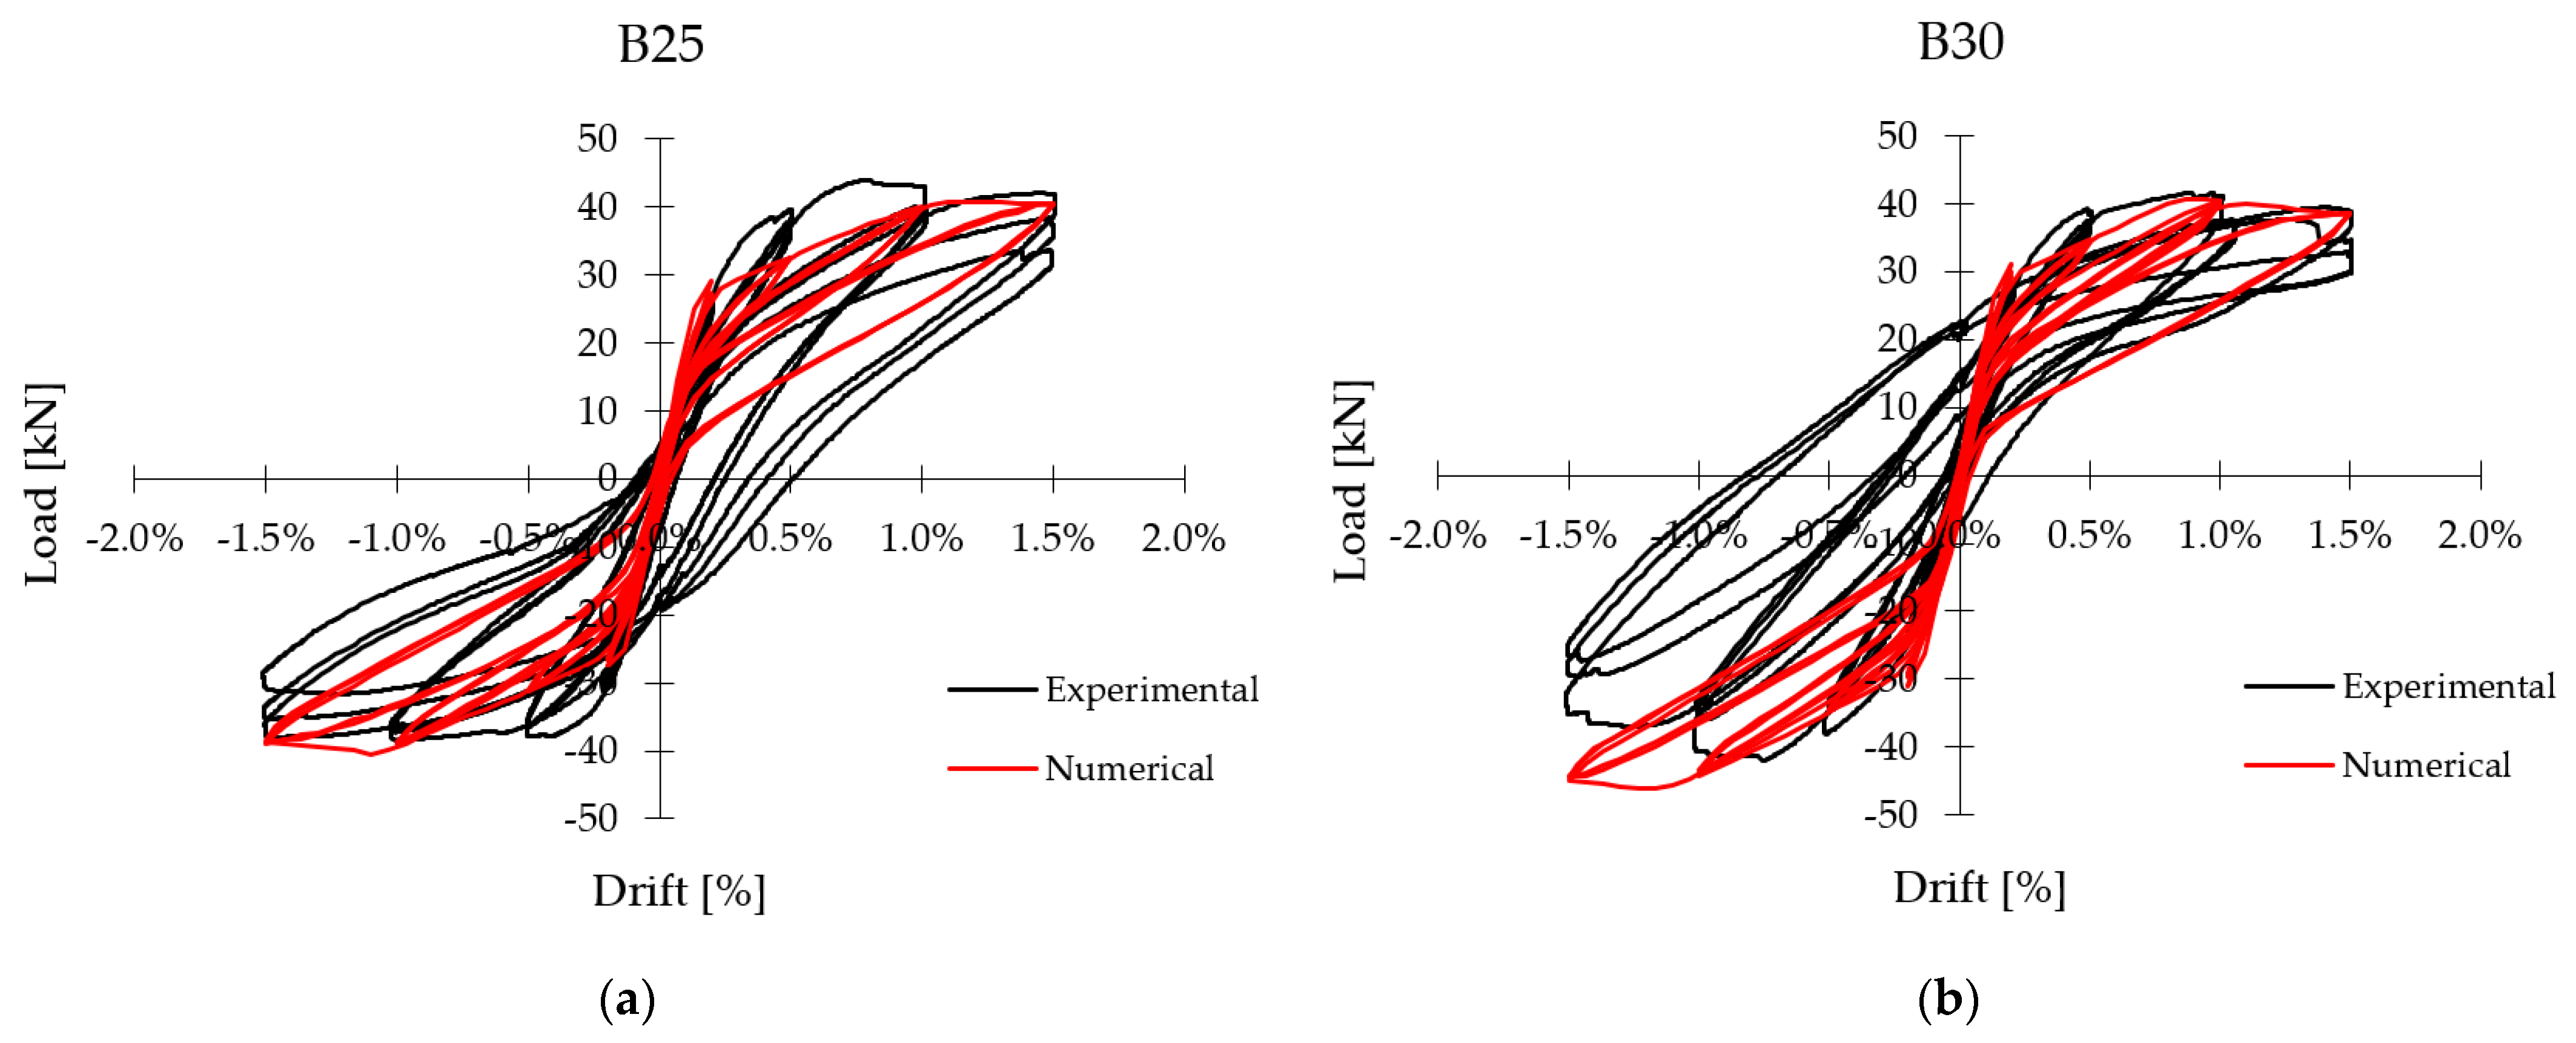
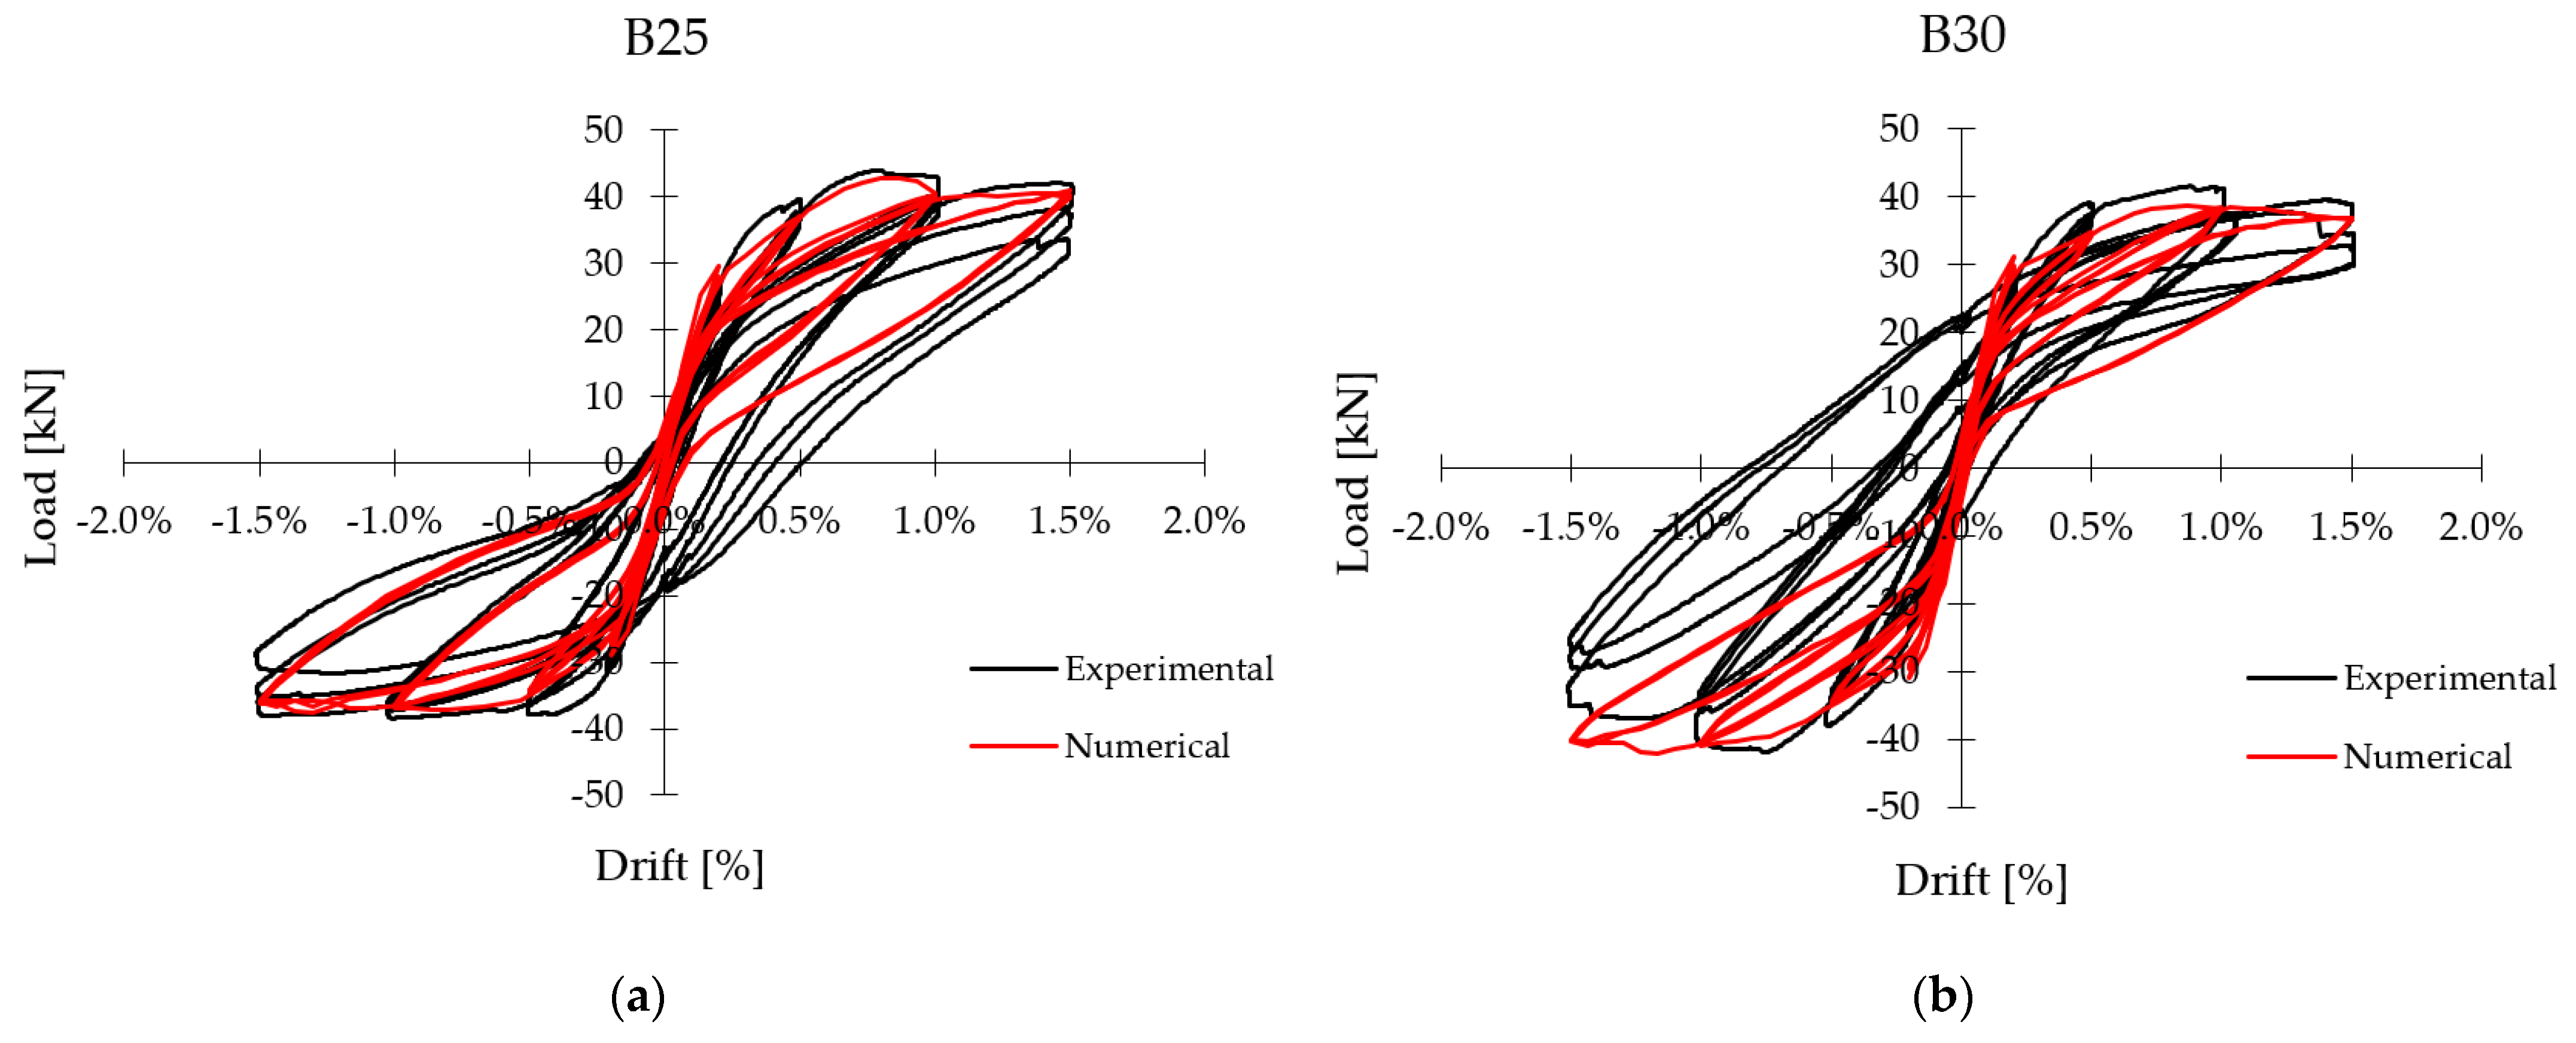
4.2.4. Modelling Strategy 4
The aim of strategy 4 is the modelling of the phenomenon as detailed as possible, considering both the corrosion localization along the bar (macro-morphology) and the corrosion morphology in the cross-section of the bar (micro-morphology). The benefits in terms of fitting the numerical curves emerge from the comparison with the experimental results (Figure 16). About the B25 column, it can be noted that the behaviour in the post-cracking phase has been improved. In fact, both the capacity and the drift for which the first crack and the yielding of the reinforcements occur are captured. Likewise, the ultimate behaviour of the column has been correctly identified. The cyclic dissipation is in agreement with the experimental results, as well as the cracking pattern as shown below. The latter is, also in this case, governed by the formation of the main crack at the base of the column, in which the reinforcements, given the reduction of the bond, slide exchanging minimum stresses with the concrete. This aspect is found in the pinching that characterizes the response curves. In conclusion, the results of the analyses confirm that the numerical model is very suitable for the prediction of the cyclic behaviour of reinforced concrete columns subjected to roughly uniform corrosion. The considerations made concerning column B25 are also valid for column B30. The model provides satisfactory results and is therefore validated by the experimental test. Compared to the other modelling strategies, the results considerably improve, confirming the importance of the morphological study explained in Section 3. Still, a slight underestimation of the capacity in the positive load direction is observed for column B30, but it is considered acceptable.
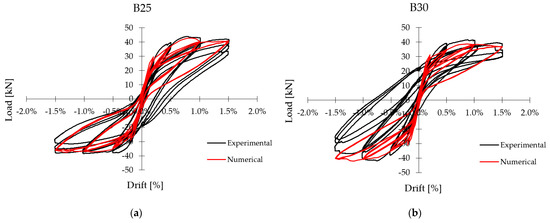
Figure 16.
Comparison between experimental and numerical response, corroded specimens, MS 4. (a) column B25, (b) column B30.
5. Discussion
In the previous section, the main results relating to the numerical models for both specimens B25 and B30 and the proposed modelling strategies have been reported. In general, the authors’ expectations regarding the model responses were largely met. From the comparison with the experimental results, it emerged that the modelling strategies based on the constitutive law and bond law reduction as a function of the average loss mass of the corroded bars (i.e., modelling strategies 1 and 2) are suitable for the prediction of the ultimate capacity of the structure. Furthermore, it is noted how, attributing distinct values of the bars’ mass loss (instead of a single value for all the bars of the column), allows to catch the cyclic asymmetrical behaviour due to corrosion, as in the case of the column B30. As regards the post-cracking behaviour, it emerged that these strategies (MS 1 and 2) may underestimate the capacity and overestimate the yielding displacement. The authors believe that this deficiency is linked to the fact that the variation of corrosion along the bar is neglected and therefore neither the possible localized bar section reductions nor good bond areas are considered. These strategies risk being not accurate for the prediction of the Damage Control Limit State in the seismic performance assessment, especially as the corrosion degree increases, since the formulations available in the literature are affected by high results’ dispersion. The authors also noted that the results for pitting corrosion could be more inaccurate than those for uniform corrosion and therefore believe that, given the danger of the phenomenon, new experimental campaigns must be conducted for the pitting degradation relationship of reinforcements, focusing on the localization of the corroded areas and the influence of the pits. The results relating to modelling strategies 3 and 4 showed that considering detailed micro and macro morphological aspects allows improving the predictivity of the model in main aspects related to the cyclic behaviour of the corroded columns. While strategy 3 proved to be suitable only for columns characterized by roughly uniform corrosion, strategy 4 proved to be very suitable for both specimens and therefore for both types of corrosion. It is also underlined that in addition to the force-drift curves, the numerical models are in agreement with the experimental results with regard to the cracking pattern. This, for corroded columns, is characterized by the opening of a main crack close to the base of the column and by the cyclic slipping of the reinforcement, with a reduction of the collaboration between steel and concrete and of the energy dissipation, as it is emphasized by the pinching in the force-drift curves. Figure 17 shows an example of comparison between the cracking pattern numerically and experimentally obtained.
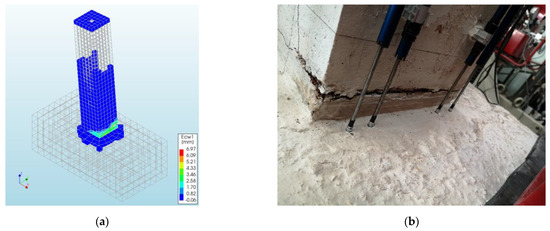
Figure 17.
Comparison between cracking pattern, numerical vs. experimental, column B25, drift = −1.5%. (a) Numerical, (b) Experimental.
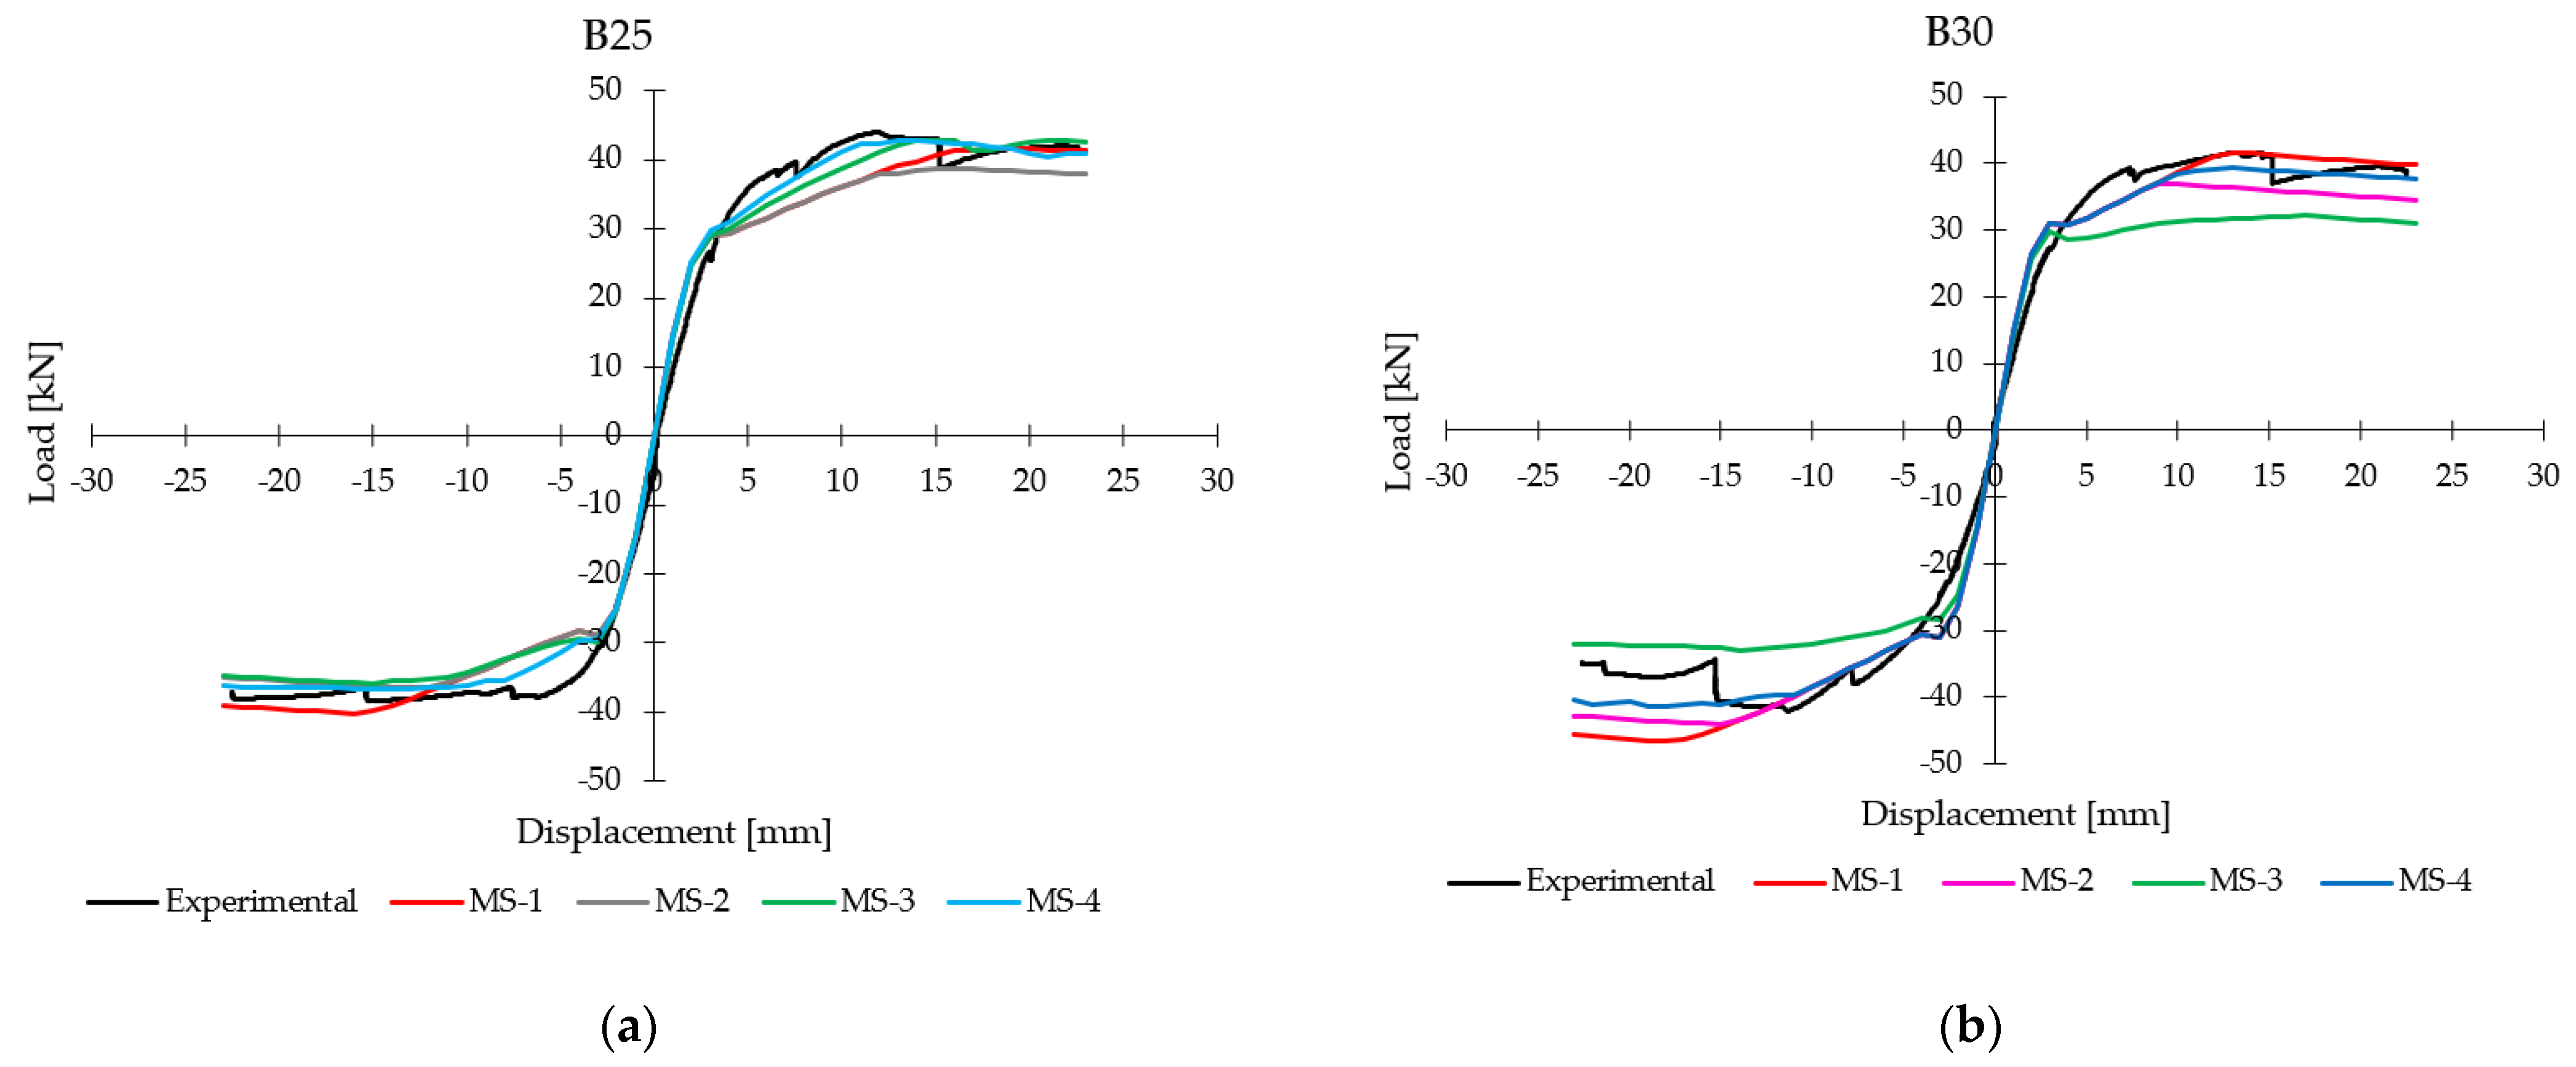
The results of the four strategies of numerical analyses and the experimental response have been superimposed in terms of monotonic load-displacement curves, obtained as envelopes of the cyclic ones in Figure 18a,b relatively for B25 and B30.
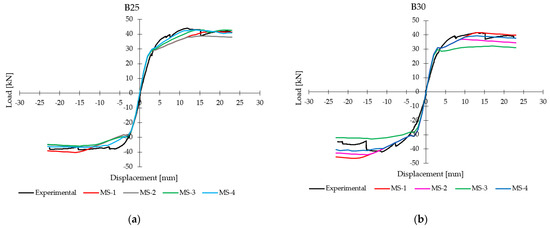
Figure 18.
Comparison between experimental and numerical response, monotonic curves. (a) Column B25; (b) column B30.
From the comparison, the coherence between the models emerges. In particular, strategy 4 stands out for being close to 1 in the case of uniform corrosion and instead tends to migrate towards strategy 2 in the case of pitting corrosion. It should be noted that numerical models tend to underestimate the energy dissipated by the specimens. As mentioned in Section 3.2, this can be due to the model adopted for the concrete (TSCM), that tends to underestimate the energy dissipation of the concrete, and also due to some asymmetric sliding shear phenomena verified during the tests, not fully captured by the numerical model. Finally, it is also noted that almost no model is able to capture the cyclic degradation of strength by a shear mechanism, which can be seen in the last cycles of the experimental tests of corroded columns. These results can be justified by the numerical assumption of considering an average corrosion level in the stirrups, since no detailed measurements are available for the transversal reinforcement.
6. Conclusions
In this work, the cyclic behaviour of RC columns subjected to localized corrosion in the plastic hinge regions was investigated through FE modelling and non-linear analyses. The validation of the numerical models was performed through the comparison with the results of an experimental campaign carried out by some of the authors. Particular attention was paid to the modelling of the corroded rebars and their corrosion morphology. The comparison between the numerical results showed how the most common modelling strategies, which operate according to the section or constitutive law reduction as a function of the average corrosion of the bars, are suitable for the evaluation of the ultimate capacity. Nevertheless, given the uncertainties that characterize the phenomenon from the morphological point of view, they may present deficiencies in the seismic performance assessment (i.e., at the Damage Control performance stage). The strategies based on the morphological study of the corroded bars show, instead, a very good fit for all the cyclic behaviours. The results, therefore, demonstrated how the behaviour of the RC corroded columns depends both on the nature of corrosion (uniform vs. pitting) and on the localization of damage along with the structural element, both on aspects of a random nature that affect the structural response. However, it must be considered that the most refined modelling strategies are difficult to implement for the assessment of real existing structures, as they make use of detailed data and measurements that cannot be obtained with the same precision through on-site surveys. The authors, therefore, believe that to maintain the easy application approach based on the reduction of the constitutive law as a function of the mean mass loss, a new experimental campaign for the mechanical behaviour of corroded bars, which focuses on pitting and localization, is necessary. Furthermore, the assessment of corroded existing RC structures should take into account the probabilistic aspects of the morphology of the corrosion phenomenon.
Author Contributions
Conceptualization, F.M., F.D.C. and Z.R.; methodology, F.M., F.D.C. and Z.R.; formal analysis, F.M.; writing—original draft preparation, F.M.; writing—review and editing, F.M., F.D.C. and Z.R. All authors have read and agreed to the published version of the manuscript.
Funding
This research received no external funding.
Institutional Review Board Statement
Not applicable.
Informed Consent Statement
Not applicable.
Data Availability Statement
Some or all data that support the findings of this study are available from the corresponding author upon reasonable request.
Conflicts of Interest
The authors declare no conflict of interest.
References
- Cairns, J.; Plizzari, G.A.; Du, Y.; Law, D.W.; Franzoni, C. Mechanical properties of corrosion-damaged reinforcement. ACI Mater. J. 2005, 102, 256–264. [Google Scholar]
- Imperatore, S.; Rinaldi, Z. Mechanical behaviour of corroded rebars and influence on the structural response of R/C elements. In Proceedings of the 2nd International Conference on Concrete Repair, Rehabilitation and Retrofitting, Cape Town, South Africa, 24–26 November 2008; CRC Press Balkema: Boca Raton, FL, USA, 2008. [Google Scholar]
- Almusallam, A.A.; Al-Gahtani, A.S.; Aziz, A.R. Effect of reinforcement corrosion on bond strength. Constr. Build. Mater. 1996, 10, 123–129. [Google Scholar] [CrossRef]
- Coronelli, D. Corrosion cracking and bond strength modelling for corroded bars in reinforced concrete. ACI Struct. J. 2002, 99, 267–276. [Google Scholar]
- Prieto, M.; Tanner, P.; Andrade, C. Bond response in structural concrete with corroded steel bars. Experimental results. In Modelling of Corroding Concrete Structures; RILEM Book Series; Springer: Dordrecht, The Netherlands, 2011; Volume 5, pp. 231–241. [Google Scholar]
- Coccia, S.; Imperatore, S.; Rinaldi, Z. Influence of corrosion on the bond strength of steel rebars in concrete. Mater. Struct. 2016, 49, 537–551. [Google Scholar] [CrossRef]
- Rodriguez, J.; Ortega, L.; Casal, J.; Diez, J.M. Assessing structural conditions of concrete structures with corroded reinforcement. In Proceedings of the International Conference on Concrete in the Service of Mankind, Dundee, UK, 24–26 June 1996. [Google Scholar]
- Cairns, J. Assessment of effects of reinforcement corrosion on residual strength of deteriorating concrete structures. In Proceedings of the First International Conference on Behaviour of Damaged Structures, Rio de Janeiro, Brazil, May 1998; Federal University of Fluminense: Niteroi, Brazil, 1998. [Google Scholar]
- Castel, A.; Francois, R.; Arligue, G. Mechanical behaviour of corroded reinforced concrete beams—Part 1: Experimental study of corroded beams. Mater. Struct. 2000, 33, 539–544. [Google Scholar] [CrossRef]
- Coronelli, D.; Gambarova, P.G. Structural assessment of corroded reinforced concrete beams: Modelling guidelines. ASCE J. Struct. Eng. 2004, 130, 1214–1224. [Google Scholar] [CrossRef]
- Rinaldi, Z.; Valente, C.; Pardi, L. A simplified methodology for the evaluation of the residual life of corroded elements. Struct. Infrastruct. Eng. Main Manag. Life-Cycle Des. Perform. 2008, 4, 139–152. [Google Scholar] [CrossRef]
- Rinaldi, Z.; Imperatore, S.; Valente, C. Experimental evaluation of the flexural behaviour of corroded P/C beams. Constr. Build. Mater. 2010, 24, 2267–2278. [Google Scholar] [CrossRef]
- Zhang, W.; Liu, X.; Gu, X. Fatigue behaviour of corroded prestressed concrete beams. Constr. Build. Mater. 2016, 106, 198–208. [Google Scholar] [CrossRef]
- Lee, H.S.; Kage, T.; Noguchi, T.; Tomosawa, F. An experimental study on the retrofitting effects of reinforced concrete columns damaged by rebar corrosion strengthened with carbon fiber sheets. Cem. Concr. Res. 2003, 33, 563–570. [Google Scholar] [CrossRef]
- Meda, A.; Mostosi, S.; Rinaldi, Z.; Riva, P. Experimental evaluation of the corrosion influence on the cyclic behaviour of RC columns. Eng. Struct. 2014, 76, 112–123. [Google Scholar] [CrossRef]
- Yang, S.Y.; Song, X.B.; Jia, H.X.; Chen, X.; Liu, X.L. Experimental research on hysteretic behaviours of corroded reinforced concrete columns with different maximum amounts of corrosion of rebar. Constr. Build. Mater. 2016, 121, 319–327. [Google Scholar] [CrossRef]
- Ma, G.; Li, H.; Hwang, H.J. Seismic behaviour of low-corroded reinforced concrete short columns in an over 20-year building structure. Soil Dyn. Earthq. Eng. 2018, 106, 90–100. [Google Scholar] [CrossRef]
- Rajput, A.S.; Sharm, U.K. Corroded reinforced concrete columns under simulated seismic loading. Eng. Struct. 2018, 171, 453–463. [Google Scholar] [CrossRef]
- Ma, Y.; Che, Y.; Gong, J. Behaviour of corrosion damaged circular reinforced concrete columns under cyclic loading. Constr. Build. Mater. 2012, 29, 548–556. [Google Scholar] [CrossRef]
- Liu, X.; Jiang, H.; He, L. Experimental investigation on seismic performance of corroded reinforced concrete moment-resisting frames. Eng. Struct. 2017, 153, 639–652. [Google Scholar] [CrossRef]
- Cardone, D.; Perrone, G.; Sofia, S. Experimental and numerical studies on the cyclic behaviour of R/C hollow bridge piers with corroded rebars. Earthq. Struct. 2013, 4, 41–62. [Google Scholar] [CrossRef]
- Vecchi, F.; Belletti, B. Capacity Assessment of Existing RC Columns. Buildings 2021, 11, 161. [Google Scholar] [CrossRef]
- Di Carlo, F.; Meda, A.; Rinaldi, Z. Numerical evaluation of the corrosion influence on the cyclic behaviour of RC columns. Eng. Struct. 2017, 153, 264–278. [Google Scholar] [CrossRef]
- Vu, N.S.; Yu, B.; Li, B. Prediction of strength and drift capacity of corroded reinforced concrete columns. Constr. Build. Mater. 2016, 115, 304–318. [Google Scholar] [CrossRef]
- Biswas, R.K.; Iwanami, M.; Chijiwa, N.; Nakayama, K. Structural assessment of the coupled influence of corrosion damage and seismic force on the cyclic behaviour of RC columns. Constr. Build. Mater. 2021, 304, 124706. [Google Scholar] [CrossRef]
- fib Bulletin No. 34. Model Code for Service Life Design; fib: Lausanne, Switzerland, 2006. [Google Scholar] [CrossRef]
- Di Carlo, F.; Isabella, P.; Rinaldi, Z.; Spagnuolo, S. Influence of localized corrosion on the experimental response of R.C. columns under horizontal actions. In Proceedings of the Italian Concrete Days 2020, Naples, Italy, 14–17 April 2021. [Google Scholar]
- Vecchio, F.J.; Collins, M.P. Modified Compression-Field Theory for Reinforced Concrete Elements Subjected To Shear. J. Am. Concr. Inst. 1986, 83, 219–231. [Google Scholar] [CrossRef]
- Selby, R.G.; Vecchio, F.J. Three-Dimensional Constitutive Relations for Reinforced Concrete; Technical Report 93-02; University of Toronto, Dept. of Civil Engineering: Toronto, ON, Canada, 1993. [Google Scholar]
- User’s Manual–Release 10.5. Available online: Dianafea.com/manuals/d105/Diana.html (accessed on 23 September 2021).
- Feenstra, P.H. Computational Aspects of Biaxial Stress in Plain and Reinforced Concrete; Delft University of Technology: Delft, The Netherlands, 1993; 159p. [Google Scholar]
- fib Model Code for Concrete Structures 2010. Available online: http://hdl.handle.net/1854/LU-4255771 (accessed on 23 September 2021). [CrossRef]
- Rots, J.G. Computational Modelling of Concrete Fracture. Ph.D. Thesis, Delft University of Technology, Delft, The Netherlands, 1988. [Google Scholar]
- Menegotto, M.; Pinto, P.E. Method of Analysis for Cyclically Loaded RC Plane Frames Including Changes in Geometry and Non-Elastic Behaviour of Elements under Combined Normal Force and Bending. In Proceedings of the IABSE Symposium on Resistance and Ultimate Deformability of Structures Acted on by Well Defined Loads, Lisboa, Portugal, 1973; pp. 15–22. [Google Scholar]
- Imperatore, S.; Rinaldi, Z.; Drago, C. Degradation relationships for the mechanical properties of corroded steel rebars. Constr. Build. Mater. 2017, 148, 219–230. [Google Scholar] [CrossRef]
- Val, D.V.; Melchers, R.E. Reliability of Deteriorating RC Slab Bridges. J. Struct. Eng. 1997, 123, 1638–1644. [Google Scholar] [CrossRef]
- Bhargava, K.; Ghosh, A.; Mori, Y.; Ramanujam, S. Suggested empirical models for corrosion-induced bond degradation in reinforced concrete. J. Struct. Eng. 2008, 134, 221–230. [Google Scholar] [CrossRef]
- Wang, X.; Liu, X. Bond strength modelling for corroded reinforcements. Constr. Build. Mater. 2006, 20, 177–186. [Google Scholar] [CrossRef]
- Tariq, F.; Bhargava, P. Post corrosion bond-slip models for super ductile steel with concrete. Constr. Build. Mater. 2021, 285, 122836. [Google Scholar] [CrossRef]
- Koulouris, K.; Apostolopoulos, C. Study of the residual bond strength between corroded steel bars and concrete—A comparison with the recommendations of fib model code 2010. Metals 2021, 11, 757. [Google Scholar] [CrossRef]
- Lee, H.S.; Noguchi, T.; Tomosawa, F. Evaluation of the bond properties between concrete and reinforcement as a function of the degree of reinforcement corrosion. Cem. Concr. Res. 2002, 32, 1313–1318. [Google Scholar] [CrossRef]
- Blomfors, M.; Zandi, K.; Lundgren, K.; Coronelli, D. Engineering bond model for corroded reinforcement. Eng. Struct. 2018, 156, 394–410. [Google Scholar] [CrossRef]


Publisher’s Note: MDPI stays neutral with regard to jurisdictional claims in published maps and institutional affiliations. |
© 2021 by the authors. Licensee MDPI, Basel, Switzerland. This article is an open access article distributed under the terms and conditions of the Creative Commons Attribution (CC BY) license (https://creativecommons.org/licenses/by/4.0/).