Article

Analysis of the Water Quality Characteristics of Urban Streams Using the Flow–Pollutant Loading Relationship and a Load Duration Curve (LDC)

Department of Civil & Environmental Eng., Incheon National University, Academy-ro 119, Yeonsu-gu, Incheon 22012, Korea
*
Author to whom correspondence should be addressed.
Appl. Sci. 2021, 11(20), 9694; https://doi.org/10.3390/app11209694
Submission received: 8 September 2021 / Revised: 29 September 2021 / Accepted: 12 October 2021 / Published: 18 October 2021

Abstract

:
For urban streams, wastewater inflow makes water quality management difficult. This study attempted to analyze the water quality characteristics and pollution sources for the efficient management of water quality in the upper, middle, and lower Gul-po stream reaches. The water quality and flow characteristics for each point were analyzed using five-year water quality and flow discharge data at Gul-po stream from 2016 to 2020. The results showed that the flow increased and the water quality improved in the upper part of the stream, under the influence of a treated water discharge. The flow–pollutant loading equation revealed that the flow coefficient (slope of the regression equation) values of the water quality characteristics, except T-N, were lower than 1 in the upper part, indicating that the water quality decreased as the flow increased. In the middle and lower parts, the flow index values of the water quality characteristics, except T-N, were greater than 1, indicating that the water quality increased with the flow. For the middle and lower parts, the overage rate of target water quality by the Ministry of Environment was high for high-flow discharge sections, indicating the significant influence of nonpoint pollution sources. These results show that it is necessary to consider different pollution sources at each point for urban stream quality management.

1. Introduction

Since the 1960s, the amount of pollutants introduced to streams has increased due to the increase in wastewater discharge caused by rapid urbanization and industrialization. In general, pollutants introduced into streams from watersheds can mainly be classified into point pollution sources, which constantly come from specific places, and nonpoint pollution sources, which normally exist over large areas and then discharged into streams along with surface runoff during rainfall. Nonpoint pollution sources are difficult to quantify because their discharge is different depending on topographical conditions, the characteristics of the watershed, land use type, and hydrological conditions [1,2,3,4,5,6]. To address this problem, the Ministry of Environment (ME; Rep. of Korea) implemented the total maximum daily load (TMDL) program on the Nakdong River in 2004. Since the water quality and flow are measured simultaneously by the TMDL monitoring network, unlike the conventional water quality monitoring network, it is possible to quantify the pollutant load from the flow [7]. The TMDL program of South Korea is managing to achieve the target water quality at the reference flow, which involves specific flow conditions averaged over the past decade. Therefore, there is a limitation for managing the water quality using TMDL for the various flow conditions [7].
In recent years, the pollution of water bodies has been analyzed, and the effect of flow fluctuations on water quality has been investigated using the load duration curve (LDC), which considers various flow conditions for the entire stream [8].
Through analysis of the pollutant load, research on the water quality of urban streams has been conducted in various ways. Numerous studies have identified the sources of pollution in simple and indirect ways using the relationship between flow and pollutant load. Kwon et al. analyzed the changing characteristics of the water quality in the Gyeongan stream for ten years and investigated those characteristics using the flow–pollutant load relationship [9]. Lee et al. evaluated the organic matter load contained in the streams flowing into Masan Bay using the flow–pollutant loading equation and thus classified the pollution sources of each stream [10]. Lee et al. investigated the outflow characteristics of pollutants subjected to the TMDL program and the degree of water quality deterioration by section and season under flow conditions, using discharge and water quality data in the Seomjin River [7].
Studies have also been conducted using LDCs. Lee et al. investigated the water pollution load according to discharge conditions using an LDC for the major tributaries of the Nakdong River; in addition, the location and period for water quality management were suggested [11]. Jang et al. found regions that preferentially require the management of nonpoint pollution sources and proposed a method for setting management goals, mainly for the four major rivers in Korea, by creating an LDC and evaluating the water quality characteristics for each flow condition [12]. Luo et al. calculated the TMDLs for ammonia to evaluate the water quality upstream of the Taoxi River in the Taihu Basin in China and conducted research on the analysis of water quality characteristics using LDCs to quantify monthly and seasonal variations in TMDLs [13]. Chen et al. conducted research on the application of the LDC method for the management of water pollution in the Yuanhe River, a tributary of the Ganjiang River, which itself is a tributary of the Yangtze River [14]. Serrano et al. presented an alternative for estimating the coliform load reduction at various locations in the Piranga and Piracicaba basins using the LDC method [15]. As in the previous studies, LDC has been used in various ways to evaluate the water pollution load of rivers in space and time. In addition, it is suggested to be highly useful as a major analysis method for river water quality management.
Various domestic and international studies have been conducted on water pollution management. In particular, various techniques have been applied for calculating the pollutant load. Unlike natural streams, urban streams require complex water quality management due to wastewater and rainwater in cities, which makes it difficult to calculate the pollutant load. An urban stream with a high pollutant load was selected for this study, and the water pollutant load of the stream was analyzed using the flow–pollutant load relationship and an LDC.
In this study, water quality and flow status over the last five years were identified and the flow–pollutant load relationship was derived for the Gul-po stream, a stream in Incheon, South Korea, subjected to the TMDL program in the Han River system, using the data observed by the TMDL monitoring network. To this end, the pollutants that flow into the Gul-po stream were analyzed to know whether it exceeded the target water quality under various flow conditions through the LDC. In addition, the water quality characteristics and inflow pollution sources of the Gul-po stream were analyzed to present appropriate water quality management measures for the basin.

2. Methods

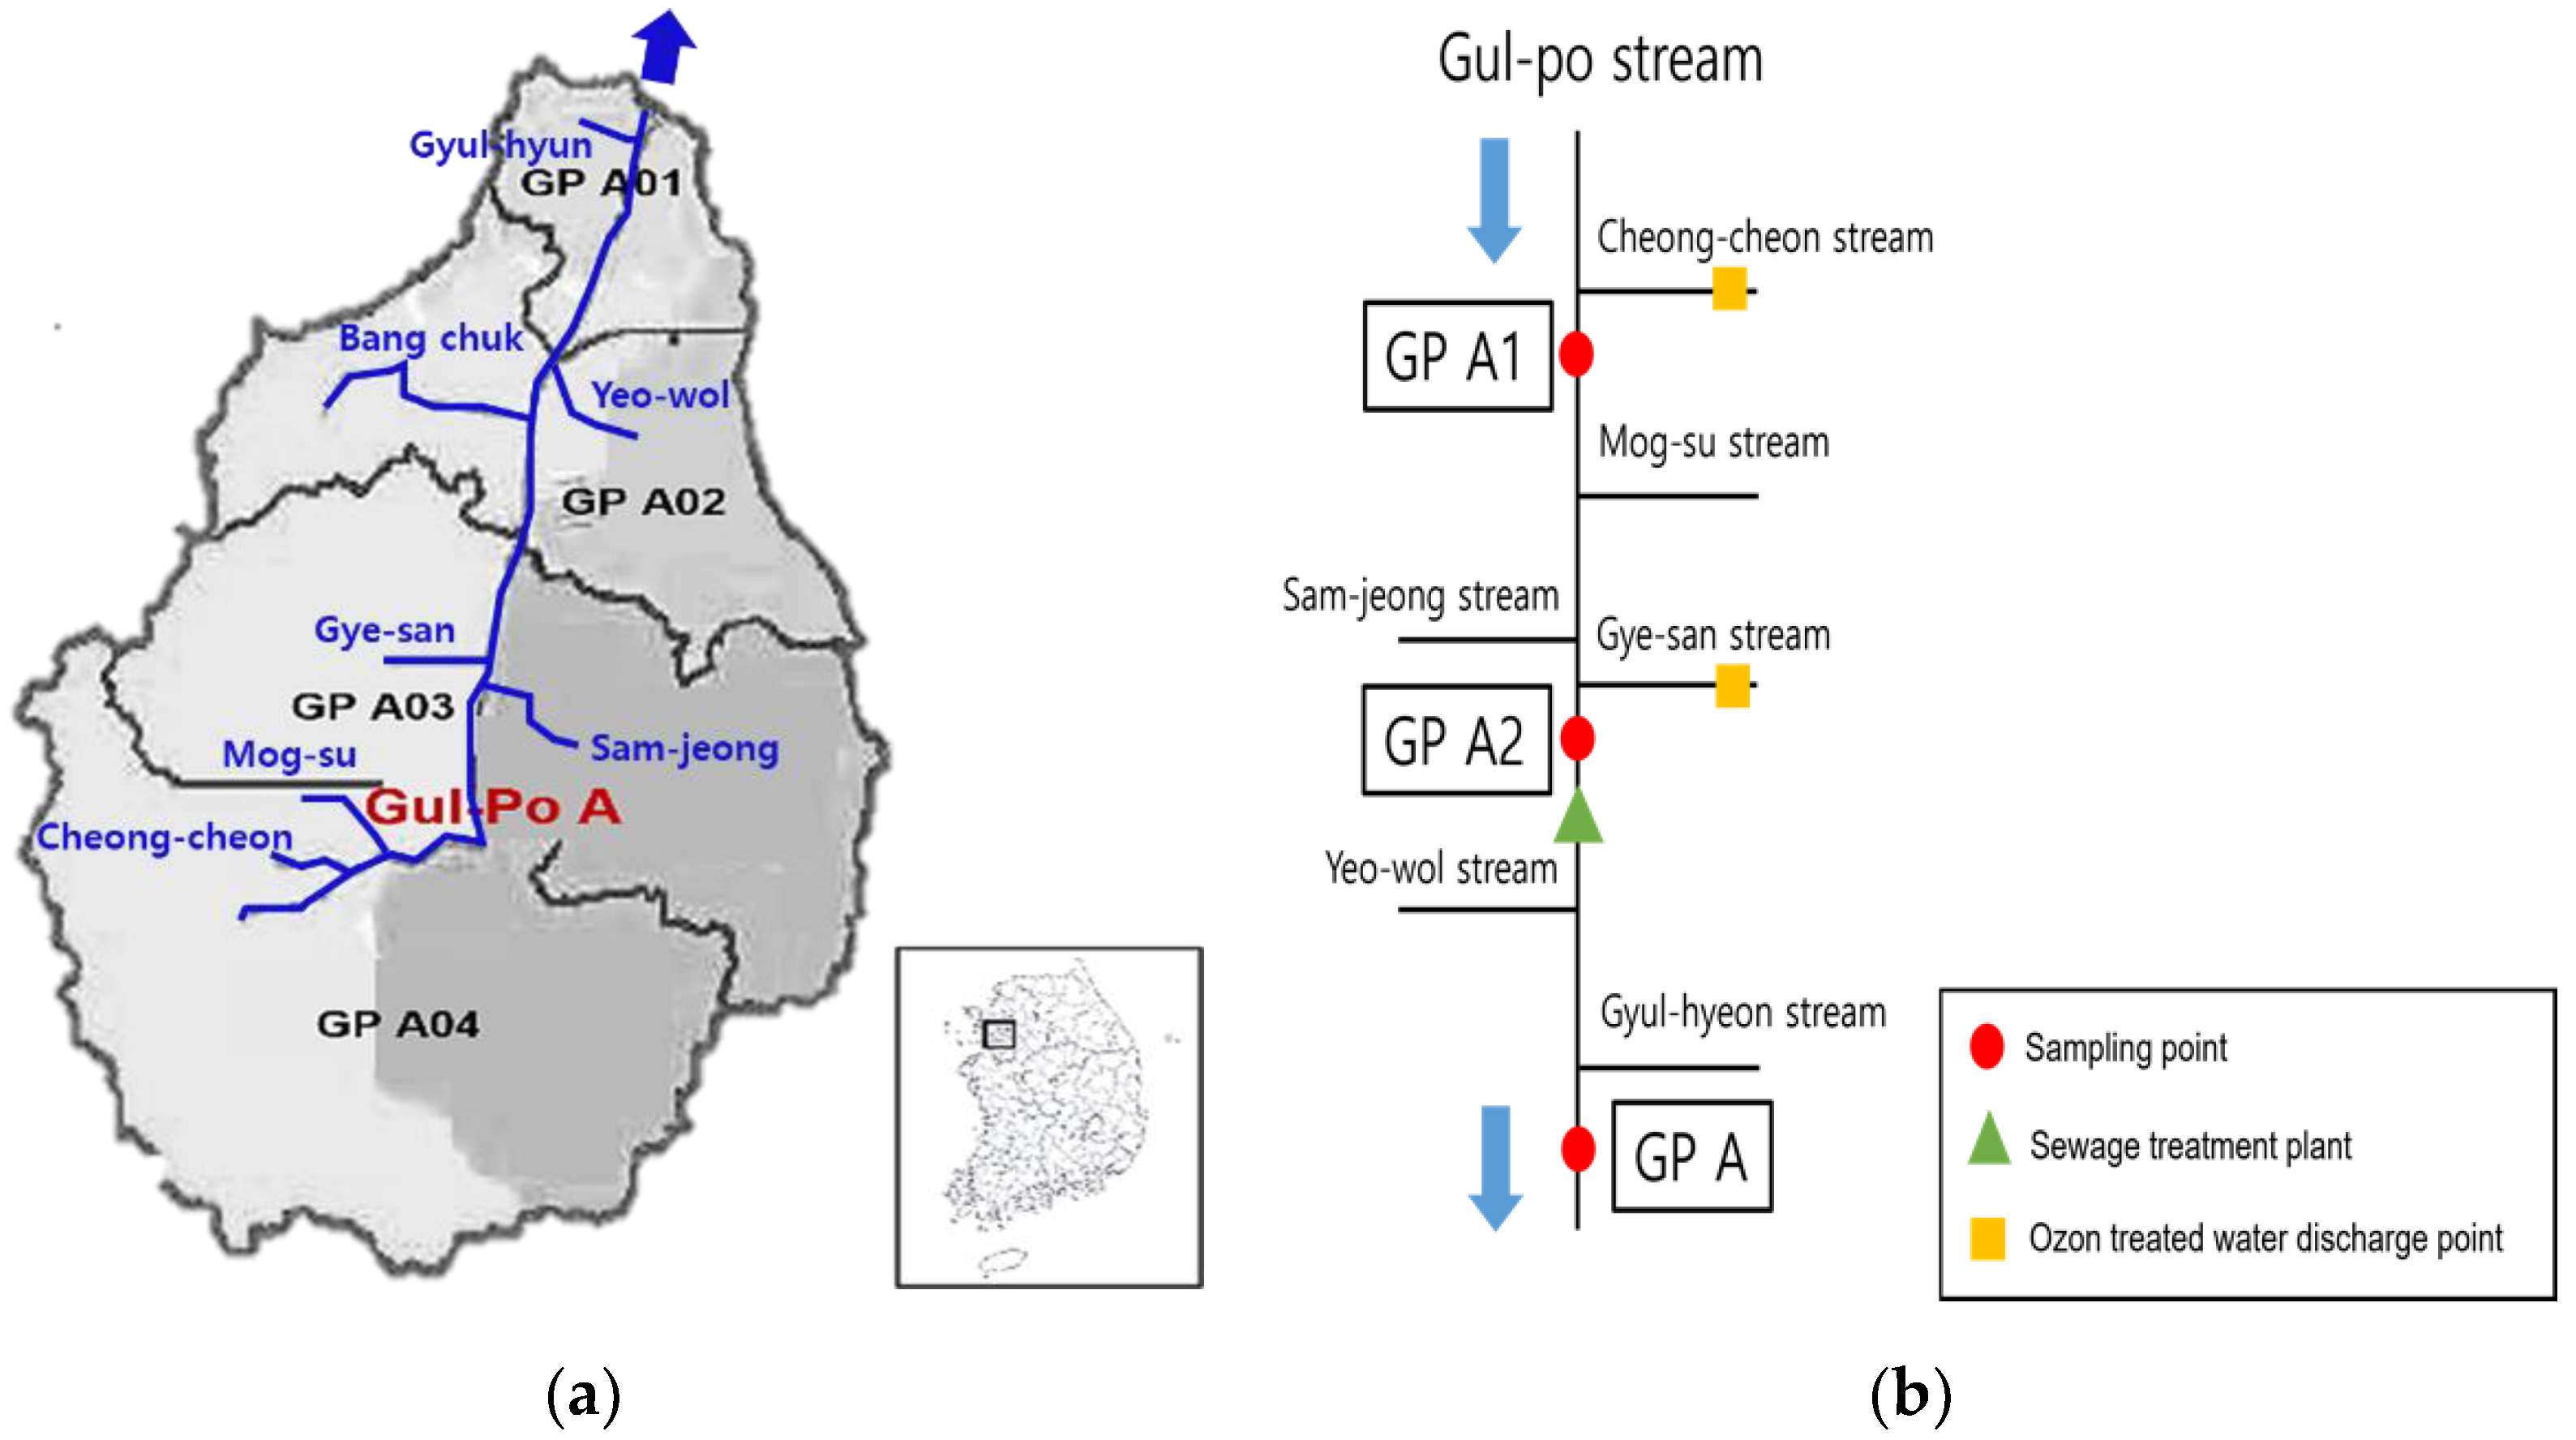
2.1. Target Area and Data Collection

The Gul-po stream, which is the target stream of this study, flows through five local governments in Korea—Bucheon, Gimpo, Bupyeong, Gyeyang, and Gangseo, comprising an area with the highest density of urban household and industrial pollution sources. It has tributaries such as the Yeo-wol, Gye-san, Sam-jeong, Mog-su, Gyul-hyeon, and Cheong-cheon streams. National industrial complexes are located upstream of the Gul-po stream, and apartment complexes exist in the middle and upstream areas. The downstream area has been used as farmland. The Gul-po sewage treatment plant is also located downstream and processes large amounts of pollutants from nearby factories and farmland [16]. Since the Gul-po stream is a basin that has a direct impact on the Han River system, it requires sufficient management to improve the water quality in the Han River estuary and along the coast of Incheon. In addition, efficient water quality management by identifying pollution sources that flow into the stream is essential, because the stagnation of flow occurs in the stream when it joins the end of the main stream of the Han River. The water quality of the stream is significantly worse than that of other streams in the Han River system due to the influence of effluent from a large sewage treatment plant (Gul-po sewage treatment plant) located at the end of its basin [17]. Figure 1 shows the Gul-po basin and location of major facilities, and the sampling point of the Gul-po Basin [18].
As for the flow and water quality data for this study, the data of six water quality items—BOD (biochemical oxygen demand), COD (chemical oxygen demand), TOC (total organic carbon), SS (suspended solid), T-N (total nitrogen), and T-P (total phosphorus)—and flow discharge data at GulpoA1, GulpoA2, and GulpoA, (water quality measured points) from 2016 to 2020 were collected from the water environment information system (WEIS, 2021) of ME and analyzed. More detailed water quality and flow measured points are shown in Table 1. The 571 time series data were collected from observation points (GP A1-193, GP A2-187, and GP A3-191) and the measured results of water quality and discharge are shown in Table 2.

2.2. Flow–Pollutant Loading Equation

The pollutant load is a value obtained by multiplying the discharge at the observation point by the concentration of water quality. It is an important factor for the analysis of nonpoint pollution sources because it increases as the rainfall time continues, due to the increase in flow despite the decrease in the concentration of pollutants [19]. Huber and Barnwell proposed an empirical formula by converting the relationship between stream flow and pollutant load to numerically investigate the pollution load according to the flow change, as shown in Equation (1) [20]:
L = a Q b
where L is the pollutant load (kg/day), a is the coefficient related to the baseflow load, Q is the stream flow (m3/s), and b is the slope of the regression equation. If b is higher than 1, it represents the pollution load rapidly increasing with increasing flow. If not, the water quality concentration is interpreted to not be sensitive to the flow increase [21].

2.3. Flow Duration Curve

The flow duration curve (FDC) is a cumulative frequency curve that shows the percentage of time specified discharges were equaled or exceeded during a given period. The Y-axis represents the discharge and the X-axis represents the frequency (percentage exceedance) at which discharge larger than the Y-axis discharge occurs, which can be calculated using Equation (2). Since the X-axis represents flow data over a period of time in order of magnitude (0–100%), it is easy to visually understand fluctuations in the magnitude of the stream flow [22].
P e r c e n t age   exceedence   ( % ) = n N 100
where n is the rank of discharge data in descending order and N is the number of data.
For daily flow data, data from eight-day intervals were used, provided by the TMDL monitoring network. In general, it is preferable to use daily flow data for the entire period to create FDC. It is difficult to secure measurement data due to realistic conditions or if calculation results with a margin of safety (MOS) less than 10% (compared to the reference flow) are required; however, the total flow frequency of the stream can be represented through the flow data from eight-day intervals, accumulated over three to six years. Therefore, measurement data from eight-day intervals are used for FDC and LDC analysis in Korea [22,23].
The magnitude of flow is divided into five stages according to hydrological conditions. In Korea, it is divided into: High flows (HFs) with an exceedance probability of 0–10%, moist conditions (MCs) with 10–40%, mid-range conditions with 40–60%, dry conditions (DCs) with 60–90%, and low flows (LFs) with 90–100%, according to the flow duration [24].

2.4. Load Duration Curve

An LDC is a curve that shows the relationship between the measured water quality data under all flow conditions. It makes it easy to interpret water quality phenomena while considering flow characteristics and is useful when seeking appropriate water quality management measures by analyzing and diagnosing the intrinsic characteristics of the water pollution problem and for areas that exceed the target water quality [7]. Recently, it has been used as a method for analyzing the degree of damage to a water body under various flow conditions to overcome the limitations of the TMDL program at the reference flow, i.e., the specific flow condition averaged over the last decade [11].
The LDC is created by multiplying the FDC prepared using daily flow data with the target water quality. It is possible to analyze change characteristics according to flow by adding the load calculated using daily flow and water quality data onto the LDC. The pollutant load can be calculated using Equation (3):
L o a d ( k g d a y ) = F l o w ( m 3 s ) C o n c e n t r a t i o n ( m g l ) 86.4
Whether the target water quality is exceeded or not can be identified using the LDC. If the overage rate is higher than 50% based on the center point (50%) of the flow section, the target water quality is exceeded; if not, the target water quality is satisfied [23]. In general, when the water quality criteria are exceeded during the high-flow period (0–40%), it is due to the influence of nonpoint pollution sources. When the water quality criteria are exceeded during the low-flow period (40–100%), it is likely to be caused by the influence of point pollution sources [25].

3. Results and Discussions

3.1. Analysis of Water Quality and Flow Characteristics for Each Point

When the average flow (by year) and the concentrations of six water quality factors in the upper, middle, and lower parts of the Gul-po stream were measured through the TMDL monitoring network (from 2016 to 2020) and then analyzed, it was found that the discharge in the upper and middle parts increased after 2018. This appears to be due to the influence of the ozone-treated reclaimed water supply project implemented in March 2019.
Through this project, average flows of 30,000 and 15,000 m3/d are discharged to the Cheong-cheon stream, located in the upstream area of the Gul-po stream (upstream of point GulpoA1) and the Gye-san stream, located in the midstream area (upstream of point GulpoA2), respectively [26]. Accordingly, the flow in the upper Gul-po stream almost doubled from 2018 to 2019, and the water quality in the upper and middle parts has also improved. The T-N concentration increased rapidly, likely due to the influence of ozone treated reclaimed water with a higher T-N concentration than the upper part of the Gul-po stream (Figure 2).
Figure 2a shows the T-N concentration in ozone-treated water; the concentration ranges from 8 to 16 mg. As shown in Figure 2b, the T-N concentration in the upper Gul-po stream increased to the T-N concentration range of ozone-treated water due to its discharge. Figure 2b has sections where the T-N concentration is lower than that of ozone-treated water (minimum concentration is 6 mg/L)—this appears to be due to the influence of the rainwater introduced into the stream during rainfall.
The daily discharge of the Gul-po sewage treatment plant is 664,550 m3/day, and this represents most of the flow in the lower part of the Gul-po stream. Therefore, the lower part was affected by the water quality of the discharge from the Gul-po sewage treatment plant, while the influence of ozone-treated reclaimed water discharge (45,000 m3/day) on the upper part was found to be insignificant compared to discharge from sewage treatment plant. Table 2 shows the annual average water quality concentration and flow for each measurement point in the Gul-po stream.
Compared to the upper and lower parts of the Gul-po stream, the concentrations of BOD, COD, and TOC were highest in the middle part. This is because water from the urban industrial complexes and road sections flows into the middle part and the water quality is lower compared to other points under the influence of surrounding pollution sources [27]. In addition, it appears that the Sam-jeong stream (a tributary of the Gul-po stream), which is located upstream of the middle part of the stream, has direct and indirect influence on the water quality in the middle part of the Gul-po stream due to the high population density compared to the administrative districts areas of Bucheon and Incheon in the upstream area, as well as untreated water discharged from livestock/agricultural farms and industrial complexes [28].

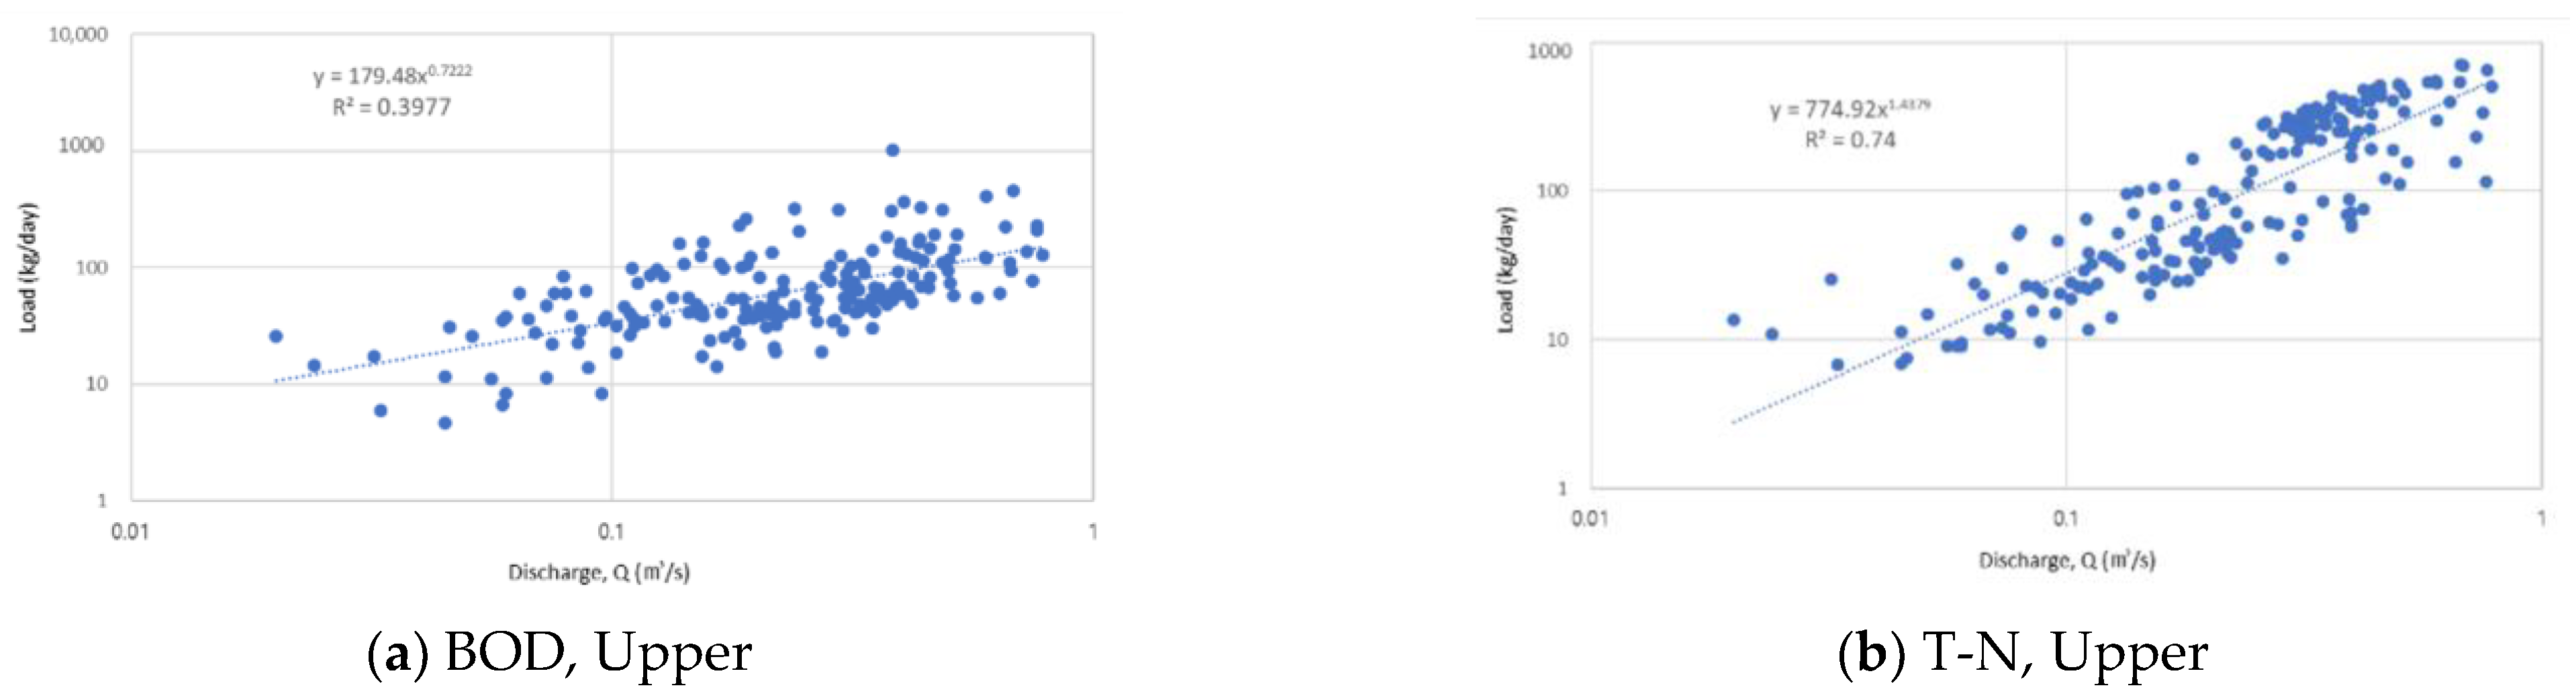
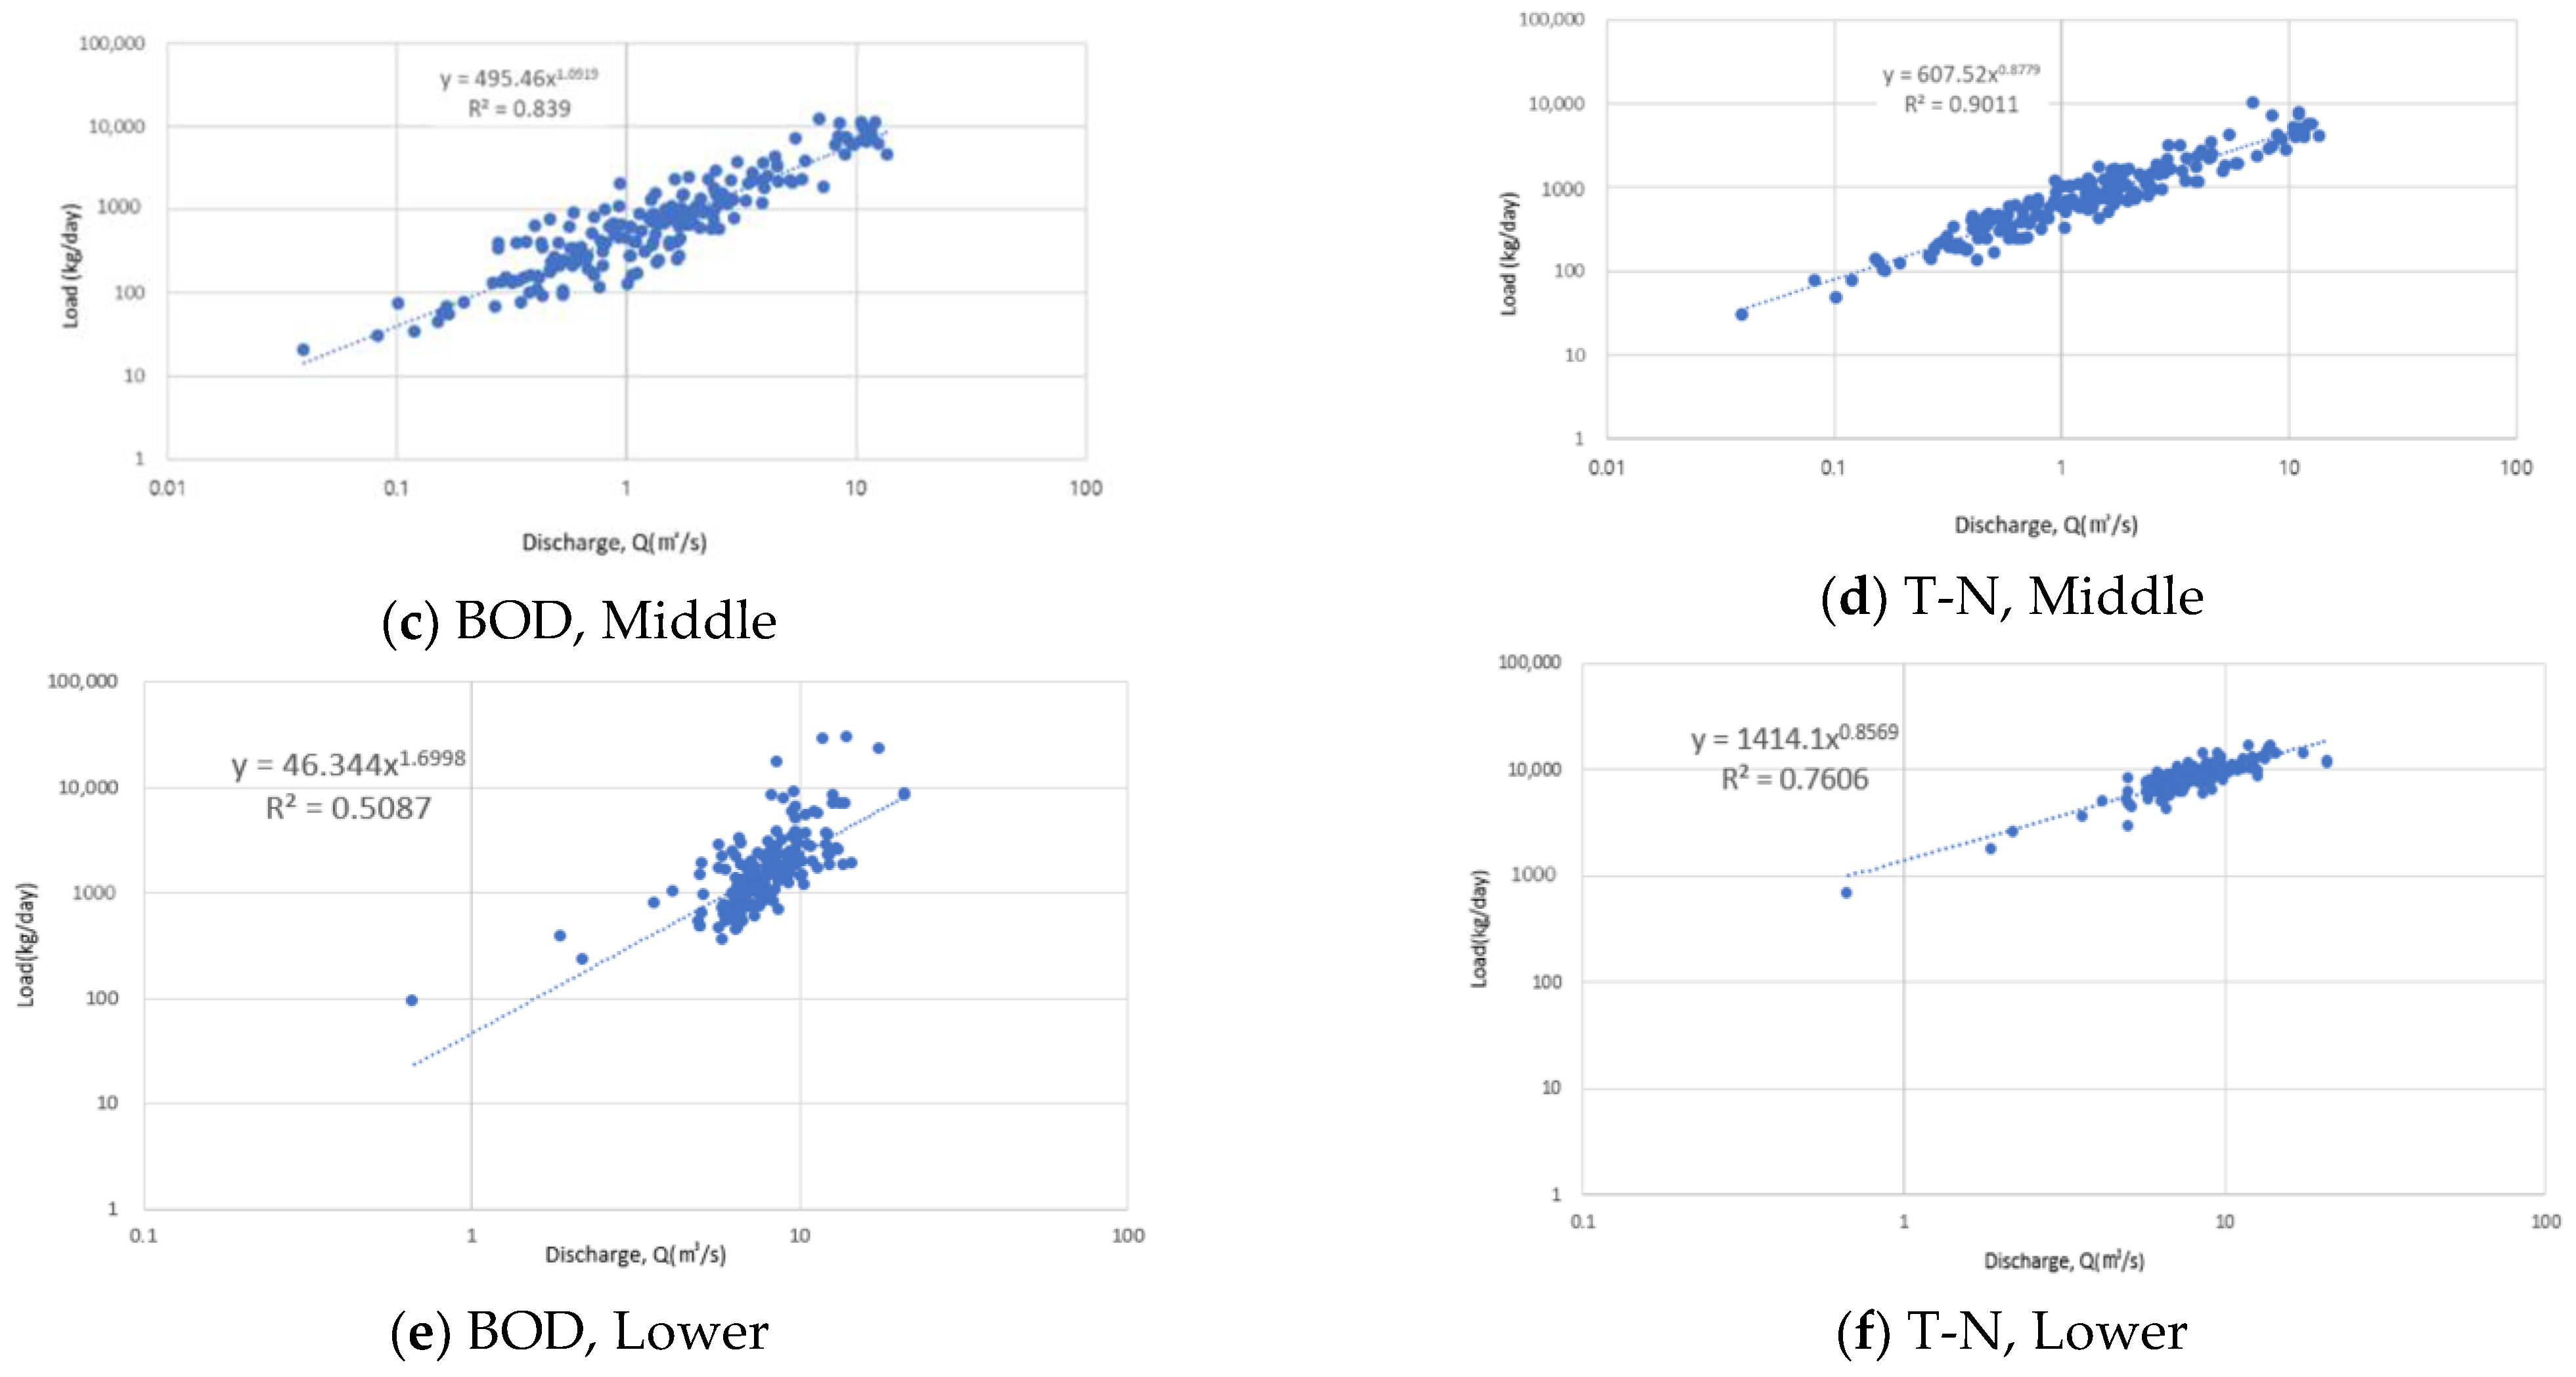
3.2. Derivation of the Flow–Pollutant Loading Equation

The flow–pollutant loading equation was derived using the flow and water quality data for each point in the Gul-po stream from 2016 to 2020, as shown in Table 3. Regarding the degree of dispersion of the pollutant load according to flow, only the results of BOD and T-N with the distinct characteristics of the flow coefficient are shown in Figure 3. R-squared (R2) is a statistical measure that represents the proportion of the variance for a dependent variable and independent variable.
As shown in Table 3, the b values of BOD, COD, SS, TOC, and T-P in the upper part were lower than 1—they were 0.72, 0.92, 0.85, 0.88, and 0.89, respectively, showing that their concentrations decreased as the flow increased. This indicates that the stream’s flow increase rate was higher than the pollutant inflow increase rate during rainfall. In addition, when compared to the flow distribution data, flow discharge significantly increased after April 2019. This indicates that the flow fluctuation characteristics in the upper part, between 2016 and 2020, were directly affected by ozone-treated reclaimed water discharge, which is responsible for the improvement of water quality (b value is lower than 1).
On the contrary, the b value of T-N (1.44 in Table 3) was greater than 1, showing that its concentration increased as the flow discharge increased. This is because the T-N concentration of ozone-treated reclaimed water is higher than that of the Gul-po stream water, as shown in Figure 2.
In the middle part, the b values of BOD, COD, TOC, SS, and T-P were greater than 1—they were 1.09, 1.03, 1.07, 1.13, and 1.07, respectively, showing that their concentrations increased as the flow increased. This can be interpreted as the significant influence of nonpoint pollution sources during rainfall. The b value of T-N (0.8779), however, was lower than 1, showing that its concentration decreased as the flow increased. This appears to be because the dependence of the discharge water concentration on the flow decreases, since nitrogen has high fluidity in the atmosphere or soil pores and is thus easily discharged, even during small-scale rainfall [29]. In the lower part, the b values of BOD, COD, TOC, SS, and T-P were greater than 1, showing that their concentrations increased as the flow increased. The b value of T-N (0.8569) was lower than 1, showing that its concentration decreased as the flow increased. In particular, the b values of BOD, SS, and T-P in the lower part significantly increased to 1.6998, 1.3851, and 1.241, respectively, compared to the middle part. This shows that the influence of nonpoint pollution sources was larger as the concentration of the water quality variables rapidly increased alongside the flow discharge.

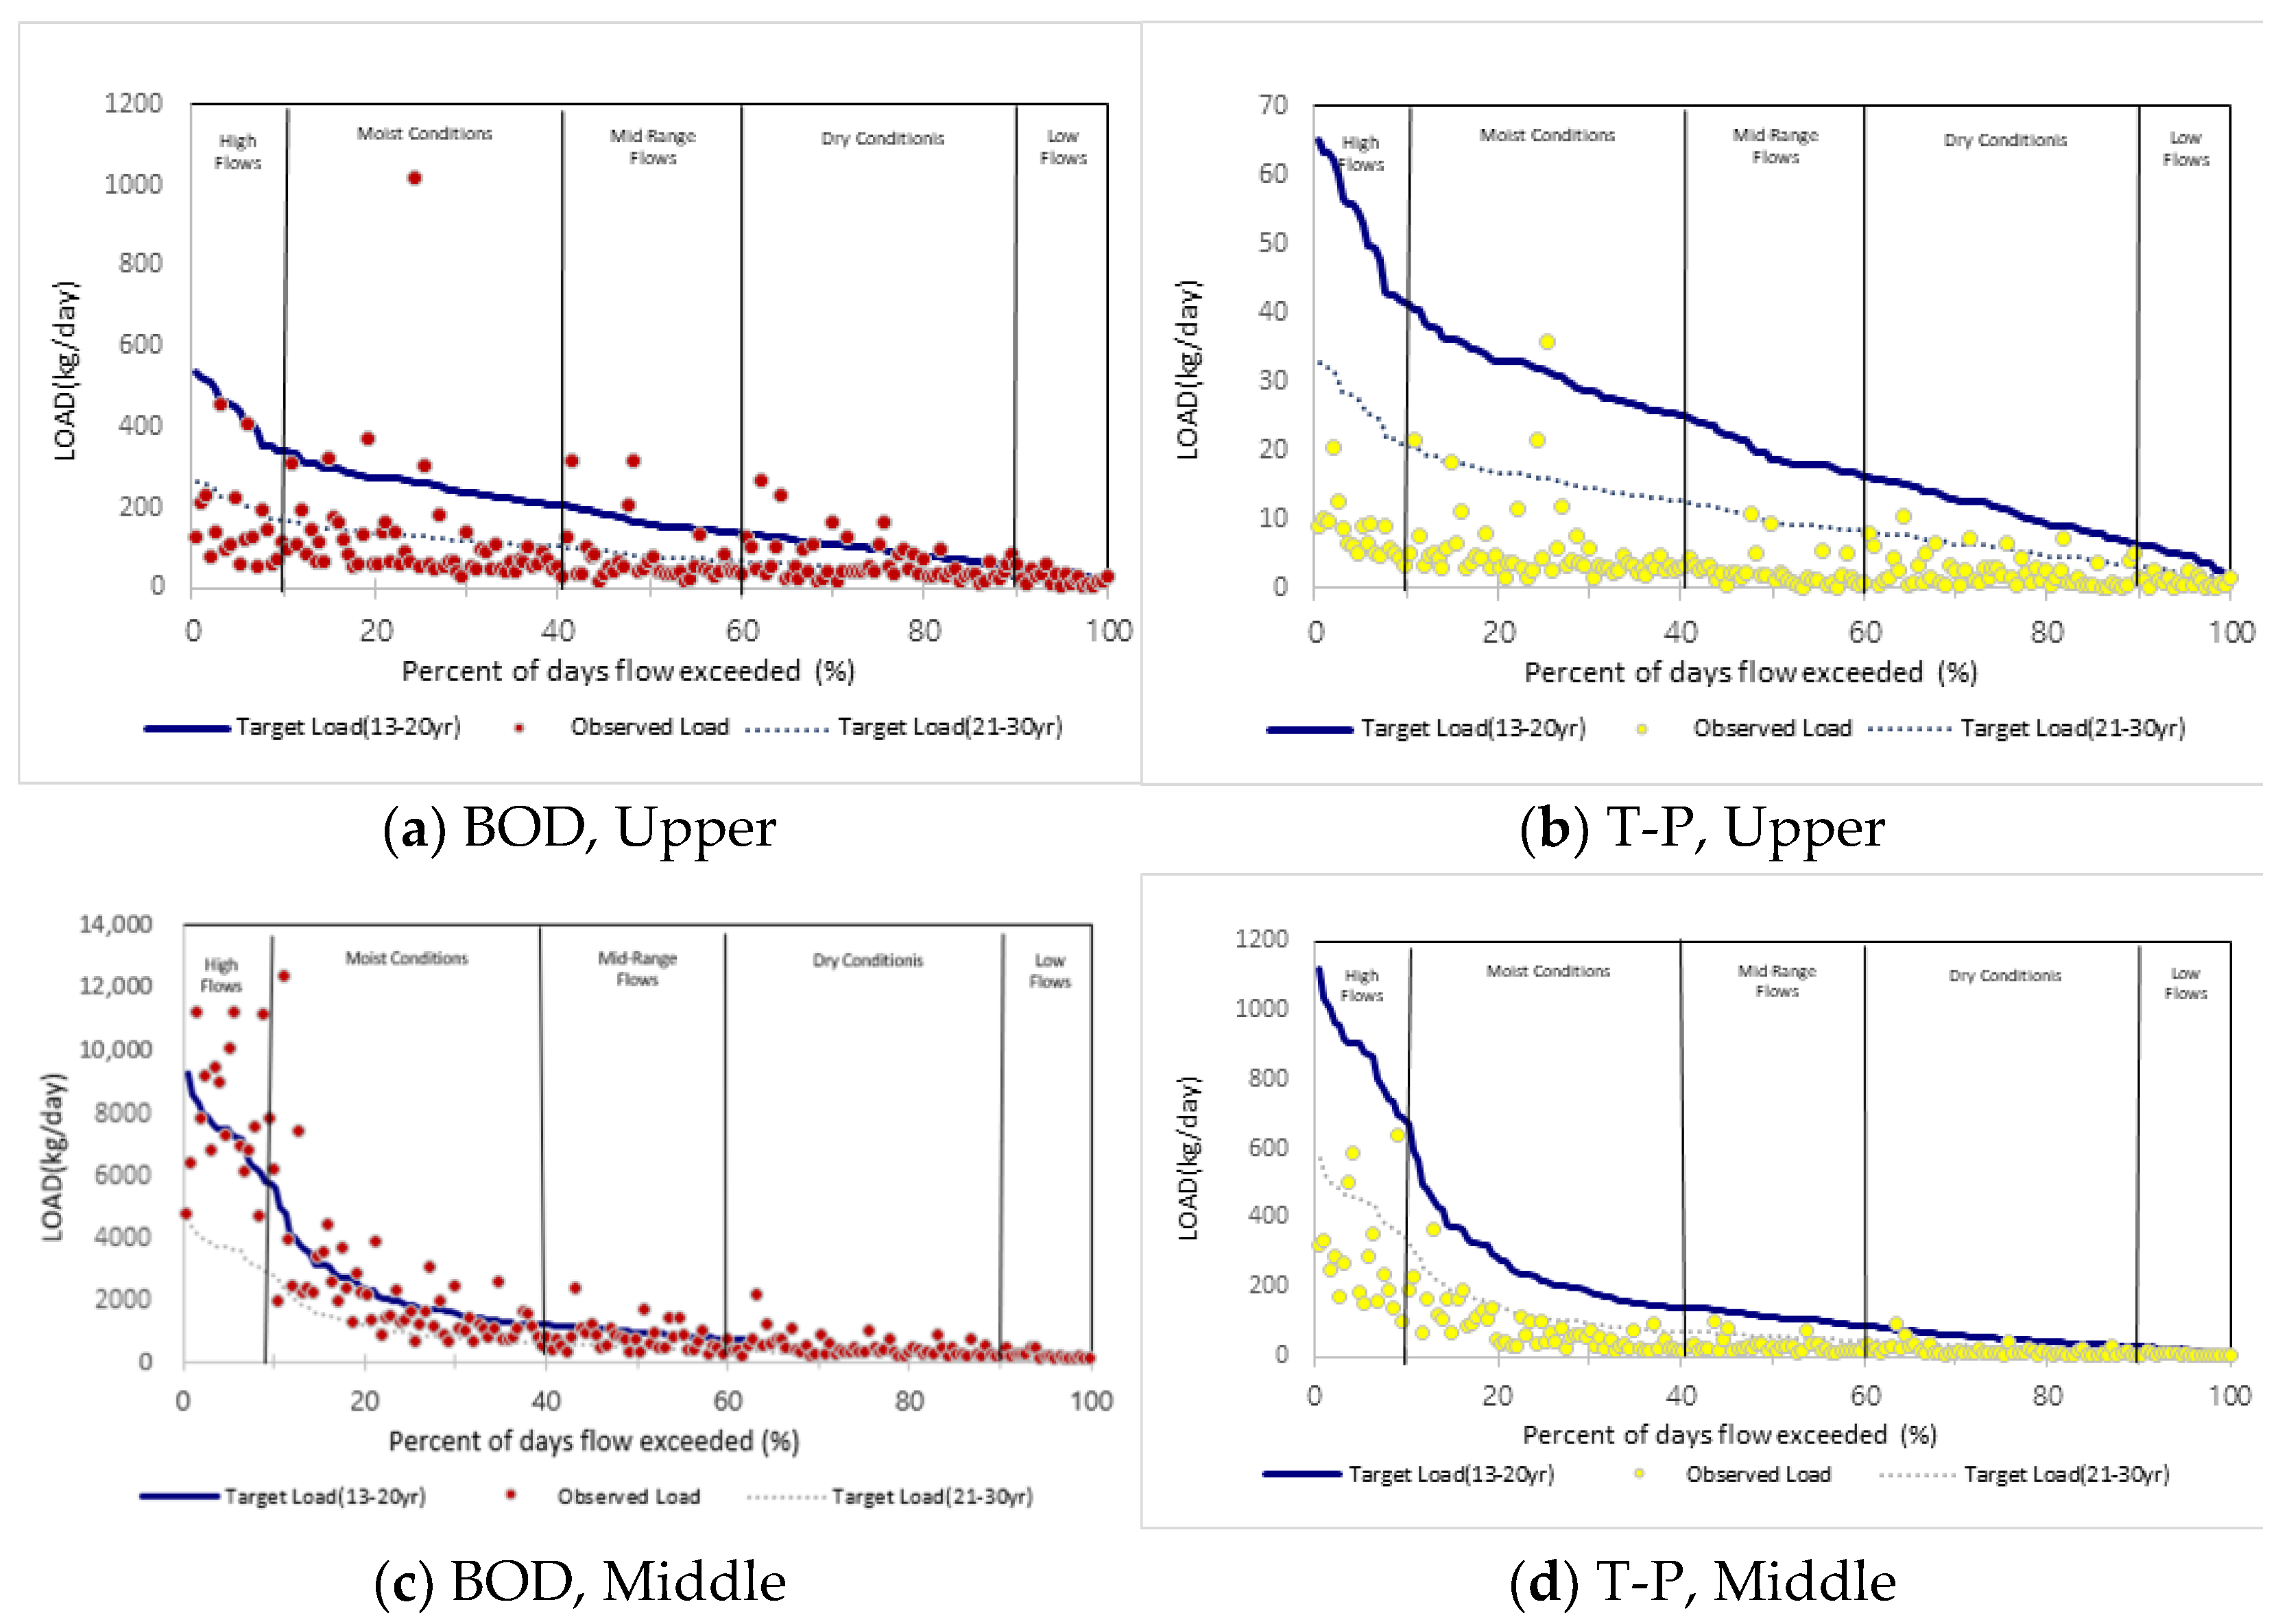
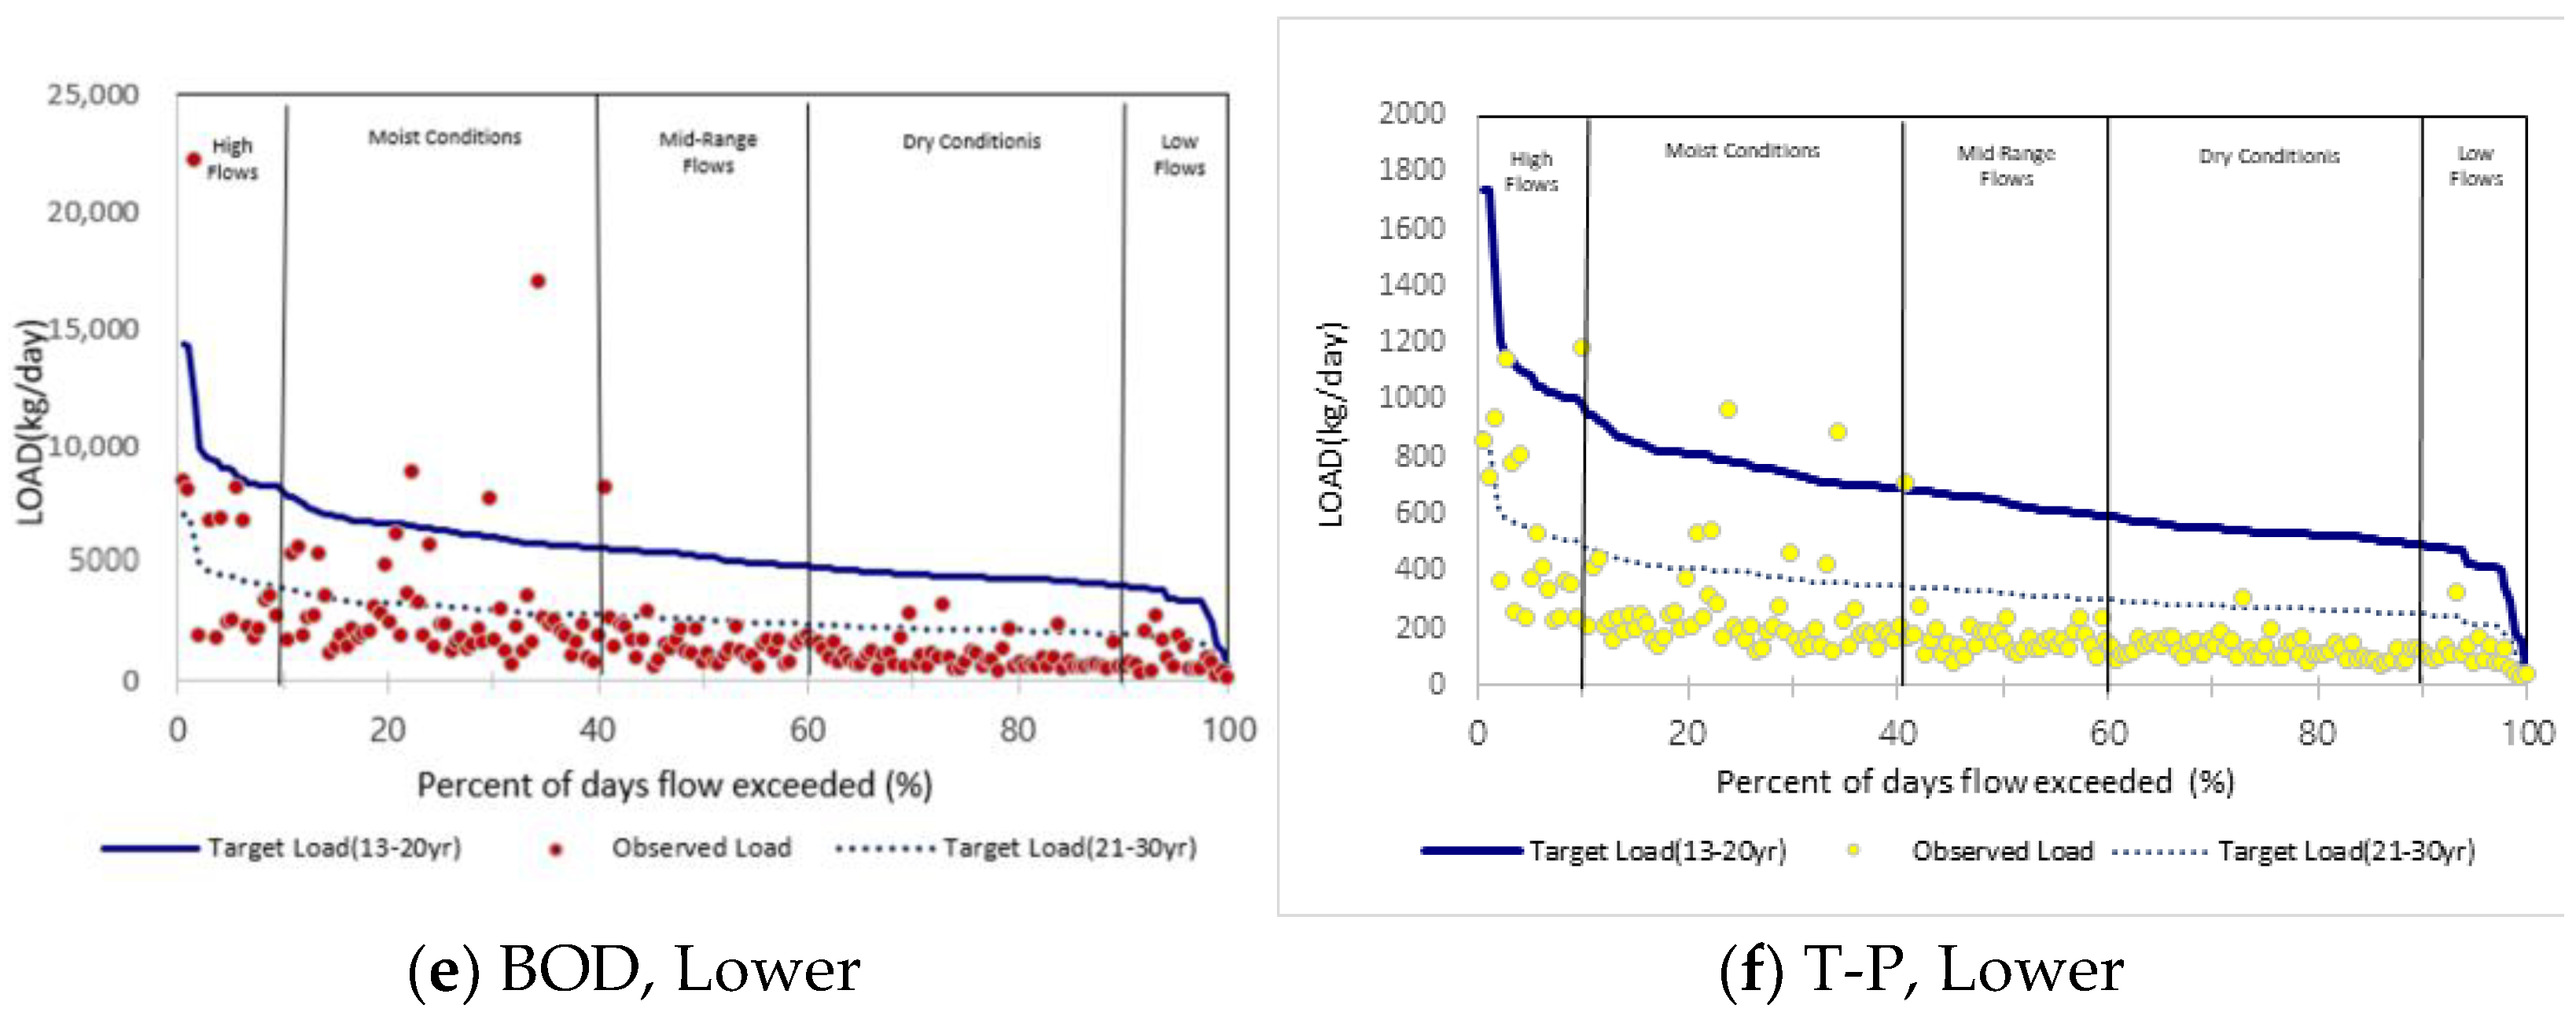
3.3. Derivation of LDC for Each Point

To identify the degree of water pollution in the Gul-po stream, the LDCs of BOD and T-P for each point were derived using the daily flow and water quality data over five years (from 2016 to 2020) (see Figure 4). The target water quality used as the benchmark was set based on the target water quality presented in the operation plan for the TMDL program in the Han River Basin, because the Gul-po stream was subjected to the program. Comparative analysis was conducted mainly on the target water quality of phase 1 from 2013 to 2020, and the total overage rate for the target water quality of Phase 2 from 2021 to 2030 was additionally analyzed, as it was set recently (see Table 4).
When the target water quality (phase 1) overage rate was analyzed for each flow section in the upper part, BOD exhibited an overage rate of less than 50% for all sections, thereby satisfying the phase 1 target water quality. DC and LF, which are low-flow sections, showed higher overage rates (21% and 15%, respectively) than HF and MC, which are high-flow sections. T-P exhibited a low overage rate of 1.72% for the MC section and an overage rate of 0% for the DC and LF sections, thereby satisfying the target water quality. In the upper part of the stream, where the overage rate is high for low-flow sections, the influence of point pollution sources is larger than that of nonpoint pollution sources when the results of the flow–pollutant loading equation are also considered. The increase in the BOD concentration in the upper part, however, can also be explained by algal growth due to the increase in stream residence time, caused by lower flow as compared to other points—especially regarding the reduction in stream flow for the DC and LF sections and the increase in the amount of native organic matter due to the growth of phytoplankton [30].
When the target water quality (phase 1) overage rate was analyzed for each flow section in the middle part, BOD showed an overage rate of 55.56% for HF and thus did not satisfy the target water quality. T-P satisfied the target water quality, as it exhibited a low overage rate of 1.79% for MC and DC. As mentioned in the analysis of water quality characteristics, it appears that BOD exceeded the target water quality for HF in the middle part due to the influence of nonpoint pollution sources caused by the discharge from the urban industrial complexes, road sections, and the inflow of the Sam-jeong stream (a tributary of the Gul-po stream). In the results of the flow–pollutant loading equation, the b value of SS was higher than that of the other variables. This can be interpreted as an increase in SS during rainfall due to nearby pollutants and increases the concentration of BOD and other organic matter [27].
When the target water quality (phase 1) overage rate was analyzed for each flow section in the lower part, BOD was 15.79% for HF and 5.26% for MC, indicating that the overage rate concentrated in high-flow sections showed an overage rate of 0% compared to low-flow sections. In the case of T-P, the overage rage was also concentrated in high-flow sections compared to low-flow sections, and this showed the significant influence of nonpoint pollution sources during rainfall on water pollution in the lower part. This appears to be closely related to land use in the lower part of the Gul-po stream when considering that the flow index values of BOD, SS, and T-P were high in the results of the flow–pollutant loading equation. According to a previous study, the concentrations of organic matter and phosphorus tend to increase as the area of farmland increases [31]. In the case of paddy fields, organic matter and soil are introduced into streams in large quantities during rainfall because of the large quantity of organic fertilizers (e.g., compost) being used as nutrients for crops. This can also explain the increase in the BOD concentration in the lower part of the Gul-po stream during rainfall, due to the high proportions of paddy fields. In addition, the presence of phosphorus can be explained by the inflow of soil with a large amount of phosphorus adsorbed along with the rainfall runoff, because phosphorus has a high soil adsorption capacity [31]. Therefore, in the lower part of the stream, where there is a high proportion of farmland, it was ascertained that the related pollutant load (BOD, T-N) is introduced into the stream, along with rainfall, and affects the water quality.
When the target water quality overage rates in phase 2 were compared for each point, it was found that the overage rate increased for all flow sections in the upper, middle, and lower parts. In the case of BOD, in particular, the overage rate was higher than 50% for all flow sections in the middle part and thus could not satisfy the target water quality. This indicates that the water quality management plan must be improved, considering both point and nonpoint pollution sources. Intensive management is required for the DC and LF sections in the upper part that exhibited overage rates of 46.5% and 60%, and the HF section in the lower part that showed an overage rate of 47.37%.
As shown in Figure 4 and Table 4, it was found that the target water quality was satisfied in the upper part, since the overage rate was less than 50% for all flow sections. For both BOD and T-P, however, the overage rates for low-flow sections, i.e., normal conditions, were higher than those for high-flow sections, indicating that point pollution sources had a larger influence on the occurrence of water pollution than nonpoint pollution sources. In the middle part, BOD did not satisfy the target water quality for high flows (HFs); this appears to be due to the influence of nonpoint pollution sources and the inflow of the Sam-jeong stream (a tributary) during rainfall in nearby areas. It is suggested that the increase in suspended matter due to the inflow of nearby pollution sources is the cause for the increase in the concentrations of BOD and organic matter. In the lower part of the stream, the target water quality was also satisfied, since the overage rate was less than 50% for all flow sections. Since both BOD and T-P exhibited high overage rates for high-flow sections, however, it is suggested that the nonpoint pollution sources had a significant influence on the occurrence of water pollution when the results of the flow–pollutant loading equation are also considered. In particular, BOD exhibited higher overage rates than T-P. This appears to be due to the high proportions of paddies and fields in the lower part in terms of land use.

4. Conclusions

In this study, water quality and flow status were identified for the Gul-po stream, a stream subjected to the total maximum daily load (TMDL) program in the Han River system, using water quality concentrations and daily flow data as measured by the TMDL monitoring network. The outflow characteristics of the pollutants that flow into the Gul-po stream were analyzed by deriving the flow–pollutant load relationship and determining whether the target water quality was exceeded under various flow conditions through the load duration curve (LDC) to propose appropriate management measures for the pollutants introduced into the stream. The conclusions are thus as follows:
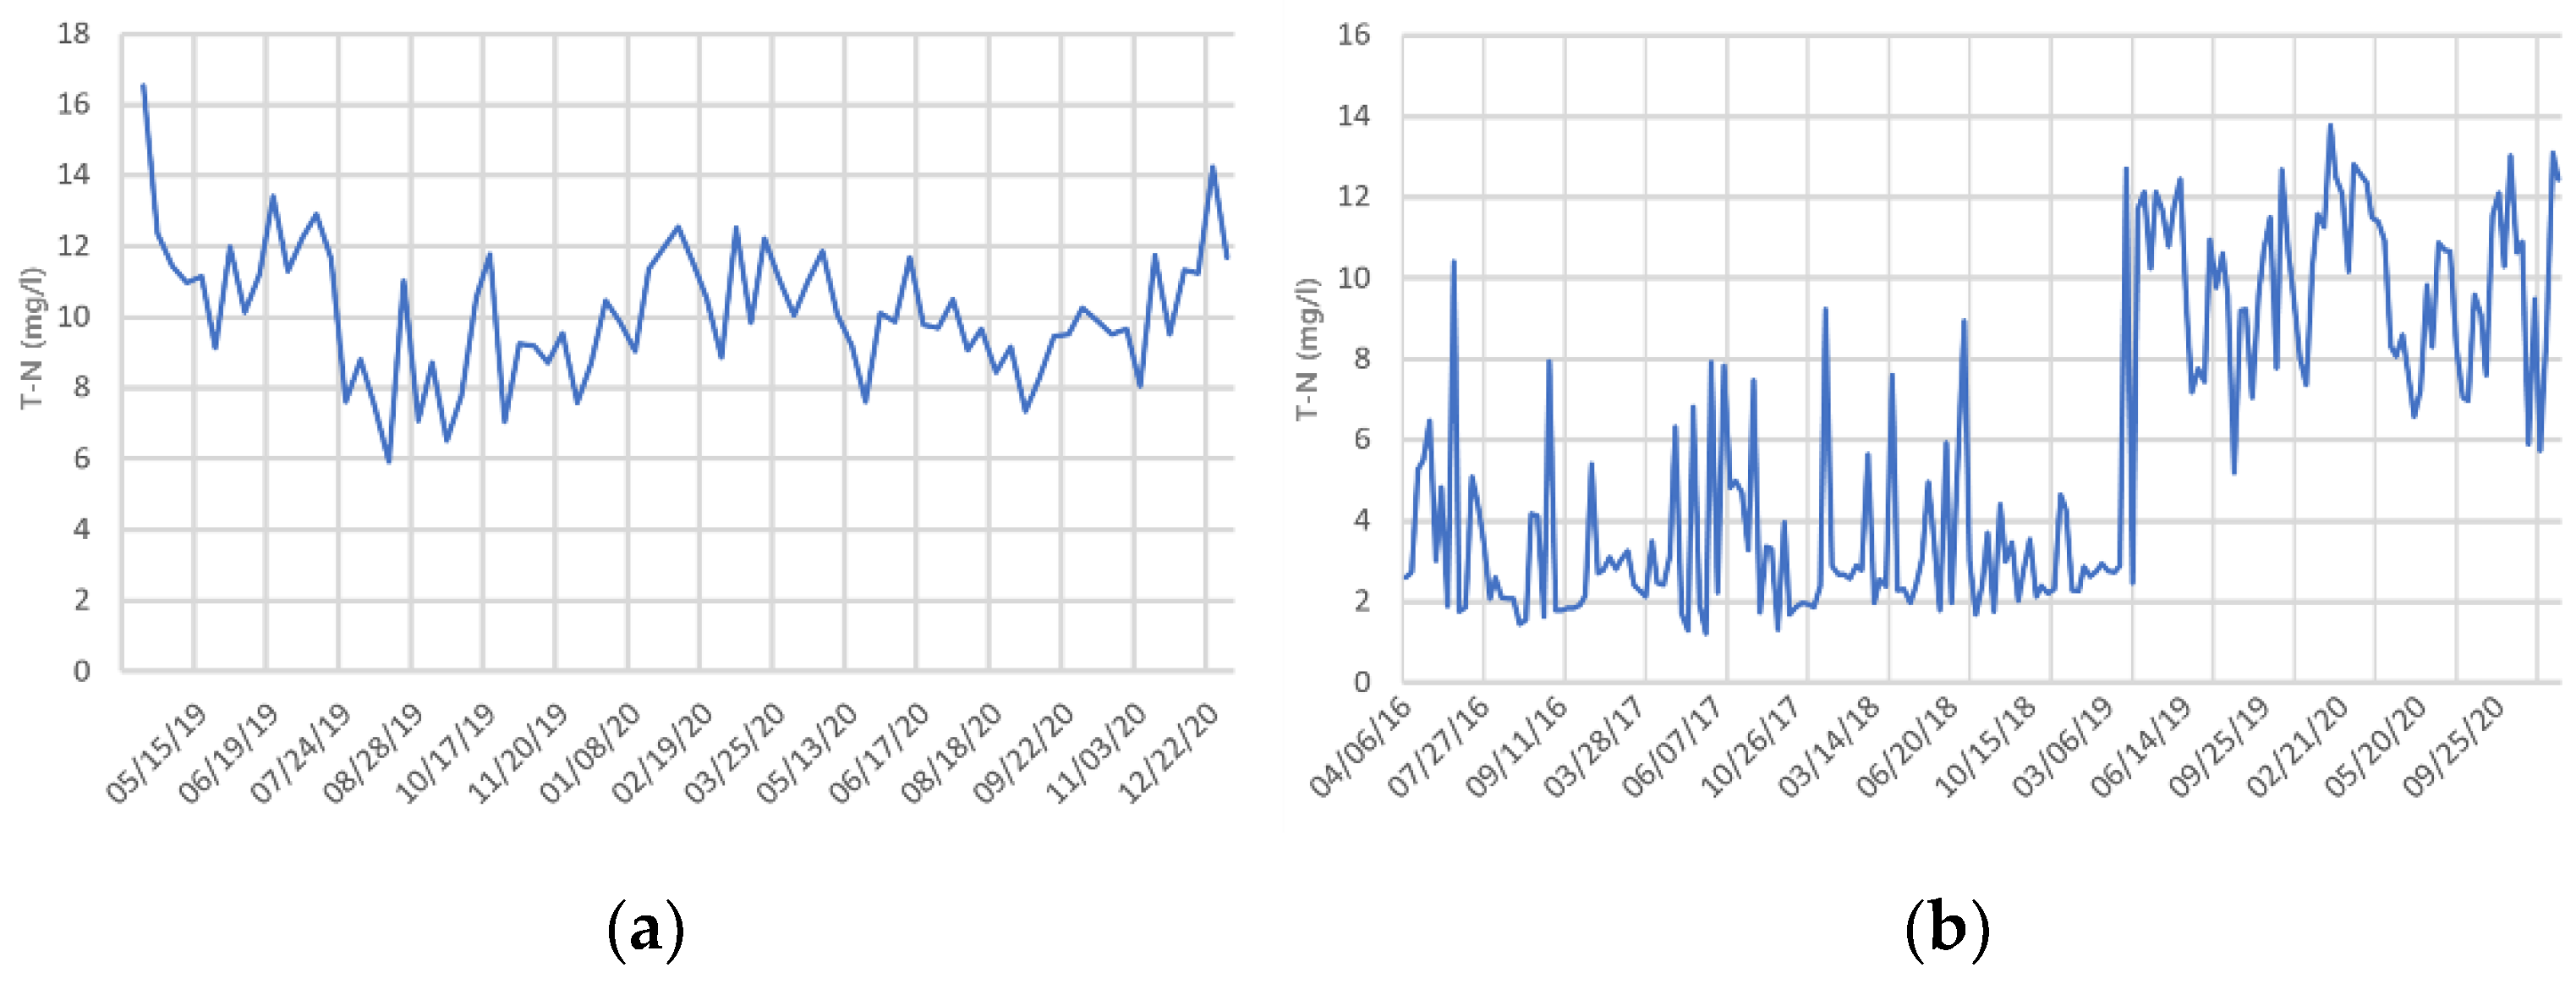
  • When the water quality and flow status were analyzed for each year, it was found that the flow increased and the water quality improved in the upper and middle parts of the stream after 2018, under the influence of the ozone-treated reclaimed water supply project implemented in April 2019. T-N, however, increased rapidly after 2018, since the concentration in the treated water was higher than that of the stream water. In the middle part of the stream, the overall water quality was poor compared to the upper and lower parts. This appears to be due to the high population density and the untreated water discharged from livestock/agricultural farms and industrial complexes affected the water quality at the middle point in the Gul-po stream.
  • When the flow–pollutant loading equation was derived for each point, the flow index (b) values of BOD, T-P, COD, TOC, and SS were lower than 1 in the upper part, except for T-N, indicating that their concentrations decreased as the flow increased. The flow index value of T-N, however, was greater than 1. This appears to be due to the influence of ozone-treated reclaimed water with a higher T-N concentration than the stream water. In the middle and lower parts of the stream, the flow index values of the water quality characteristics, except for T-N, were greater than 1, indicating that their concentrations increased as the flow increased. In the lower part of the stream, in particular, the flow index values were higher than those in the middle part, showing that the influence of nonpoint pollution sources was large, since the water quality concentration increased rapidly along with the increase in flow.
  • The results of this study revealed that the upper part of the Gul-po stream is significantly affected by point pollution sources, while the middle and lower parts are affected by nonpoint pollution sources in nearby areas, even though the overall target water quality is satisfied. This indicates that different water quality management measures are required for each distinct part of the Gul-po stream. A comparison with the target water quality by basin under the implementation of phase 2 of the TMDL program (2021 to 2030) revealed that the total overage rate in the Gul-po stream increased, and that the overage rate was higher than 50% (depending on the flow section for each point), indicating the occurrence of sections that could not satisfy the target water quality. Therefore, it is necessary to supplement the current management plan by reflecting the pollution source characteristics for each point of the Gul-po stream, to ensure that phase 2 water quality targets can be achieved.
This study conducted quantitative analysis of water pollution on nonpoint and point sources by applying LDC and flow–pollutant loading equations to urban rivers with highly polluted condition. In the future, if this research method is applied to more diverse urban rivers and comparatively evaluated, it is expected that it will be helpful in the management of river water quality.

Author Contributions

Conceptualization, J.-Y.J. and D.-W.J.; methodology, J.-Y.J. and D.-W.J.; formal analysis, J.-Y.J.; investigation, J.-Y.J., D.-W.K., and Y.-J.C.; writing—original draft preparation, J.-Y.J.; writing—review and editing, J.-Y.J. and D.-W.J.; visualization, J.-Y.J., D.-W.K., and Y.-J.C.; supervision, D.-W.J. All authors have read and agreed to the published version of the manuscript.

Funding

This research received no external funding.

Institutional Review Board Statement

Not applicable.

Informed Consent Statement

Not applicable.

Conflicts of Interest

The authors declare no conflict of interest.

References

  1. Park, S.J.; Choi, H.K.; Baek, K.W.; Han, Y.S. Estimation of contribution rate and pollution load delivery rate of Soyang lake basin. Proc. Korea Water Resour. Assoc. Conf. 2011, 199–203. [Google Scholar]
  2. Geng, R.; Wang, X.; Sharpley, A. Developing and testing a best management practices tool for estimating effectiveness of nonpoint source pollution control. Environ. Earth Sci. 2015, 74, 3645–3659. [Google Scholar] [CrossRef]
  3. Adu, J.T.; Kumarasamy, M.V. Assessing Non-Point Source Pollution Models. Pol. J. Environ. Stud. 2018, 27, 1913–1922. [Google Scholar] [CrossRef]
  4. Park, H.K.; Jeung, M.H.; Beom, J.A.; Choi, D.H.; Jung, J.W.; Ko, J.H.; Kim, Y.S.; Yoon, K.S. LDC Construction Through Water Quality and Discharge Monitoring for Evaluation of Nonpoint Source Pollution Management. J. Korea Soc. Water Sci. Technol. 2019, 27, 43–57. [Google Scholar] [CrossRef]
  5. Park, J.H. A Study of Waterbody Health Diagnosis Method Using Load Duration Curve. Master’s Thesis, Kyungpook National University, Daegu, Korea, 2010. [Google Scholar]
  6. Park, J.H.; Moon, M.J.; Kim, K.S. Analysis of Relationship between Water Quality Parameters with Land Use in Yeongsan River Basin. J. Environ. Impact Assess. 2014, 23, 19–27. [Google Scholar] [CrossRef] [Green Version]
  7. Lee, Y.S.; Kim, Y.S.; Han, S.W.; Lee, Y.J.; Kim, K.; Jung, K.Y. Analysis of Water body Damage at Osu Stream Using the Flow-Loading Equation and 8-Day Intervals Cumulative Flow Duration Curve. J. Environ. Sci. Int. 2018, 27, 1179–1193. [Google Scholar] [CrossRef]
  8. Kim, G.H.; Kim, J.M.; Jeong, H.K.; Im, T.H.; Kim, S.M.; Kim, Y.S.; Seo, M.J. Comparative study on evaluating standard flow in partially gauged and ungauged watershed. J. Korean Soc. Water Environ. 2019, 35, 481–496. [Google Scholar]
  9. Kwon, P.S.; Park, M.J.; Lee, Y.J.; Cho, Y.C.; Noh, C.W.; Jung, W.S.; Kim, J.H.; Yu, S.J. Evaluation of water quality characteristics at Kyeongan stream using the flow-loading equation and factor analysis. Ecol. Resilient Infrastruct. 2017, 4, 226–236. [Google Scholar]
  10. Lee, B.M.; Bae, E.T.; Moon, B.H. Evaluation of Organic Loading of Masan Bay Streams using Streamflow-Load Rating Curve. J. Korean Soc. Environ. Technol. 2016, 17, 558–569. [Google Scholar]
  11. Lee, S.S.; Kang, J.M.; Park, H.R.; Kang, J.H.; Kim, S.; Kim, J.P.; Kim, G.H. A Study on the Variation of Water Quality and the Evaluation of Target Water Quality Using LDC in Major Tributaries of Nakdong River Basin. J. Korean Soc. Water Environ. 2020, 36, 521–534. [Google Scholar]
  12. Jang, S.S.; Ji, H.S.; Kim, H.K. Identifying priority area for nonpoint source pollution management and setting up load reduction goals using the load duration curve. J. Korean Soc. Agric. Eng. 2018, 60, 17–27. [Google Scholar]
  13. Luo, Y.; Zhang, J. Application of a load duration curve for establishing TMDL programs upstream of the Tiaoxi River within the Taihu watershed, China. J. Coast. Res. 2017, 80, 80–85. [Google Scholar] [CrossRef]
  14. Chen, Y.; Zhang, X.H.; Li, H.X.; Luo, J.Z.; Zhao, S.H. Application study on LDC for water pollution control. J. Southwest Univ. Natl. 2011, 5. [Google Scholar]
  15. Serrano, L.D.O.; Borges, A.C.; Pruski, F.F.; Melo, M.C.D. A new approach to use load duration curves to evaluate water quality: A study in the Doce river basin, Brazil. Water 2020, 12, 811. [Google Scholar] [CrossRef] [Green Version]
  16. Hong, J.K.; Im, J.K.; Son, J.Y.; Noh, H.R.; Yu, S.J.; Lee, B.M. Source Tracking of Particular Matters using Stable Isotope Analysis and Water Quality Characteristics in Gulpo and Anyang Stream, Han-River. J. Korean Soc. Water Environ. 2020, 36, 116–124. [Google Scholar]
  17. Choi, O.Y.; Kim, H.T.; Seo, H.S.; Han, I.S. Analysis of Water Quality Changes & Characterization at the Watershed in Han River Basin for Target Indicator in TMDLs. J. Korean Soc. Water Environ. 2017, 33, 15–33. [Google Scholar]
  18. Water Environment Information System. Available online: http://water.nier.go.kr (accessed on 16 October 2021).
  19. Wanielista, M.P. Stormwater management: Quantity and quality. Ann. Arbor Sci. 1978, 187–220. [Google Scholar]
  20. Huber, W.C.; Barnwell, T.O. Storm Water Management Model; Version 4: User’s manual; EPA: Athens, GA, USA, 1988; pp. 59–282.
  21. Kim, D.W.; Jang, M.J.; Park, J.H.; Han, I.S. Determination of important parameter control term for Paldang lake water quality management using load duration curves. J. Korean Soc. Water Environ. 2013, 29, 762–776. [Google Scholar]
  22. Hwang, H.S.; Rhee, H.P.; Seo, J.Y.; Choi, Y.J.; Park, J.H.; Shin, D.S.; Lee, S.J. Analysis of the difference of flow duration curve according to the cumulative variation of the daily average flow in unit watershed for TPLCs. J. Korean Soc. Agric. Eng. 2018, 60, 97–109. [Google Scholar]
  23. Kim, E.J.; Park, B.K.; Kim, Y.S.; Rhew, D.H.; Jung, K.W. A study on development of management targets and evaluation of target achievement for non-point source pollution management in Saemangeum watershed. J. Korean Soc. Environ. Eng. 2015, 37, 480–491. [Google Scholar] [CrossRef] [Green Version]
  24. An Approach for Using Load Duration Curves in the Development of TMDLs. In Office of Wetlands, Oceans and Watersheds; EPA: Washington, DC, USA, 2007.
  25. Nevada Division of Environmental Protection. Load Duration Curve Methodology for Assessment and Total Maximum Daily Loads Development; Nevada Division of Environmental Protection: Reno, NV, USA, 2003; pp. 1–3.
  26. Environmental Corporation of Incheon. Available online: https://www.eco-i.or.kr (accessed on 16 October 2021).
  27. Ahn, T.W.; Jung, J.H.; Kim, T.H.; Kim, S.W.; Choi, I.; Oh, J.M. A study on the Characteristic of Pollutants of Water Quality and Sediments in Gul-po Stream Basin. J. Korean Soc. Environ. Eng. 2012, 34, 495–503. [Google Scholar] [CrossRef]
  28. Hwang, J.W.; Cho, W.S.; Byeon, S.J. Analysis of Water Quality and Hydraulic Characteristics of Gyeonging Ara Wataerway Basin using ADCP and EFDC. J. Soc. Converg. Knowl. 2015, 3, 51–56. [Google Scholar]
  29. Kong, D.S.; Yoon, S.K.; Lee, H.J.; Kim, B.I.; Kim, S.S.; Park, J.H.; Noh, H.R.; Kang, T.G.; Park, H.H.; Kim, S.M.; et al. Investigation on Loading and Water Quality Variation in Namhangang Drainage Basin(II); The Han River Environment Research Center National Institute of Environmental Research: Gyeonggi-do, Korea, 2006; pp. 1–126. [Google Scholar]
  30. Baek, K.H. Measures for Water Quality Management in the Lower Nakdong River during Dry Season. BDI Policy Focus 2013, 232, 1–12. (In Korean) [Google Scholar]
  31. Yim, Y.J.; Bang, J.Y.; Kim, Y.D. Changes in stream water quality according to land use at Kyong-an stream. Korean J. Ecol. 1995, 18, 341–351. [Google Scholar]
Figure 1. Water quality monitoring site in Gul-po: (a) The Gul-po basin; (b) mimetic diagram of Gul-po [18].
Applsci 11 09694 g001
Figure 2. Comparison of T-N concentrations in Gul-po stream water and ozone-treated reclaimed water: (a) T-N of ozone-treated discharge water (Cheong-cheon stream); (b) T-N of the Gul-po stream (Gulpo A1 measure point).
Applsci 11 09694 g002
Figure 3. Scatter graph of the flow–pollutant loading equation for the Gul-po stream.
Applsci 11 09694 g003aApplsci 11 09694 g003b
Figure 4. Results of the load duration curve plot from monitoring data at each point.
Applsci 11 09694 g004aApplsci 11 09694 g004b
Table 1. Target areas for the characteristic analysis [18].
Watershed AreaMeasure PointBasinLocation
UpperGulpocheon-1
(GP A1)
GulpoA04Sangdong, Wonmi-gu, Bucheon City,
(37.51522, 126.74529)
MiddleGulpocheon1-1
(GP A2)
GulpoA03Parkchon-dong, Gyeyang-gu, Incheon
(37.54025, 126.76138)
LowerGulpocheon-2
(GP A)
GulpoA02Gyeyang-dong, Gyeyang-gu, Incheon
(37.50870, 126.72585)
Table 2. Average water quality variable concentrations and discharge of each point from 2016 to 2020.
LocationYearBOD (㎎/L)COD (mg/L)SS (mg/L)T-N (mg/L)T-P (mg/L)TOC (mg/L)Discharge
(m3/s)
Upper20165.229.4415.823.370.27.340.25
20175.238.89.383.380.237.110.1
20184.357.6110.283.250.194.520.23
20192.076.296.088.570.113.950.41
20203.977.519.099.970.154.960.36
Middle20167.9212.9419.096.680.4110.156.41
20179.0615.0319.987.230.3511.421.68
20186.8011.2213.756.000.306.281.57
20194.828.708.957.840.194.731.27
20205.918.6610.128.180.235.342.12
Lower20163.678.1610.1613.010.356.428.64
20172.647.568.5612.810.284.477.76
20182.677.3010.3412.200.304.448.85
20192.927.948.4512.610.244.497.39
20202.857.509.0211.350.274.538.36
Table 3. Results of the flow–pollutant loading equation of the Gul-po stream.
WatershedFactorWater Quality Factor
BODCODTOCSST-PT-N
Upperb0.72220.91770.84940.88060.89651.4379
R20.39770.76760.68960.48070.40780.7400
Middleb1.09191.02651.07031.12681.07020.8779
R20.83900.90500.88110.77980.81950.9011
Lowerb1.69881.12851.09221.38511.24130.8569
R20.50870.77180.75160.59470.54720.7606
Table 4. Results of the load duration curve analysis at each point: (Phase 1) 2013–2020 target water quality; (Phase 2) 2021–2030 target water quality.
(%)
ClassificationWatershedWater Quality FactorHigh FlowsMoist ConditionsMid-Range FlowsDry ConditionsLow Flows
Phase 1 Target Water Overage RateUpperBOD06.897.8920.6815.0
T-P01.72000
MiddleBOD55.5628.5716.2228.5721.05
T-P01.7901.790
LowerBOD15.795.262.5600
T-P5.263.512.5600
Phase 2 Target Water Overage RateUpperBOD15.7922.4118.4246.5560
T-P05.172.6310.3410
MiddleBOD10085.7164.867578.95
T-P16.677.148.1112.55.26
LowerBOD47.3724.565.135.2615
T-P26.3210.532.571.7510
Publisher’s Note: MDPI stays neutral with regard to jurisdictional claims in published maps and institutional affiliations.

