Abstract
It is essential to expose students to real situations in science courses, to experience how classroom concepts are reflected in the real world. However, the materials and methods available are not always very adequate; for example, chemistry courses involve the supervision of reagents to avoid risky situations, in addition to the costs, logistics of preparing materials, and possible adverse environmental factors. As an alternative solution, the following experience was carried out using virtual reality (VR) equipment, with very realistic applications that allowed 304 fourth semester high school students to have an immersive, interactive, and contextualized experience of the disciplinary contents. The students were asked about their perception regarding the motivation and acceptance of the use of virtual reality. The results were 72% positive for attention, 61% positive for relevance, 64% positive for trust, and 71% positive for satisfaction. Also, they mentioned their intention to continue using this resource and create lines of research to study the different aspects that could form a disciplinary proposal for an entire course based on virtual reality.
1. Introduction
High school science courses include exposing students to laboratory experiences, where they can manipulate the materials used. However, often these materials could be risky, as some reagents used in chemistry courses are expensive and difficult to obtain. An alternative to physically showing these contents is to present them through technologies such as virtual reality (VR) that allows the student to be presented with an immersive framework for the representation, visualization, and understanding of the information [1]. VR is based on computer systems, through software and hardware that allow alternative realities to be constructed and visualized by powerfully simulating real situations [2]. At the same time, contact with these emerging technologies will enable students to be more familiar with the demands of Industry 4.0 [3], allowing the students to develop competencies and skills that will enable them to act in real future situations [4]; hence, educational institutions are increasingly beginning to explore these innovative technologies that are applied to abstract content that is often difficult for students to understand.
The primary motivation for developing these experiences is associated with the need for students to “live” science. However, that experience is often limited because some phenomena in chemistry occur at the molecular level. Thus, students see the results when manipulating reagents, but do not see the process and molecular interactions that lead to that result, giving a partial view of something real. Therefore, the advantage that these applications have is that they allow the student to be placed in a learning environment that allows them to learn about a topic of interest from perspectives that are difficult to obtain in other conditions, allowing them to interact from different frames of reference [5]; for example, at the molecular level, students must settle for using two-dimensional images that they can only observe, and that do not allow an interaction of or variation in parameters to explore and test possibilities that are important for understanding concepts better.
On the other hand, VR facilitates a multidimensional experience that favors engagement and allows students to have more excellent content retention. In a meta-analysis conducted by Merchant et al. [6], virtual reality interventions significantly affected the learning outcomes and knowledge obtained at high school levels. Considering that students are forming their disciplinary competencies at these educational levels, and acquiring the basis for the achievement of skills for their higher education, this study aimed to determine the motivation of high school students when performing an activity using VR technologies in a science subject.
2. Related Work
The following is literature related to the use of virtual reality in education. Although VR has had its most significant deployment in video games for several years, due to its possibility of presenting an immersive environment for the user [7,8], the chances of its use have made it extend to other fields. It is used in different contexts, such as science, industry, and economics, with education being one of the fields in which it is being used the most [9]. This technology is innovative because it allows traditional methodologies to be surpassed, especially in contexts where complex or abstract topics must be taught, and it involves the student in the learning process, without risks to their health or physical integrity [10]. According to the studies analyzed, further research is needed on these technologies and their impact on education. Although their benefits are recognized, the studies conducted cannot be generalized because they are limited to short-term experiments [11].
2.1. Learning with Virtual Reality
Virtual reality (VR) refers to the immersion of learners in concrete, contextualized, and everyday learning situations. Virtual reality learning should include elements that foster immersion, interaction, and imagination, and contain aspects that are in line with sustainable development [12]. Because learners control virtual objects, places, or situations, which are very believable to them, this results in the appropriation of a large amount of visual, auditory, and tactile information. In science courses, experimental laboratories are significant because they improve students’ skills and increase their interest in learning using these VR strategies [13]. Also, these laboratories are very safe, without risky materials and leading situations attached to reality.
Immersive virtual reality hardware creates a sensory experience that surrounds the user. VR is characterized by using a head-mounted display (HMD), enhanced with auditory, haptic, or other sensory feedback to give the virtual world an authentic look and feel [14]. Therefore, the virtual world is perceived as unmediated, and people often respond to stimuli as they would outside a virtual world. Immersive virtual reality also provides situated action, or the ability for people to move and act within a novel environment.
Situated action can facilitate knowledge acquisition because learning occurs in the environment of interest. People can learn by forming more positive associations towards a stimulus, and internalizing information by acting in space and performing movements that are relevant to a specific context, relative to simply internalizing information about a phenomenon [15]. Therefore, the use of VR increases learning achievement, and enhances interaction and interest [16]. These technologies have various benefits and disadvantages that must be considered by the teacher and the institution seeking to implement them.
The main benefits of using VR are that this technology can increase the motivation and participation of students. Also, the use of 3D models allows them to improve their learning experience. In turn, these objects help them investigate and obtain feedback. Finally, students can access these technological resources from mobile phones, tablets, or video game devices, so their access does not require complex equipment. Students feel immersed with concepts and processes through virtual reality hardware [2]. The disadvantages are that its use requires training for both the professors and the students, since VR programs present a certain degree of difficulty for those who are not familiar with these technologies [13]. In addition, some institutions cannot invest in the necessary equipment and fear the new, which involves leaving aside other traditional materials. There have also been reported cases where medical problems, such as migraines, disorientation, or vision problems, appear [17,18].
Some of the VR experiences are in Table 1. The study conducted by Tsaramirsis [19] sought to improve teaching effectiveness through VR by simulating a virtual classroom in which students could participate in lectures, interacting in real-time with teachers and other students in an asynchronous way. The experience was positive because it enhanced traditional video asynchronous viewing participation but did not include the presentation of abstract concepts nor the measurement of student motivation.

Table 1.
Comparison of VR studies.
Another study is that of Lütjens [7], in which virtual reality was used in cartography, using 3D digital models to represent large-scale terrain. The objective was to explore the landscape, and the results were analyzed by various professionals who participated in the experience. The results showed that VR could improve the educational experience in the water and geographic fields. On the other hand, authors used VR to simulate fires in virtual interiors, through 3D scenes [8]. The results showed that the visualization and simulation results are reliable and can be used in education.
Finally, Sdravopoulou [20] conducted a study with adults, analyzing motivation through gaming using augmented reality. The results were positive, although the authors mention that further research is still needed in these environments. In the case of our study, we seek to identify how to improve motivation in students by presenting abstract concepts through immersive elements that enhance the educational experience.
2.2. VR Chemistry Education
Studies dating back to the 1990s have explored the use of VR for science, technology, engineering, and mathematics (STEM) education. In an organic chemistry course, Ferrell et al. [21] used VR to explore the spatial relationships of molecular structures and their interactions to engage students in exploring the independent research of this field of study. In their results, they state that there was a gain in student learning and motivation. Other authors point out that the study of chemistry at the molecular level represents a challenge because it includes inaccessible content to the senses and must use physical models that involve a high cognitive demand and abstraction capacity [22,23]. The use of VR models could provide a new perspective on science learning.
Johnston et al. [24] claim that VR models involving 3D images allow students to interact with "real" microscopic models, resulting in a significant increase in the understanding of processes. On the other hand, Fairén, Motés and Insa [25] found that the most important added value of using VR in a science course is that students adapt the activity to their academic needs, allowing the equipment to be used as a self-management tool.
At Tecnológico de Monterrey, VR strategies have been applied to teach chemistry at initial levels, considering that the knowledge of students coming from secondary school is heterogeneous and they generally have low levels of knowledge of the disciplinary competencies required for this subject [26]. In a project applied at the undergraduate level, five activities were developed using virtual and augmented reality as an innovative didactic strategy within the chemistry course. The activities used various technologies, such as Oculus Go, Mel Chemistry, and virtual reality presentations, to study the contents. The results showed that the grades were higher in the groups in which these methodologies were taught.
2.3. Motivation
Meeting the main objective of the research was necessary to select the appropriate instrument to measure the fulfillment of this objective. For Keller [27], motivation refers to what people want, what they choose to do, and what they commit to doing. Naranjo [19] mentions the following two types of motivation: (1) intrinsic motivation, which refers to those situations where the person performs activities for the pleasure of doing them, regardless of whether they obtain recognition or not; and (2) extrinsic motivation, which is due to situations where the person is involved in activities mainly for instrumental purposes or for reasons external to the activity itself, such as obtaining a reward.
Students’ academic behavior is guided by their motives and intentions, which largely determine the cognitive resources when dealing with various types of learning. However, according to Keller [27], teachers do not feel responsible for students’ motivation, and the following reasons are stated for this:
- Teachers cannot choose who will be in their class.
- The class is mandatory.
- You do not have enough time to include all the required content, so you should forget about motivational activities.
- The course material in a science course is severe; it is not a fun and games situation.
- An educator’s responsibility is to teach. It is up to the students to decide whether they want to learn or not. You cannot control their motivation.
Based on the definition of motivation in the formative process of students, motivation is one of the most relevant variables, as it can determine the direction, positive or negative, that the student can follow concerning a course, and which must be considered in the design of a subject. One of the reasons that explains low performance or school dropout is a lack of motivation, where the elements of persistence and interest affect the willingness and concentration of the student [28]. If a student is not motivated, they will probably not attend the course correctly, do things for convenience, and have not achieved the objective.
Professors can handle motivation from different approaches. On the one hand, environmental theories are based on the principles of conditioning that affirm that a voluntary response is produced before a stimulus that can be reinforced positively or negatively, causing the operant behavior to strengthen or weaken [29]. At the other extreme are the humanistic theories that emphasize individuals’ freedom of their lives when taking the course.
The social learning theory [30] suggests that observational learning can have a powerful effect. The effect is enhanced when observers believe that the person demonstrating the behavior is similar to themselves; it assumes that motivation and behavior result from interactions between a person and the environment.
Considering motivation as a primordial element that determines the student’s attitudes towards learning, this work tries to assess the student’s intrinsic and extrinsic motivation. In this research chemistry teaching is supported with emerging technological resources, virtual reality, and a vivid experience in these environments. Considering that education trends show an increase in the use of new technologies and digitalization [31].
This study will be based on Bandura’s [32] postulate, since we want to demonstrate that creating virtual environments that emulate the real functioning of the concepts observed in science subjects (similar to the real world) can improve students’ motivation.
Keller [27] defined, based on expectancy-value motivation theories, the following four-dimensional motivational model with practical applications in instructional design: attention, relevance, confidence, and satisfaction (ARCS) that translate into motivations to learn, as follows:
- Attention: This dimension refers to gaining and maintaining the learner’s attention or interest. Milman [29] mentions that attention is divided into the following three categories: (1) perceptual arousal and (2) inquisitive arousal, which serve to gain attention, and (3) variability that is used to maintain it. To gain the learner’s interest and capture their attention, professors can use actions, words, and unexpected materials (1), and to maintain it, they must use various strategies to create different and exciting lessons.
- Relevance: This dimension focuses on the relevance of the course, concerning the objectives and needs of the students. Torres [33] mentions that, according to Mills [34], “it is essential that students perceive that in the teaching learning process the proposed contents are related to their interests”.
- Confidence: This dimension refers to the fact that students should feel confident in their ability to succeed in learning (expectation of success). According to Torres [4], the teacher must create a favorable environment for students to communicate their expectations during the lesson.
- Satisfaction: Students should feel satisfied with their achievement in the learning opportunity. Milman [29] mentions that intrinsic motivation is one of the most critical elements of satisfaction and is challenging to influence. Extrinsic motivation, however, is more easily influenced, primarily by using feedback.
The analysis of the above dimensions shows essential elements that should be considered as sources of motivation to improve students’ perception of their courses, which fits the present study.
2.4. Context
The study was conducted at the Eugenio Garza Lagüera High School in Monterrey, N.L., Mexico. This institution is part of a system of 26 high schools, professional and postgraduate campuses, distributed throughout the country. The following three types of baccalaureate are offered: bicultural, multicultural, and international.
The baccalaureate consists of 6 semesters, and, currently, the school has approximately 1450 students (706 females and 744 males).
The students cover mathematics, science, Spanish, languages, integral development, social sciences, and technology during their stay. For this research, the students exposed to the educational intervention were in the fourth semester in a chemistry course. This subject contains many theoretical elements that are reviewed through readings, illustrations, simple practices, and three-dimensional virtual models, due to their nature. Students tend to consider the subject as complicated or difficult.
3. Materials and Methods
The present study has a quantitative approach, in which a descriptive study was conducted. Implementation of VR was carried out, and an instrument based on the four dimensions of motivation adapted from Keller [18] was applied. The sample consisted of 304 students in the fourth semester in a Chemistry course; there were 153 of the female gender and 151 of the male gender. The selection was intentional concerning the professors who agreed to participate in the study. The participants were 60% of the total number of students in that subject and the teaching period in which the implementation was carried out, and six teachers participated. The data analysis was performed using descriptive and inferential statistics to determine the students’ motivation towards the VR-supported teaching intervention and possible significant differences between the genders of the participants.
3.1. Description of the Innovation
In the present work, participants used 64 GB Oculus Go VR devices, independent viewers, without connection to a computer or external sensors, with manual control to interact with the applications and battery autonomy of 60 min. Each viewer was pre-loaded with the MEL Chemistry application to be used in the chemistry course. The application has a bank of lessons according to the discipline’s curriculum, presented as playful and immersive. The student manipulates from atoms to form molecules to reagents to obtain certain compounds. The application contents were taken as a reference by the authors of this paper to develop the activity that would allow each student to explore and interact with virtual molecular models.
3.2. Implementation
In the chemistry course, the activity was applied to 304 fourth semester students in molecular geometry using the Mel Chemistry application, which allows them to observe and manipulate compounds in three dimensions. The objective of the activity was to identify the geometry of different organic compounds. Based on their experience, the teachers participating in the experiment proposed the names of 100 other organic compounds associated with a specific geometry, which could be linear, tetrahedral, trigonal pyramidal, or trigonal planar. Each combination was written individually on paper and placed inside a plastic Easter egg in a basket. Afterwards, each student randomly took one of the Easter eggs, opened it and took note of the compound to be analyzed. Then, they placed the paper back inside the plastic container and returned it so that the basket would have many names of organic compounds available to the students.
Mel Chemistry is an application produced by Mel Science that users can manipulate with Oculus Go devices. Among its advantages, it makes chemistry classes visual and interactive, covering all the contents of standard chemistry courses and helping to improve students’ grades and averages. The app includes topics such as atomic structure, through which students who participated in this experience build molecules and explore bonds. Figure 1 shows an impression of how compounds are studied.
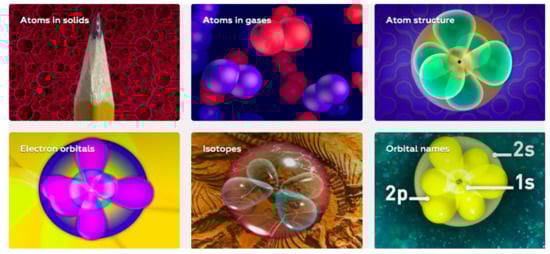
Figure 1.
Contents of the courses in the Mel Chemistry application.
The students manipulated the Mel Chemistry app, being a generation of digital natives, learning to use it required a minimum of technical indications. Then they located the compound and used the benefits of virtual reality to rotate the molecule in different axes to get a better idea of its geometry. They made comments among themselves about the compound they were analyzing and clarified their doubts with the teacher. The exploration process for each compound took the students an average of 15 min; at the end, they returned to the basket, took another Easter egg, and repeated the process. The students reviewed a minimum of two compounds, but the exploration was finished 20 min before the end of the class to give them time to answer the questionnaire to know their point of view regarding the experience on a Likert scale and placed in the Socrative application. The present immersive experience took place in January 2020. The implementation experience is shown in Figure 2.
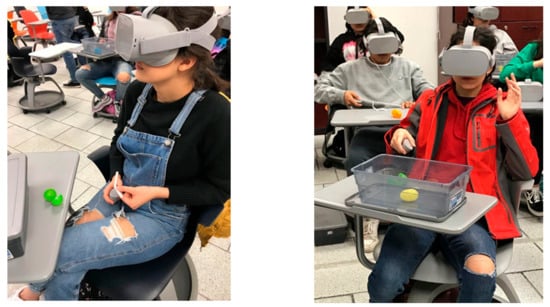
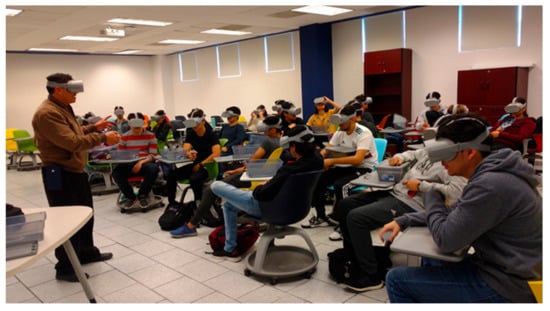
Figure 2.
Implementation of VR in the classroom with chemistry students.
3.3. Instrument
Different tools were evaluated to select the appropriate instrument, comparing what these tools measured against the objectives to be covered. To obtain the data from the sample studied and due to the complexity of the factors that contribute to student motivation, the instructional materials motivation survey (IMMS) instrument was used, which was developed by Keller [18] and is associated with his ARCS motivation model.
The IMMS is composed of 36 questions [18], which collect information from the following four dimensions that comprise it: attention (12 questions), confidence (9 questions), relevance (9 questions), and satisfaction (6 questions). The instrument is elaborated with a Likert-type construction and with five response options, from 1 = not true/disagree to 5 = very true/agree; these options, for purposes of quantification of the results regarding the motivation of students towards the use of VR, were translated for this report into five levels, which are as follows: very positive, positive, neutral, negative, very negative, which were reported for each of the dimensions of attention, relevance, confidence and satisfaction (ARCS), first in general and then differentiated by gender.
We reviewed different studies with similar characteristics and samples to validate the results obtained to validate the instrument. Some research that supports the validity of the model is the study conducted by Cook [35]. They measure the motivational characteristics of medical courses, or the study conducted by Cózar [36] to identify the motivation to use virtual reality in teaching history.
Additionally, the instrument was evaluated by an expert who considered that it adequately met the objectives of this study. The questionnaire was applied in its original language to a population of bilingual students in the 4th semester of high school studying Chemistry, modified and supported by virtual reality. The questions are presented in Appendix A.
4. Results
4.1. Results by Dimension
The first dimension analyzed is attention. The questions include the students’ point of view regarding the following: how interesting the materials are, and if the content is eye-catching, of good quality, presented in an organized way, able to arouse curiosity, able to surprise the students when interacting, and with a variety of images that avoid boredom. Figure 3 shows that 72% of the responses were positive, 17% had no definite view, and only 9% were unfavorable.
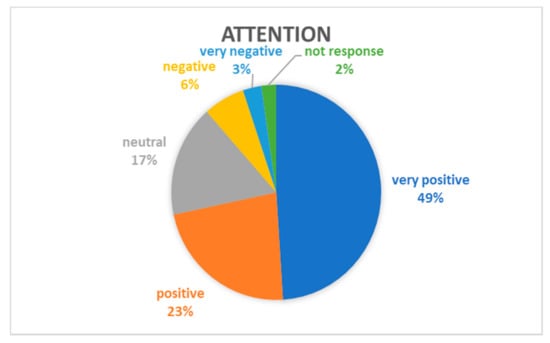
Figure 3.
Graph of the average response to the attention dimension questions.
The second dimension is relevance, and the questions are oriented towards how the VR images relate to the course content and real life, i.e., it measures the students’ perception of the future application of the materials used and the learning achieved. According to Figure 4, the positive responses in terms of relevance were 61%, neutral responses were 23%, and negative responses were 14%.
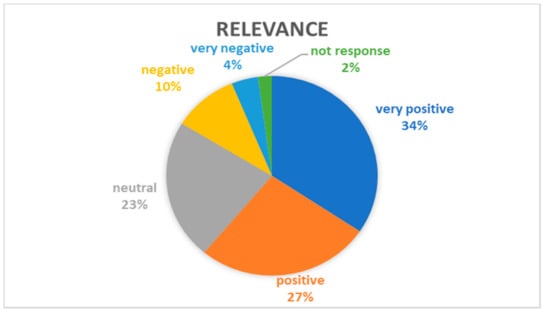
Figure 4.
Graph of the average response to the questions of the relevance dimension.
The confidence dimension is oriented to questions about the ease students felt when interacting with the application, its usefulness in answering the questions of the activity, and whether they felt confident to solve a test successfully. The confident dimension shows positive responses of 64%, 21% answered without a defined point of view, and 12% selected the negative option. The results are shown in Figure 5.
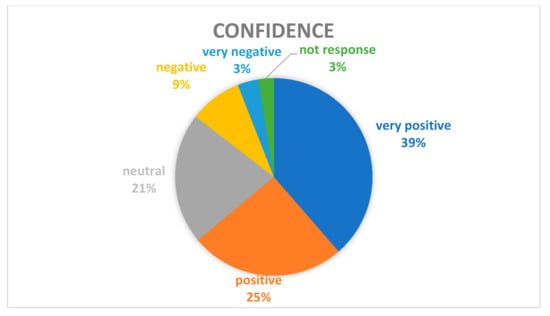
Figure 5.
Graph of the average response to the questions of the trust dimension.
In the satisfaction dimension, the questions focus on the students’ perceived sense of accomplishment, pleasure, enjoyment in interacting with VR, and their attitude towards having more of these activities. Figure 6 shows that the positive responses were 71%, neutral responses were 18%, and negative responses were 8%; satisfaction obtained the lowest negative score of the four dimensions analyzed.
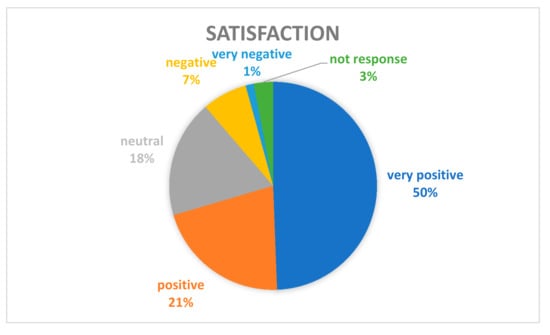
Figure 6.
Graph of the average response to the satisfaction dimension questions.
4.2. Responses by Gender
Based on the results and the demographic data of the students, descriptive and inferential statistical studies were carried out to determine if there was any difference in the responses depending on gender.
4.2.1. Descriptive Statistics
The most positive response for each of the four dimensions is in item E of the options, which corresponds to “very true”; similarly, the most negative response is in item A, which corresponds to “not true”.
In the presentation of the results for each dimension, the percentages of those questions that were not answered, or those that were answered using two or more options, were included. In both cases, these responses appear in the graphs as “unanswered”.
The percentages represented in the graphs are rounded, considering that from 0.5, the number is rounded to the next higher integer, and lower values to the next lower one.
Attention
Twelve questions, answered by 153 female students, evaluated the dimension of attention; this implies that a total of 1836 responses were generated, of which 41 were left unanswered or answered with more than one option, which constitutes 2.2% of the total.
One hundred and fifty-one male students participated, generating 1812 responses, of which 42 remained unanswered, representing 2.3%.
The results of the attention dimension by gender are shown in Figure 7. The very negative response was selected by 3.4% of the male students and 2.3% of the female students, giving a difference of 1.1 percentage points, being more negative among male students than female students. On the other hand, 54.2% of the female students chose a very positive response, and 43.7% of the male students. The difference between the values of both groups is 10.5 percentage points, which is more favorable among the female students.
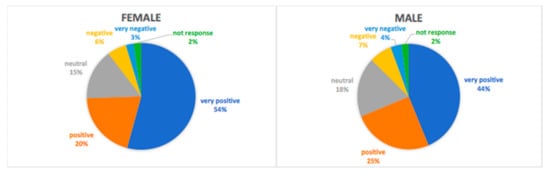
Figure 7.
Results of the attention dimension by gender.
The neutral response for this dimension was 15.3% among the female students and 18.3% among the male students, and the negative response was 5.7% among the female students and 7.1% among the male students.
Relevance
The dimension of relevance had nine questions answered by 153 female students, generating 1377 possible answers, of which 29 remained unanswered, representing 2.1% of the total. In the case of the male students, the possible answers were 1359, and 29 remained unanswered, that is, 2.1% of the total.
The results for this dimension are shown in Figure 8, and it was found that the very negative response was selected by 4.2% of the male students and by 3.9% of the female students; the difference being 0.3 percentage points more negative among the male students. The most positive response was selected by 37.5% of the female students and 31.3% of the male students; the difference being 6.2 percentage points greater for the female students. For this dimension, the neutral response was selected by 21.1% of the female students and 24.4 % of the male students.
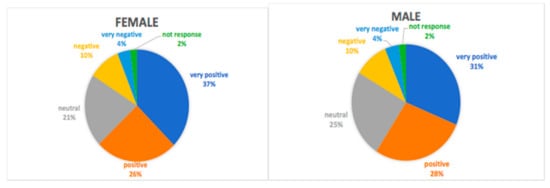
Figure 8.
Results of the relevance dimension by gender.
Confidence
In the dimension of confidence, the 153 female students answered nine questions, giving a total of 1377 possible answers, of which, in this group, there were 37 unanswered, that is, 2.7% of the total, and in the 151 male students, there were 33 unanswered, which represents 2.4% of the total. The responses are shown in Figure 9.
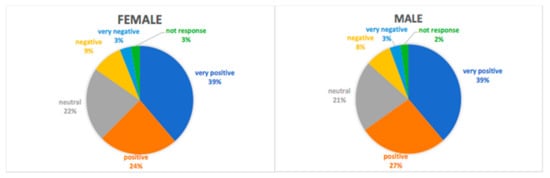
Figure 9.
Results of the confidence dimension by gender.
The most negative option was selected by 3.4% of the male students and 3.4% of the female students. The percentages represent that in the total of responses for this dimension, there were 46 negative responses by the male students and 46 by the female students. The most positive response was selected by 38.7% of the female students and 38.6% of the male students, with a difference of 0.1 percentage points between these values.
Satisfaction
In the satisfaction dimension, six questions were used, which were answered by 153 female students, giving a total of 918 possible answers, leaving 27 unanswered, corresponding to 2.9%. As for the male students’, the possible answers were 906, and 28 were left unanswered, representing 3.1% of the total. The responses are shown in Figure 10.
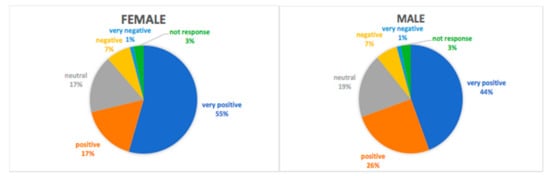
Figure 10.
Satisfaction dimension responses by gender.
Eleven female students selected the most negative option, that is, 1.2% of the total of their responses, and this option was selected by 12 male students, which corresponds to 1.3% of the total, with a difference of 0.1 percentage points between these values, which represents very similar numbers. In this dimension, 54.5% of the female students and 44.2% of the male students selected the most positive response, with a difference of 9.6 percentage points between these values.
4.2.2. Inferential Statistics
Because the female gender showed a greater number of very positive responses in three of the four dimensions, we performed a Student’s t-test to determine if there is any statistical difference between genders regarding the perception of the experience for each dimension. The results are shown in Table 2.
Table 2.
Table of Student’s t-test results by gender.
When comparing the attention between the two populations, we found that the mean for the female students was 4.11, with a standard deviation of 0.65. On the other hand, in the male students, the mean was 3.91, with a standard deviation of 0.72. In this dimension, the Student’s t-test resulted in a p-value of 0.0126, with a confidence level of 95%, that is, α = 0.05. With this value, it can be affirmed that there is a difference between the responses of the populations.
For the dimension of relevance, the mean for the female students was 3.76, with a standard deviation of 0.64, and for the male students, the mean was 3.65, with a standard deviation of 0.71. The p-value was 0.1694, again with a confidence level of 95%, i.e., α = 0.05. By obtaining a value greater than this, it can be stated that there is no difference between the responses of the populations.
In the confidence dimension, for the female students, the mean was 3.76, with a standard deviation of 0.74, and for the male students, it was 3.82, with a standard deviation of 0.67. The p-value was 0.5370, which implies that there is no difference between the populations.
Finally, in the dimension of satisfaction, the mean for the female students was 4.07, with a standard deviation of 0.80, and for the male students, it was 3.95, with a standard deviation of 0.85. In this case, the p-value was 0.2109, showing no difference between the studied populations.
5. Discussion
Using the Mel Chemistry application, this study made it possible to implement a virtual reality experience with 304 fourth semester students of a chemistry subject. Because the concepts studied are abstract and challenging to present in laboratory environments, VR was conducted. Considering that the use of immersive technologies, such as VR, can help to better understand and visualize the information [1], is in this study, we sought to know the motivation that is generated in the student by using emerging technologies for the study of science subjects in high school.
This research presents a proposal for the use of VR that was carried out with students to identify different organic compounds, who responded to a questionnaire to identify the different dimensions of both intrinsic and extrinsic motivation. The results were mostly positive for all the dimensions, for both types of motivation. These findings agree with studies conducted by other authors. The use of this type of interaction allows students to explore the concepts and increase their motivation to study the subjects [8,9].
In the four dimensions suggested by Keller [18] for motivation, this research showed satisfactory results regarding students’ opinions about the immersive experience using VR. The dimensions of attention and satisfaction obtained the highest positive percentage, related to intrinsic motivation, which is the most difficult to achieve in educational interventions [29]. This result agrees with other studies, in which virtual reality technology motivates students by providing real experiences and the interest generated by using this immersive technology [8,17]. The findings also establish that attention was more significant for women than for men, with a significant difference. However, there is a positive response for both genders in this dimension. In this sense, the study of Mouronte-López [16] indicates that they found a difference in female students’ interest compared to males in the subjects studied using virtual reality. Still, they did not find differences in other variables.
In the case of confidence, this was lower for women. Although there were no significant differences between both genders, training is necessary due to the VR program’s degree of difficulty for those who are unfamiliar with these methods [13]. So, with more frequent use, students could improve the results in this dimension.
6. Conclusions
The present work allowed us to determine the motivation of high school students to perform a virtual reality experience in a chemistry subject. The instrument used allowed us to measure the following four dimensions of motivation: attention, relevance, confidence, and satisfaction. We found that the most favorable results were attention and satisfaction. These results are consistent with other studies in which using technologies such as VR increases student interest.
When comparing the results by gender, we also identified higher results for women in the following three dimensions: attention, relevance, and satisfaction. They were only lower in the confidence dimension. However, when we checked if there were significant differences between both genders, we only found a difference in attention, so gender did not present significant differences in the other three dimensions.
We conclude that the use of virtual reality for this study group was positive in terms of motivation. Professors can use VR to study subjects associated with chemistry, to improve attention to the content learned. Therefore, this technology could incorporate it into subjects in other related topics. In addition, more use can increase confidence, since knowledge is required to handle these technologies. As limitations, despite these positive results, it should be considered that they apply to the context in which we conducted the research. In this case, the students have facilities for internet access, with classrooms with furniture that allows the development of this type of educational experience, and with students who are interested in the use of this technology, also with digital expertise and immersed in a demanding academic system where activities are carried out competitively.
For future studies, we recommend extending these immersive experiences to other subject contents, or even in other subjects that require studying complex topics, such as the one seen in this course. Also, we could work with these same students to observe whether the confidence in using these technologies increases, and analyze differences in other variables, such as age or students’ interest in scientific careers. The study of gender is also important to establish new tools to motivate students in STEM careers.
Author Contributions
Conceptualization, H.A.S.G., M.I.E.M. and M.P.C.; methodology, H.A.S.G. and M.I.E.M.; software, H.A.S.G.; investigation, H.A.S.G., M.I.E.M. and M.P.C.; writing—original draft preparation, H.A.S.G., M.I.E.M. and M.P.C.; writing—review and editing, H.A.S.G., M.I.E.M. and M.P.C.; supervision, H.A.S.G., M.I.E.M. and M.P.C. All authors have read and agreed to the published version of the manuscript.
Funding
The authors would like to acknowledge the financial support of NOVUS (Grant number: N19-52), Institute for the Future of Education, Tecnologico de Monterrey, Mexico, in the production of this work.
Institutional Review Board Statement
Not applicable.
Informed Consent Statement
Informed consent was obtained from all subjects involved in the study.
Data Availability Statement
Not applicable.
Acknowledgments
The authors would like to acknowledge the financial support of Writing Lab, Institute for the Future of Education, Tecnologico de Monterrey, Mexico, in the production of this work.
Conflicts of Interest
The authors declare no conflict of interest.
Appendix A
Table A1.
Instructional materials motivation survey [18].
Table A1.
Instructional materials motivation survey [18].
| 1. When I first looked at this lesson, I had the impression that it would be easy for me. |
| 2. There was something interesting at the beginning of this lesson that got my attention. |
| 3. This material was more difficult to understand than I would like for it to be. |
| 4. After reading the introductory information, I felt confident that I knew what I was supposed to do. |
| 5. Completing the exercises in this lesson gave me a satisfying feeling of accomplishment. |
| 6. It is clear to me how the content of this material is related to things I already know. |
| 7. Many of the pages had so much information that it was hard to pick out and remember the important points. |
| 8. These materials are eye-catching. |
| 9. There were stories, pictures, or examples that showed me how this material could be important to some people. |
| 10. Completing this lesson successfully was important to me. |
| 11. The quality of the writing helped to hold my attention. |
| 12. This lesson is so abstract that it was hard to keep my attention on it. |
| 13. As I worked on this lesson, I was confident that I could learn the content. |
| 14. I enjoyed this lesson so much that I would like to know more about this topic. |
| 15. The pages of this lesson look dry and unappealing |
| 16. The content of this material is relevant to my interests. |
| 17. The way the information is arranged on the pages helped keep my attention. |
| 18. There are explanations or examples of how people use the knowledge in this lesson. |
| 19. The exercises in this lesson were too difficult |
| 20. This lesson has things that stimulated my curiosity. |
| 21. I really enjoyed studying this lesson. |
| 22. The amount of repetition in this lesson caused me to get bored sometimes |
| 23. The content and style of writing in this lesson convey the impression that its content is worth knowing. |
| 24. I learned some things that were surprising or unexpected. |
| 25. After working on this lesson for a while, I was confident that I would be able to pass a test on it. |
| 26. This lesson was not relevant to my needs because I already knew most of it. |
| 27. The wording of feedback after the exercises, or of other comments in this lesson, helped me feel rewarded for my effort. |
| 28. The variety of reading passages, exercises, illustrations, etc., helped keep my attention on the lesson. |
| 29. The style of writing is boring. |
| 30. I could relate the content of this lesson to things I have seen, done, or thought about in my own life. |
| 31. There are so many words on each page that it is irritating. |
| 32. It felt good to successfully complete this lesson. |
| 33. The content of this lesson will be useful to me. |
| 34. I could not really understand quite a bit of the material in this lesson. |
| 35. The good organization of the content helped me be confident that I would learn this material. |
| 36. It was a pleasure to work on such a well-designed lesson. |
References
- Tamayo, J.L.R.; Hernández, B.M.; Gómez, H.G. Digital data visualization with interactive and virtual reality tools. Review of current state of the art and proposal of a model ICONO 14. Rev. Comun. Tecnol. Emerg. 2018, 16, 40–65. [Google Scholar]
- Martín-Gutiérrez, J.; Mora, C.E.; Añorbe-Díaz, B.; González-Marrero, A. Virtual Technologies Trends in Education. Eurasia J. Math. Sci. Technol. Educ. 2017, 13, 469–486. [Google Scholar] [CrossRef]
- Sari, I.; Sinaga, P. The impact of industrial revolution 4. In 0 on basic chemistry learning. In Proceedings of the 2nd Science And Mathematics International Conference (SMIC 2020): Transforming Research and Education of Science and Mathematics in the Digital Age, Jakarta, Indonesia, 8–9 August 2020. [Google Scholar]
- Flores, J.; Camarena, P.; Avalos, E. Virtual reality, an innovative technology applicable to the teaching process of engineering students. Apertura 2014, 6, 1–13. [Google Scholar]
- Markowitz, D.M.; Laha, R.; Perone, B.P.; Pea, R.D.; Bailenson, J.N. Immersive Virtual Reality Field Trips Facilitate Learning About Climate Change. Front. Psychol. 2018, 9, 2364. [Google Scholar] [CrossRef] [PubMed]
- Merchant, Z.; Goetz, E.T.; Cifuentes, L.; Keeney-Kennicutt, W.; Davis, T.J. Effectiveness of virtual reality-based instruction on students’ learning outcomes in K-12 and higher education: A meta-analysis. Comput. Educ. 2014, 70, 29–40. [Google Scholar] [CrossRef]
- Lütjens, M.; Kersten, T.P.; Dorschel, B.; Tschirschwitz, F. Virtual Reality in Cartography: Immersive 3D Visualization of the Arctic Clyde Inlet (Canada) Using Digital Elevation Models and Bathymetric Data. Multimodal Technol. Interact. 2019, 3, 9. [Google Scholar] [CrossRef]
- Guo, Y.; Zhu, J.; Wang, Y.; Chai, J.; Li, W.; Fu, L.; Xu, B.; Gong, Y. A Virtual Reality Simulation Method for Crowd Evacuation in a Multiexit Indoor Fire Environment. ISPRS Int. J. Geo-Inf. 2020, 9, 750. [Google Scholar] [CrossRef]
- Cao, L.; Lin, J.; Li, N. A virtual reality simulation method for crowd evacuation in a multiexit indoor fire environment. Comput. Hum. Behav. 2019, 90, 37–45. [Google Scholar] [CrossRef]
- Cruz, J.F.; Gallardo, P.C.; Villarreal, E.A. La realidad virtual una tecnología innovadora aplicable al proceso de enseñanza de los estudiantes de ingeniería. Apertura 2015, 6, 86–99. [Google Scholar]
- Aylward, K.; Dahlman, J.; Nordby, K.; Lundh, M. Using Operational Scenarios in a Virtual Reality Enhanced Design Process. Educ. Sci. 2021, 11, 448. [Google Scholar] [CrossRef]
- Su, C.-H.; Cheng, T.-W. A Sustainability Innovation Experiential Learning Model for Virtual Reality Chemistry Laboratory: An Empirical Study with PLS-SEM and IPMA. Sustainability 2019, 11, 1027. [Google Scholar] [CrossRef]
- Monita, F.A.; Ikhsan, J. Development Virtual Reality IPA (VR-IPA) learning media for science learning. In Journal of Physics: Conference Series; IOP Publishing: Bristol, UK, 2020; Volume 1440. [Google Scholar] [CrossRef]
- Ahn, S.J.; Bostick, J.; Ogle, E.; Nowak, K.; McGillicuddy, K.T.; Bailenson, J.N. Experiencing Nature: Embodying Animals in Immersive Virtual Environments Increases Inclusion of Nature in Self and Involvement with Nature. J. Comput. Commun. 2016, 21, 399–419. [Google Scholar] [CrossRef]
- Weisberg, S.M.; Newcombe, N.S. Embodied cognition and STEM learning: Overview of a topical collection in CR:PI. Cogn. Res. Princ. Implic. 2017, 2, 38. [Google Scholar] [CrossRef] [PubMed]
- Mouronte-López, M.L.; García, A.; Bautista, S.; Cortés, C. Analyzing the gender influence on the interest in engineering and technical subjects. Int. J. Technol. Des. Educ. 2021, 31, 723–739. [Google Scholar] [CrossRef]
- Răzvan-Alexandru, C. Virtual Reality, Augmented Reality and Mixed Reality—Trends in Pedagogy. Soc. Sci. Educ. Res. Rev. 2018, 5, 169–179. [Google Scholar]
- Won, J.-H.; Kim, Y. A Study on Visually Induced VR Reduction Method for Virtual Reality Sickness. Appl. Sci. 2021, 11, 6339. [Google Scholar] [CrossRef]
- Tsaramirsis, S.; Buhari, K.; Al-Shammari, S.; Ghazi, M.S.; Nazmudeen, M. Towards simulation of the classroom learning experience: Virtual reality approach. In Proceedings of the 3rd International Conference on Computing for Sustainable Global Development (INDIACom), New Delhi, India, 16–18 March 2016; 1343–1346. [Google Scholar]
- Sdravopoulou, K.; González, J.M.; Hidalgo-Ariza, M. Assessment of a Location-Based Mobile Augmented-Reality Game by Adult Users with the ARCS Model. Appl. Sci. 2021, 11, 6448. [Google Scholar] [CrossRef]
- Ferrell, J.B.; Campbell, J.P.; McCarthy, D.R.; McKay, K.T.; Hensinger, M.; Srinivasan, R.; Zhao, X.; Wurthmann, A.; Li, J.; Schneebeli, S.T. Chemical exploration with virtual reality in organic teaching laboratories. J. Chem. Educ. 2019, 96, 1961–1966. [Google Scholar] [CrossRef]
- Frevert, M.; Di Fuccia, D.-S. Virtual Reality as a Means of Teaching Contemporary Chemistry. In Proceedings of the 3rd International Conference on Digital Technology in Education, Yamanashi, Japan, 25–27 October 2019; pp. 34–38. [Google Scholar]
- Gaeta, M.; Cavazos, J. Academic involvement in mathematics: Perception of teaching goals and self-regulatory processes in high school students. Rev. Ibero-Am. Estud. Educ. 2015, 9, 951–968. [Google Scholar] [CrossRef]
- Johnston, A.P.; Rae, J.; Ariotti, N.; Bailey, B.; Lilja, A.; Webb, R.; Ferguson, C.; Maher, S.; Davis, T.P.; Webb, R.I.; et al. Journey to the centre of the cell: Virtual reality immersion into scientific data. Traffic 2018, 19, 105–110. [Google Scholar] [CrossRef] [PubMed]
- Fairén, M.; Moyés, J.; Insa-Calderón, E. VR4Health: Personalized teaching and learning anatomy using VR. J. Med. Syst. 2020, 44, 1–11. [Google Scholar] [CrossRef] [PubMed]
- Ramirez, J.A.; Bueno, A.M.V. Learning organic chemistry with virtual reality. In Proceedings of the 2020 IEEE International Conference on Engineering Veracruz (ICEV), Veracruz, México, 26–29 October 2020; pp. 1–4. [Google Scholar]
- Keller, J.M. Motivational Design for Learning and Performance: The ARCS Model Approach; Springer US: Berlin/Heidelberg, Germany, 2010. [Google Scholar] [CrossRef]
- Naranjo, M. Motivation: Theoretical Perspectives and Some Considerations of its Importance in the Educational Environment. Rev. Educ. 2009, 33, 153–170. [Google Scholar]
- Milman, N.B. Defining and conceptualizing mixed reality, augmented reality, and virtual reality. Distance Learn. 2018, 15, 55–58. [Google Scholar]
- Skinner, B.F. Science and Human Behavior; Free Press: New York, NY, USA, 1953. [Google Scholar]
- Ramírez-Montoya, M.S.; Andrade-Vargas, L.; Rivera-Rogel, D.; Portuguez-Castro, M. Trends for the Future of Education Programs for Professional Development. Sustainability 2021, 13, 7244. [Google Scholar] [CrossRef]
- Bandura, A. Social Learning Theory; Englewood Cliffs: Prentice-Hall, NJ, USA, 1977. [Google Scholar]
- Torres, J. Motivational Design ARCS (Attention, Relevance, Confidence and Satisfaction. Available online: https://www.academia.edu/6516253/Dise%C3%B1o_Motivacional_ARCS_Atenci%C3%B3n_Relevancia_Confianza_y_Satisfacci%C3%B3n (accessed on 9 September 2021).
- Mills, R. Kids CollegeTM 2004: An implementation of the ARCS Model of Motivational Design. Available online: http://www.contentedits.com/img.asp?id=1706 (accessed on 9 September 2021).
- Cook, D.A.; Beckman, T.J.; Thomas, K.G.; Thompson, W.G. Measuring Motivational Characteristics of Courses: Applying Kellerʼs Instructional Materials Motivation Survey to a Web-Based Course. Acad. Med. 2009, 84, 1505–1509. [Google Scholar] [CrossRef]
- Cózar, R.; González-Calero, J.; Villena, R.; Merino, J. Analysis of the Motivation before the Use of Virtual Reality in the Teaching of the History in Future Teachers; University of Castilla-La Mancha: Castilla-La Mancha, Spain, 2019. [Google Scholar]
Publisher’s Note: MDPI stays neutral with regard to jurisdictional claims in published maps and institutional affiliations. |
© 2021 by the authors. Licensee MDPI, Basel, Switzerland. This article is an open access article distributed under the terms and conditions of the Creative Commons Attribution (CC BY) license (https://creativecommons.org/licenses/by/4.0/).