Abstract
In the application of pulsating heat pipes (PHPs), the lengths of the adiabatic sections are usually determined by the distance between the heat source and the heat sink, and have important effects on the performance of PHPs. However, there was little research on the effect of the adiabatic section lengths on the performance of PHPs. In this work, a new transient numerical model was proposed to investigate the transient flow and the heat transfer for PHPs with various adiabatic section lengths of 60, 120, 180, and 240 mm. Based on the numerical results, the flow and the heat transfer characteristics of the PHPs were analyzed. It was found that the flow velocities in the PHP with different adiabatic lengths increased with the increase in the heat input, and the mean velocity was calculated to be in the range of 0.139–0.428 m/s, which was consistent with the previous experimental results. The start-up performance of the PHP was better with shorter adiabatic section length. Furthermore, the thermal resistances of the PHPs with different adiabatic section lengths were calculated to analyze the effects of the adiabatic section length on the performance of the PHP. The results showed that when the heat input was 20 W, the PHP with the adiabatic section of 60 mm showed the lowest thermal resistance, whereas the PHP with longer adiabatic section length presented lower thermal resistance at high heat input (≥25 W).
1. Introduction
Rapid development of electronic industries has resulted in higher heat fluxes of electronic devices, and more effective and environmentally friendly methods are required to face the challenges associated with thermal management. Pulsating heat pipes (PHPs), as a kind of two-phase passive heat transfer device, have drawn wide attention due to their advantages of excellent heat transfer capability, simple structure, low cost, and high flexibility [1]. However, the thermal-hydraulic behavior of the PHP is complex, and thus it is difficult to predict the thermal performance of the PHP. To date, several approaches have been developed to theoretically investigate the thermal performance of PHP, including artificial neural networks (ANNs) [2,3], computational fluid dynamics (CFD) [4,5], and numerical analysis.
The numerical approach, which considers mass, momentum, and energy equations, can not only predict the transient performance of the PHP, but also help researchers to understand the operation mechanism. Several numerical models have been proposed for predicting the heat transfer performance of the PHP, and Table 1 shows the typical numerical models used in the past 10 years for predicting the heat transfer performance of the PHP [6,7,8,9,10,11,12,13,14,15,16]. From Table 1, it could be seen that the numerical models had been improved to get closer to the actual operation of the PHP by considering local pressure losses in the bend [6,14] or the dynamics of the liquid film [13,15] or the heterogeneous and homogeneous phase changes in the PHP [11,15]. However, due to the complexity of the operating mechanism, there are still a number of problems that must be overcome in numerical investigations. For example, the calculation on capillary force was one of the problems needed to be overcome in the numerical investigation. It was found that the capillary force had significant effects on the flow motion of the working fluid inside the PHP in previous experimental investigations [17,18]. However, in the numerical models shown in Table 1, the dynamic contact angles were usually assumed to be zero, and the capillary force was ignored. Only Zhao et al. [16] considered the effect of the capillary force on the flow motion of the working fluid in their numerical investigation. Zhao et al. [16] assumed that the advancing contact angle and the receding contact angle were 45° and 25°, respectively. But the advancing and receding contact angles of the working fluid change with the flow motion of the working fluid during operation [19], and therefore, the calculation of the capillary force should be improved. In addition, the simulation on the coalescence of vapor plugs was another problem needed to be overcome. During the operation of PHP at high heat input, more bubbles are generated in the PHP, different bubbles are contacted, and the coalescence of vapor plugs can be observed in the PHP [20]. Figure 1 shows the coalescence of vapor plugs during visual experiments in our previous work [21]. However, the coalescence of vapor plugs was usually neglected in some numerical models [6,7,8,9,10,11,12,13,14,15,16], and long vapor plugs were hardly simulated in PHPs which made the simulation results on flow characteristics deviate from the actual results. Meanwhile, bubbles were assumed to only generate at particular positions of the PHP [9,10], which affected the pressure distribution in the PHP and further influenced the flow and heat transfer characteristics. In addition, the necessary superheat for bubble generation changed with the thermophysical properties of the working fluids and the local heat flux. Thus, assuming the superheat as a constant brought some errors to the calculation on the latent heat transfer. The numerical simulations needed to be improved to simulate the bubble generation without a large amount of subjective fitting parameters by the researchers.
Table 1.
Typical numerical models in recent 10 years.
Figure 1.
Connection and coalescence of vapor plugs at high input power.
It is well known that the performance of the PHP is influenced by many parameters, such as the thermophysical properties of the working fluids, the inclination angles, the structure parameters of the PHP, etc. The adiabatic section length, as one of the structure parameters, has a significant effect on the practical application of the PHP, because the adiabatic section length of PHP was determined by the distance between the heat source and the heat sink. To ensure that the PHP can operate efficiently in practical situations, the influence of the adiabatic section length on the heat transfer performance of the PHP was investigated. For example, Czajkowski et al. [22] experimentally investigated the effect of the adiabatic length on the heat transfer performance of the PHP, and the results showed that the startup performance of the PHP with shorter adiabatic section length was better than that with longer adiabatic section length. In addition, with the increase of the adiabatic section length, the dry-out heat input of the PHP was also increased. Thus, the adiabatic section length had a significant effect on the performance of the PHP in practical applications. However, few models have been validated for transient operations of the PHP with various adiabatic section lengths. Only Li et al. [5] developed a CFD model, using Ansys/Fluent, to investigate the effect of the adiabatic section length on the performance of the PHP. The results showed that, as the adiabatic section length increased, the start-up time of the PHP reduced and the anti-dry-out ability was weakened.
Based on the existed research, a new transient numerical model was proposed to investigate the transient flow of the working fluid and the transient heat transfer in the PHP with various adiabatic section lengths (60–240 mm) in this work. After the model was validated by comparison with the experimental data, the effect of the adiabatic section length was analyzed by means of the numerical simulation results. The research will provide a valuable reference for a design tool for PHP construction and implementation, particularly for the design of the adiabatic length.
2. A New Transient Numerical Model
The main features for the new transient numerical model to improve its prediction accuracy were shown in the following aspects: (1) To approach to the real flow motion in the PHP, the capillary force was calculated, and the dynamic contact angles were calculated based on the flow velocity of the liquid slug. (2) The coalescence of vapor plugs, as shown in Figure 1, was considered in the numerical simulation, and the simulation results were more representative of the actual flow in the PHP. (3) A new vapor slug was formed in a liquid slug when the liquid evaporation satisfied the relationship () without assuming particular positions for nucleation. Moreover, the superheat needed for the bubble generation was calculated using the correlation provided by Davis and Anderson [23,24]. Thus, compared with previous models, the operation of the PHP obtained by the transient model of this work more closely approximated the actual situation without a large amount of subjective fitting parameters by the researchers.
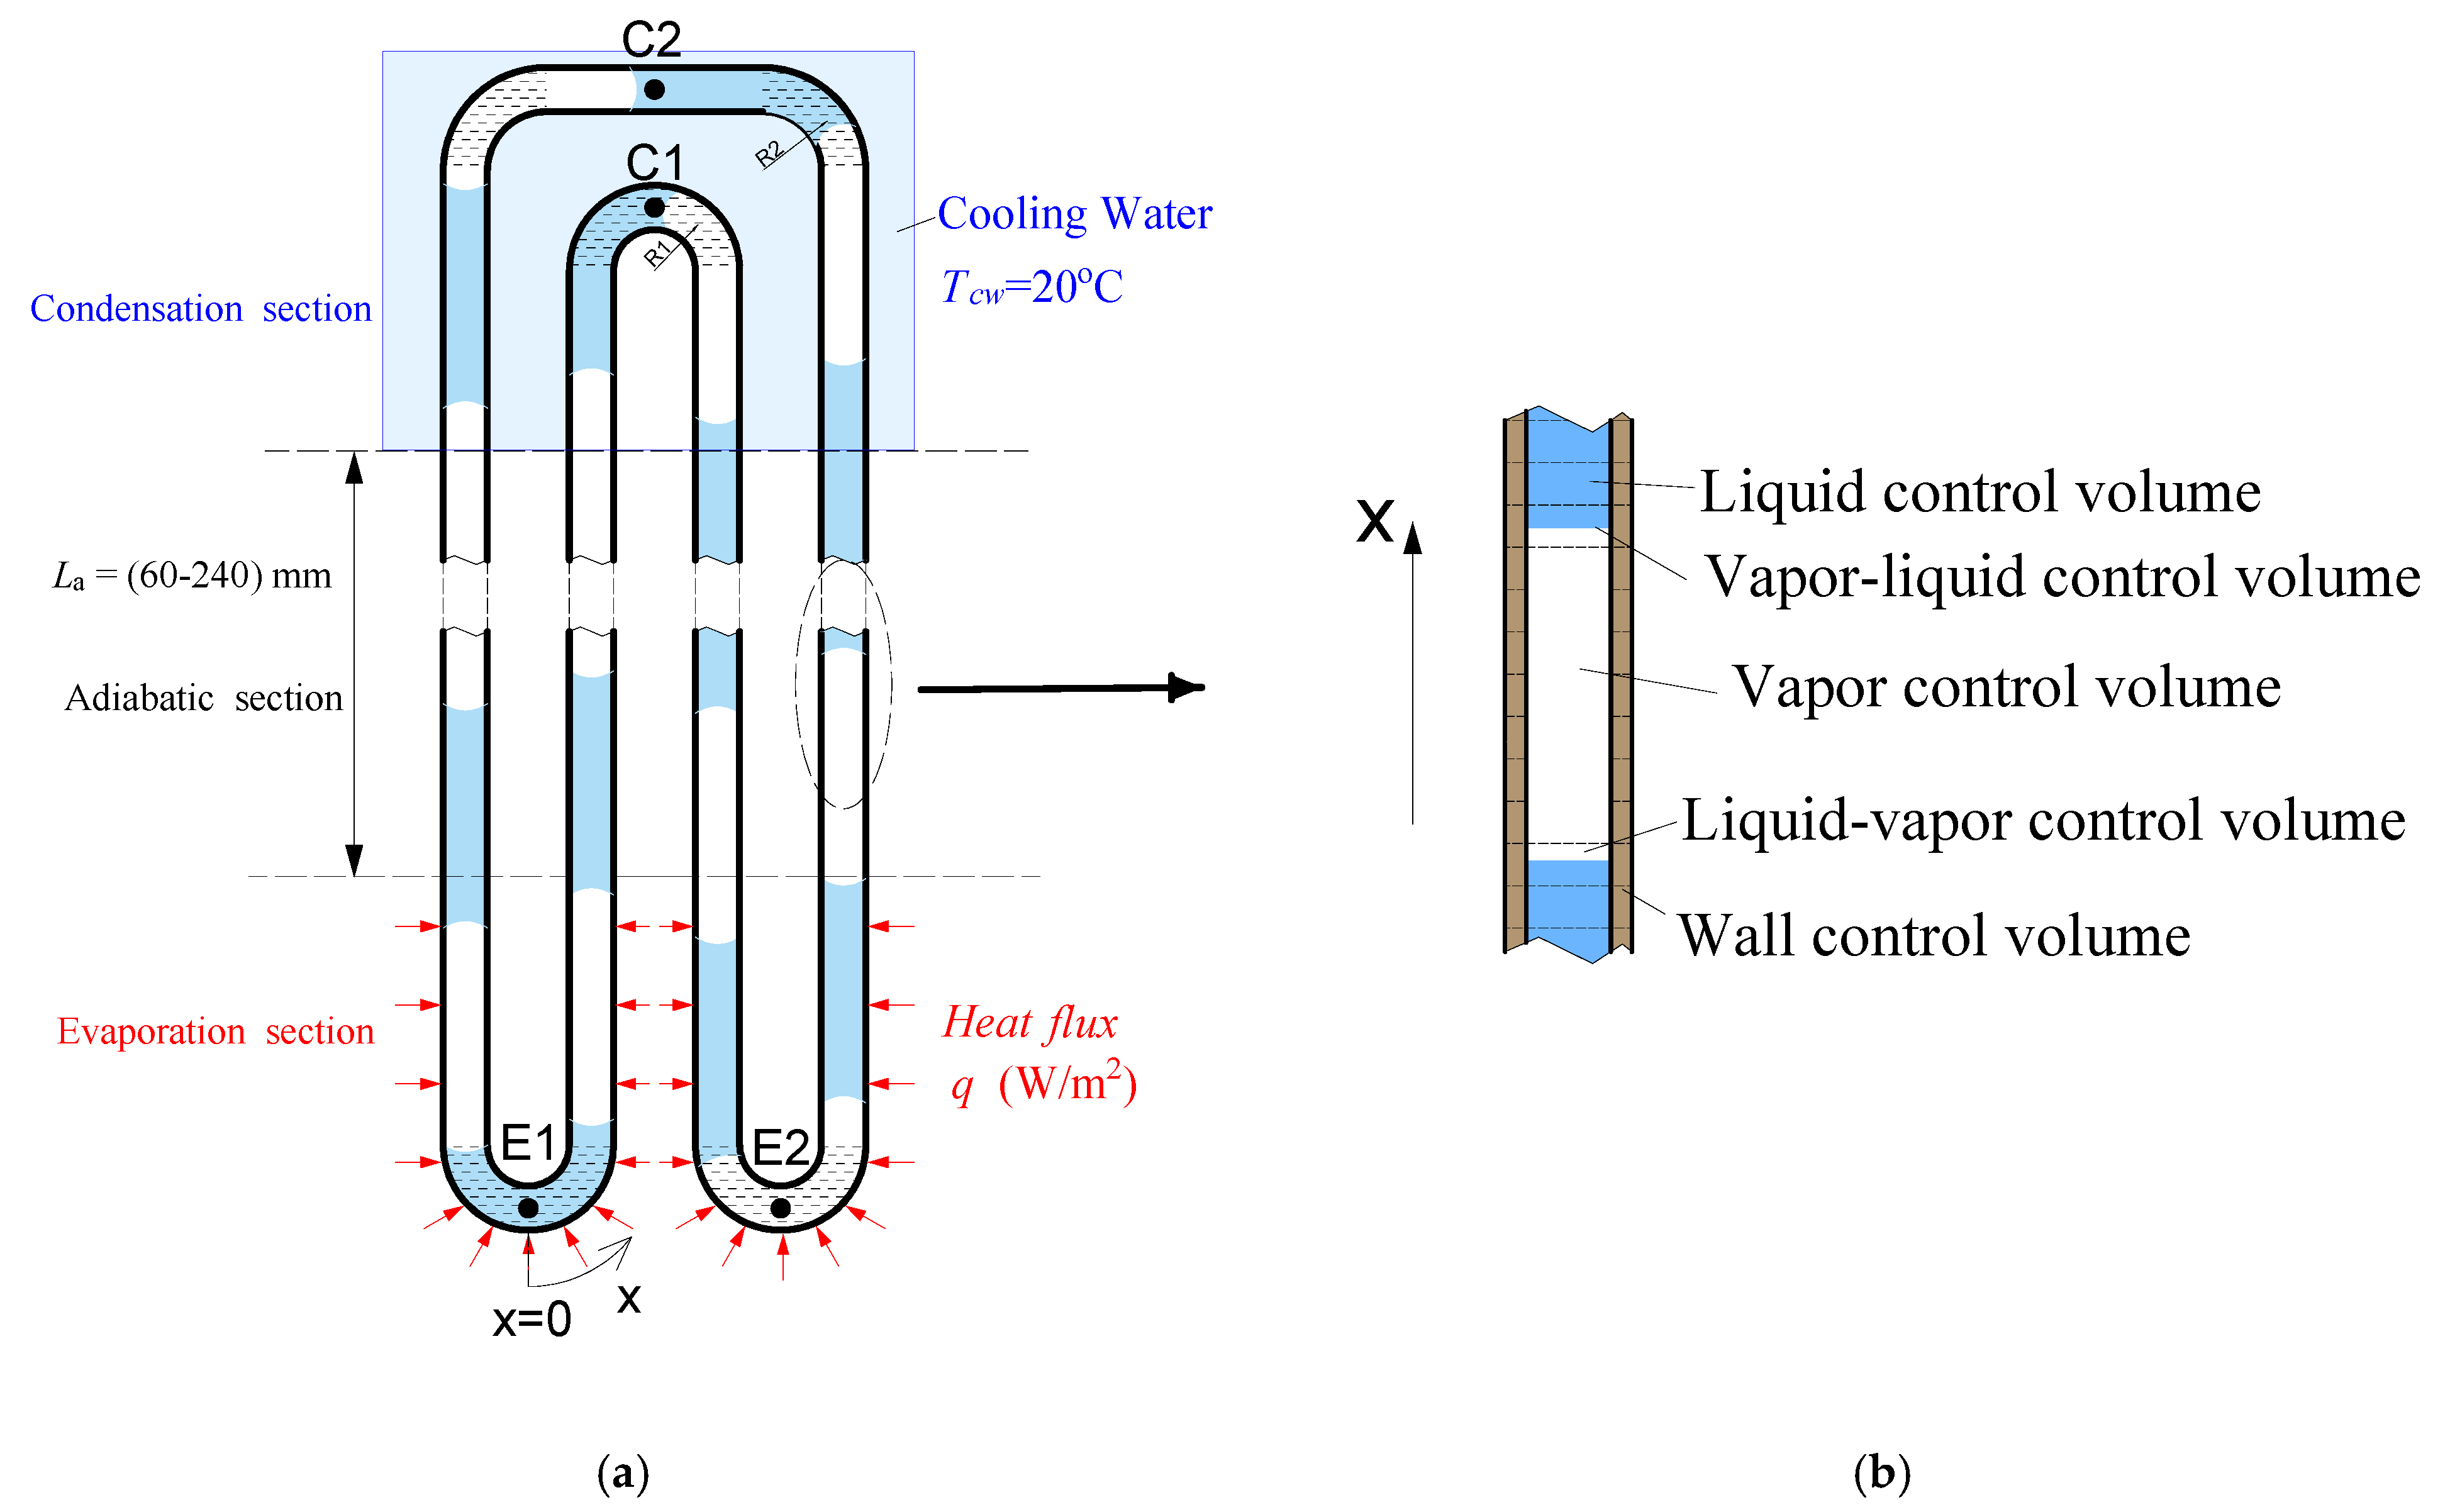
2.1. Model Description and Assumptions
The schematics of the physical model for the PHP and the control volumes are shown in Figure 2. The PHP was made of a copper tube with an inner diameter of 2 mm. As shown in Figure 2, the two-turn PHP was placed vertically and heated in the bottom. Table 2 presents the geometric parameters of the PHP in detail. In this work, water was used as the working fluid, and the filling ratio was 0.5.
Figure 2.
The schematics of (a) the physical model and (b) the control volumes.
Table 2.
The geometric parameters of the PHP.
The main assumptions of the numerical model in this work are as follows:
- (1)
- The flow pattern of the working fluid was assumed to be the slug flow.
- (2)
- Liquid was assumed to be incompressible, and vapor was treated as an ideal gas.
- (3)
- The pressure and the temperature were uniform inside a vapor plug.
- (4)
- The friction between vapor plugs and inner wall of the PHP was neglected
- (5)
- The vapor plug was enclosed by the liquid film, and the thickness of the liquid film was assumed to be a constant (100 μm).
2.2. Governing Equations
The control volumes in the PHP are divided into five types: the pipe wall control volume, the liquid-vapor control volume, the vapor control volume, the vapor-liquid control volume, and the liquid control volume, as shown in Figure 2b. The wall control volume and the liquid control volume represent the control volume of the tube wall or liquid with one grid size (length = 1 mm), respectively. The vapor control volume is the control volume of a vapor plug. The vapor-liquid control volume and the liquid-vapor control volume are the control volumes that contain the interface between the liquid phase and the vapor phase. The difference between the liquid-vapor control volume and the vapor-liquid control volume is the order of the liquid phase and the vapor phase on the axes, as shown in Figure 2b. The mass, momentum, and energy governing equations are established for the control volumes as follows.
2.2.1. Pipe Wall
The energy equation of the pipe wall control volume is as follows:
where qex represents the external heat flux of the PHP, which is calculated by:
where hc is the heat transfer coefficient between the cooling water and the tube wall in the condensation section. In addition, the heat transfer process between the pipe wall and the liquid slug includes the sensible heat transfer and the nucleate boiling heat transfer, whereas the heat transfer process between the pipe wall and the vapor plug includes the sensible heat transfer, the nucleate boiling heat transfer of the liquid film, and the condensation heat transfer. Thus, the heat transfer between the wall and the working fluid can be calculated by the following equation:
The heat transfer coefficients are discussed in detail in the following sections.
2.2.2. Vapor Control Volume
As mentioned above, a vapor plug is considered to be a control volume. The energy equations for the vapor plug are:
Introducing the Meyer formula () into Equation (5) results in:
hv represents the heat transfer coefficient between the pipe wall and the vapor plug, which can be calculated by [14]:
If the temperature difference between the wall and the liquid film temperature is higher than the required superheat for the nucleate boiling, the phase change occurs in the liquid film. The nucleate boiling heat transfer coefficient of the liquid film is calculated by the correlation provided by Gungor and Winterton [25,26], given by:
The evaporated mass in the vapor plug is calculated using Equation (10):
When the temperature between the saturation temperature of the vapor plug and the pipe wall is higher than the required subcooled temperature, condensation occurs in the vapor plug. The condensation coefficient is calculated by Equations (11)–(13):
where Nucond represents the Nusselt number for the condensation, which is calculated by [27,28]:
The condensed mass in the vapor plug is calculated by:
The vapor is assumed to be an ideal gas, therefore:
If the vapor pressure calculated by Equation (15) is higher than the saturation pressure for the vapor temperature, the phase change occurs in the PHP and the pressure is equal to the saturation pressure:
2.2.3. Liquid Control Volume
The energy equation of the liquid slug is as follows:
The heat transfer between the pipe wall and the liquid slug may include the convective heat transfer, the subcooled boiling, and the saturated nucleate boiling, and thus qwf in Equation (1) can be calculated as follows:
The convective heat transfer coefficient of the liquid slug (hl) is calculated by [27]:
When the temperature difference of the tube wall and the saturated temperature of the liquid slug is higher than the superheat required for the nucleate boiling, and the temperature of the liquid slug is lower than the saturation temperature, subcooled boiling can occur in the PHP. The superheat needed for the nucleate boiling is calculated by [23,24]:
In the subcooled boiling, bubbles are generated on the tube wall, but can easily collapse in the liquid slug, because the bulk temperature of the liquid is lower than the saturation temperature. Thus, under this circumstance, no new vapor plug will be formed. When the temperature of the liquid slug increases and reaches the saturation temperature, the saturated nucleate boiling can occur in the PHP, and new bubbles can be formed in the liquid slug. The nucleate boiling heat transfer coefficient can be calculated by [24]:
When the saturated nucleate boiling occurs, the mass change in a liquid slug is calculated as follows:
When , a new vapor generates in the liquid slug.
2.2.4. Control Volumes in the Interface between Liquid Slug and Vapor Plug
For the vapor-liquid control volume as shown in Figure 2, the mass conservation of the liquid phase in the vapor-liquid control volume is as follows:
where xl represents the liquid length in the vapor-liquid control volume. The mass change in the liquid phase of the vapor-liquid control volume includes the mass change caused by the phase change in the vapor plug (dmv) and the phase change in the liquid slug (dml). The energy equation of the vapor-liquid control volume is shown as follows:
Furthermore, the mass equation and the energy equation of the liquid-vapor control volume are similar to those of the vapor-liquid control volume, although some signs must be changed.
2.3. Momentum Conservation
The momentum equation of the liquid slug is as follows:
where Fp, Ff, Fσ, and Fg represent the driving force, the frictional resistance, the capillary resistance, and the gravity of the liquid slug, respectively. The driving force of the liquid slug is calculated based on the pressure difference between the two adjacent vapor plugs:
The frictional resistance of the liquid slug is calculated by:
where fτ is the friction factor. For the straight section in the PHP, the friction factor is:
The turns of the PHP will cause the additional pressure loss of the working fluid, and the friction factor in the turns can be calculated by:
where the loss coefficient (K) of the turn is calculated as follows:
The capillary resistance of the working fluid cab be calculated by:
The advancing contact angle of the working fluid is related to the static contact angle and the capillary number (Ca):
where . According to Qu et al. [19], the receding contact angle can be calculated by:
where f is set to 0.74 according to the visual experiment by Khandekar [29], and the static contact angle θe is 52° [30]. The gravity force on the liquid slug is calculated by:
where β represents the angle between the gravity direction and the flow direction.
2.4. Merging and Coalescence
2.4.1. Merging of Liquid Slugs
When the length of the vapor plug is lower than dx, the vapor plug collapses and the two liquid slugs merge. The velocity of the new liquid slug is calculated according to the following mass equation and the momentum equation:
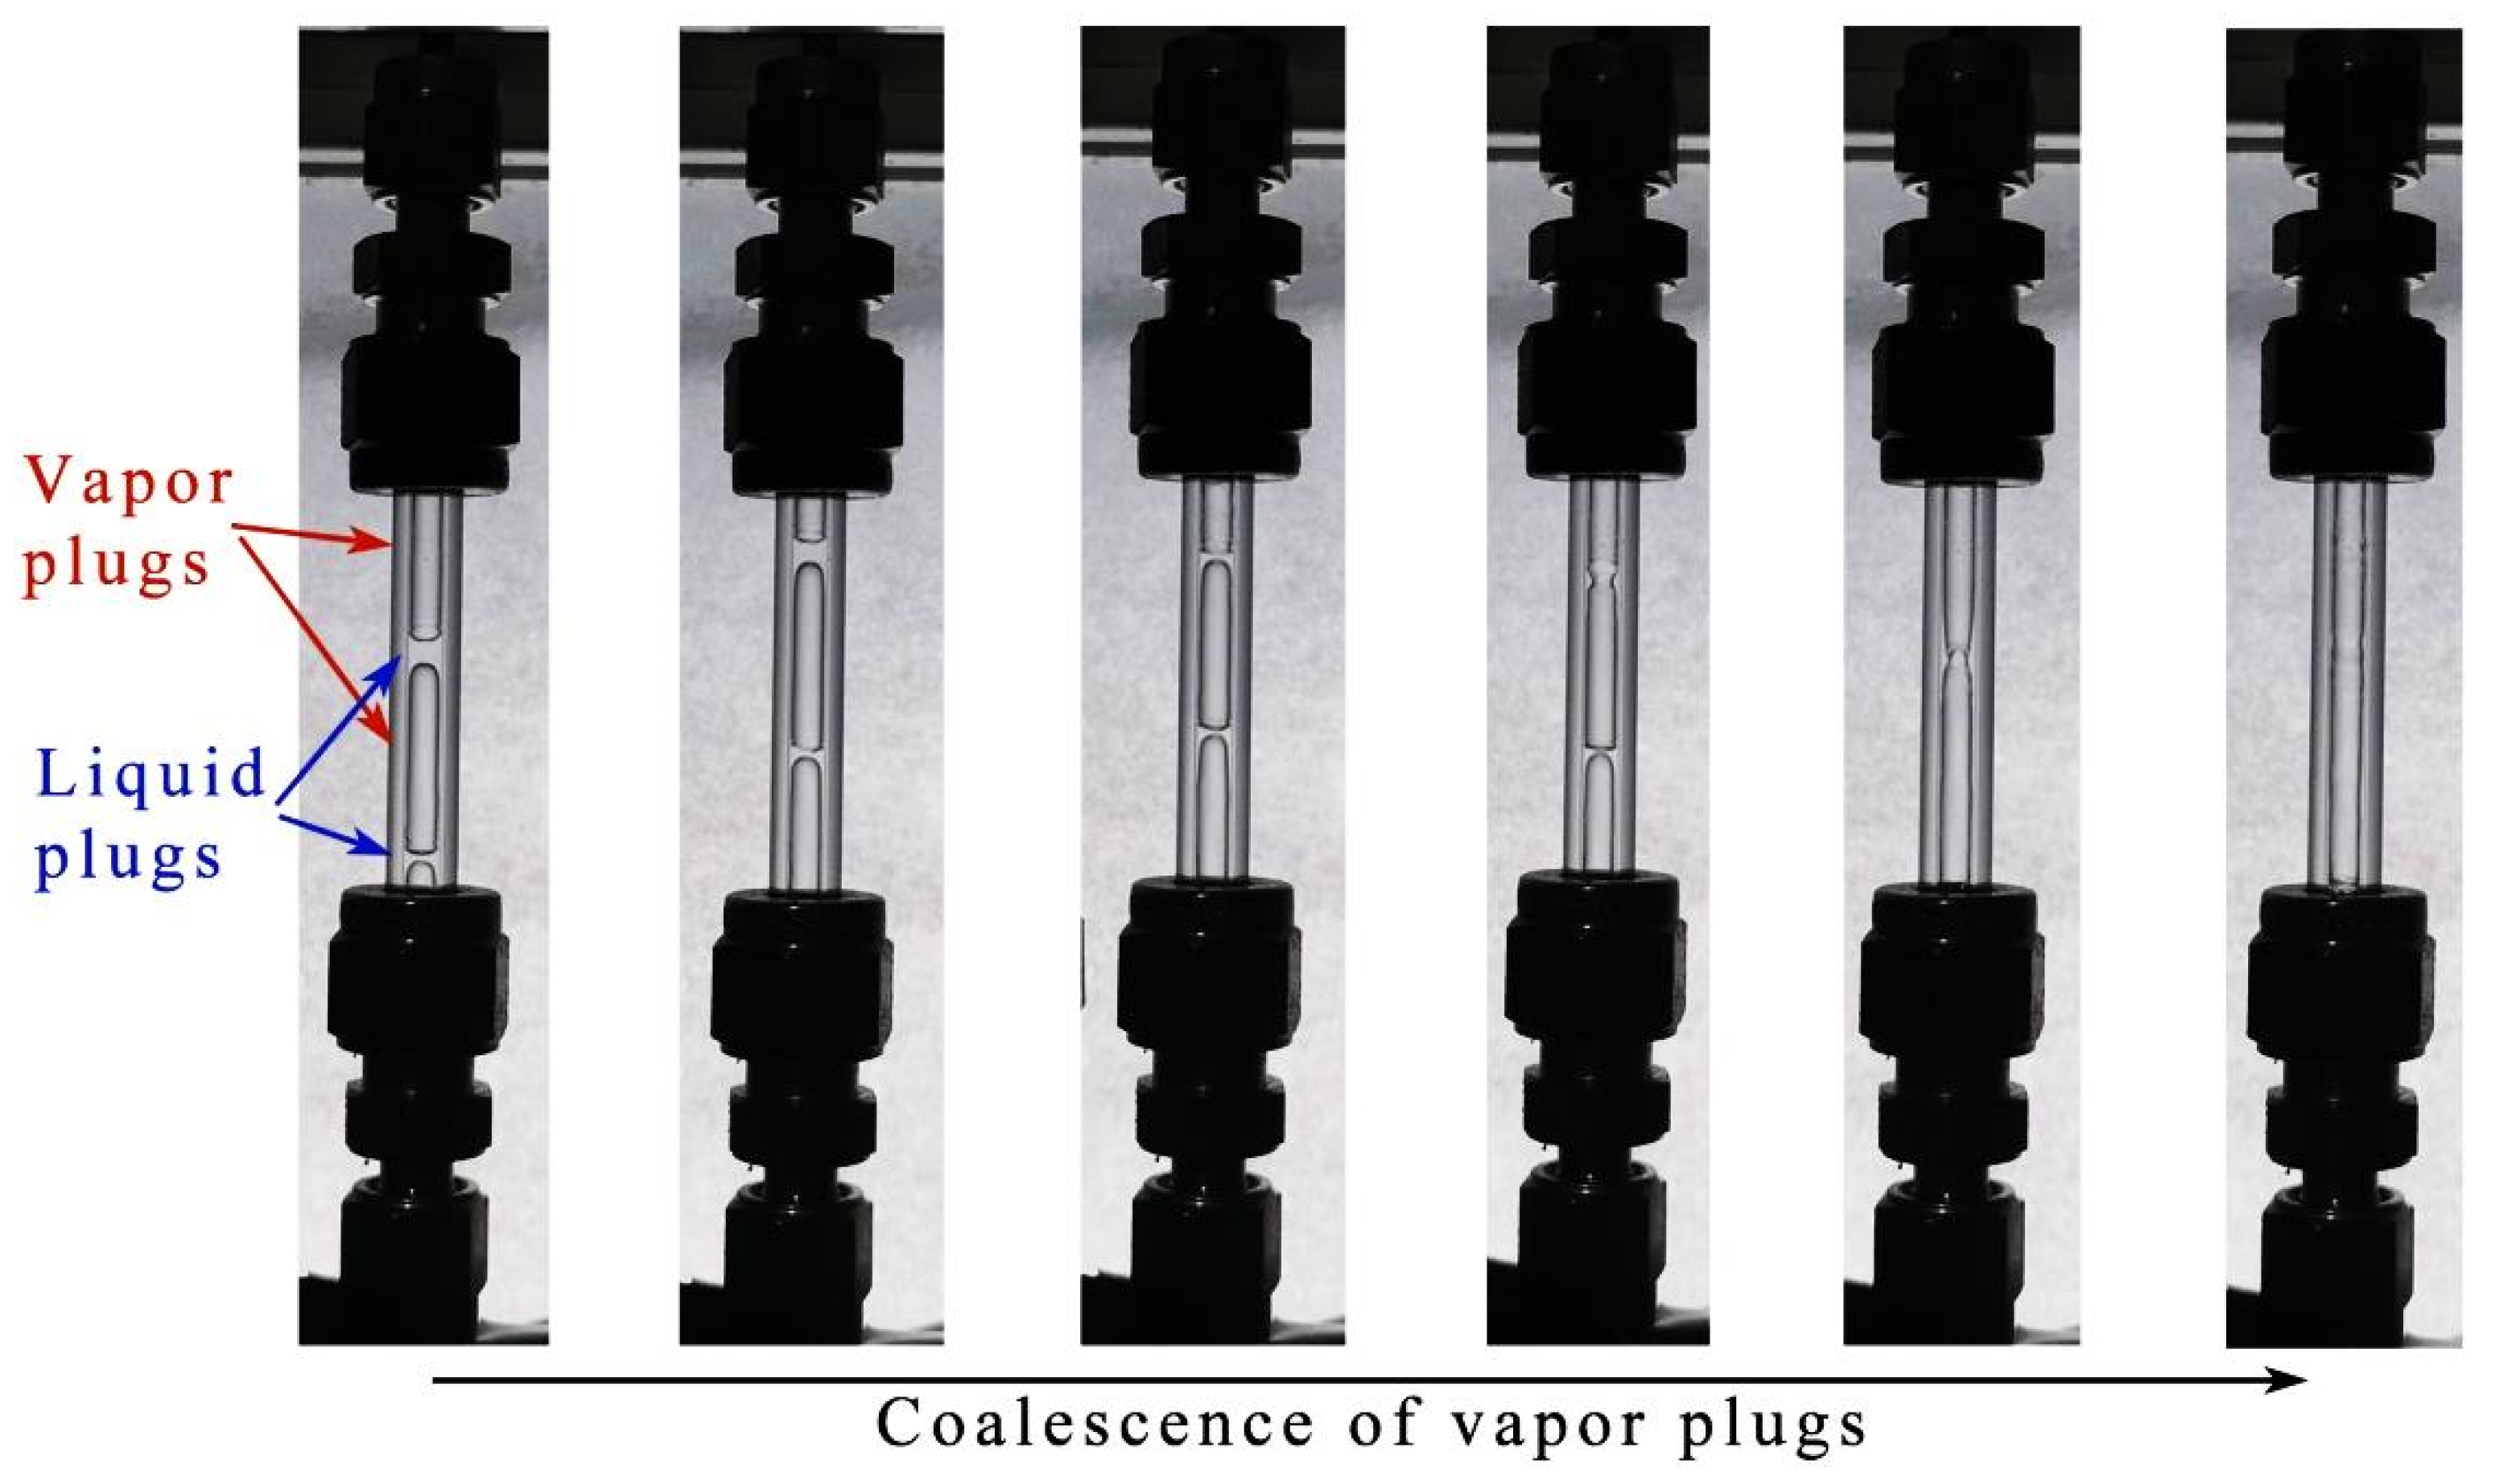
2.4.2. Coalescence of Vapor Plugs
When the length of the liquid slug is lower than dx, two adjacent vapor plugs connect and a long vapor plug is formed. The mass, volume, temperature, and the pressure of the new vapor plug can be calculated according to the equations:
2.5. New Vapor Plug Generation
When and , a new vapor generates in the liquid slug. The mass, temperature, pressure, and volume of the new vapor plug can be calculated by:
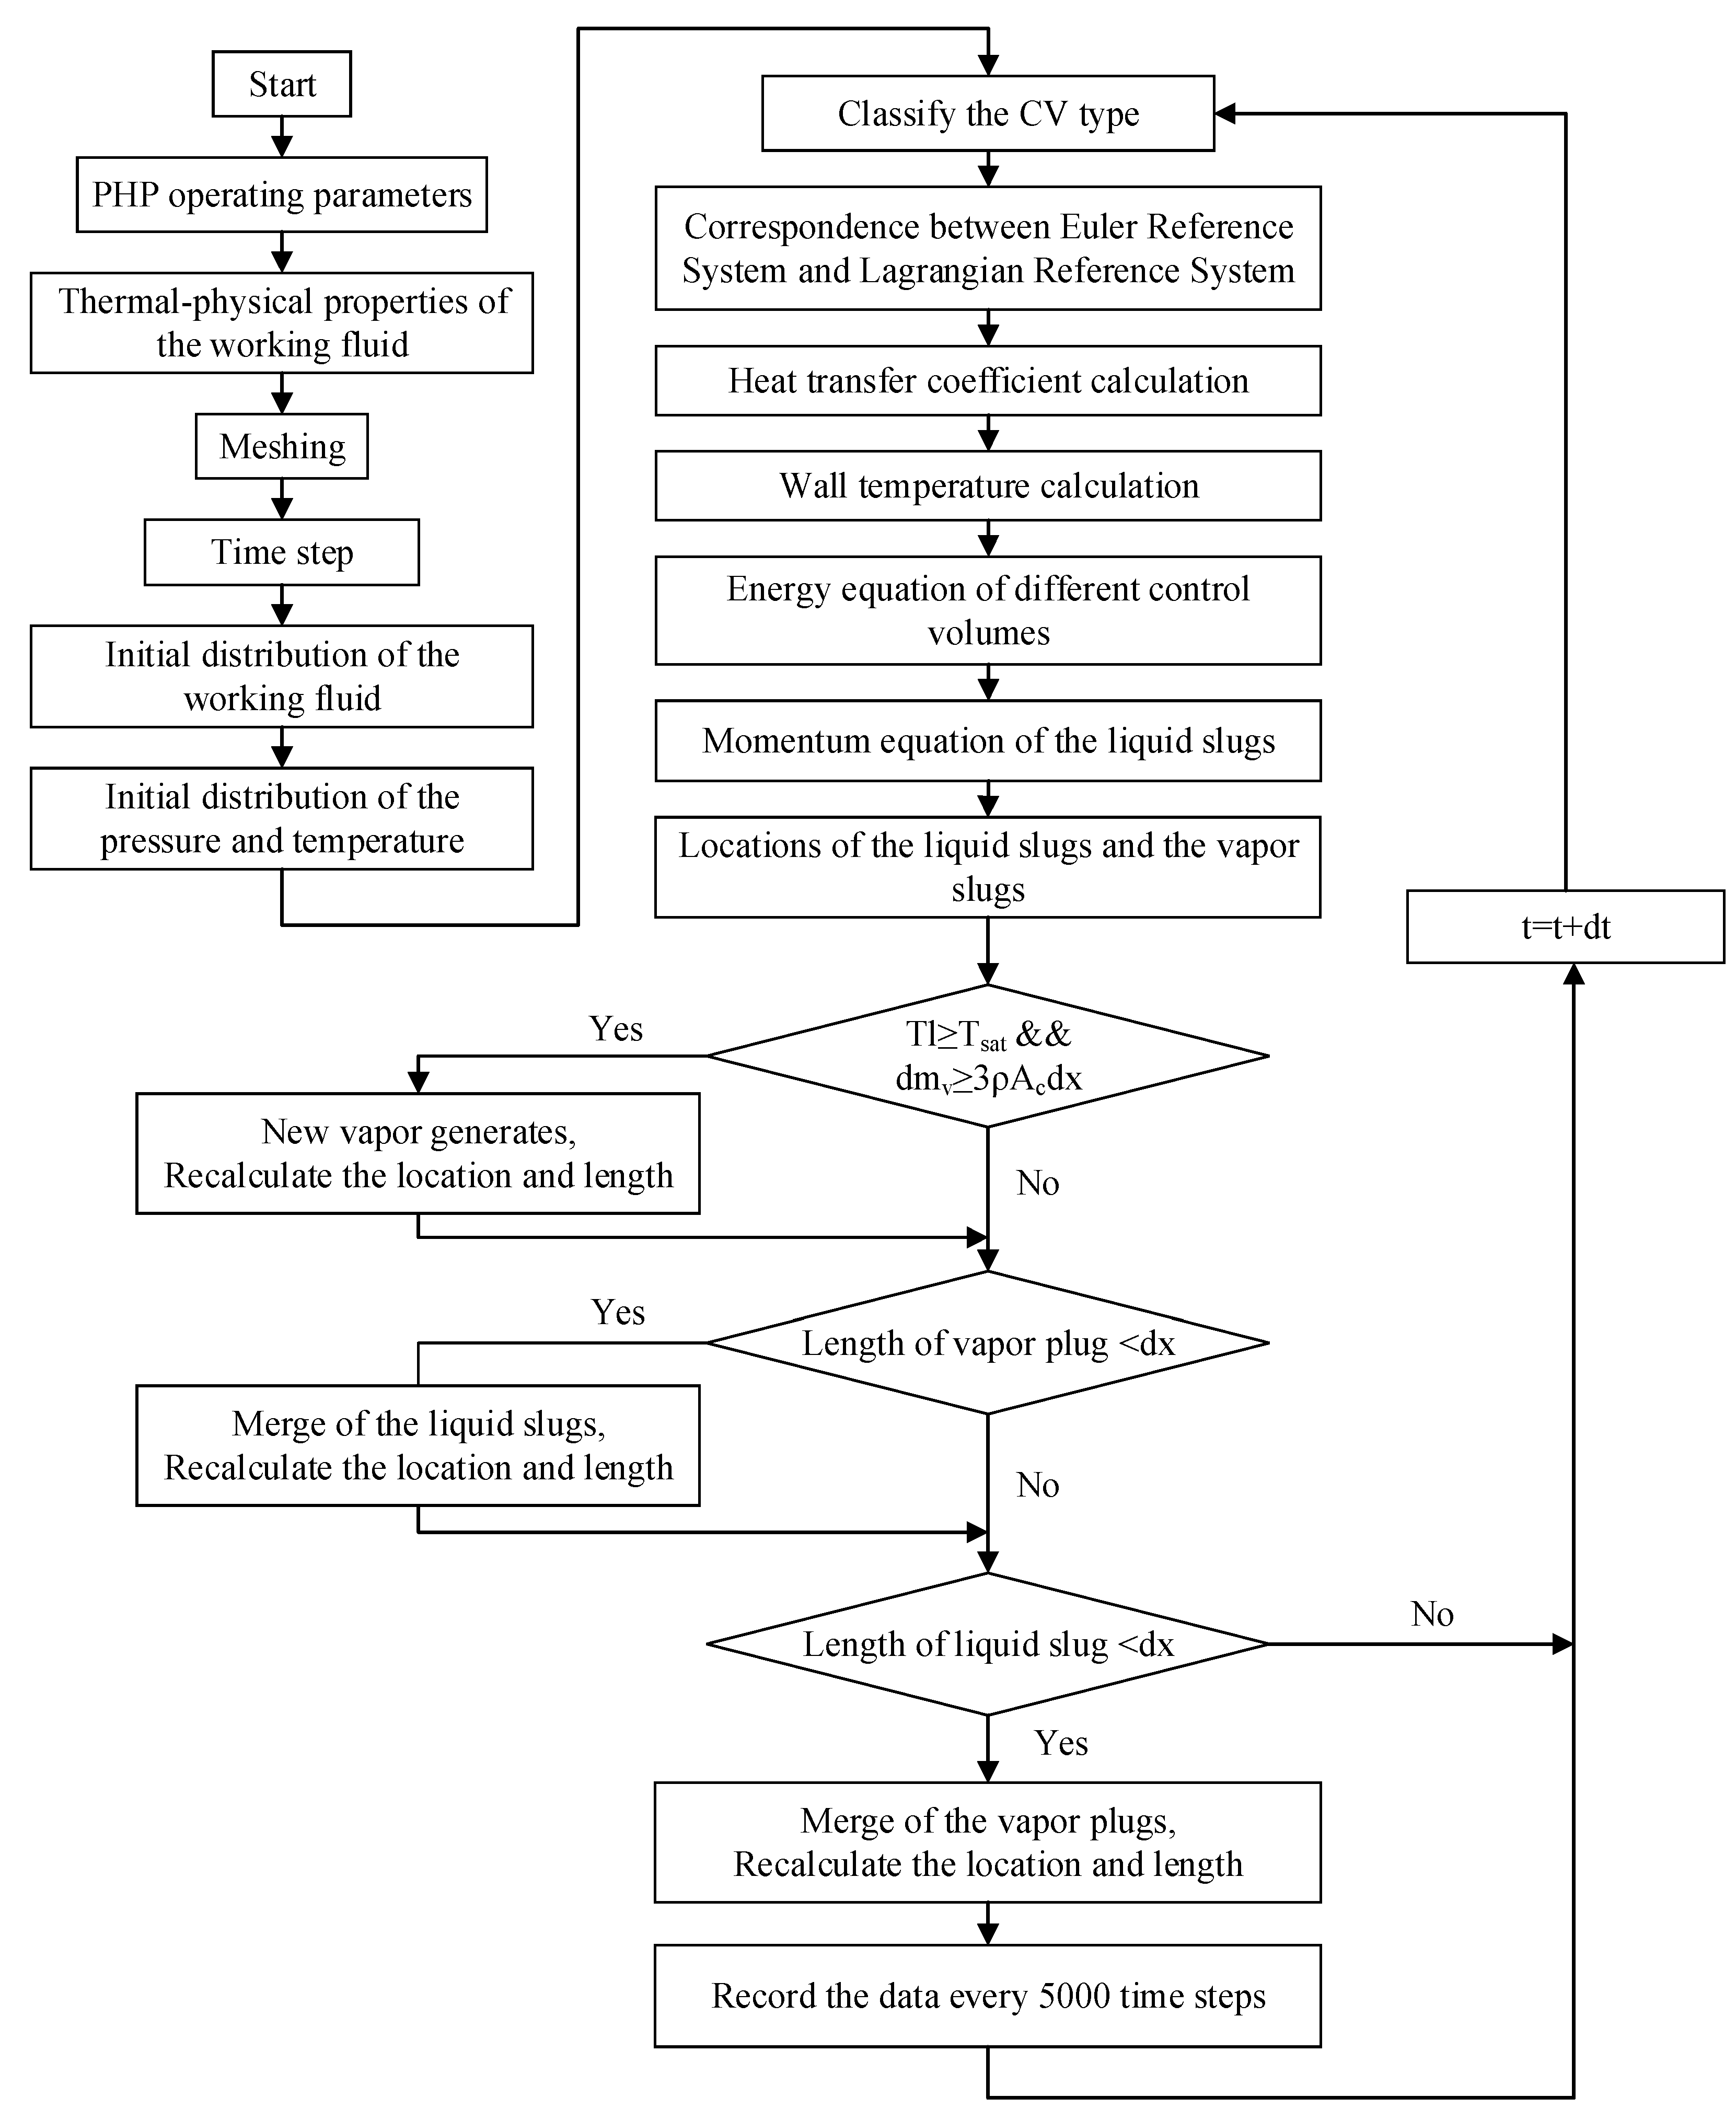
2.6. Numerical Procedure
The governing equations on the control volumes are discretized by the finite volume method. The grid size of each control volume is 1 mm. The total calculation time length is 100 s, and the time step is set at 1 × 10⁻⁵ s. Figure 3 shows the flowchart of the numerical calculation procedure in detail. The parameters of the numerical model are listed in Table 3.
Figure 3.
Numerical calculation procedure.
Table 3.
The input parameters of the numerical models.
3. Result and Discussion
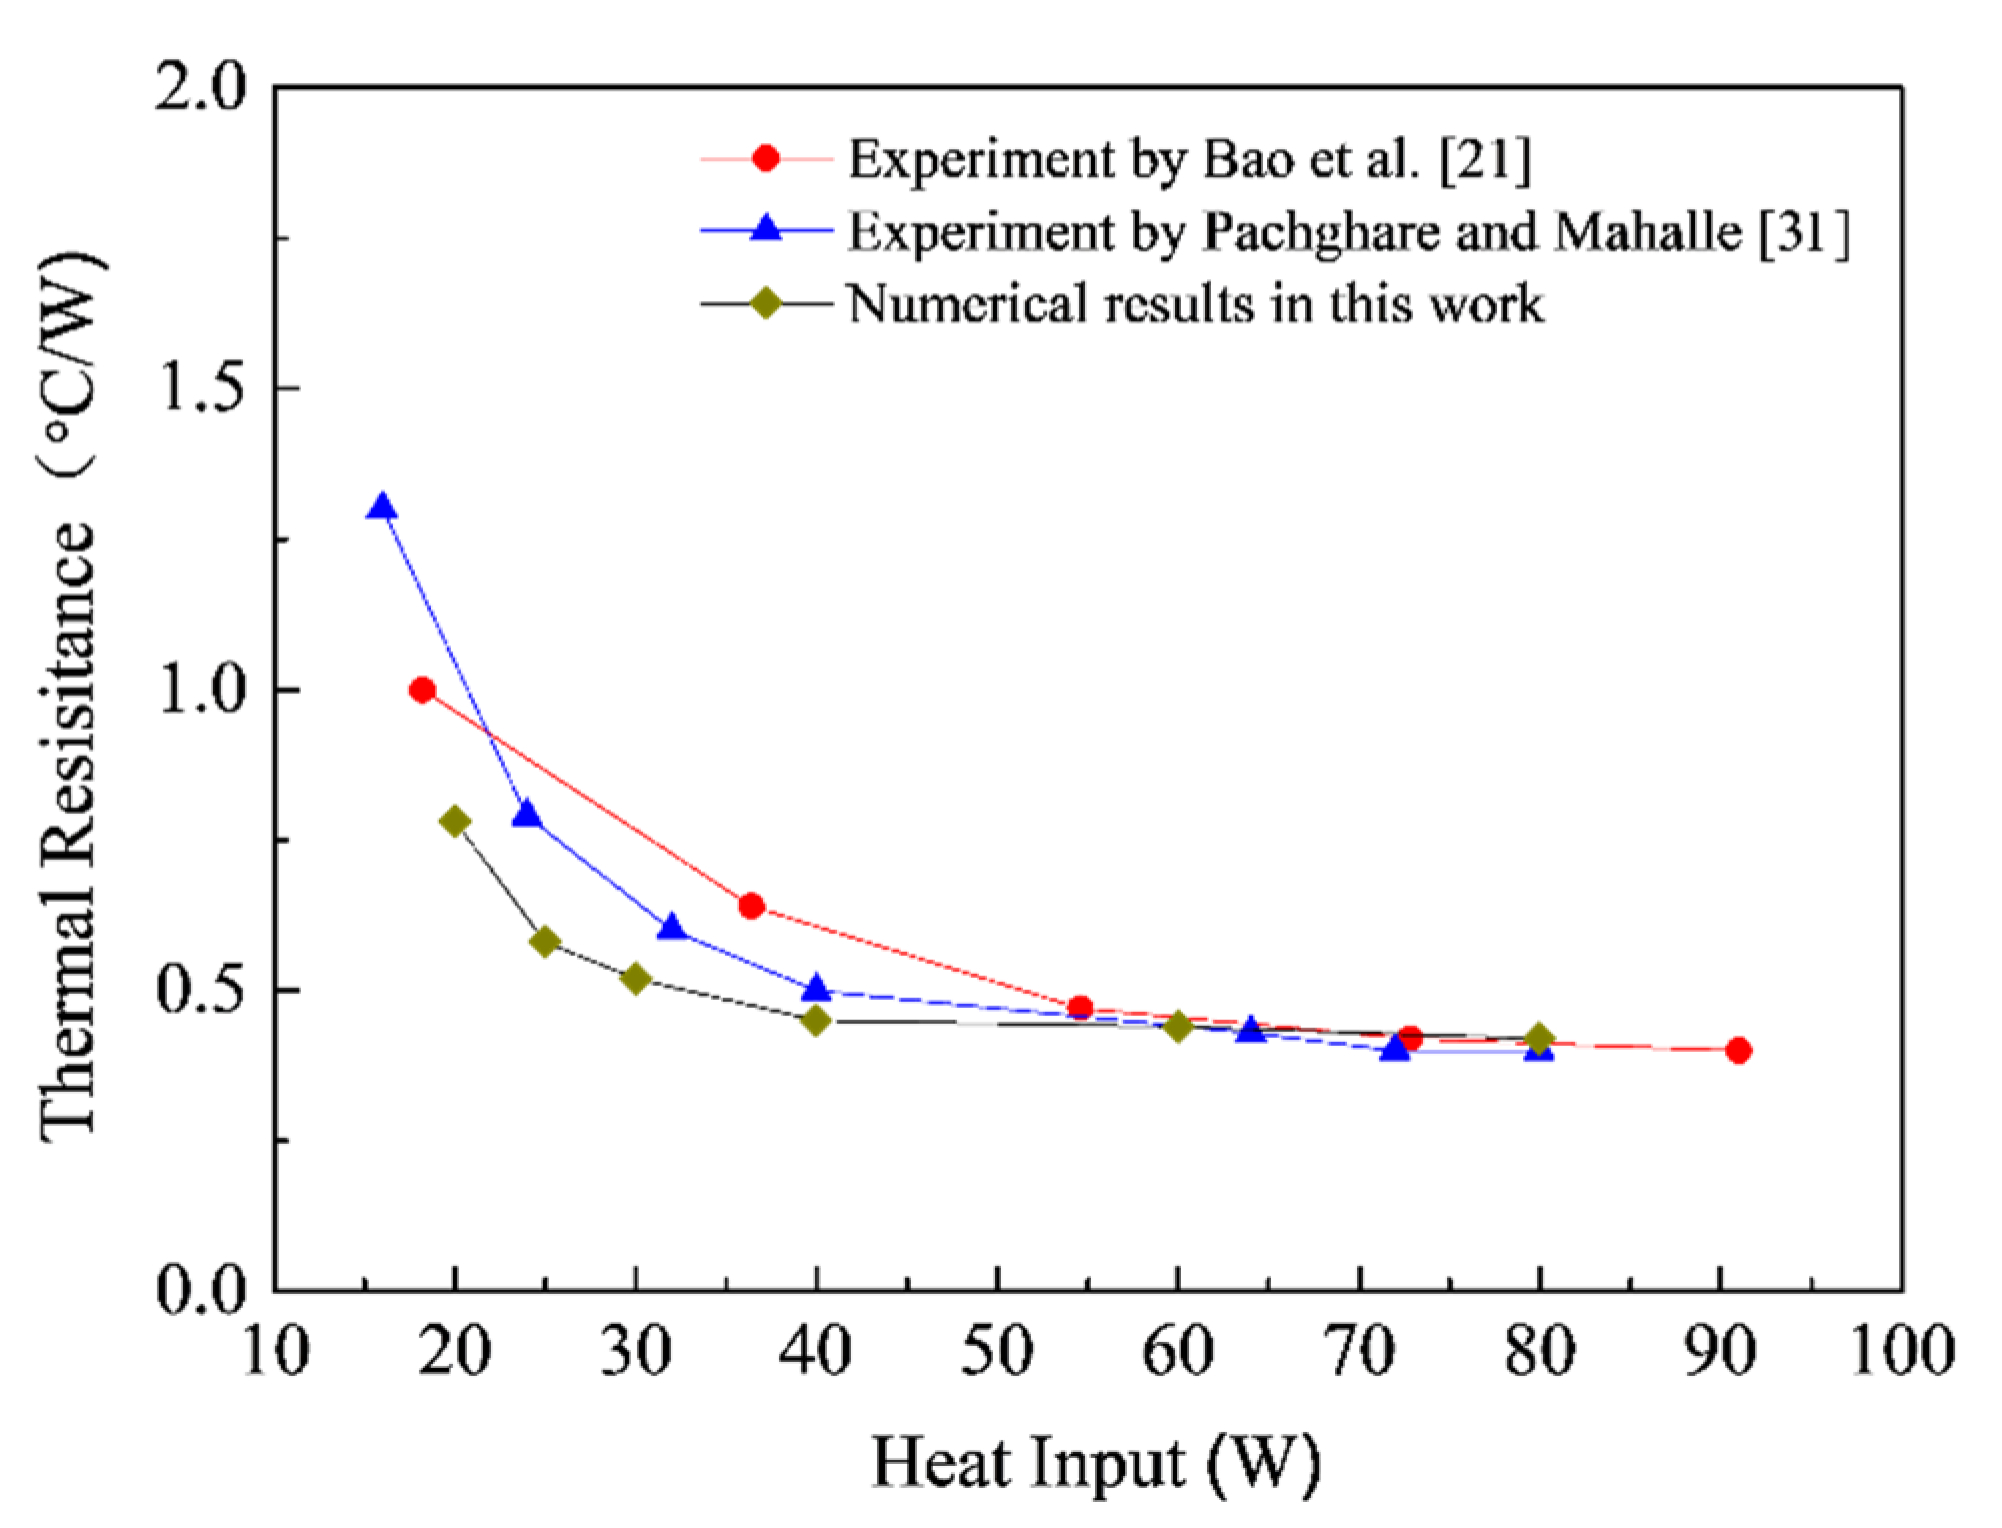
3.1. Comparison of the Numerical Results with the Experimental Results
The numerical calculations using the new transient model were undertaken for PHPs with different adiabatic section lengths. The numerical results showed that the mean flow velocities of the liquid slugs were in the range of 0.139–0.428 m/s at the heat input of 20–80 W. According to the visual experiment by Xue et al. [20], for the slug flow in the PHP, the magnitude of fluid velocity was about 0.1–0.6 m/s. Thus, the calculated flow velocities of the liquid slugs were consistent with the experimental results [20]. Moreover, the thermal resistance reduced from about 0.78 to 0.39 °C/W as the heat input increased from 20 to 80 W, and the start-up time obviously reduced with the increase in the heat input, which was in good agreement with the experimental results [1,18] (the previous experimental results [1,18] proved that the thermal resistance of the PHP decreased, and the start-up performance was improved with the increase in the heat input). In addition, Figure 4 shows the further comparison between the thermal resistances from the numerical simulation and the experimental results by Bao et al. [21] and Pachghare et al. [31]. Figure 4 shows that the numerical results had good agreement with the experimental results, and with the increase in the heat input, the deviations between the numerical results and experimental results were smaller. For example, at 80 W heat input, the relative error between the numerical result and the experimental result was lower than 5%, and the relative error between the numerical result and the experimental result at the low heat input was slightly larger. The main reason for the larger deviation at low heat input was that the heat loss and the thermal contact resistance, which were inevitable in experiments, had a significant influence on the start-up performance. It was well known that the start-up is more difficult at lower heat input because the liquid slug’s driving force generated by the temperature difference between the vapor plugs is small. With the increase in the heat input, the driving force is large enough to drive the oscillation motion of the liquid and vapor plugs in the PHP, and thus the influence of the start-up performance on the thermal resistance is reduced at high heat input. The compared of the above results suggests that the new proposed transient model reliably simulated the PHP’s operations with different adiabatic lengths.
Figure 4.
Comparison of the numerical results and the previous experimental results [21,31].
3.2. The Operation Characteristics of the PHP
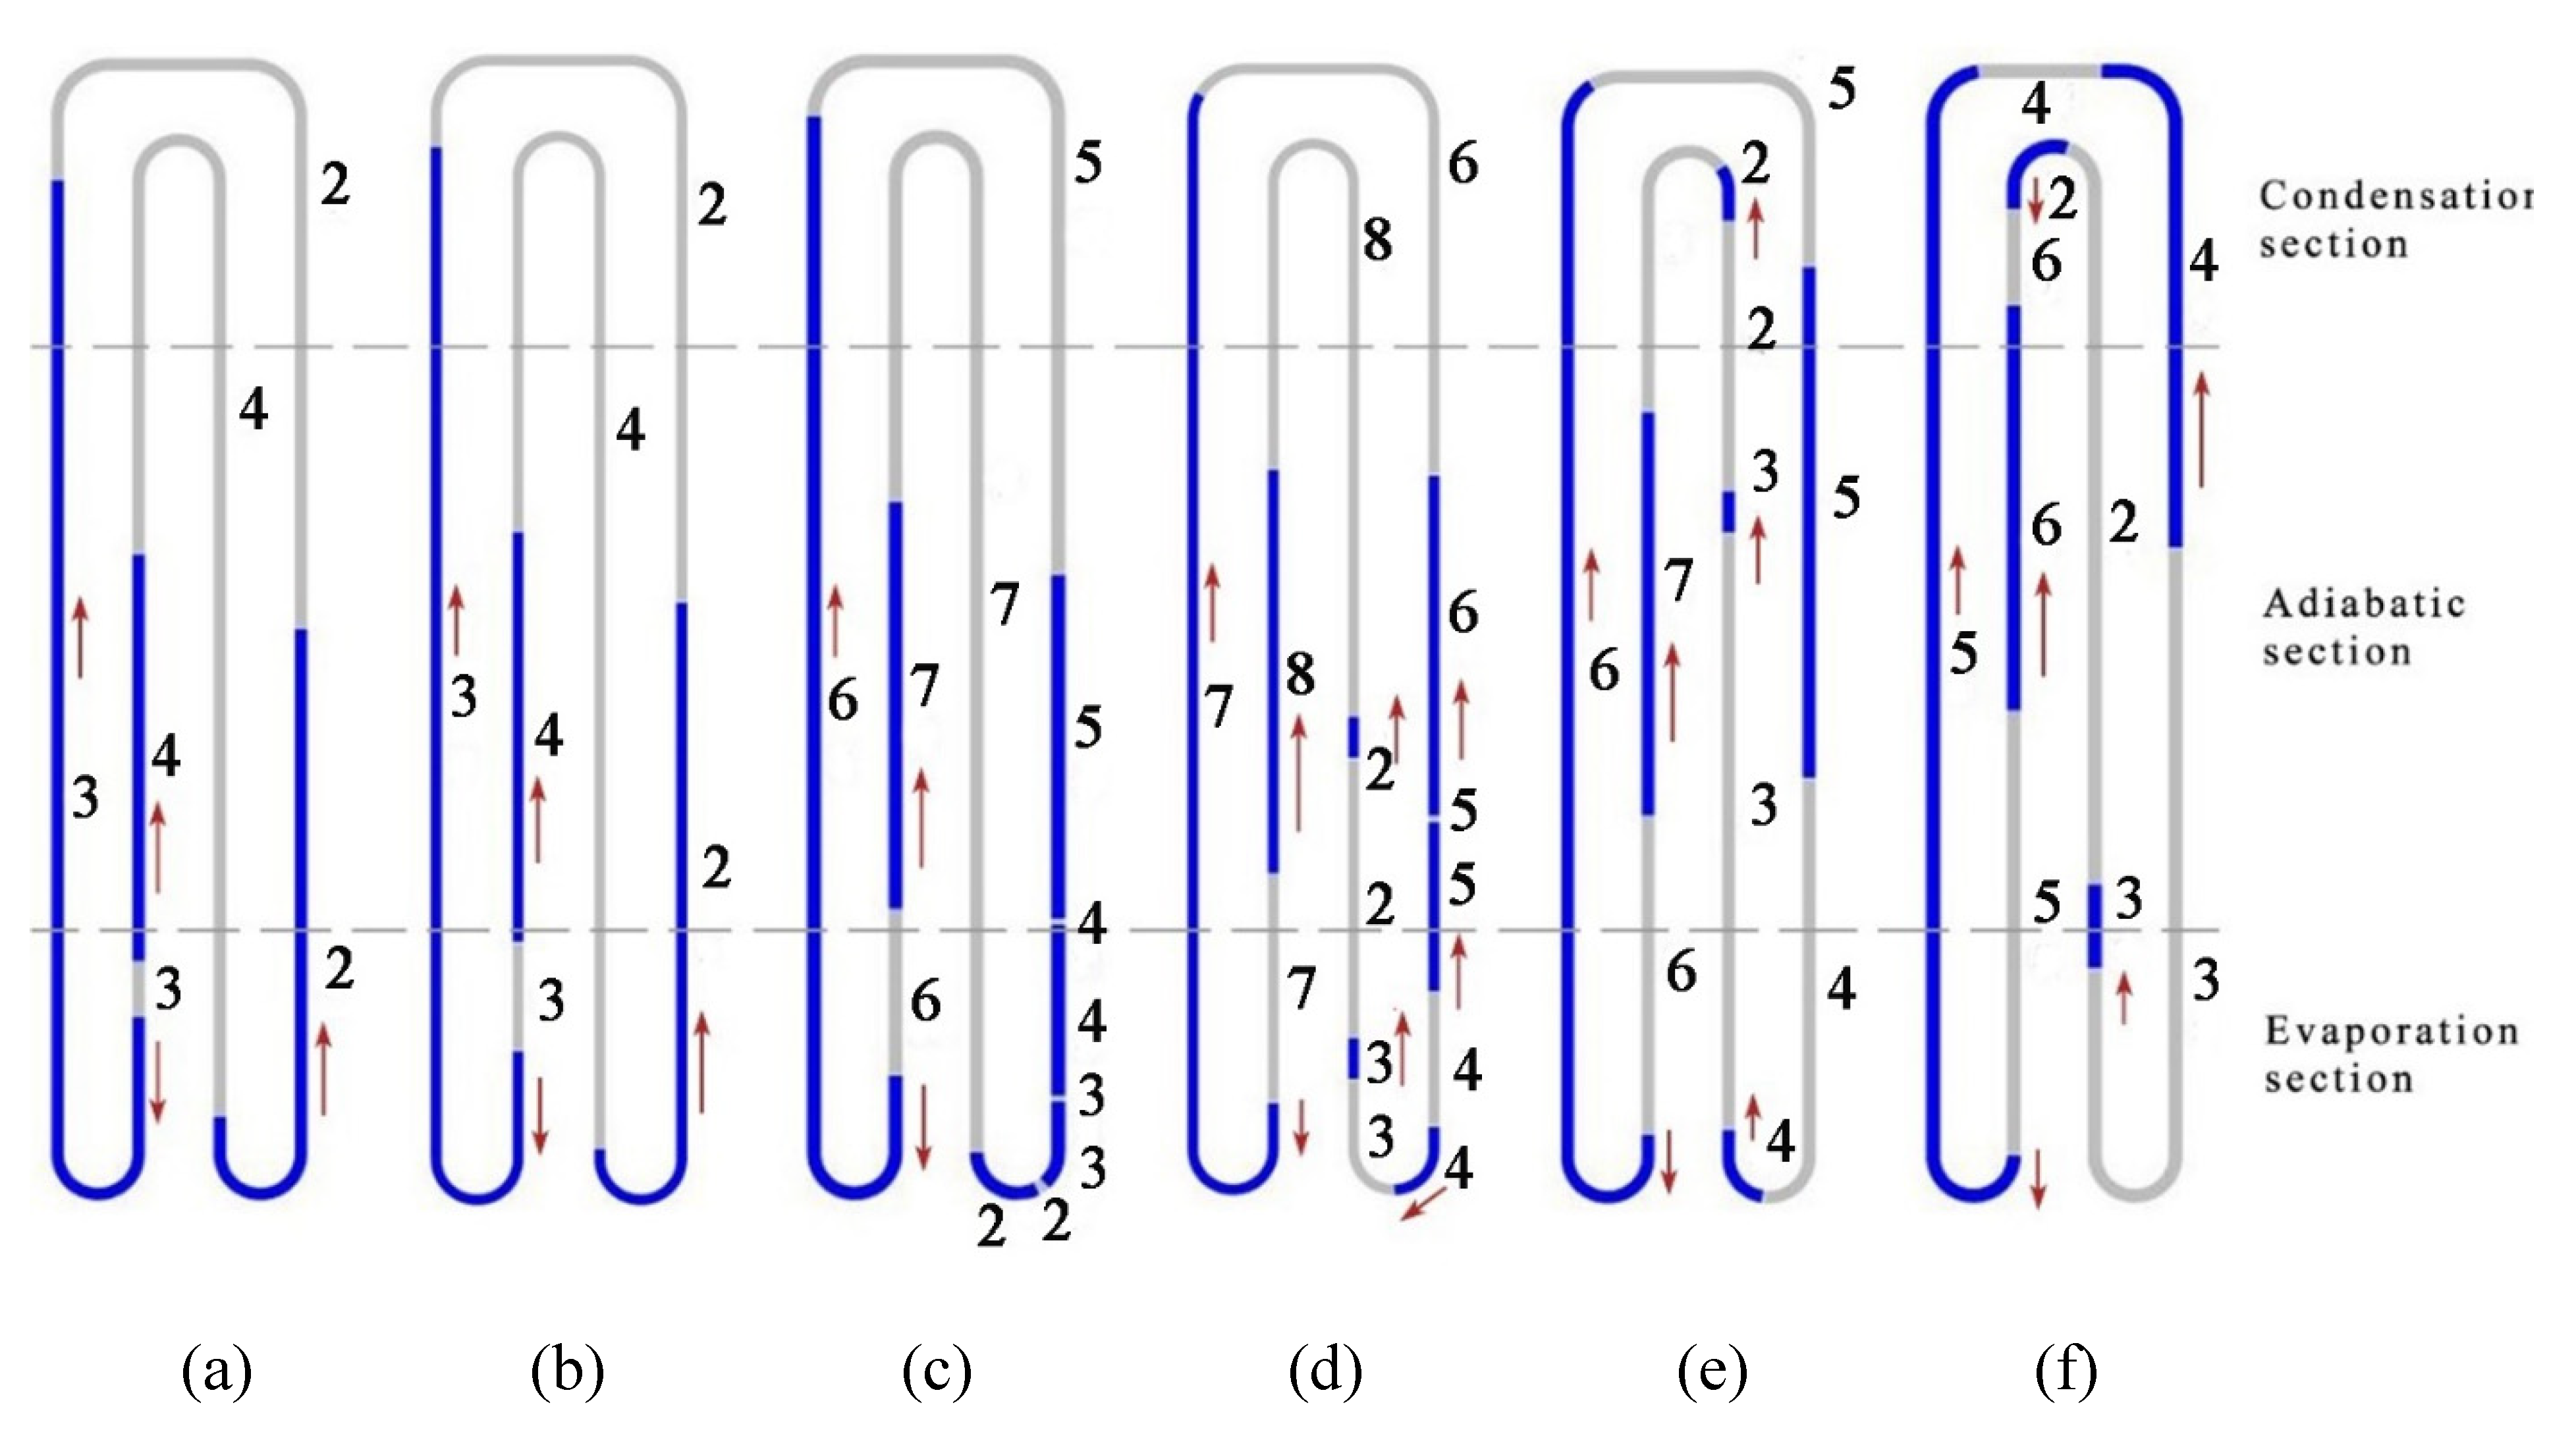
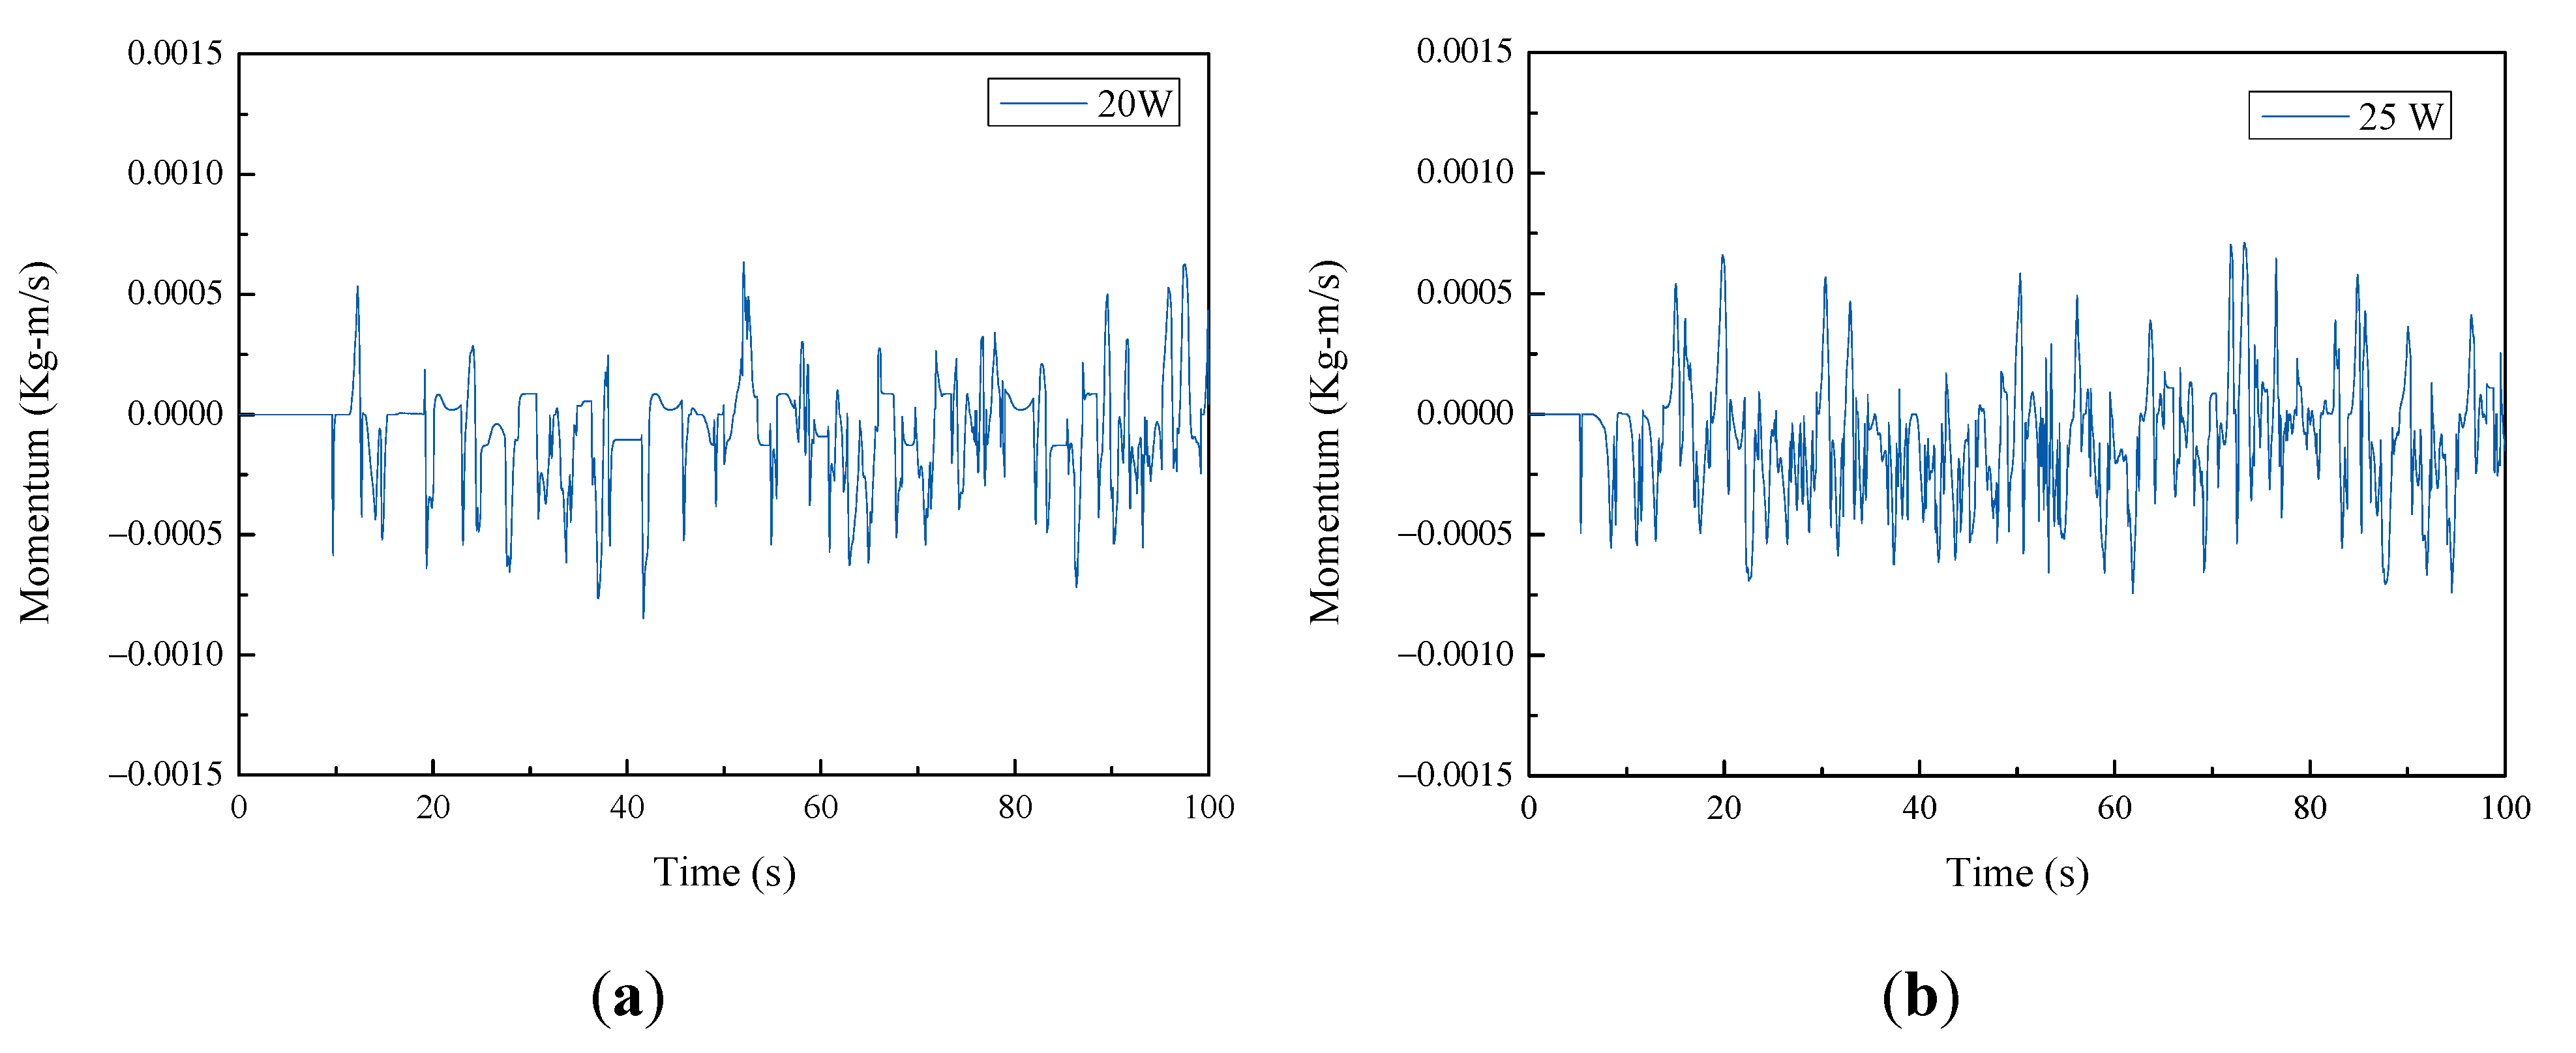
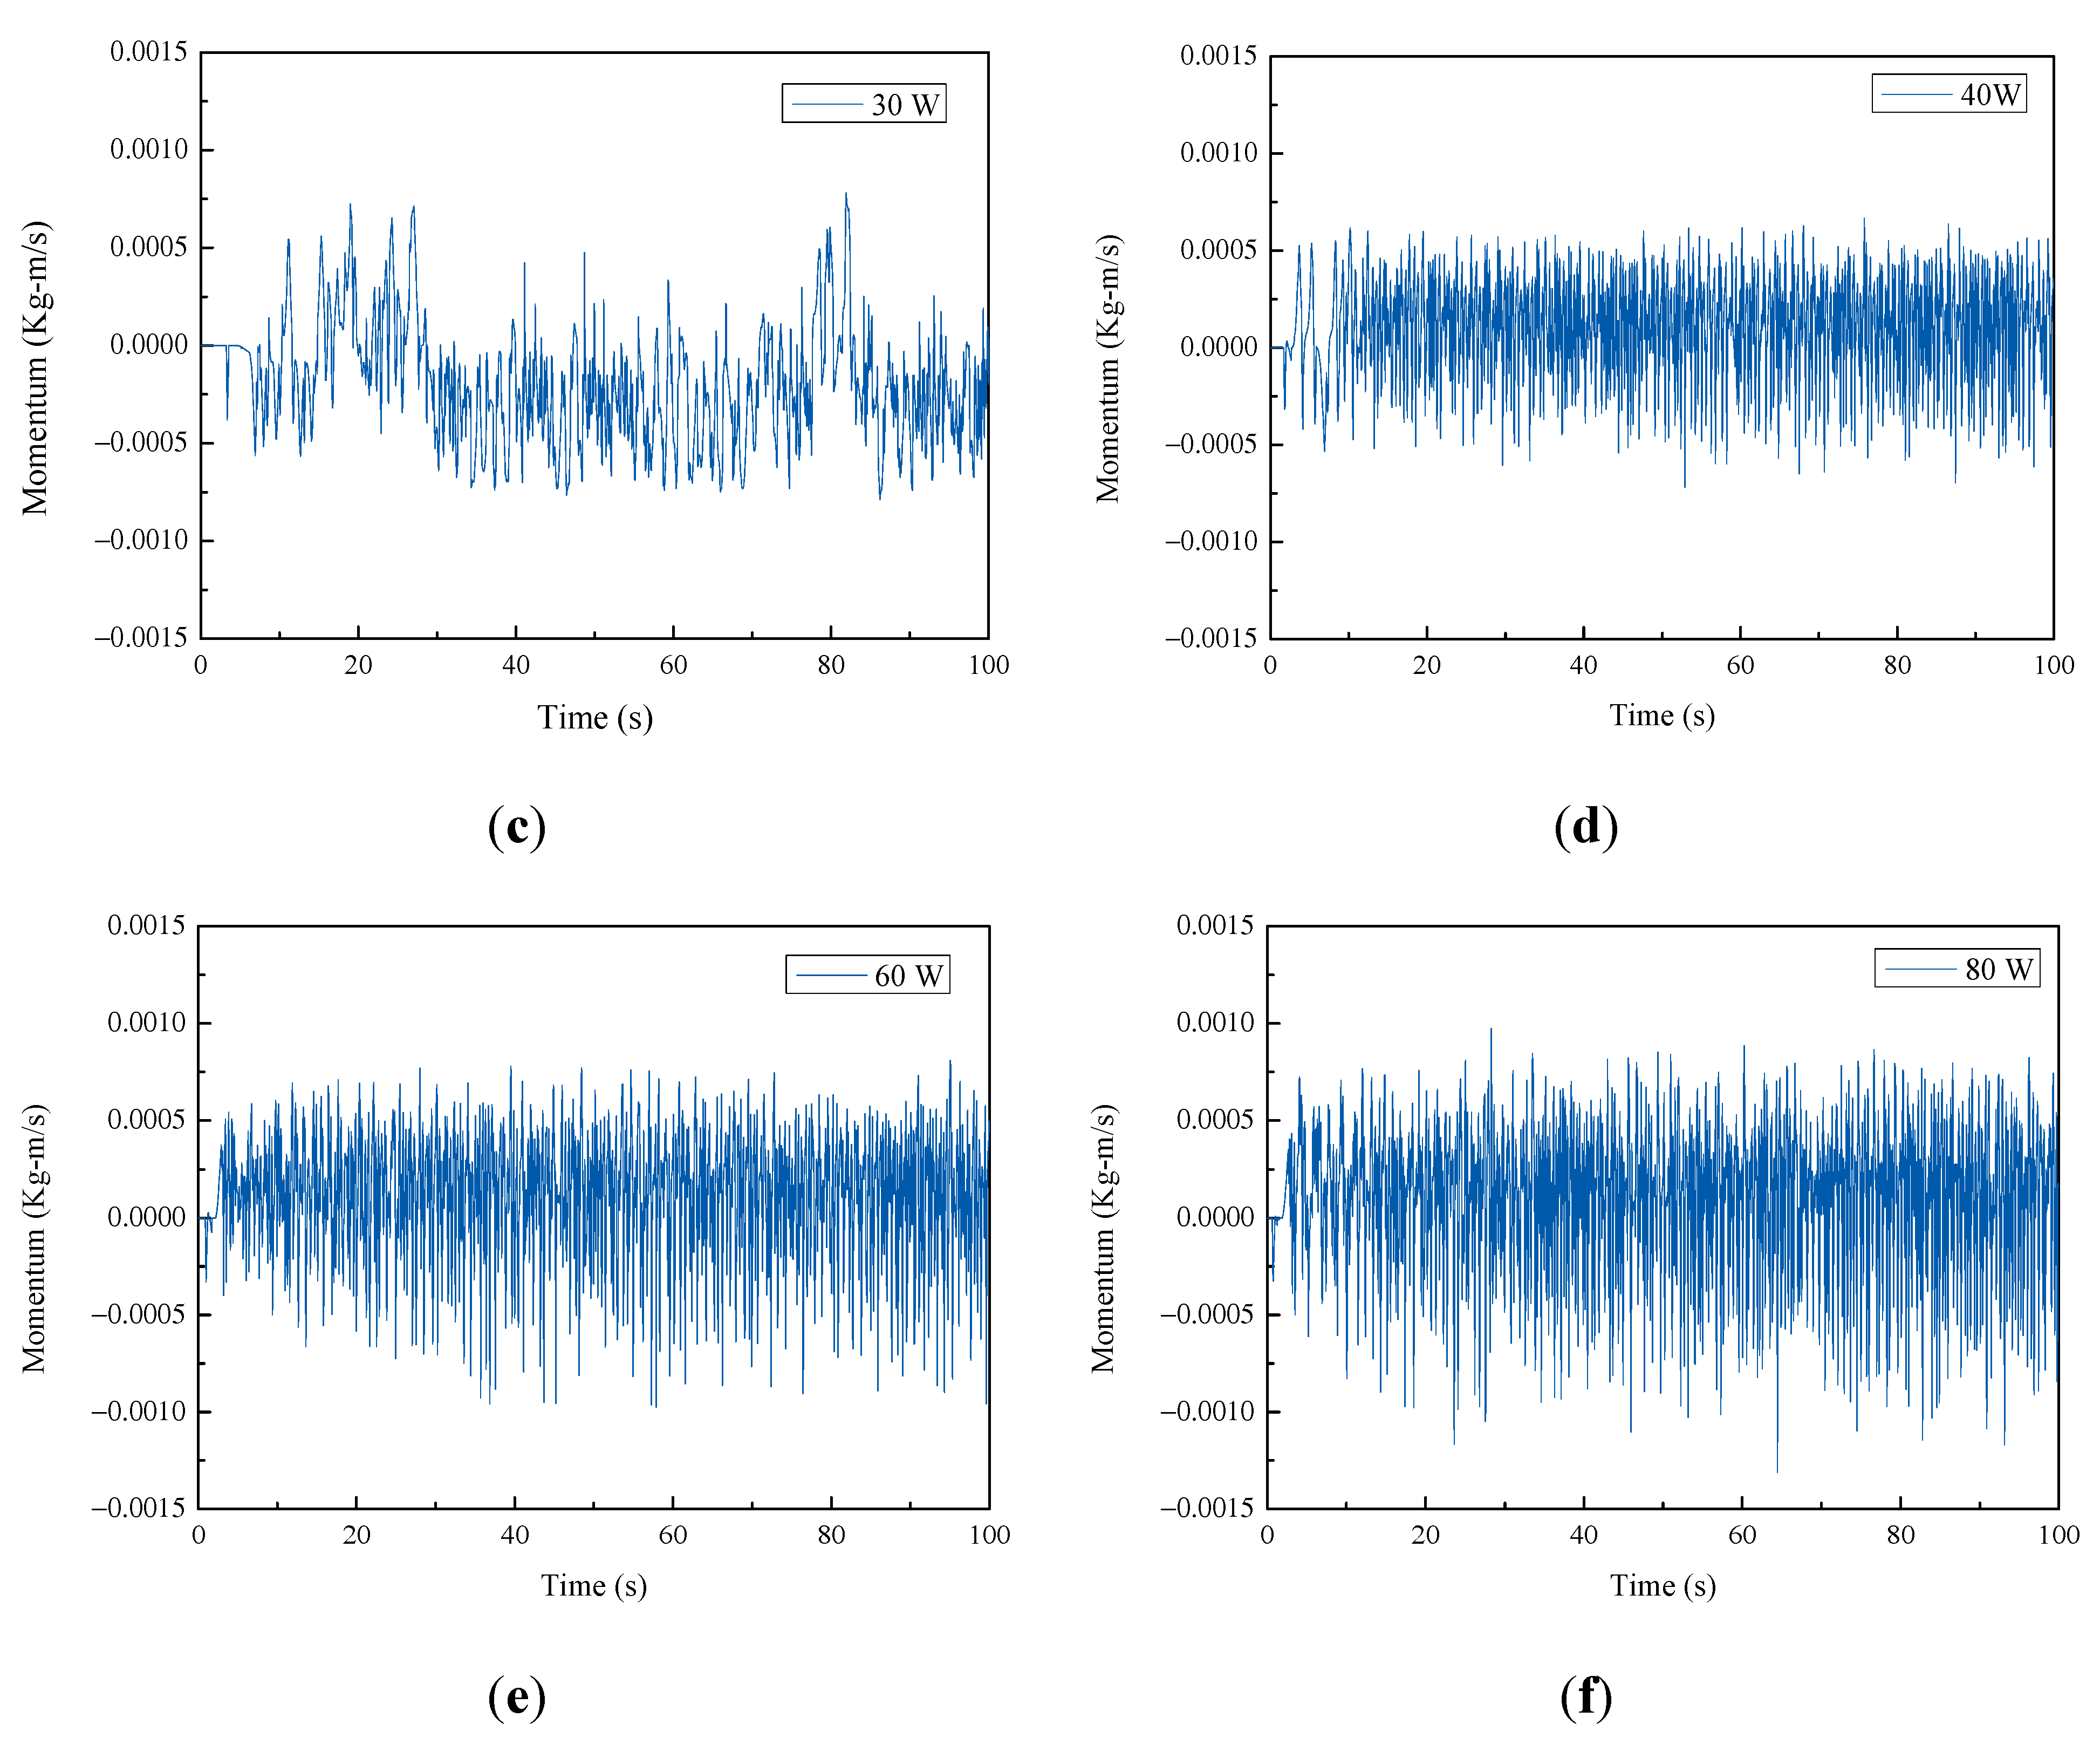
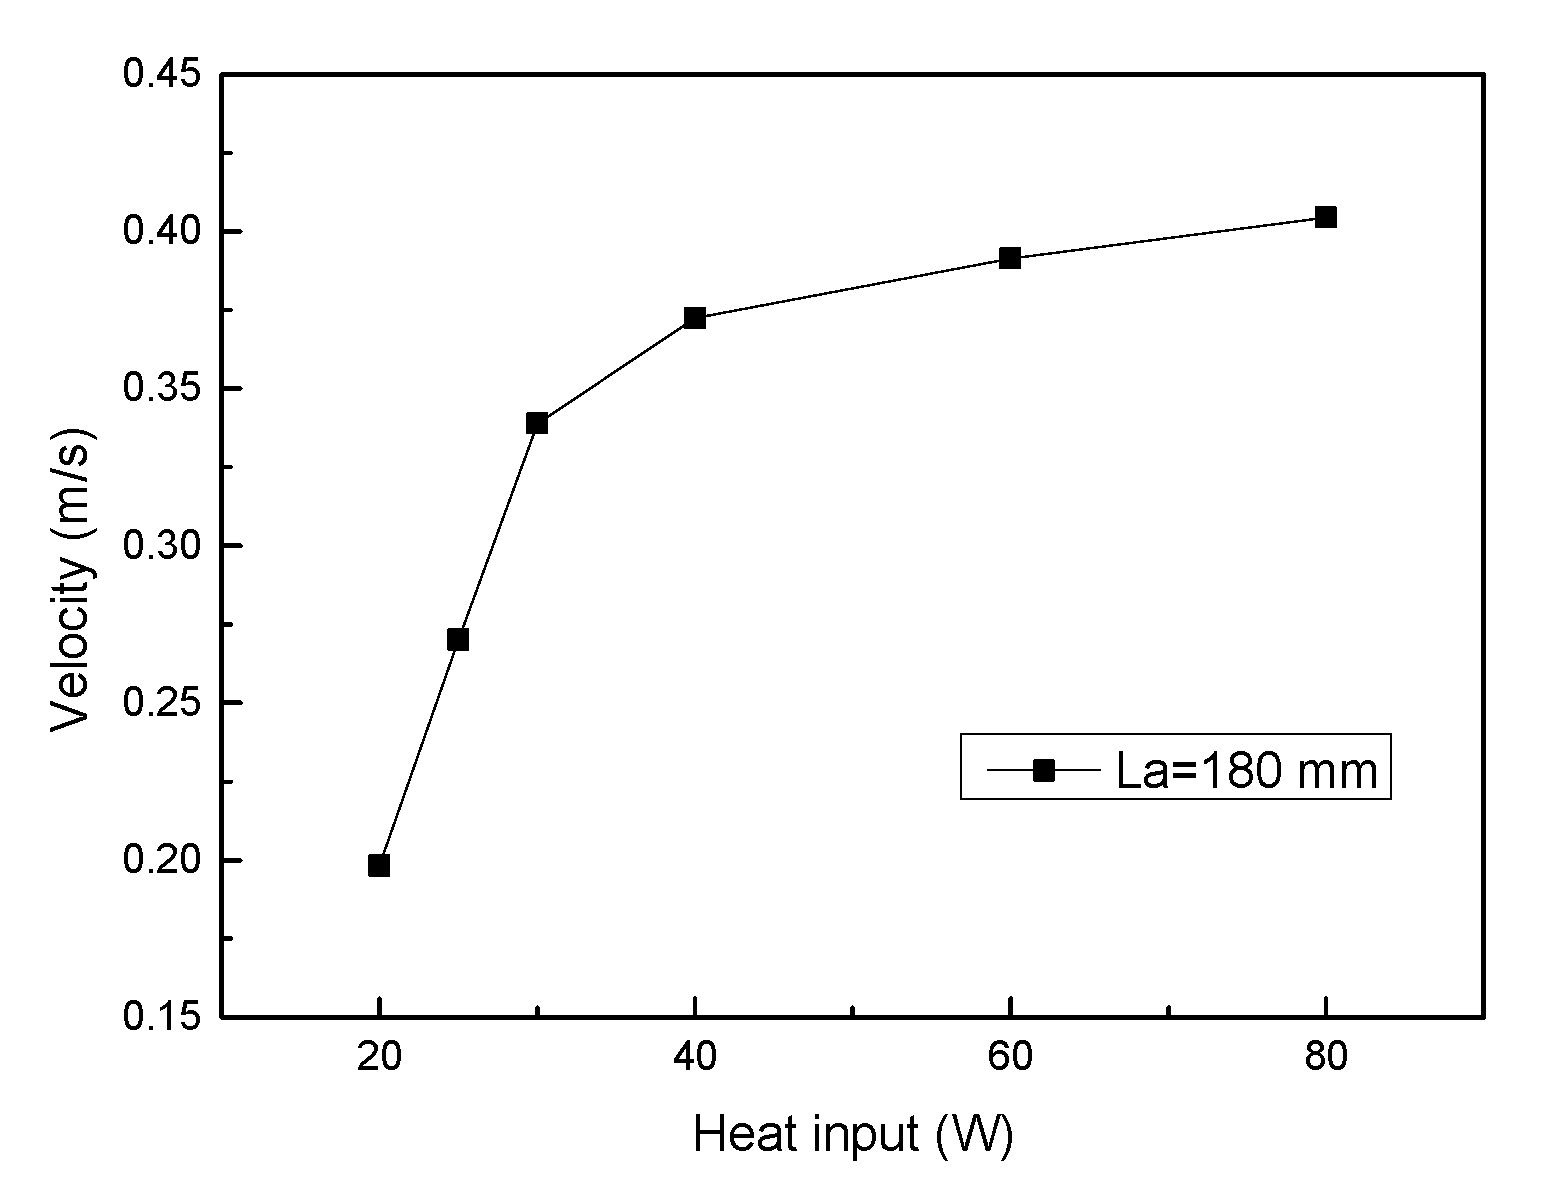
3.2.1. The Flow Characteristics of the Liquid Slugs in the PHP
The PHP with the adiabatic section length of 180 mm was taken as an example to illustrate the flow characteristics during the operation. Figure 5 shows the temperature fluctuation and the momentum of the liquid slugs at the heat input of 20 W. E1 and E2 are the temperature monitoring points in the evaporation section, and C1 and C2 are the temperature monitoring points in the condensation section. The location of temperature monitoring points E1, E2, C1, and C2 in Figure 5a are indicated in Figure 2a. The momentum (p) of the liquid slugs was calculated by:
where ml and v represent the mass and the velocity of the liquid slug, respectively. When p > 0, the flow direction of the liquid slug was consistent with the positive direction of the x-axis. When p < 0, the liquid slug flowed along the negative direction of the x-axis. From Figure 5a,b, it can be seen that the evaporation temperature continuously increased before the liquid slugs started to move. At time t0, the absolute value of the momentum increased; that is, the liquid slugs started to move. Then, the evaporation temperature decreased and the condensation temperature increased because the heat was transferred from the evaporation section to the condensation section by the movement of the liquid slugs. Therefore, it can be concluded from Figure 5 that the PHP started at t0.
Figure 5.
Operation characteristics of the PHP at 20 W (La = 180 mm): (a) temperature fluctuation of the evaporation section and the condensation section; (b) momentum of the liquid slugs.
After t0, the PHP achieved a stable operation state. During the steady operation of the PHP, the liquid slugs were driven by the pressure differences between the vapor plugs. Figure 6a–f shows the distribution of the liquid slugs and the vapor plugs in the PHP with the time interval of 0.05 s, and the flow direction of the liquid slugs is indicated by red arrows. The length of the adiabatic section was 180 mm and the heat input was 20 W. The expansion-shrink and generation-collapse processes of the vapor plugs which drove the movements of the liquid slugs were clearly shown in the results of this numerical simulation. As shown in Figure 6a,b, the third vapor plug expanded and pushed the adjacent liquid slugs. Then, the second liquid slug in Figure 6b reached the saturated temperature, new vapor plugs generated in the liquid slug; the liquid and vapor plugs are renumbered as shown in Figure 6c. The newly generated vapor plugs expanded and pushed the adjacent liquid slugs. Then, due to the different flow velocity, the second and third liquid slugs in Figure 6e merged with each other and a new second liquid slug was formed, as shown in Figure 6f. Therefore, during the operation of the PHP, the expansion-shrink and generation-collapse processes of the vapor plugs have a significant influence on the movements of the liquid slugs.
Figure 6.
The flow of the liquid slugs at the heat input of 20 W with the time interval of 0.05 s (adiabatic section length = 180 mm): (a) 78.45 s, (b) 78.50 s, (c) 78.55 s, (d) 78.60 s, (e) 78.65 s, (f) 78.70 s.
To investigate the flow characteristics in the PHP under different heat input, the momentum of the liquid slug in the PHP with 180 mm adiabatic length is shown in Figure 7. The sign of the momentum represents the flow direction of the liquid slugs; that is, when the momentum is larger than zero, the flow direction is the positive direction of the x-axis. Figure 7 shows that the absolute value of the momentum of the liquid slug increased with the increase in the heat input. Furthermore, the oscillation frequency of the momentum obviously increased with the increase in the heat input. The main reason for this was that the bubble generation can be more intense at higher heat input and the driving force for the liquid plugs was higher at larger heat input.

Figure 7.
The momentum of the liquid slug inside the PHP with the adiabatic section of 180 mm at the heat input of (a) 20 W, (b) 25 W, (c) 30 W, (d) 40 W, (e) 60 W, and (f) 80 W.
In addition, Figure 7 also shows that the oscillating frequency was much lower at the low heat inputs. The reason for this was that the flow velocity of the liquid slugs was lower and the stagnation of the liquid slug occurred frequently at low heat input. These results were also observed in previous visual experiments [21]. In addition, the mean velocity of the liquid slug in the PHP with 180 mm adiabatic length is presented in Figure 8, and it can be seen that the mean velocity of the liquid slug increased as the heat input increased. When the heat input was 20 W, the mean velocity of the liquid slugs in the PHP was 0.198 m/s, whereas the mean velocity increased to 0.404 m/s at the heat input of 80 W. According to the visual experimental results of the study of Xue et al. [20], when the PHP works at the state of slug flow, the magnitude of the fluid velocity is about 0.1–0.6 m/s. Thus, the velocity calculated by the numerical model in this work was consistent with the visual experimental results of Xue et al. [20].
Figure 8.
The mean velocity (absolute value) of the liquid slug PHP with the adiabatic section of 180 mm at a steady operation state.
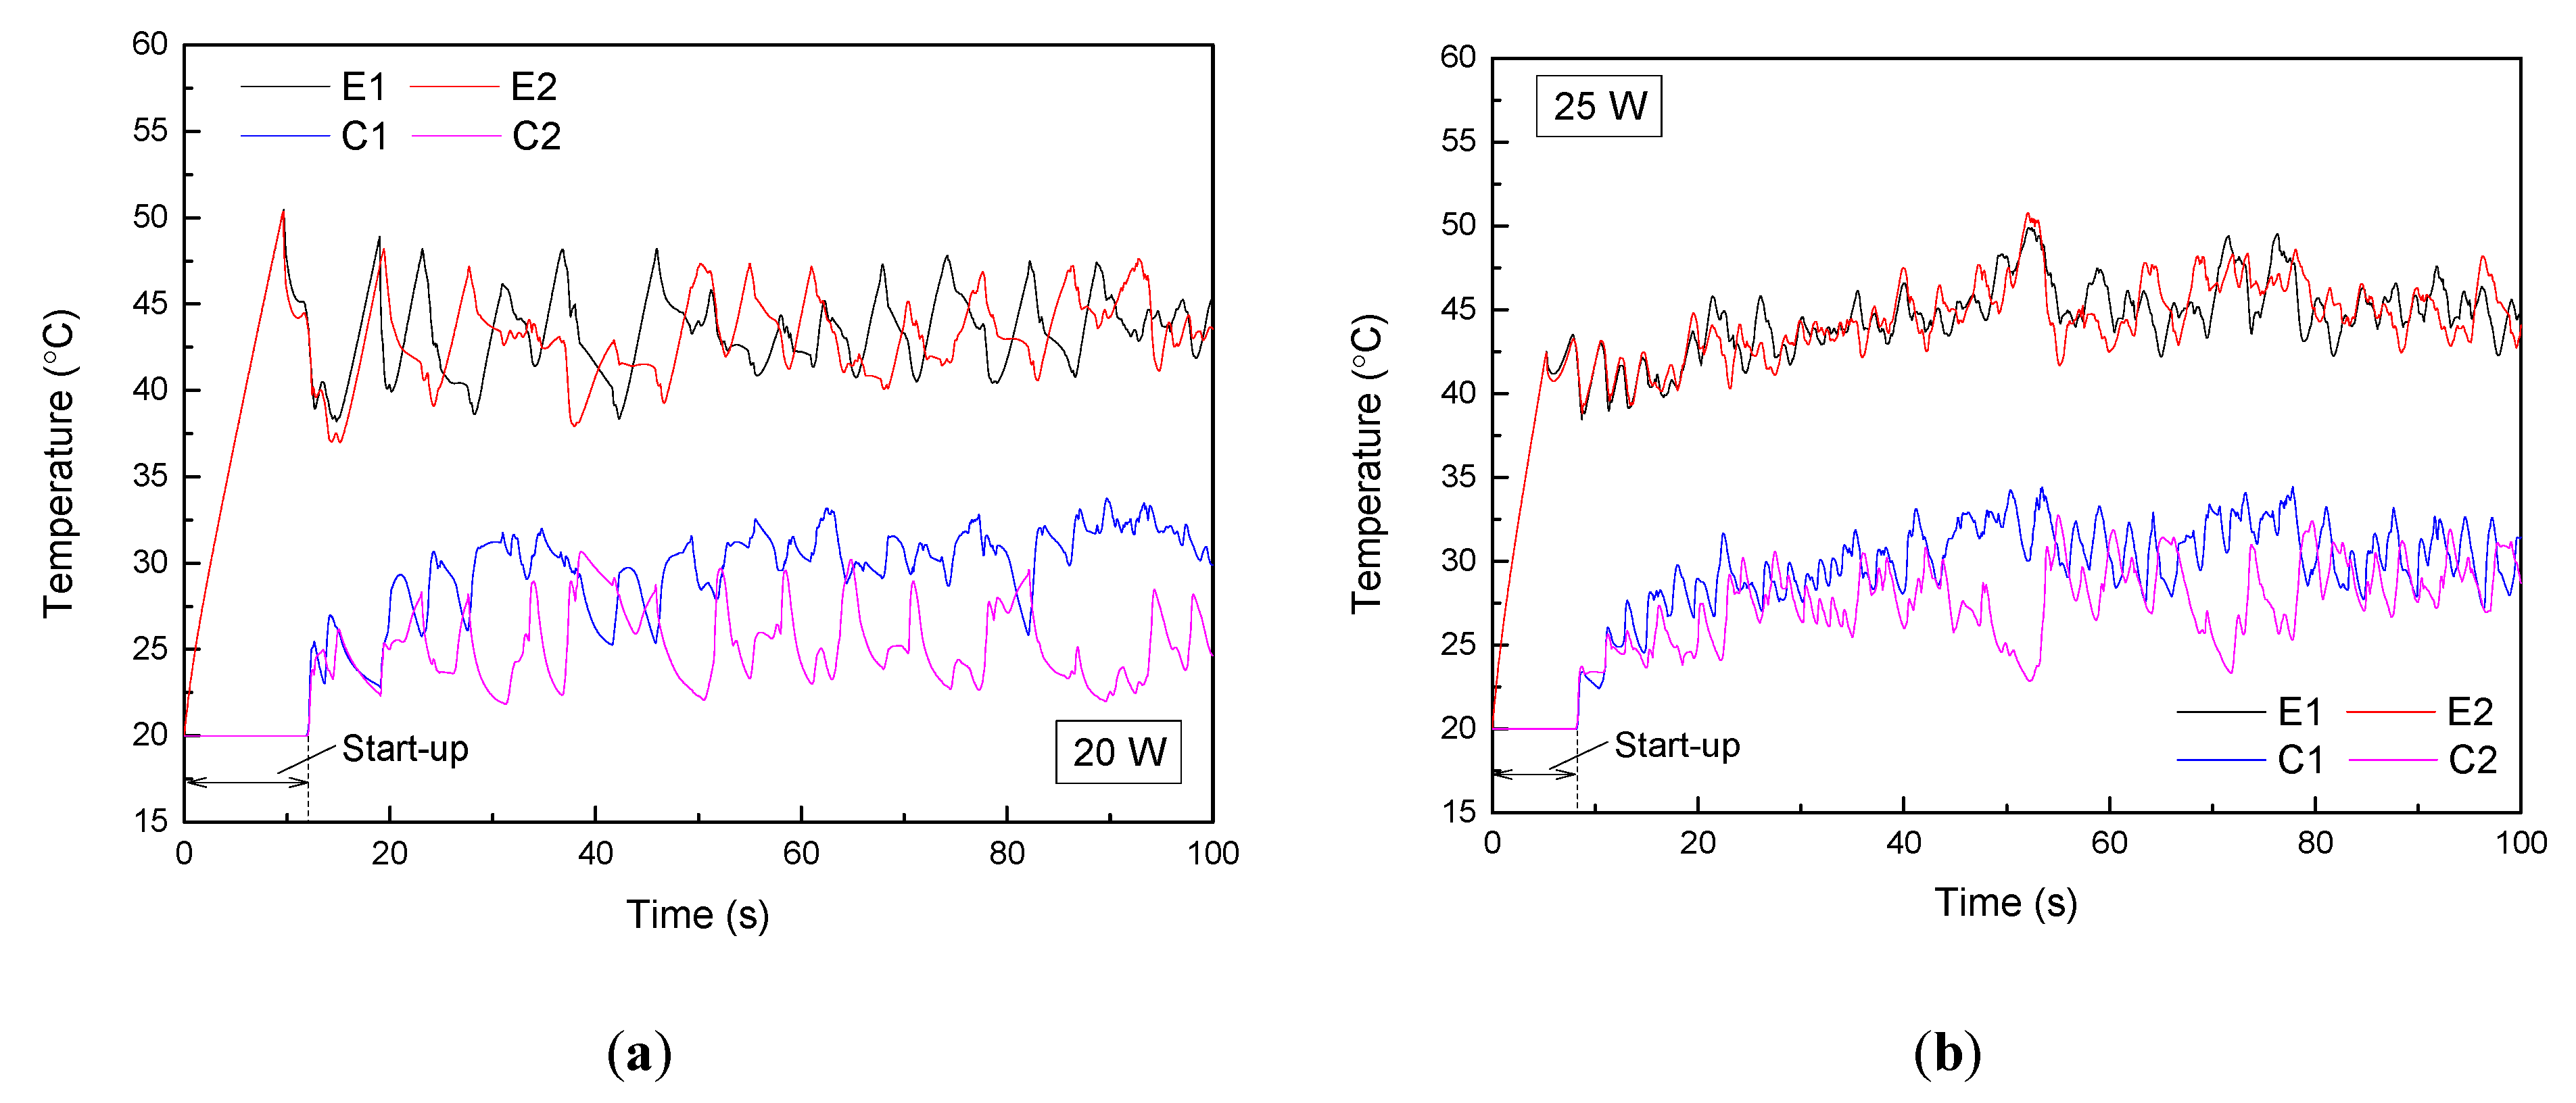
3.2.2. The Heat Transfer Characteristics of the PHP
The PHP with the adiabatic section length of 180 mm was taken as an example to illustrate the heat transfer characteristics. The temperatures of the evaporation section and the condensation section are shown in Figure 9. It can be clearly seen that at the heat input of 20 W, the oscillating amplitude of the temperature was larger and the oscillating frequency of the temperature was lower compared with those at higher heat inputs. The main reason for this was that when the heat input was low, the flow velocity of the working fluids was small, and the movement of the liquid slugs was oscillatory in the PHP, as shown in Figure 6 and Figure 7. Due to the oscillatory motion of the liquid slugs, the temperature oscillated with a high amplitude at the heat input of 20 W. When the heat input was higher, the oscillation frequency and the absolute velocity of the liquid slugs increased, and the liquid slugs in the PHP formed a more circulatory flow. Thus, the heat transfer process was more stable and the oscillation amplitude of the wall temperature was lower at higher heat input. In addition, Figure 9 shows that the time needed for the start-up of the PHP decreased as the heat input increased. The main reason for this was that new vapor plugs were easier to generate at higher heat input, and the driving force of the liquid slugs was larger. This is consistent with the previous experimental results [1,21].

Figure 9.
The wall temperature of the PHP with the adiabatic section of 180 mm at the heat input of (a) 20 W, (b) 25 W, (c) 30 W, (d) 40 W, (e) 60 W, and (f) 80 W.
To analyze the heat transfer performance of the PHP, the thermal resistance (R) was calculated as follows:
where and are the mean temperature of the evaporation section and the condensation section, respectively, and Q is the heat input. The thermal resistance of the PHP represents the heat transfer performance of the PHP. Figure 10 shows the thermal resistance and flow velocity in the PHP with different lengths of the adiabatic section length. Because the flow of liquid slugs became more intense at higher heat input, the thermal resistances of the PHPs reduced as the heat input increased. For example, when the heat input was 20 W, the thermal resistance of the PHP with 180 mm adiabatic length was 0.78 °C/W. The thermal resistance of the PHP reduced to 0.42 °C/W when the heat input increased to 80 W.
Figure 10.
The thermal resistances and the flow velocities for the PHP with the adiabatic length of (a) 60 mm, (b) 120 mm, (c) 180 mm and (d) 240 mm.
3.3. Effect of the Adiabatic Section Length on the Performance of the PHP
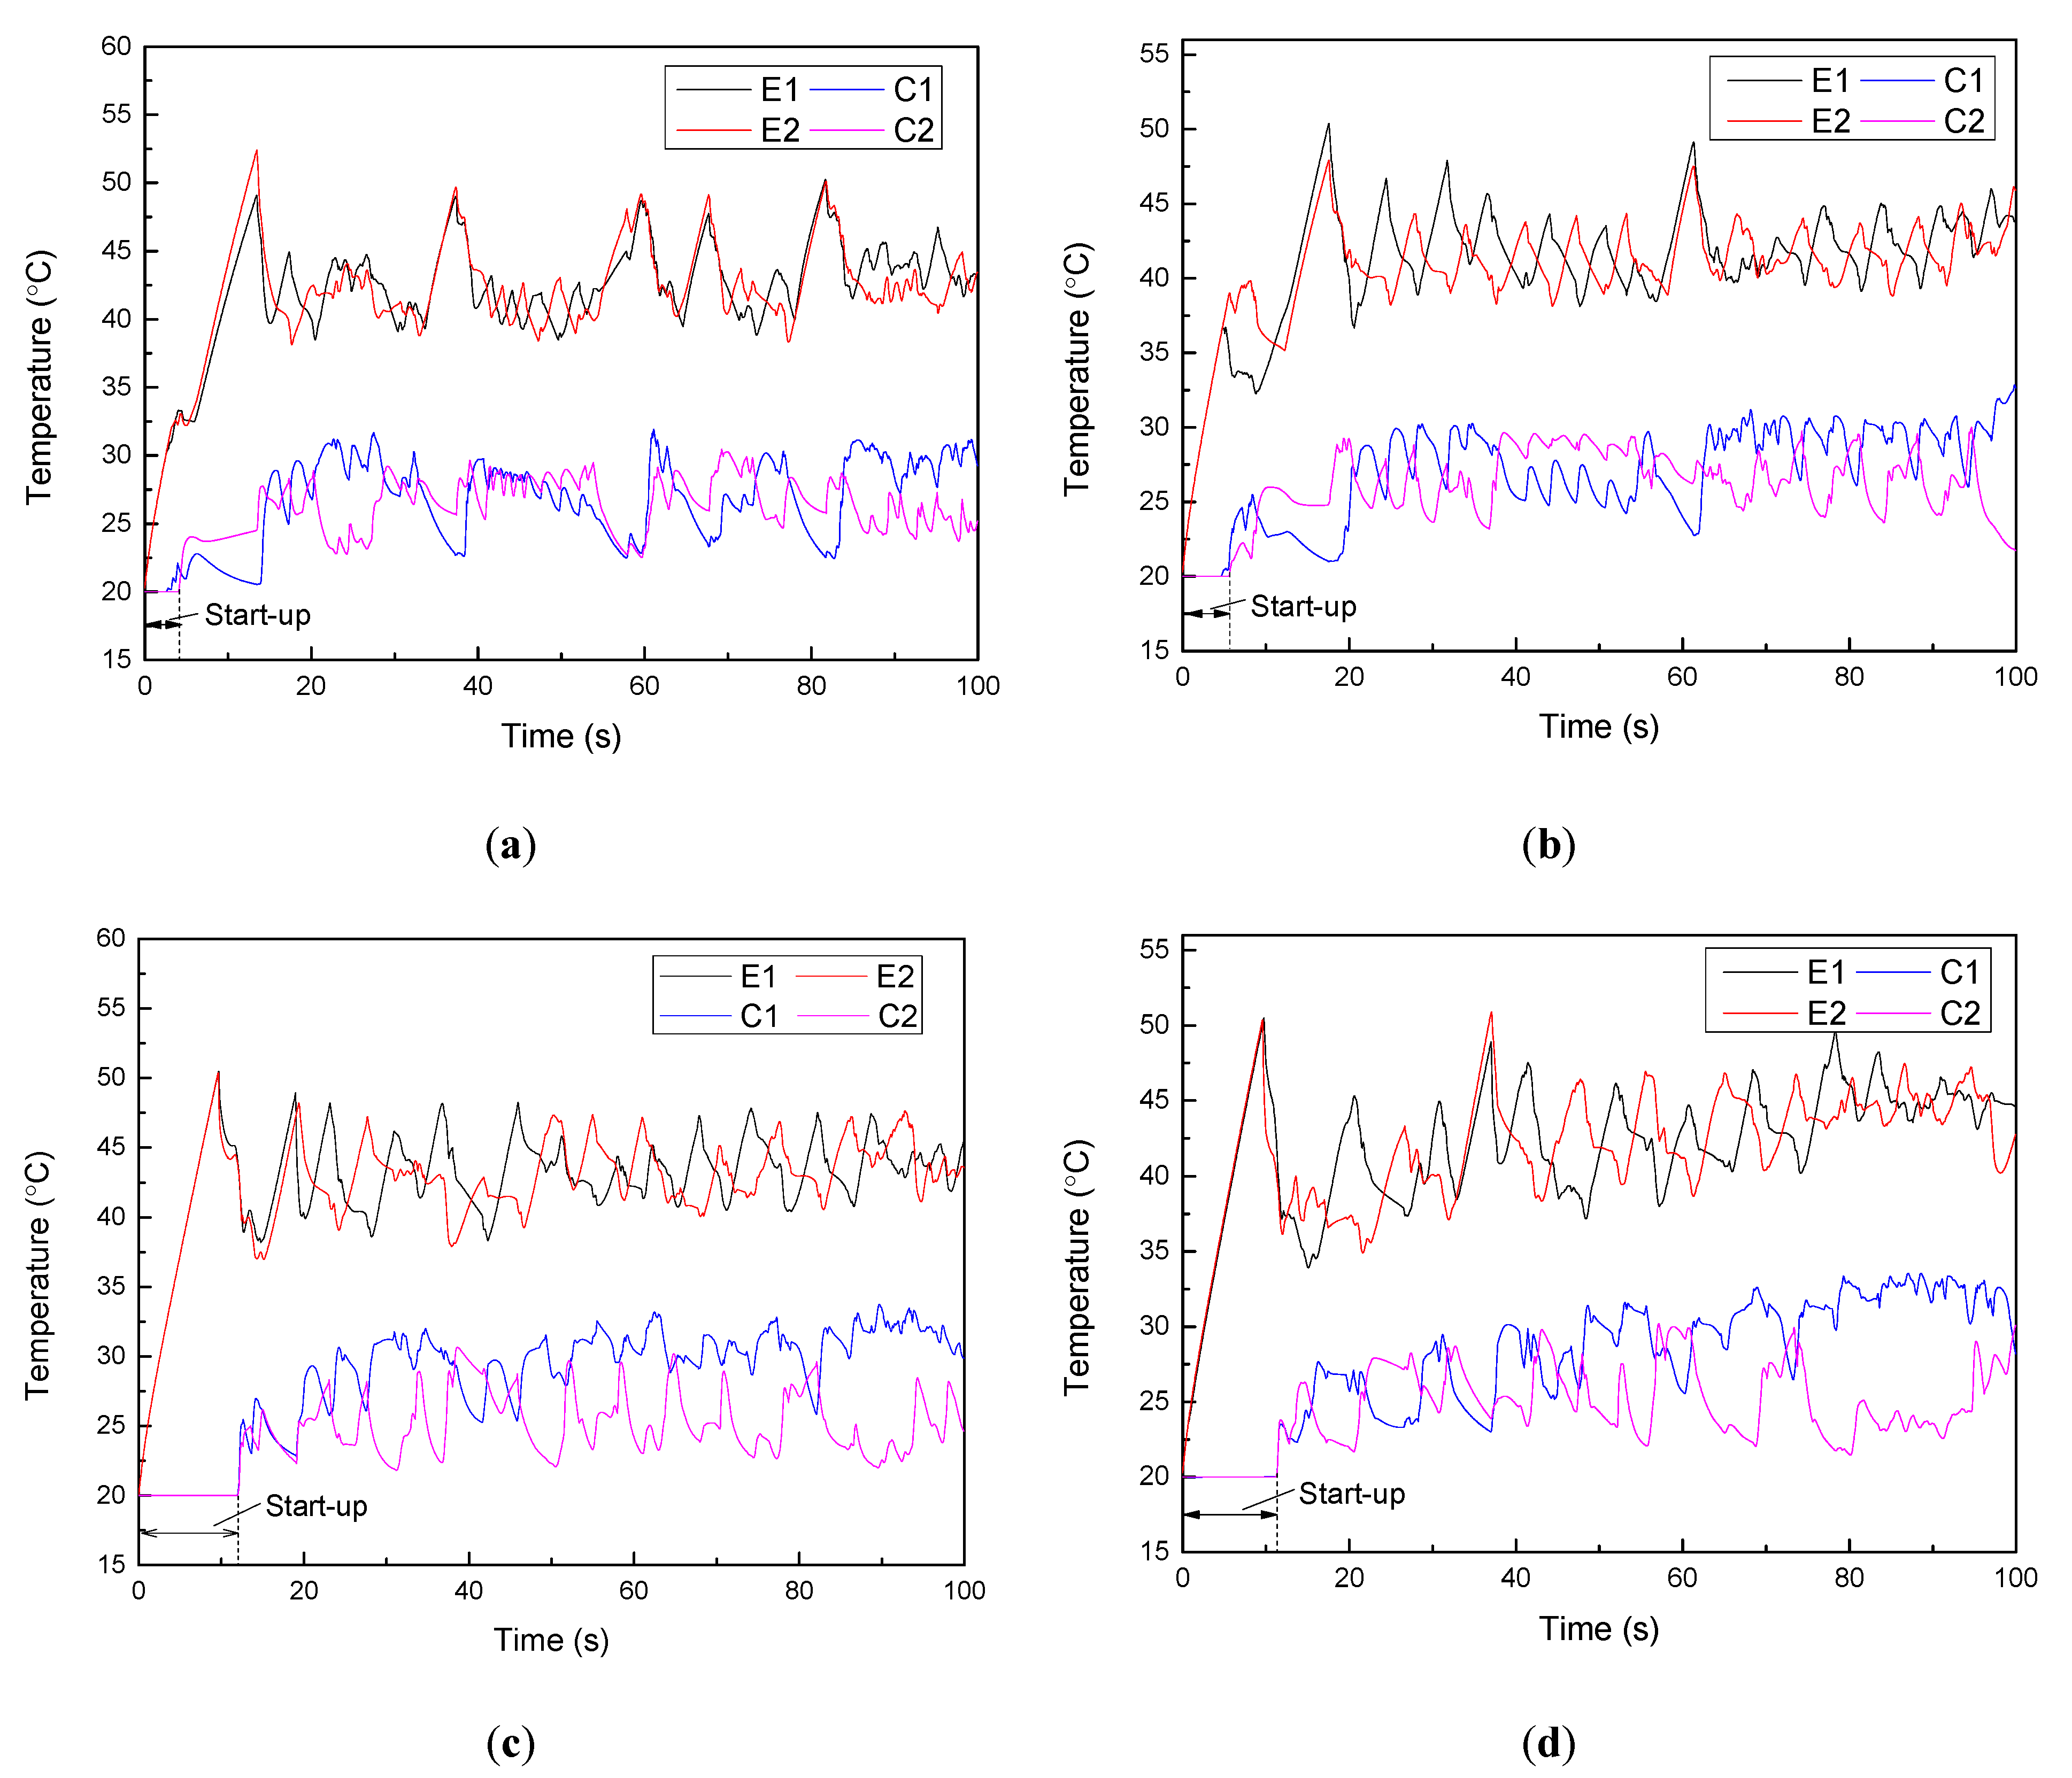
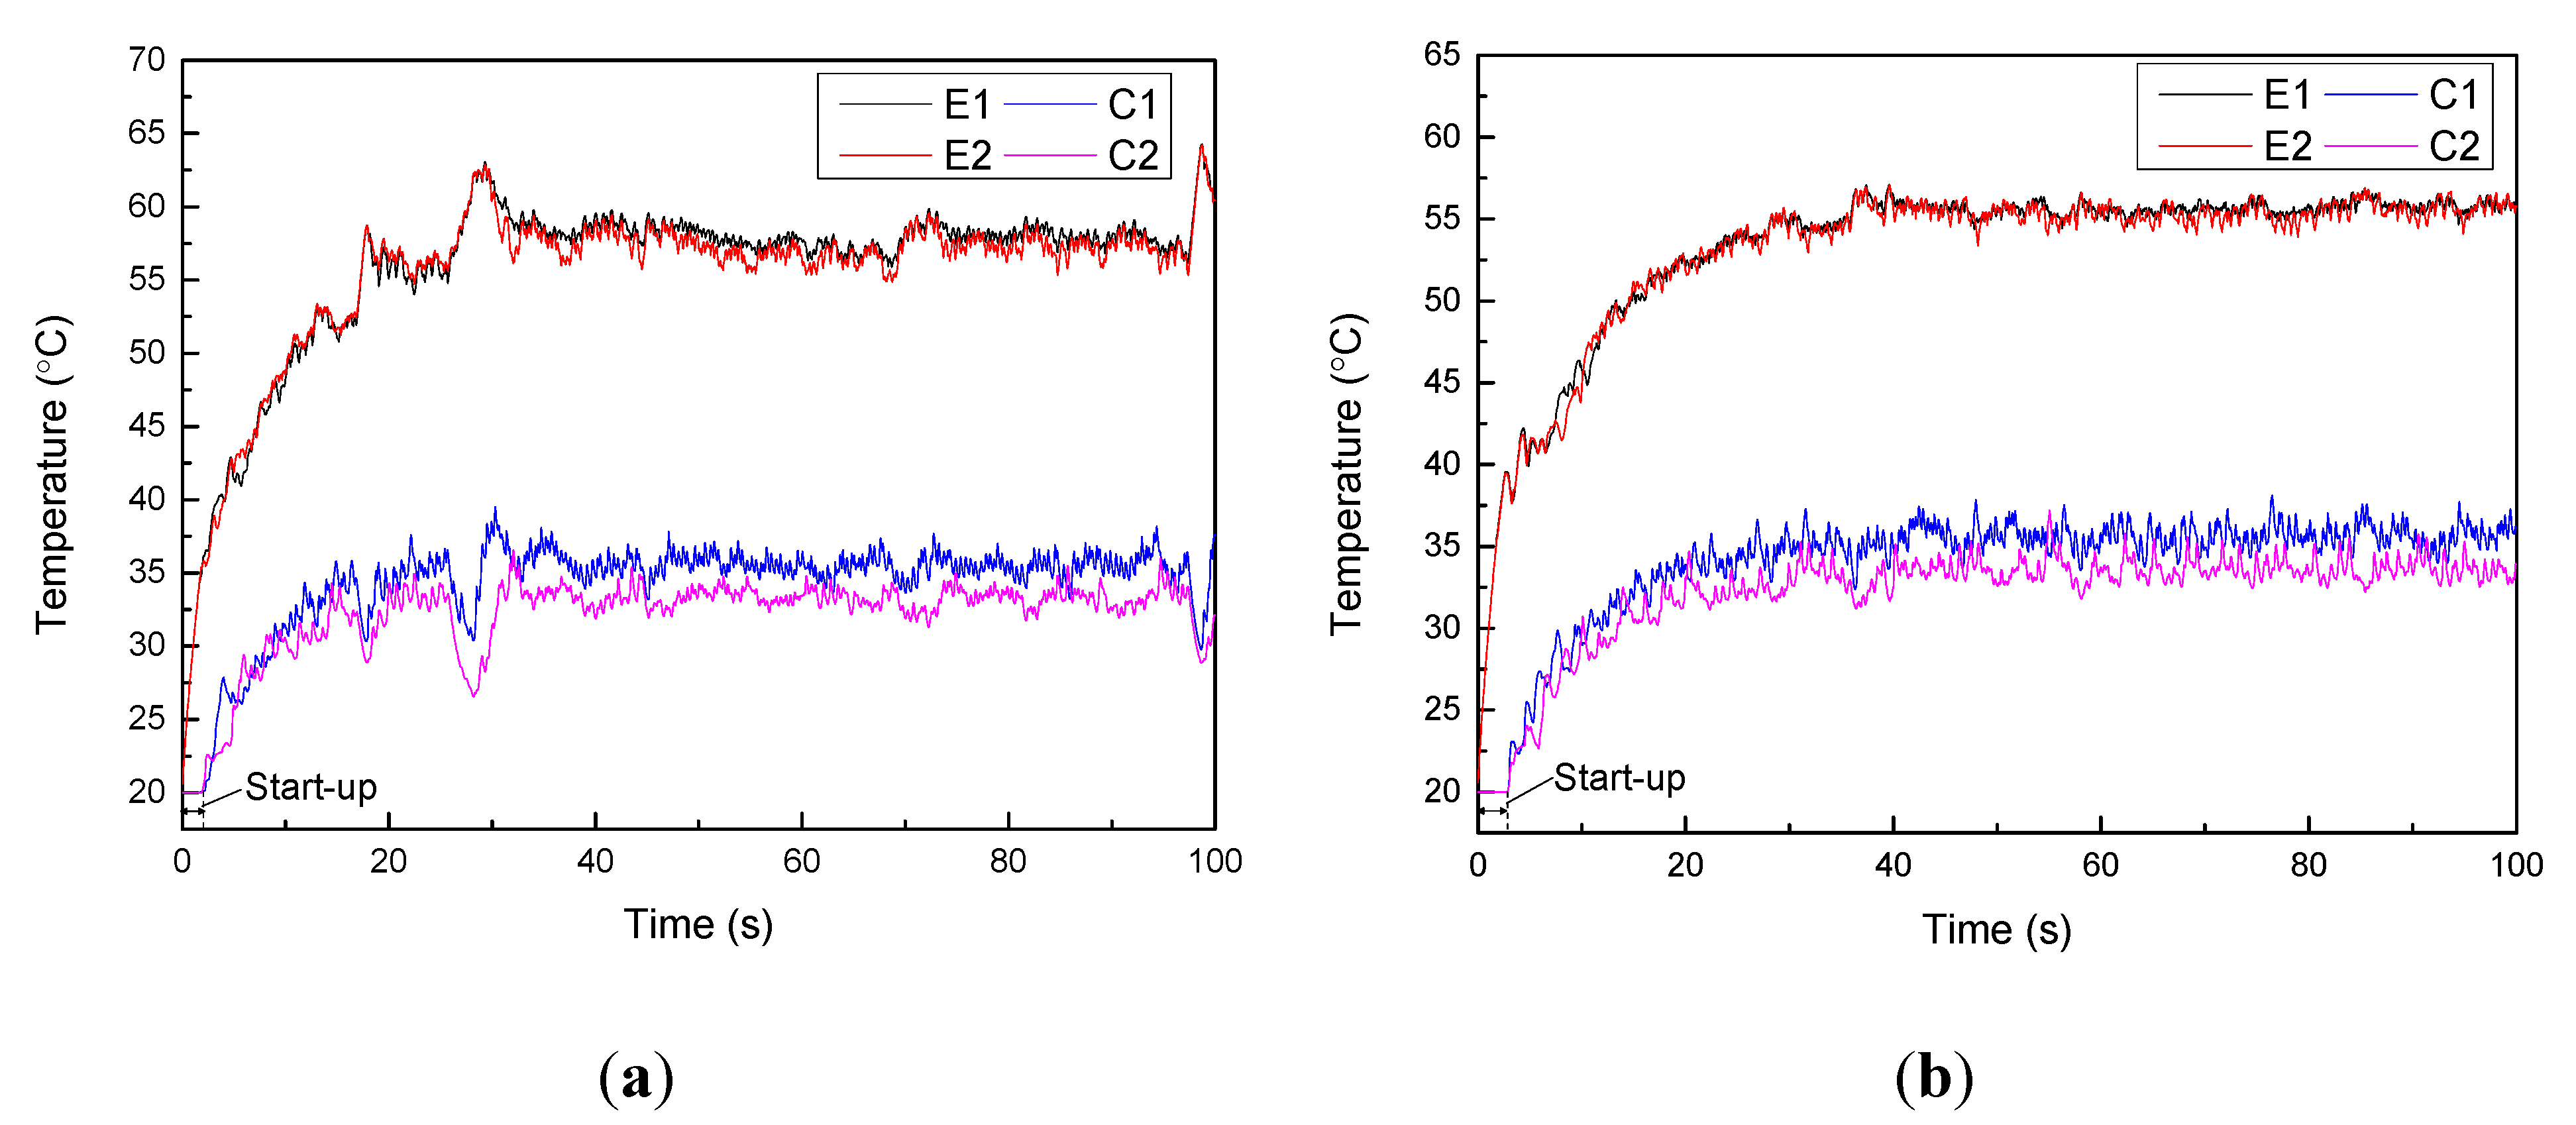
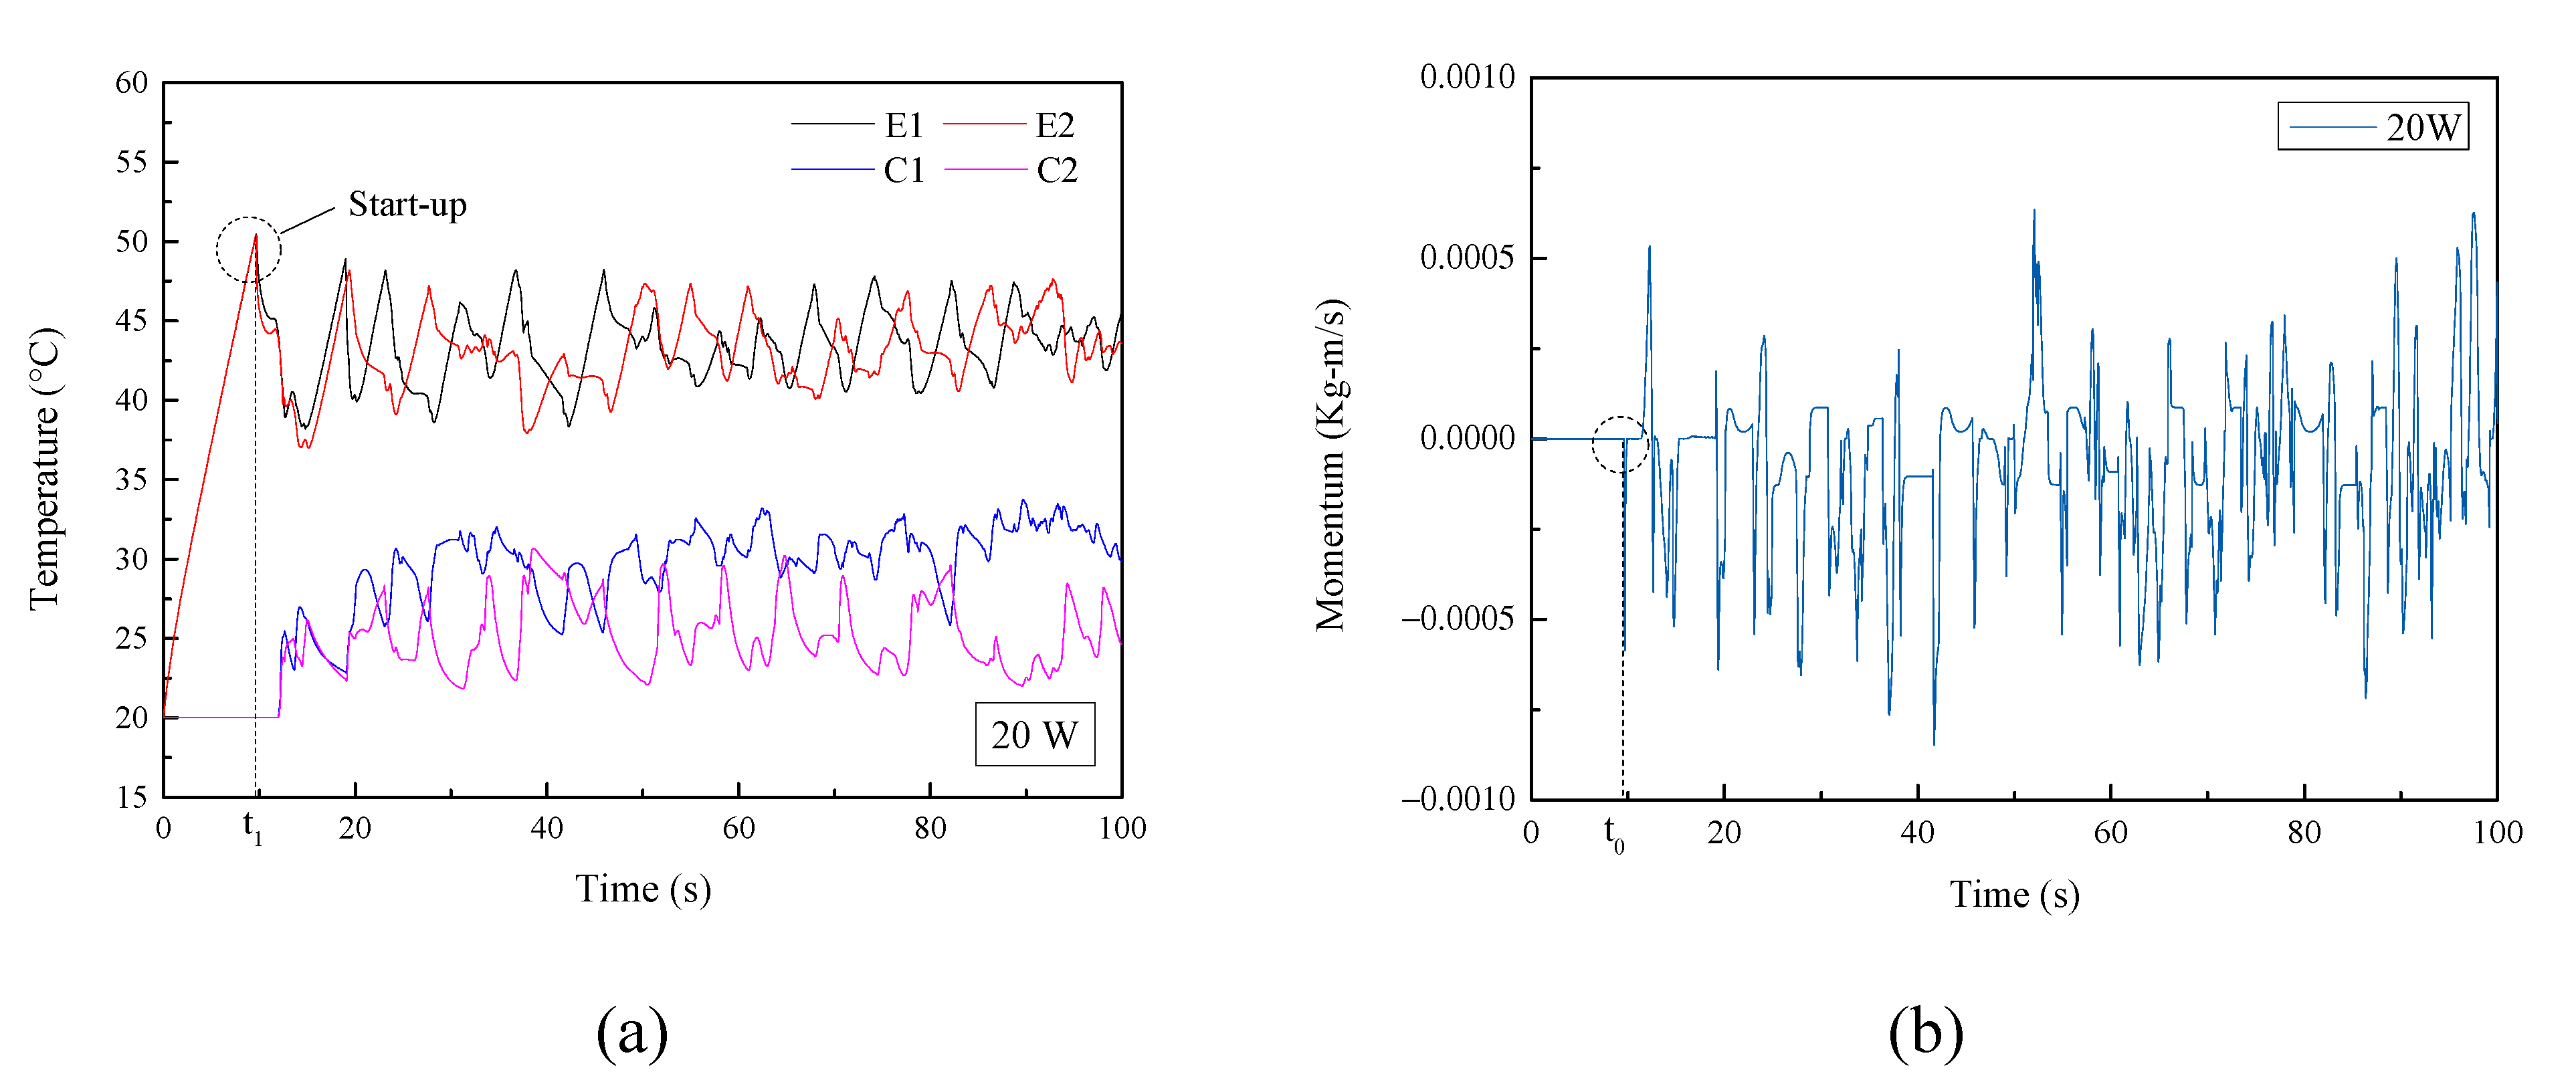
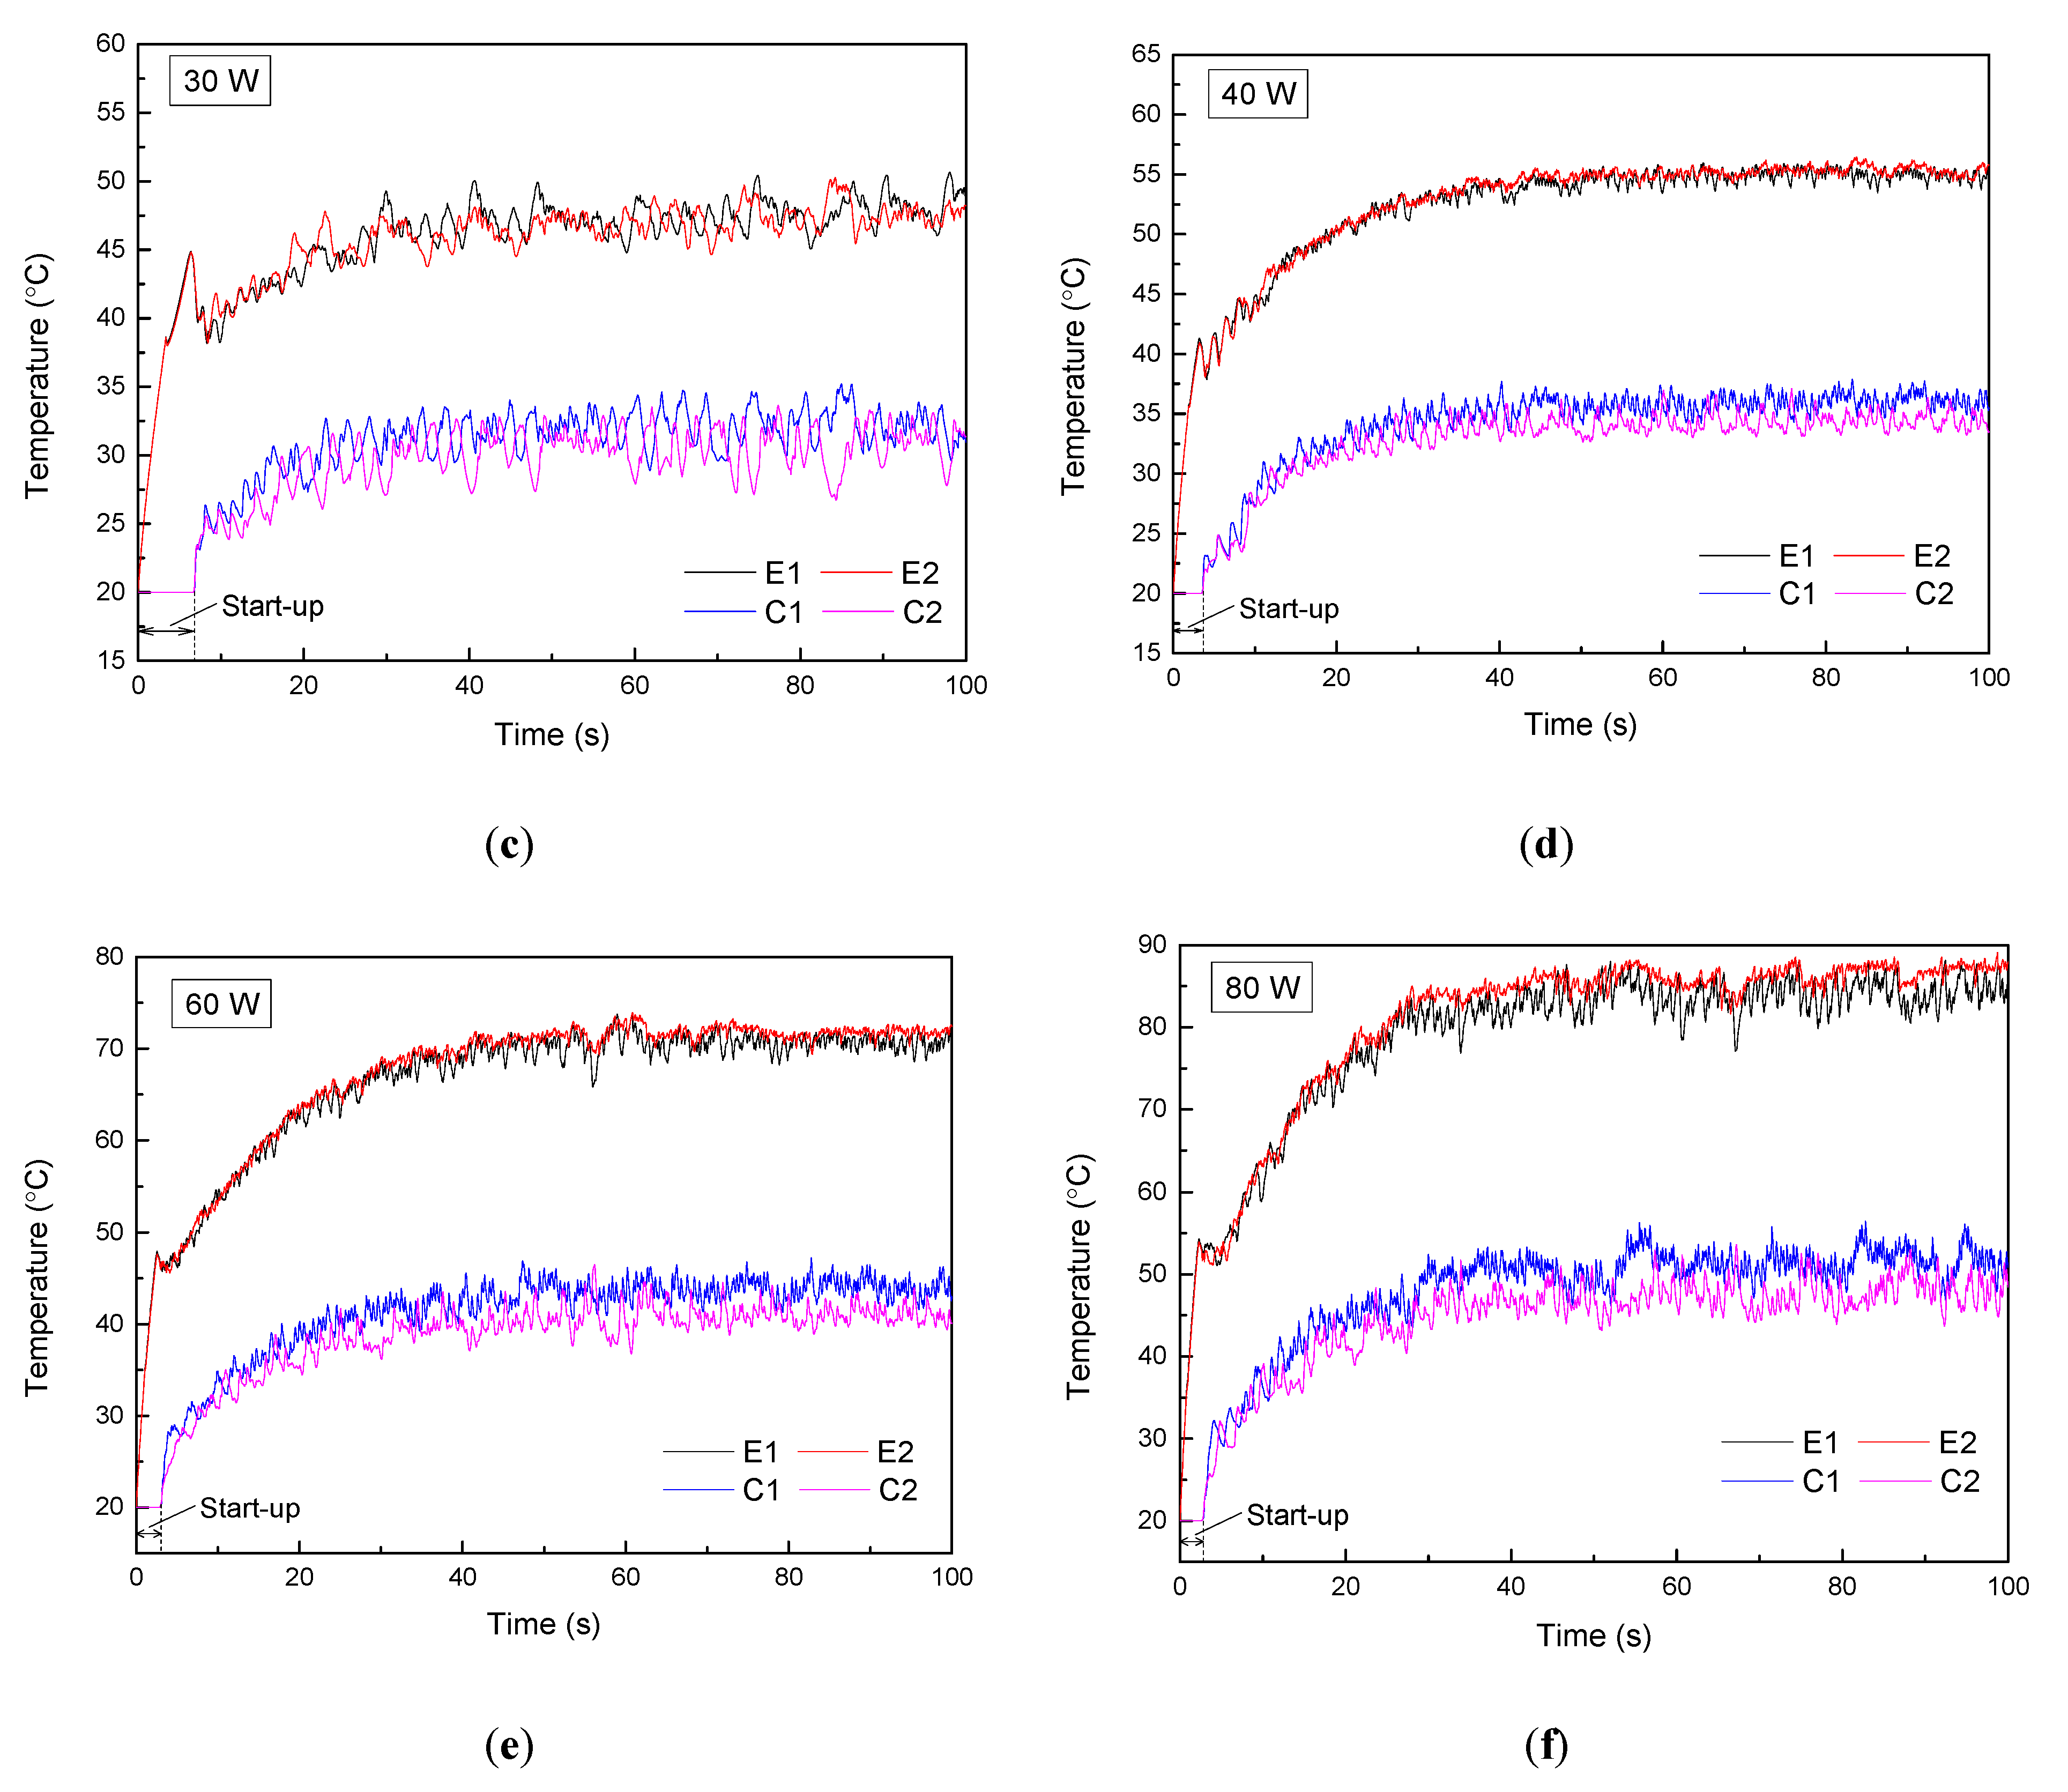
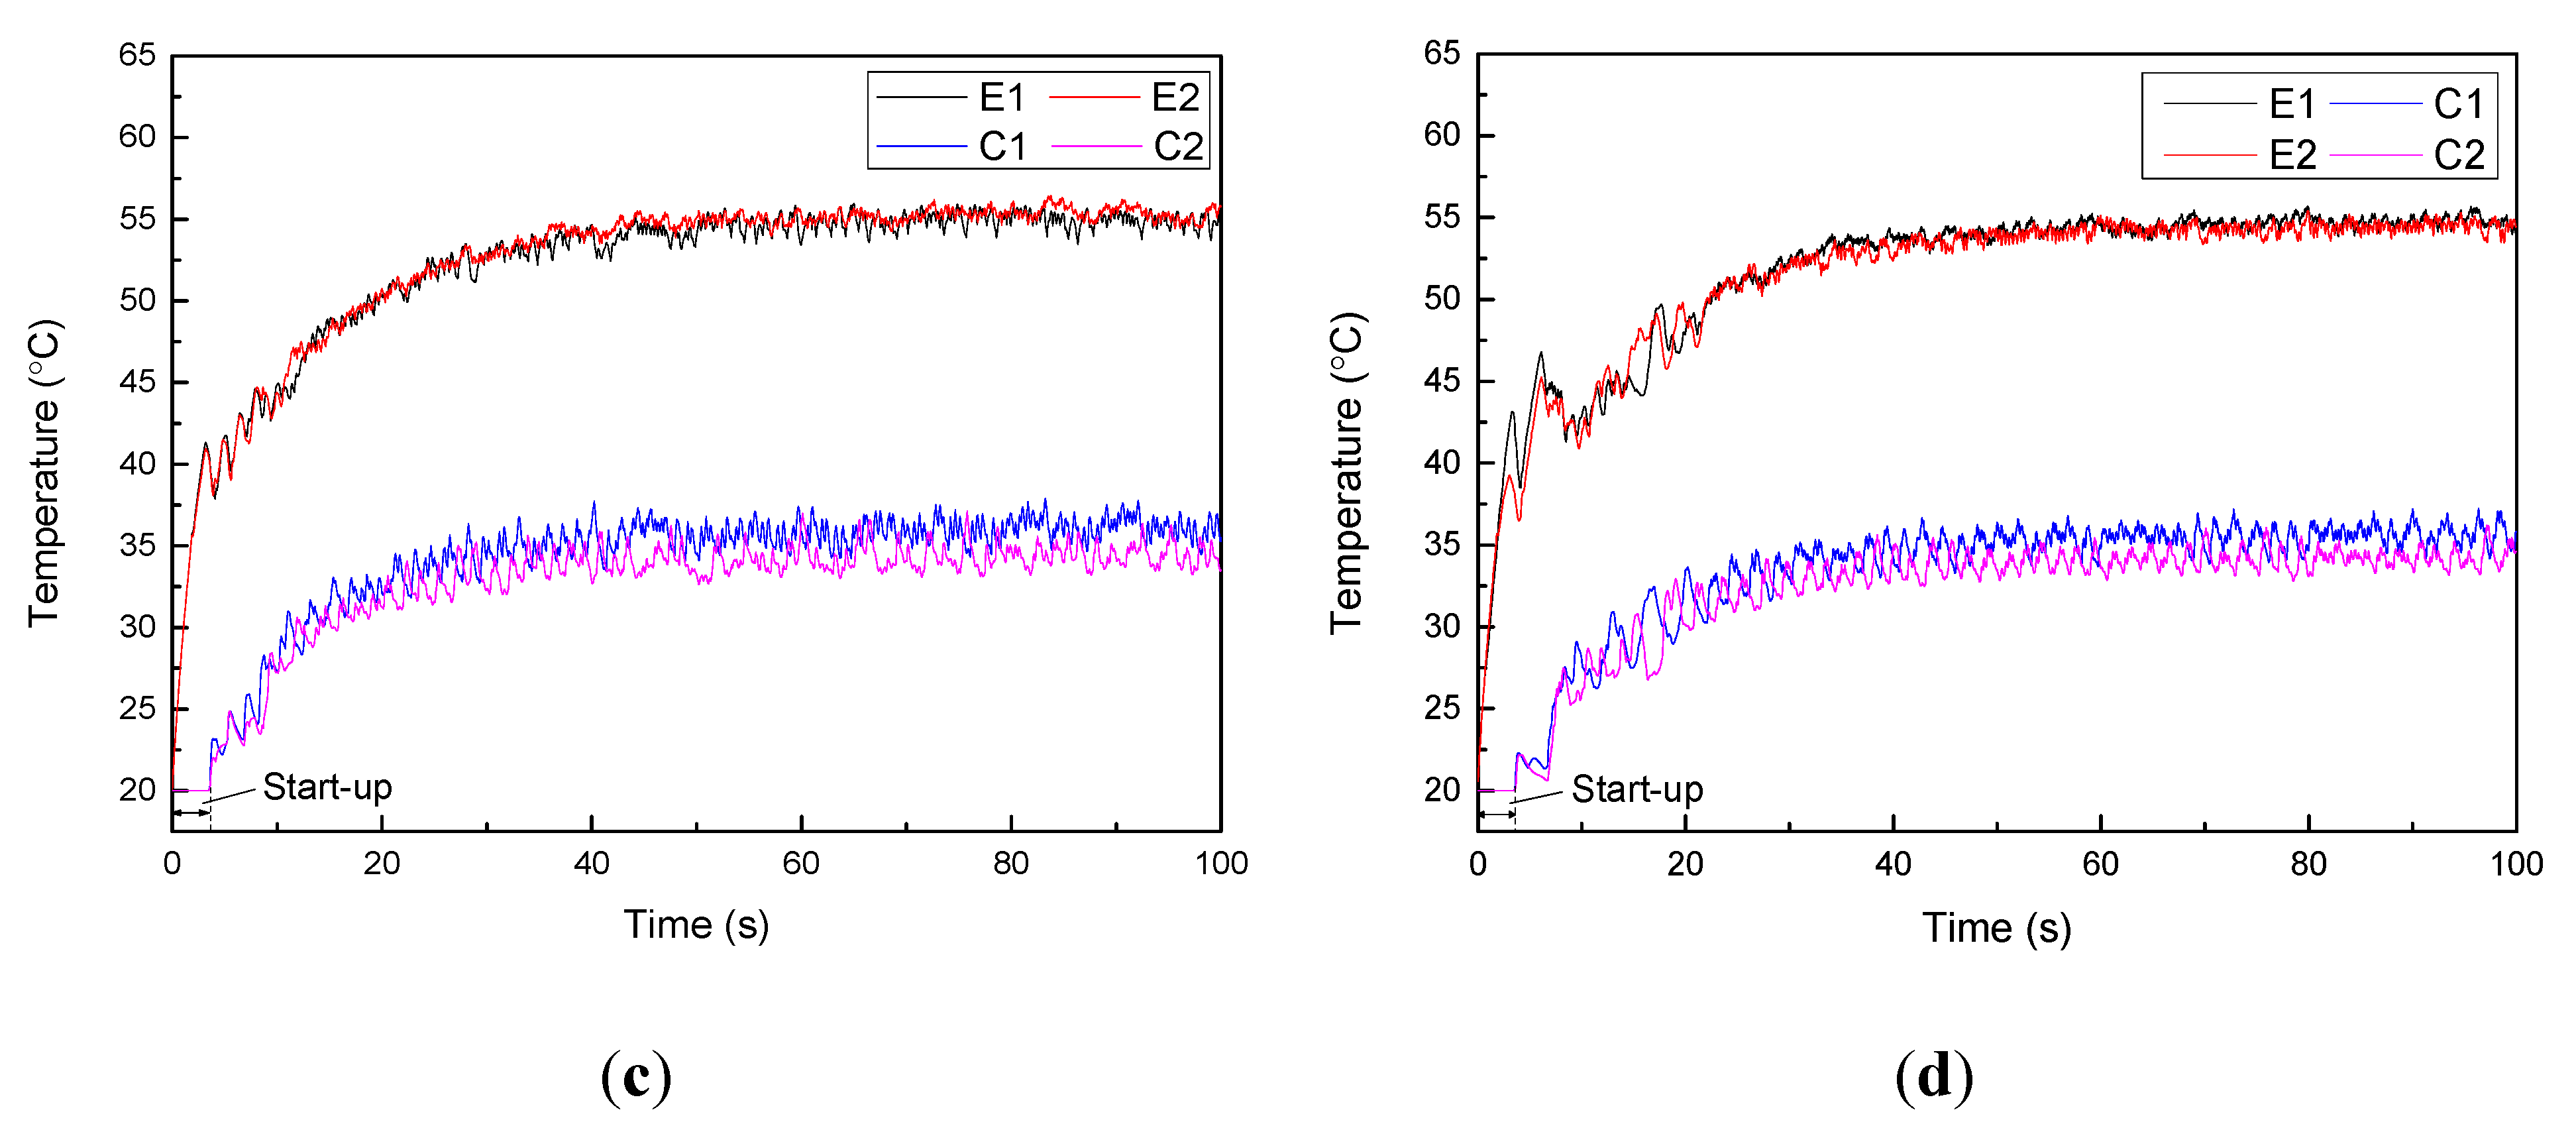
3.3.1. Effect of the Adiabatic Section Length on the Start-up Performance of the PHP
Figure 11 and Figure 12 show the temperature fluctuations of PHPs with different adiabatic section lengths at 20 and 40 W, respectively. It can be seen from Figure 11 and Figure 12 that the start-up time increased with the length of the adiabatic section. The reason for this was that the frictional losses of the liquid slugs were larger for the PHP with longer adiabatic sections, and it was more difficult for the liquid and vapor plugs to start the movement. When the heat input was higher, the driving force significantly increased, and thus the difference in the start-up performance between PHPs with different adiabatic lengths was smaller. Comparison of Figure 11 and Figure 12 shows that at the heat input of 40 W, the differences in the start-up time between PHPs with different adiabatic section lengths were significantly smaller than that at the heat input of 20 W. Therefore, as the heat input increased, the influence of the adiabatic section length on the start-up performance decreased.
Figure 11.
The temperature fluctuation of the PHP at 20 W with different lengths of the adiabatic section: (a) 60 mm, (b) 120 mm, (c) 180 mm, and (d) 240 mm.

Figure 12.
The temperature fluctuation of the PHP at 40 W with different lengths of the adiabatic section: (a) 60 mm, (b) 120 mm, (c) 180 mm, and (d) 240 mm.
3.3.2. Effect of the Adiabatic Section Length on the Thermal Performance of the PHP
To compare the heat transfer performance of the PHP with different lengths of the adiabatic section, the thermal resistances of the PHP with different lengths of the adiabatic section are presented in Figure 13. It can be seen that when the heat input was low, the PHP with shorter adiabatic length showed lower thermal resistance. As the heat input increased, the thermal resistance of the PHP with longer adiabatic length became smaller than that of the PHP with shorter adiabatic length. The reason for this was as follows: When the length of the adiabatic section was small, the start-up performance of the PHP with shorter adiabatic section length was significantly better than that of the PHP with longer adiabatic section length. Thus, the thermal resistance of the PHP with 60 mm adiabatic section length showed the lowest thermal resistance at the heat input of 20 W. However, when the heat input increased, the start-up performance of the PHP was improved, and the effect of the adiabatic length on the start-up performance reduced. In addition, when the adiabatic length of the PHP increased, the mass of liquid slugs increased at the same filling ratio. With more liquid slugs in the PHP, the evaporation section of the PHP was more easily wetted by the liquid slugs, and the convective heat transfer was enhanced. Thus, in the calculation range of this work, the heat transfer performance of the PHP with longer adiabatic section length was better at high heat input.
Figure 13.
The thermal resistance of the PHP varied with the heat input.
4. Conclusions
A numerical model of the PHP with different adiabatic lengths was constructed. Based on the numerical results, the flow characteristics, the heat transfer performance, and the effects of the adiabatic length were analyzed. The conclusions of this work are as follows:
- (1)
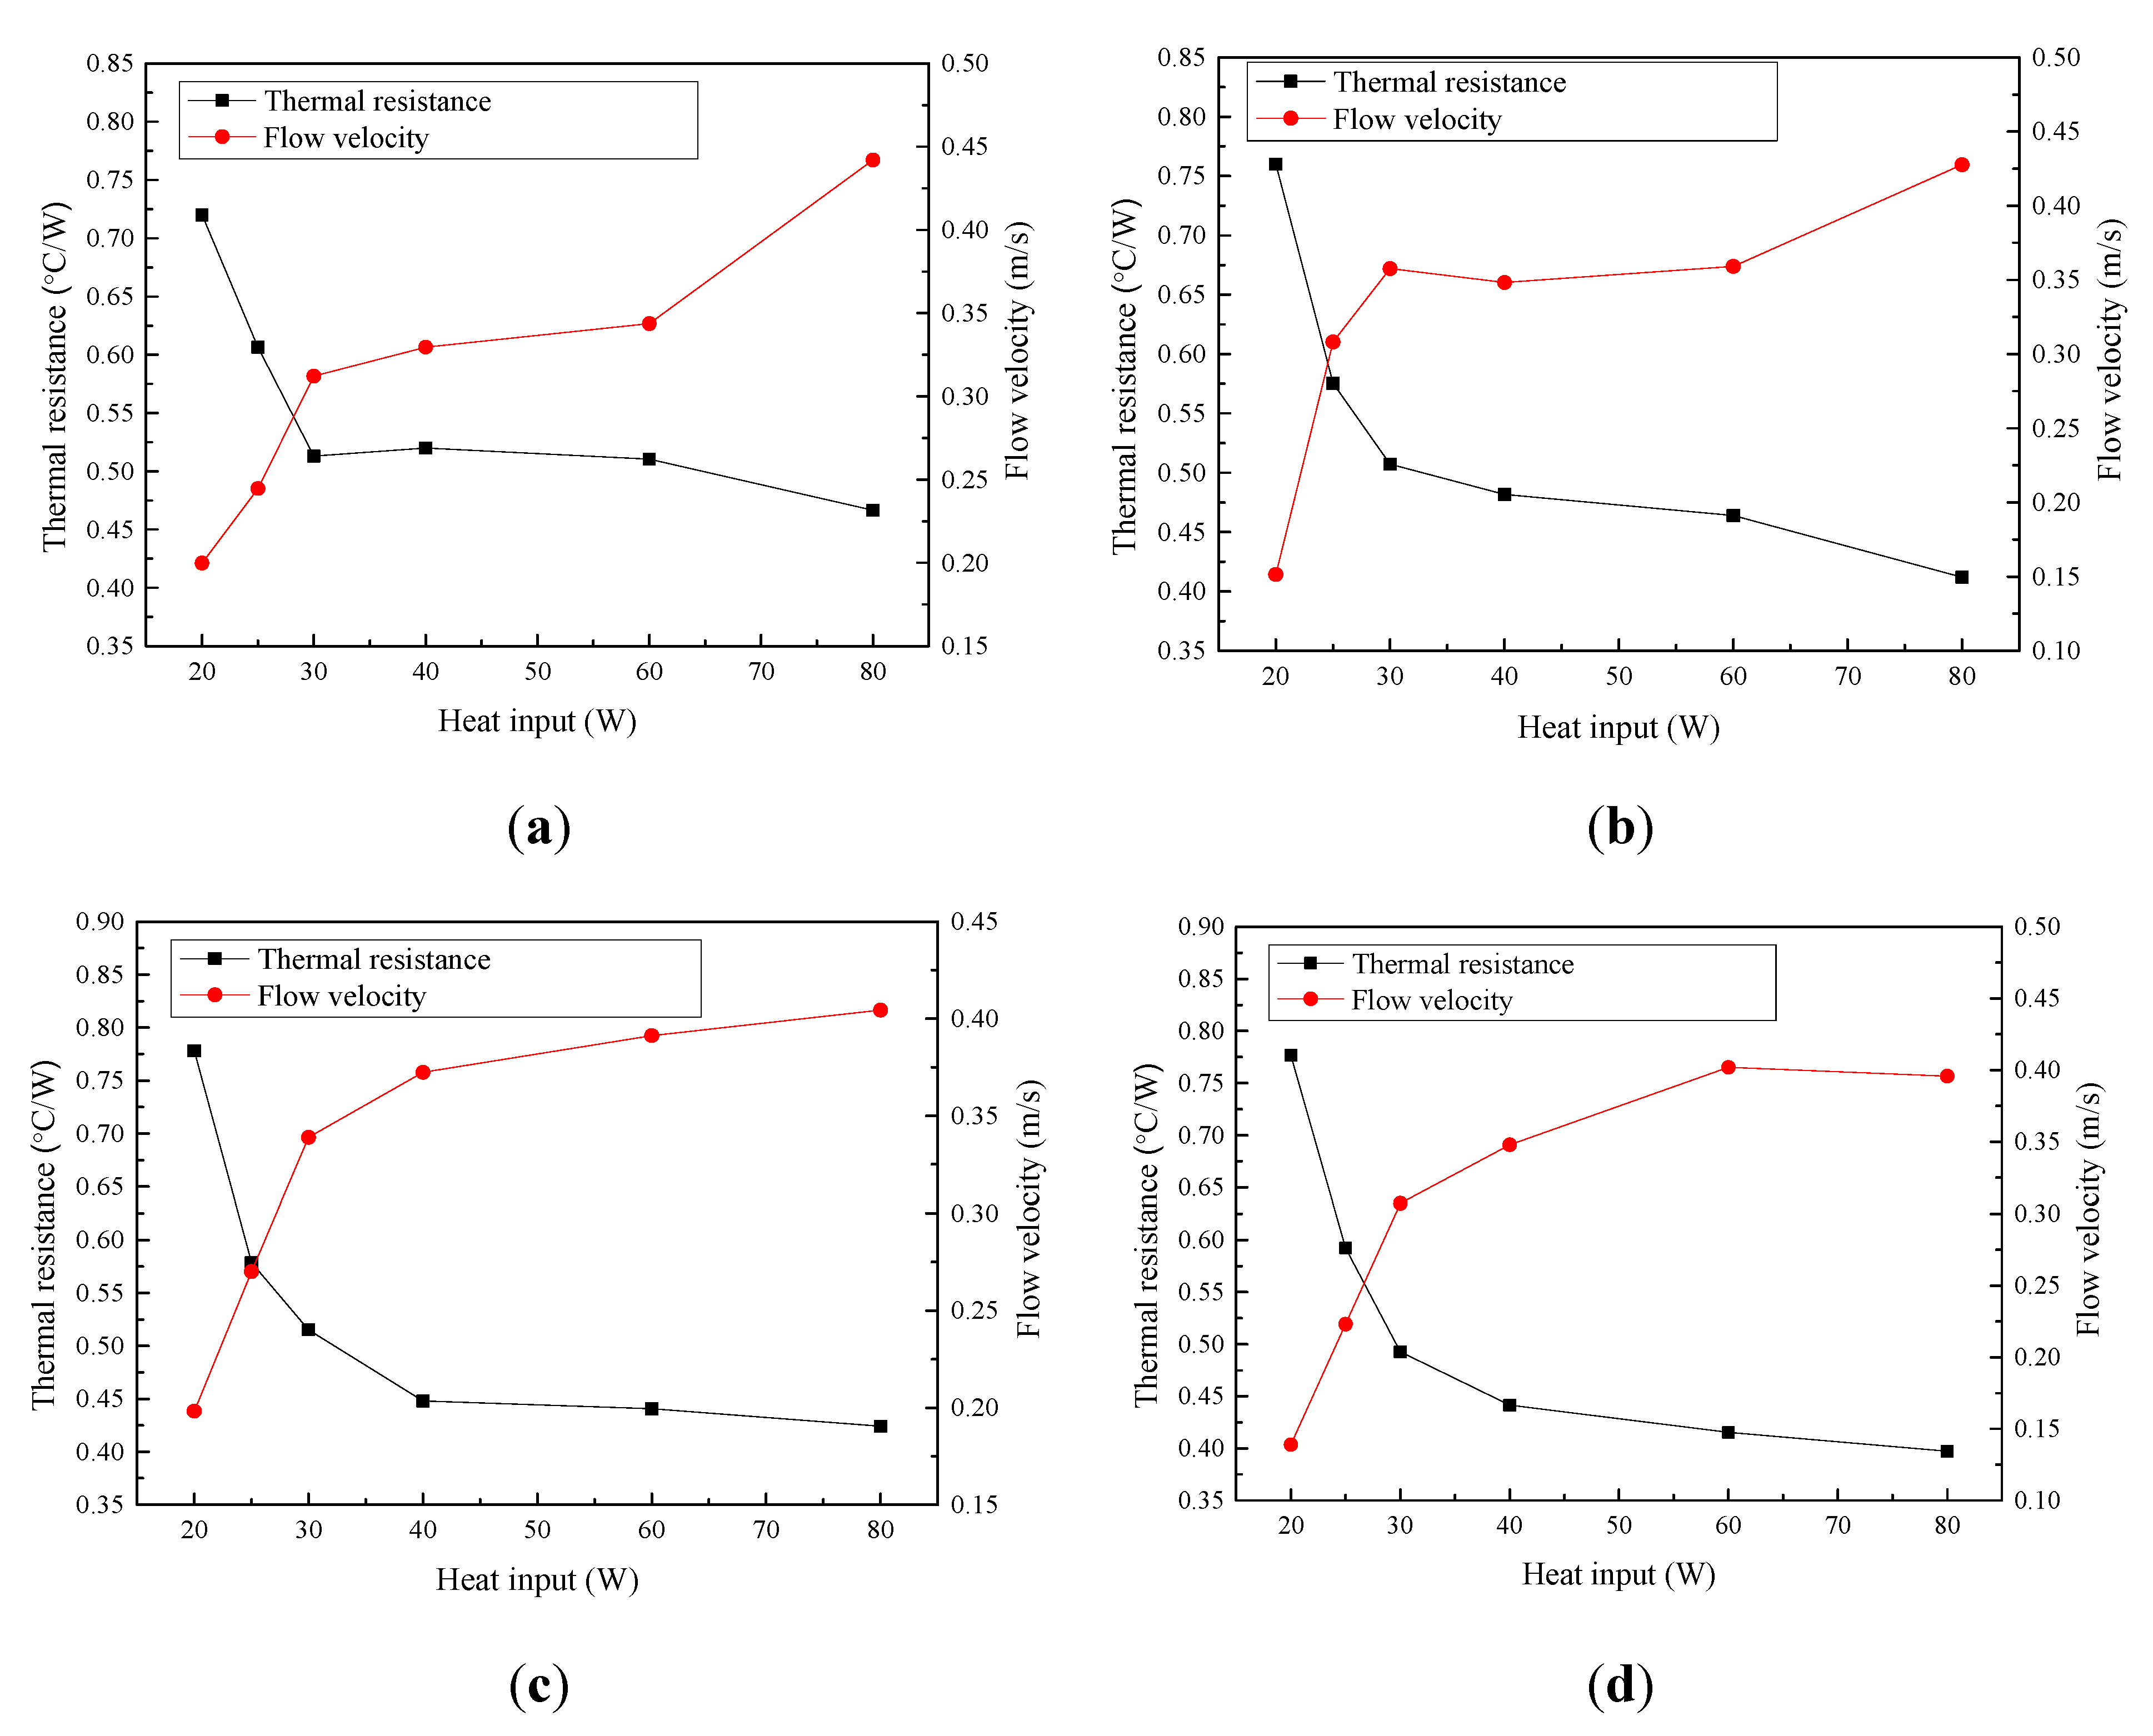
- According to the numerical results, the momentum of the liquid slugs in the PHP increased as the heat input increased. The mean velocity of the liquid slugs in the PHP was in the range of 0.139–0.428 m/s for the heat inputs in the range of 20–80 W, which was consistent with the previous experimental results.
- (2)
- It was found that at low heat inputs, the wall temperature of the PHP showed higher oscillation amplitude and lower oscillation frequency than that of the PHP at high heat input, because it was more difficult to start the PHP at low heat inputs. Moreover, the start-up time of the PHP reduced as the heat input increased.
- (3)
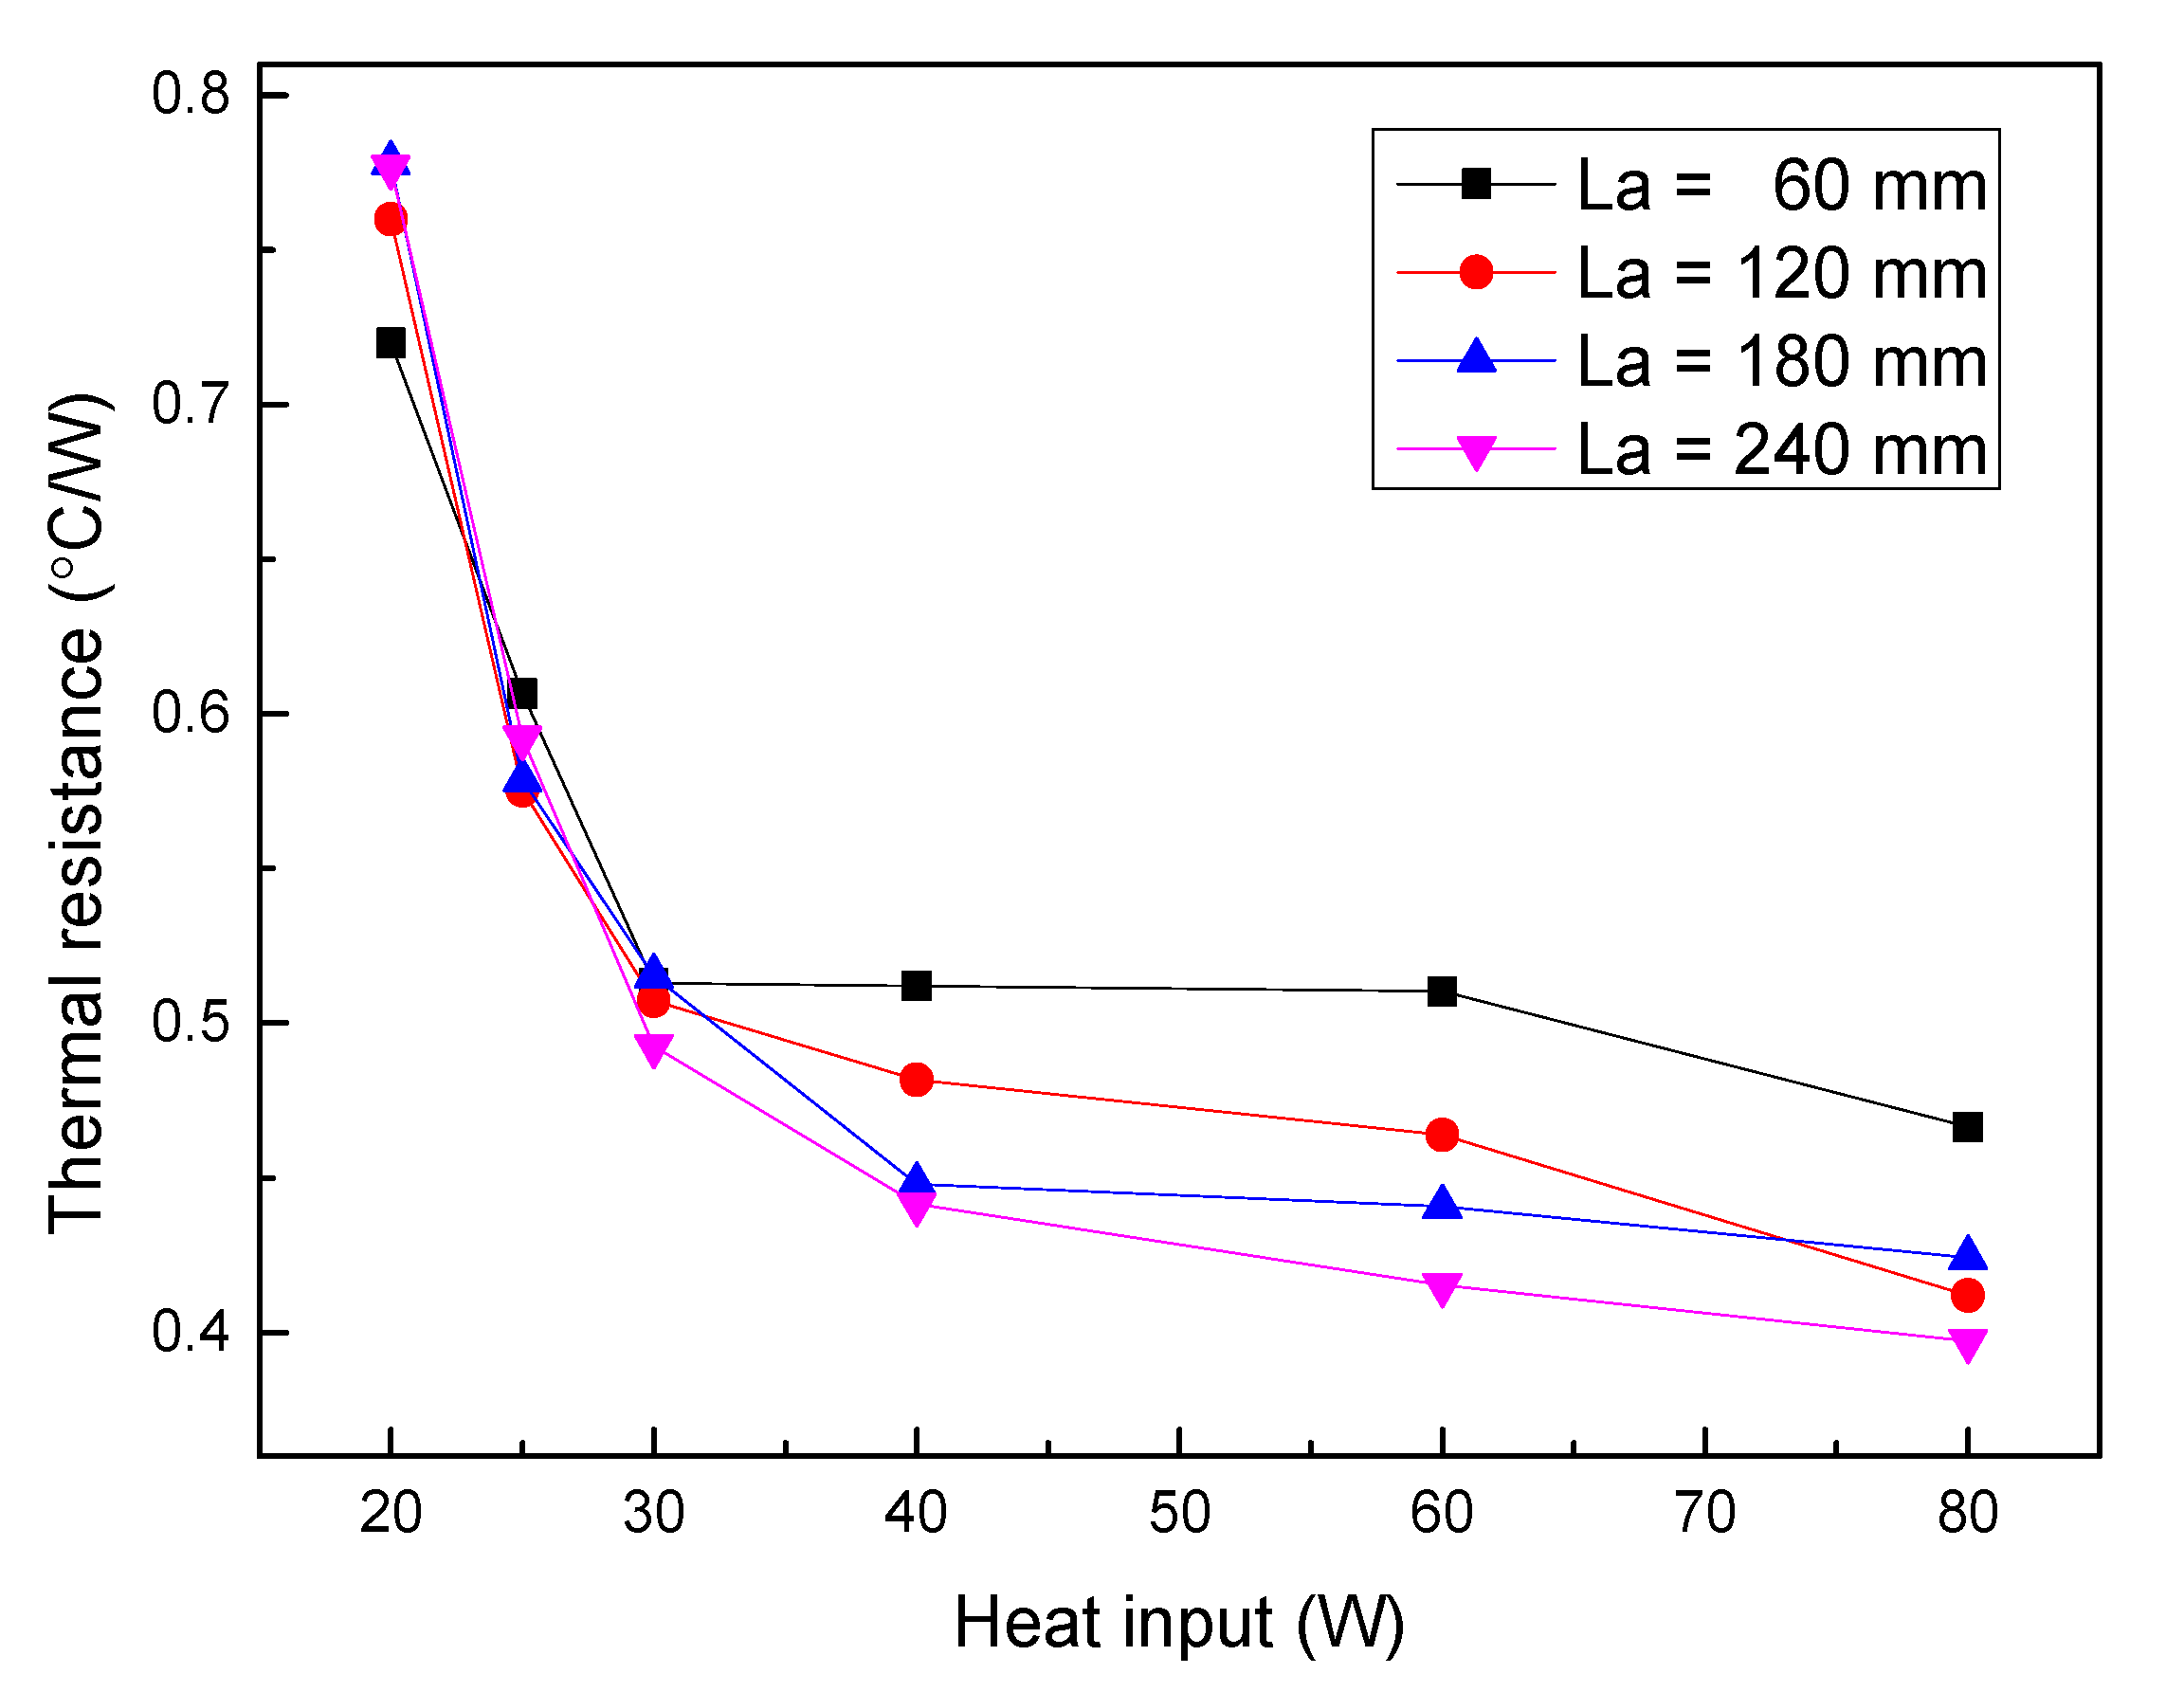
- The start-up performance of the PHP was better with a shorter adiabatic section length. The thermal resistances of the PHP with different adiabatic section lengths were calculated. The PHP with 60 mm adiabatic section length showed the lowest thermal resistance among the PHPs at the heat input of 20 W, whereas the PHP with longer adiabatic section length presented lower thermal resistance at high heat input (≥25 W).
Author Contributions
Conceptualization, K.B.; Formal analysis, K.B. and Y.Z.; Investigation, K.B., Y.Z. and X.W.; Methodology, K.B.; Resources, X.G., Y.X. and X.H.; Supervision, X.G., Y.X. and X.H.; Writing—original draft, K.B.; Writing—review & editing, X.H. All authors have read and agreed to the published version of the manuscript.
Funding
This research was supported by the fund of the State Key Laboratory of Technologies in Space Cryogenic Propellants (SKLTSCP202008).
Data Availability Statement
All the data analyzed in the article have been given.
Acknowledgments
This work was supported by the fund of the State Key Laboratory of Technologies in Space Cryogenic Propellants (SKLTSCP202008).
Conflicts of Interest
The authors declare no conflict of interest.
Nomenclature
| m | mass (kg) | Greek symbols | |
| A | area (m2) | ||
| Bo | boiling number | θ | contact angle (°) |
| C1 | condensation temperature monitoring point 1 | λ | thermal conductivity (W m−1 K−1) |
| C2 | condensation temperature monitoring point 2 | μ | viscosity (Pa s) |
| Ca | capillary number | ρ | density (kg m−3) |
| cp | heat capacity (J kg−1 K−1) | σ | surface tension (N m−1) |
| d | diameter (m) | ||
| E1 | evaporation temperature monitoring point 1 | Subscripts | |
| E2 | evaporation temperature monitoring point 2 | ||
| F | force (N) | a | advancing |
| fτ | friction factor | c | cooling water; cross section |
| g | gravity acceleration (m s−2) | cond | condensation |
| h | heat transfer coefficient | e | equilibrium |
| hfg | latent heat (J kg−1) | ex | external |
| K | loss coefficient | f | friction |
| Le | Length (m) | g | gravity |
| Nu | Nusselt number | i | inner; i th vapor plug |
| p | pressure (Pa) | l | liquid |
| Pr | Prantal number | nb | nucleate boiling |
| Q | heat (J) | o | outer |
| R | radius (m) | p | pressure |
| Re | Renolds number | r | receding |
| Rg | gas constant (J kg−1 K−1) | sat | saturation |
| T | temperature (°C) | v | vapor |
| u | velocity (m s−1) | w | wall |
| U | internal energy (J) | wf | wall to fluid |
| V | volume (m3) | ||
| W | work (J) | ||
| x | quality of vapor-liquid mixture |
References
- Han, X.; Wang, X.; Zheng, H.; Xu, X.; Chen, G. Review of the development of pulsating heat pipe for heat dissipation. Renew. Sustain. Energy Rev. 2016, 59, 692–709. [Google Scholar] [CrossRef]
- Wang, X.; Li, B.; Yan, Y.; Gao, N.; Chen, G. Predicting of thermal resistances of closed vertical meandering pulsating heat pipe using artificial neural network model. Appl. Therm. Eng. 2019, 149, 1134–1141. [Google Scholar] [CrossRef]
- Wang, X.; Yan, Y.; Meng, X.; Chen, G. A general method to predict the performance of closed pulsating heat pipe by artificial neural network. Appl. Therm. Eng. 2019, 157, 113761. [Google Scholar] [CrossRef]
- Pouryoussefi, S.; Zhang, Y. Analysis of chaotic flow in a 2D multi-turn closed-loop pulsating heat pipe. Appl. Therm. Eng. 2017, 126, 1069–1076. [Google Scholar] [CrossRef] [Green Version]
- Li, Q.; Wang, C.; Wang, Y.; Wang, Z.; Li, H.; Lian, C. Study on the effect of the adiabatic section parameters on the performance of pulsating heat pipes. Appl. Therm. Eng. 2020, 180, 115813. [Google Scholar] [CrossRef]
- Mameli, M.; Marengo, M.; Zinna, S. Numerical model of a multi-turn Closed Loop Pulsating Heat Pipe: Effects of the local pressure losses due to meanderings. Int. J. Heat Mass Transf. 2012, 55, 1036–1047. [Google Scholar] [CrossRef]
- Mameli, M.; Marengo, M.; Zinna, S. Thermal Simulation of a Pulsating Heat Pipe: Effects of Different Liquid Properties on a Simple Geometry. Heat Transf. Eng. 2012, 33, 1177–1187. [Google Scholar] [CrossRef]
- Mameli, M.; Marengo, M.; Zinna, S. Numerical Investigation of the Effects of Orientation and Gravity in a Closed Loop Pulsating Heat Pipe. Microgravity-Sci. Technol. 2012, 24, 79–92. [Google Scholar] [CrossRef]
- Senjaya, R.; Inoue, T. Oscillating heat pipe simulation considering bubble generation Part I: Presentation of the model and effects of a bubble generation. Int. J. Heat Mass Transf. 2013, 60, 816–824. [Google Scholar] [CrossRef]
- Senjaya, R.; Inoue, T. Oscillating heat pipe simulation considering bubble generation Part II: Effects of fitting and design parameters. Int. J. Heat Mass Transf. 2013, 60, 825–835. [Google Scholar] [CrossRef]
- Manzoni, M.; Mameli, M.; de Falco, C.; Araneo, L.; Filippeschi, S.; Marengo, M. Advanced numerical method for a thermally induced slug flow: Application to a capillary closed loop pulsating heat pipe. Int. J. Numer. Methods Fluids 2016, 82, 375–397. [Google Scholar] [CrossRef]
- Manzoni, M.; Mameli, M.; de Falco, C.; Araneo, L.; Filippeschi, S.; Marengo, M. Non equilibrium lumped parameter model for Pulsating Heat Pipes: Validation in normal and hyper-gravity conditions. Int. J. Heat Mass Transf. 2016, 97, 473–485. [Google Scholar] [CrossRef]
- Bae, J.; Lee, S.Y.; Kim, S.J. Numerical investigation of effect of film dynamics on fluid motion and thermal performance in pulsating heat pipes. Energy Convers. Manag. 2017, 151, 296–310. [Google Scholar] [CrossRef]
- Daimaru, T.; Yoshida, S.; Nagai, H. Study on thermal cycle in oscillating heat pipes by numerical analysis. Appl. Therm. Eng. 2017, 113, 1219–1227. [Google Scholar] [CrossRef]
- Noh, H.Y.; Kim, S.J. Numerical simulation of pulsating heat pipes: Parametric investigation and thermal optimization. Energy Convers. Manag. 2020, 203, 112237. [Google Scholar] [CrossRef]
- Zhao, J.; Wu, C.; Rao, Z. Numerical study on heat transfer enhancement of closed loop oscillating heat pipe through active incentive method. Int. Commun. Heat Mass Transf. 2020, 115, 104612. [Google Scholar] [CrossRef]
- Xing, M.; Wang, R.; Yu, J. The impact of gravity on the performance of pulsating heat pipe using surfactant solution. Int. J. Heat Mass Transf. 2020, 151, 119466. [Google Scholar] [CrossRef]
- Bao, K.; Wang, X.; Fang, Y.; Ji, X.; Han, X.; Chen, G. Effects of the surfactant solution on the performance of the pulsating heat pipe. Appl. Therm. Eng. 2020, 178, 115678. [Google Scholar] [CrossRef]
- Qu, J.; Wang, Q.; Li, C.; Han, X.; He, Z. A simple model for Taylor flow induced contact angle hysteresis and capillary pressure inside mini/micro-scale capillary tubes. Int. J. Heat Mass Transf. 2014, 78, 1004–1007. [Google Scholar] [CrossRef]
- Xue, Z.H.; Qu, W. Experimental and theoretical research on a ammonia pulsating heat pipe: New full visualization of flow pattern and operating mechanism study. Int. J. Heat Mass Transf. 2017, 106, 149–166. [Google Scholar] [CrossRef] [Green Version]
- Bao, K.; Fang, Y.; Xu, C.; Ji, X.; Qiao, X.; Han, X.; Chen, G. Visual Study on the Effects of SiO2/water and CuO/water Nanofluids on the Start-Up and Heat Transfer Performance of Pulsating Heat Pipe; International Congress of Refrigeration: Montreal, QC, Canada, 2019. [Google Scholar]
- Czajkowski, C.; Nowak, A.I.; Błasiak, P.; Ochman, A.; Pietrowicz, S. Experimental study on a large scale pulsating heat pipe operating at high heat loads, different adiabatic lengths and various filling ratios of acetone, ethanol, and water. Appl. Therm. Eng. 2020, 165, 114534. [Google Scholar] [CrossRef]
- Davis, E.J.; Anderson, G.H. The incipience of nucleate boiling in forced convection flow. AIChE J. 1966, 12, 774–780. [Google Scholar] [CrossRef]
- Whalley, P.B. Boiling Condensation, and Gas-Liquid Flow; Oxford Clarendon Press: New York, NY, USA, 1987; p. 149. [Google Scholar]
- Gungor, K.; Winterton, R. A general correlation for flow boiling in tubes and annuli. Int. J. Heat Mass Transf. 1986, 29, 351–358. [Google Scholar] [CrossRef]
- Van Carey, P. Liquid-Vapor Phase-Change Phenomena; Hemisphere Publishing Corporation: Washington, DC, USA; Philadelphia, PA, USA; London, UK, 1992; pp. 327–328. [Google Scholar]
- Theodore, L.B.; Adrienne, S.L.; Incropera, F.P.; Dewitt, D.P. Fundamentals of Heat and Mass Transfer, 7th ed.; John Wiley& Sons: Hoboken, NJ, USA, 2008; p. 4. [Google Scholar]
- Dobson, M.K.; Chato, J.C. Condensation in Smooth Horizontal Tubes. J. Heat Transf. 1998, 120, 193–213. [Google Scholar] [CrossRef]
- Khandekar, S. Microscale Thermophysical Engineering. Microscale Thermophys. Eng. 2002, 6, 303–317. [Google Scholar] [CrossRef]
- Zhiqing, Y.; Juan, H.; Chaoyi, P.; Yu, C.; Xian, W.; Menglei, W.; Jiping, B. Preparation of a superhydrophobic copper surface and its anti-icing property. J. Funct. Mater. 2016, 47, 13–17. [Google Scholar]
- Pachghare, P.R.; Mahalle, A.M. Thermo-hydrodynamics of closed loop pulsating heat pipe: An experimental study. J. Mech. Sci. Technol. 2014, 28, 3387–3394. [Google Scholar] [CrossRef]
Publisher’s Note: MDPI stays neutral with regard to jurisdictional claims in published maps and institutional affiliations All authors have read and agreed to the published version of the manuscript.. |
© 2021 by the authors. Licensee MDPI, Basel, Switzerland. This article is an open access article distributed under the terms and conditions of the Creative Commons Attribution (CC BY) license (https://creativecommons.org/licenses/by/4.0/).