Technical Note

Effect of Wetting Conditions on the In Situ Density of Soil Using the Sand-Cone Method

1
Department of Civil Engineering, Kyungpook National University, 80 Daehakro, Bukgu, Daegu 41566, Korea
2
Department of Civil Engineering, Daelim Construction Company, 14 Mirae-ro, Namdonggu, Incheon 21556, Korea
3
School of Architecture, Civil, Environment and Energy Engineering, Kyungpook National University, 80 Daehakro, Bukgu, Daegu 41566, Korea
*
Author to whom correspondence should be addressed.
Appl. Sci. 2021, 11(2), 718; https://doi.org/10.3390/app11020718
Submission received: 8 December 2020 / Revised: 7 January 2021 / Accepted: 10 January 2021 / Published: 13 January 2021

Abstract

:
The sand-cone method is commonly used to measure the in situ density of compacted soils. While determining field density with this method, differences in the sand-filling process between the test hole and the calibration container can cause errors. The differences can result from various in situ conditions such as the shape and size of the test hole and the moisture conditions of the filling sand and test ground. Temporary rainfall can increase the moisture content of both in situ soils and filling sand. This study examined the effect of wetting conditions on the accuracy of the sand-cone method in a laboratory. Compacted soils with different water contents (2–16%) were prepared in a small circular container in the laboratory, and the sand-filling process was simulated for cylindrical, conical, and roof-shaped test holes with depths of 10 and 15 cm. As the water content of the compacted soils increased, the sand-cone method underestimated the volume of sand accumulated in the test holes by up to 20%, resulting in the calculated density being overestimated by an identical amount. Slightly moist sand was poured into artificial test holes. When the water content of the filling sand was below 1%, no significant error was observed in the calculated volume.

1. Introduction

Various field-density testing methods have been developed to determine the in situ density of compacted soils. They include the sand-cone, rubber-balloon, and nuclear methods. These methods are of the utmost importance to ensure that the specified dry density of soil is achieved during compaction. The method is usually chosen based on several factors that are considered important during construction, including the availability of specialized equipment and material, logistics, the complexity of the method, and the time required to perform the test [1]. The sand-cone is the most commonly used method, since it is relatively simple and inexpensive compared to other methods.
Park [2] showed that errors in the sand-cone method could be minimized by preparing a test hole with a flat base and a depth of at least 20 cm, as well as by using rounded sand with a coefficient of uniformity (Cu) of less than 1.5 and mean grain size (D50) of approximately 0.5 mm. He used artificial test holes of various shapes, which were possibly made in the in-situ test holes. During field compaction, temporary rainfall or an increase in the groundwater level can increase the moisture content of the compacted ground. However, the wetness of the field ground has not been considered in previous studies. Furthermore, though dry sand must be used to fill the test holes, the stored dry sand can be wetted by rain or atmospheric humidity, even if it has been dried before, resulting in increased moisture content. Therefore, this study examined the effects of wetting conditions of the ground and the moist filling sand on the dry density, as determined using the sand-cone method in a laboratory. A small model of the ground containing in situ soil with different water content was used for simulating moist ground conditions in the laboratory. Different proportions of kaolinite were added to the in situ soil to simulate the various soils. In addition, an artificial, cylindrical test hole with a known volume was used to determine the effect of moist sand filling.

2. Density Tests Using Sand-Cone Method

2.1. Considerations in Sand-Cone Method

The calculations involved in the sand-cone method are described in ASTM D 1556-07 [3], BS 1377-9 [4], and KS F 2311 [5]. The volume of the excavated hole, V, can be determined using the following expression:
V = M 1 ρ d ( s a n d )
where M1 is the mass dry sand used for filling the hole and ρd(sand) is the dry density of the sand used for the calibration. A calibration container has a known volume and a dry and smooth inner surface.
The extent to which sand is packed or the test hole is filled can be influenced by the wetness of the test hole and filling sand, decreasing the reliability of the determined in situ density. Depending on the wetness of the inner surface of the hole, sand grains may stick to the surface and to each other, resulting in the formation of voids and the underestimation of the hole volume, as shown in Figure 1 and Figure 2.
Figure 1 presents a schematic of the sand-filling process in test holes with dry and wet surfaces, and Figure 2 shows photographs of real sand-filled dry- and wet-compacted grounds and hole surfaces after the removal of the sand. The soils had water contents of 2% and 16%, respectively, and a dry unit weight (density) of 16.59 kN/m3 (1.69 g/cm3). Detailed soil properties are presented in the test-procedure section, and fill sand was painted in red to show the color difference from the ground. Thus, the difference in sand-filling processes between dry and wet test-hole surfaces was examined. In addition, the use of moist sand to fill a test hole may also cause sand grains to stick to the hole surface and each other. Therefore, these two factors (moist compacted ground and moist filling sand) were investigated in this study.

2.2. Test Sand and Calibration

The sand used to fill the test hole has to adhere to the standards. ASTM D 1556-07 [3] recommends the use of sand with a Cu less than 2.0, a maximum particle size smaller than 2 mm, and that less than 3% of the weight pass through a 0.25 mm sieve. KS F 2311 [5] specifies the use of sand that can pass through a 2-mm sieve but is retained on a 0.075-mm sieve. Jumunjin sand was used in this study, and the results of the sieve test and its particle-size distribution curve are shown in Table 1 and Figure 3, respectively. The physical properties of the sand are shown in Table 2. The specific gravity (Gs) was 2.65, and the diameters through which 10%, 30%, and 60% of the particles passed (D10, D30, and D60) were 0.31 mm, 0.45 mm, and 0.62 mm, respectively. The Cu was 1.98, and the coefficient of curvature (Cc) was 1.05. Based on the results, the sand was classified as poorly-graded (SP) according to the Unified Soil Classification System (USCS). Therefore, Jumunjin sand satisfied the specifications of both ASTM and KS.
Before the sand-cone test, the dry density of the test sand had to be determined. This determination process is known as calibration. The dry density of the test sand was calculated in accordance with ASTM D 1556-07 [3] by using a compaction mold with a diameter of 15 cm, a height of 17.5 cm, and a volume of 3093 cm3. The dry unit weight (density) of the Jumunjin sand used in this study was calculated to be 13.40 kN/m3 (1.37 g/cm3).

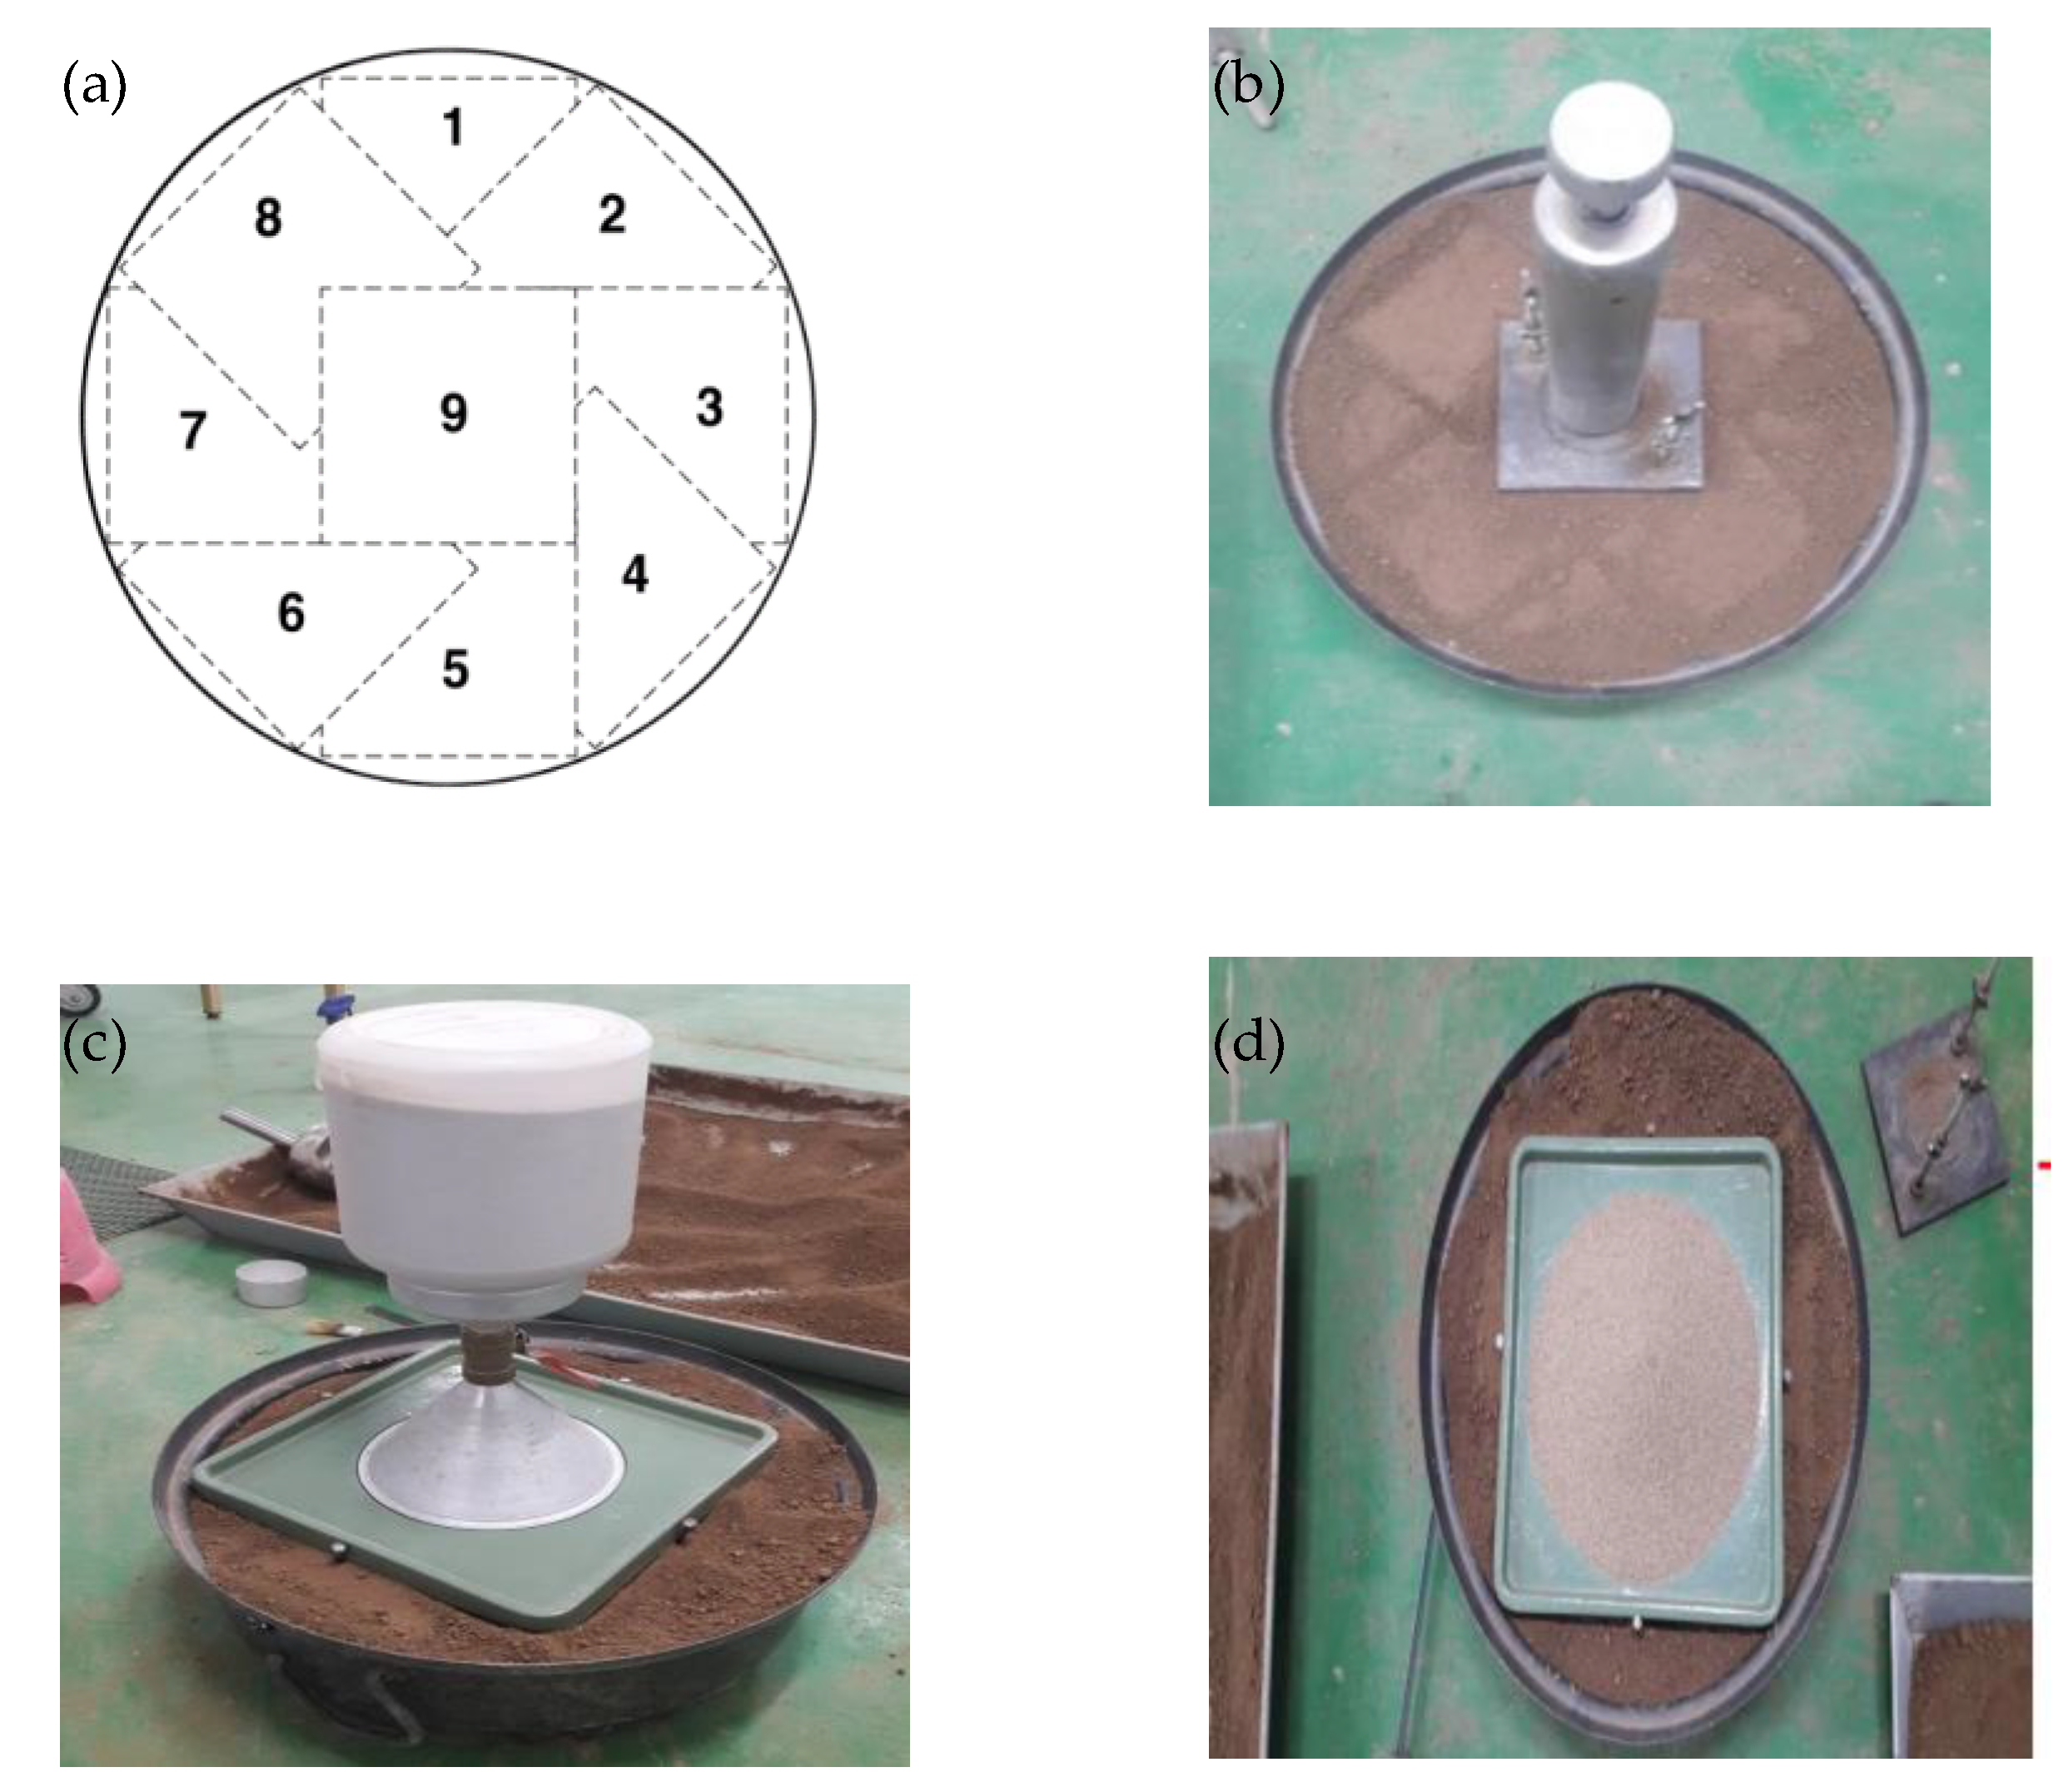
2.3. Artificial Ground and Test Procedure

To examine the effect of a moist ground on the sand-cone method, artificial test holes with three shapes (cylindrical, conical, and roof-shaped) and with depths of 10 and 15 cm were used. Detailed sizes and shapes of the holes are shown in Figure 4. The soil was obtained from a construction site located at Youngchun, Kyungbuk Province, Korea, and compacted into a test vessel with a diameter of 41.5 cm and a height of 17 cm. The soil properties are shown in Table 3. The soil was thoroughly mixed with a specific amount of water (2, 7, 12, and 16% of the weight of the soil). The wetness of a compacted ground was simulated based on the field conditions of road and railway embankments in Korea; wetness levels of 2, 7, 12, and 16% were defined as slightly wet, wet, moderately wet, and completely wet, respectively. Subsequently, the moist soil was compacted in a vessel whose weight and volume were known. As shown in Figure 5a,b, a plate with the dimensions 14.5 cm × 14.5 cm × 2 cm was placed on the soil, and three-layer compaction was performed using a 2.5-kg rammer, with a drop height of 30 cm and 15 blows per layer. The small rammer was used to compact the areas which were not in contact with the plate, especially the edges. After compaction, the entire test vessel was weighed to determine the bulk density of the compacted soil.
The compacted soil was dug to form the same size hole as the artificial hole. The soil was dug until it fitted into the hole frame by putting the frame into the digging hole. Subsequently, the sand-cone method was used (Figure 5c), and the test hole was filled with the sand (Figure 5d). Meanwhile, kaolinite was mixed with the soil to investigate whether voids due to the sand sticking appeared, regardless of the soil type. The mixture was compacted to make an artificial ground that has the same shape as Figure 2. The kaolinite used in this study was the same kaolinite used by Park and Nong [6], and the liquid limit (LL) and plastic limit (PL) of the kaolinite were 60% and 40%, respectively. It was mixed at a ratio of 0.2, 0.4, 0.6, 0.8, and 1.0 to the soil, and the moisture contents of compacted grounds used were 16% at a ratio of 0.2 and 0.4 and 20% at 0.6, 0.8, and 1.0, respectively.
The effect of moist sand filling was investigated by adding moisture to the test sand. The moisture content was gradually increased to 0.8% of the weight of dry sand. A 10-cm deep cylindrical test hole made of a galvanized iron sheet was used, and its volume was determined using the water-filling method [2]. The sand-cone method was used to determine the mass of the moist sand required to fill the test hole, and the volume and density of the sand were then calculated.

3. Results and Discussion

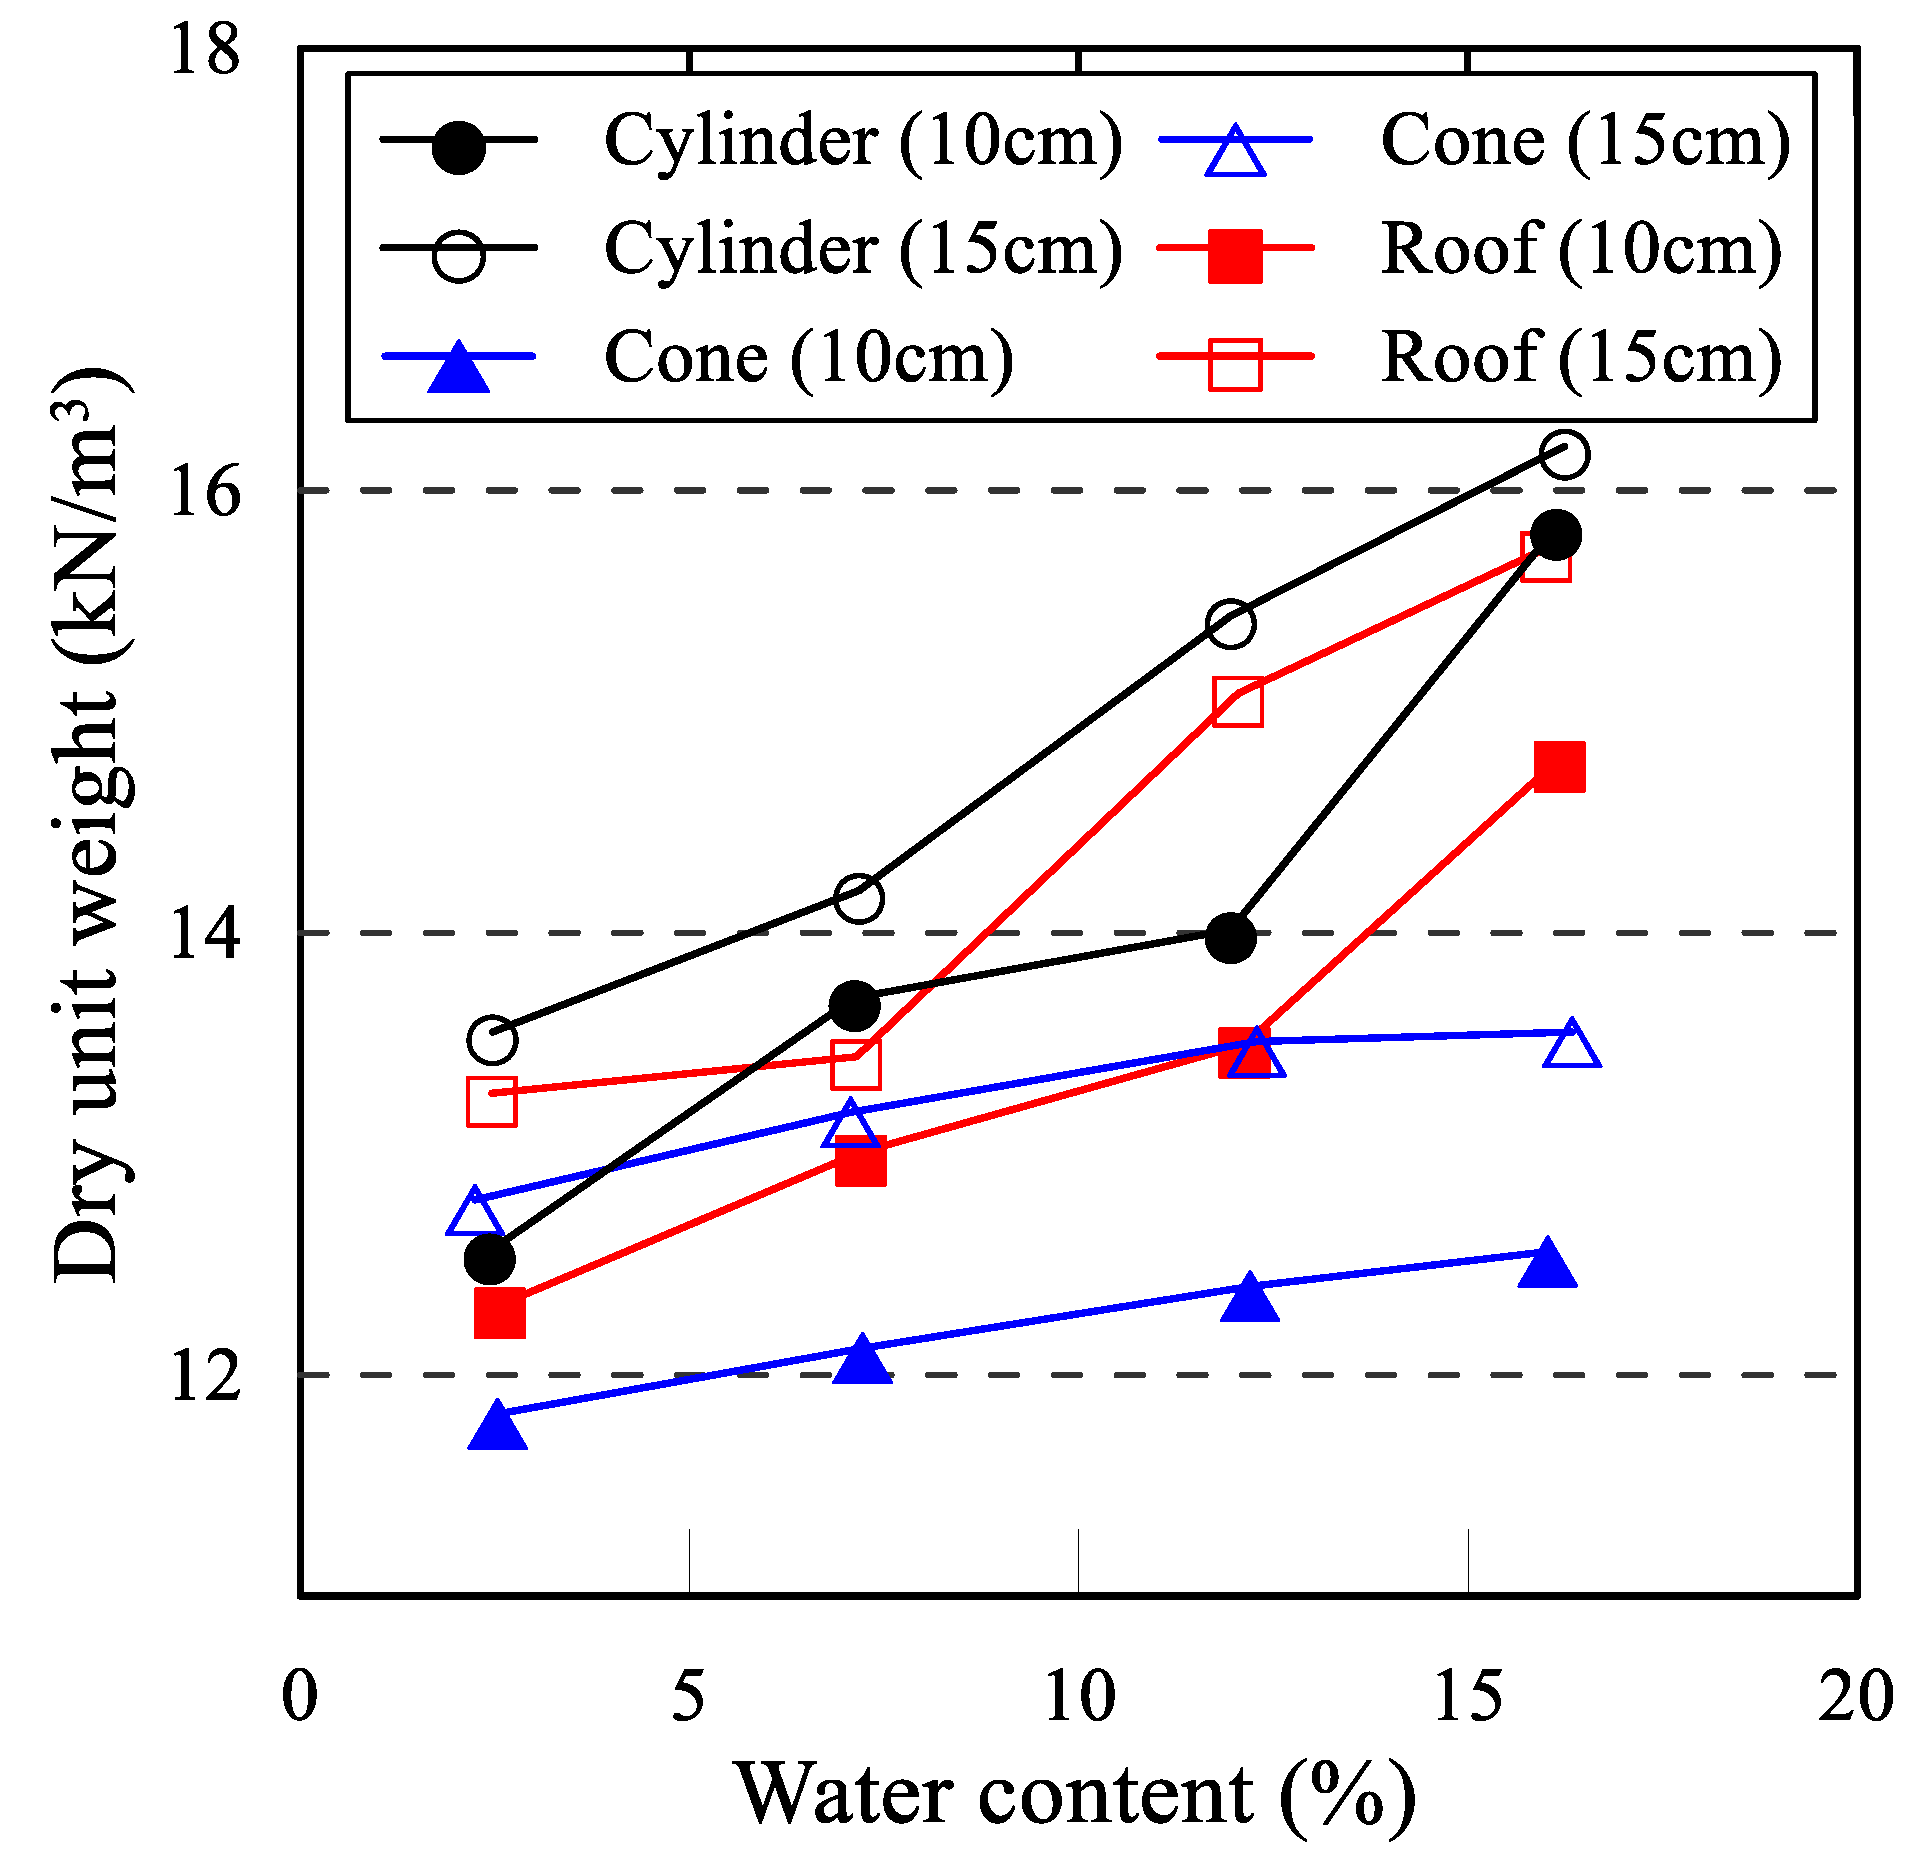
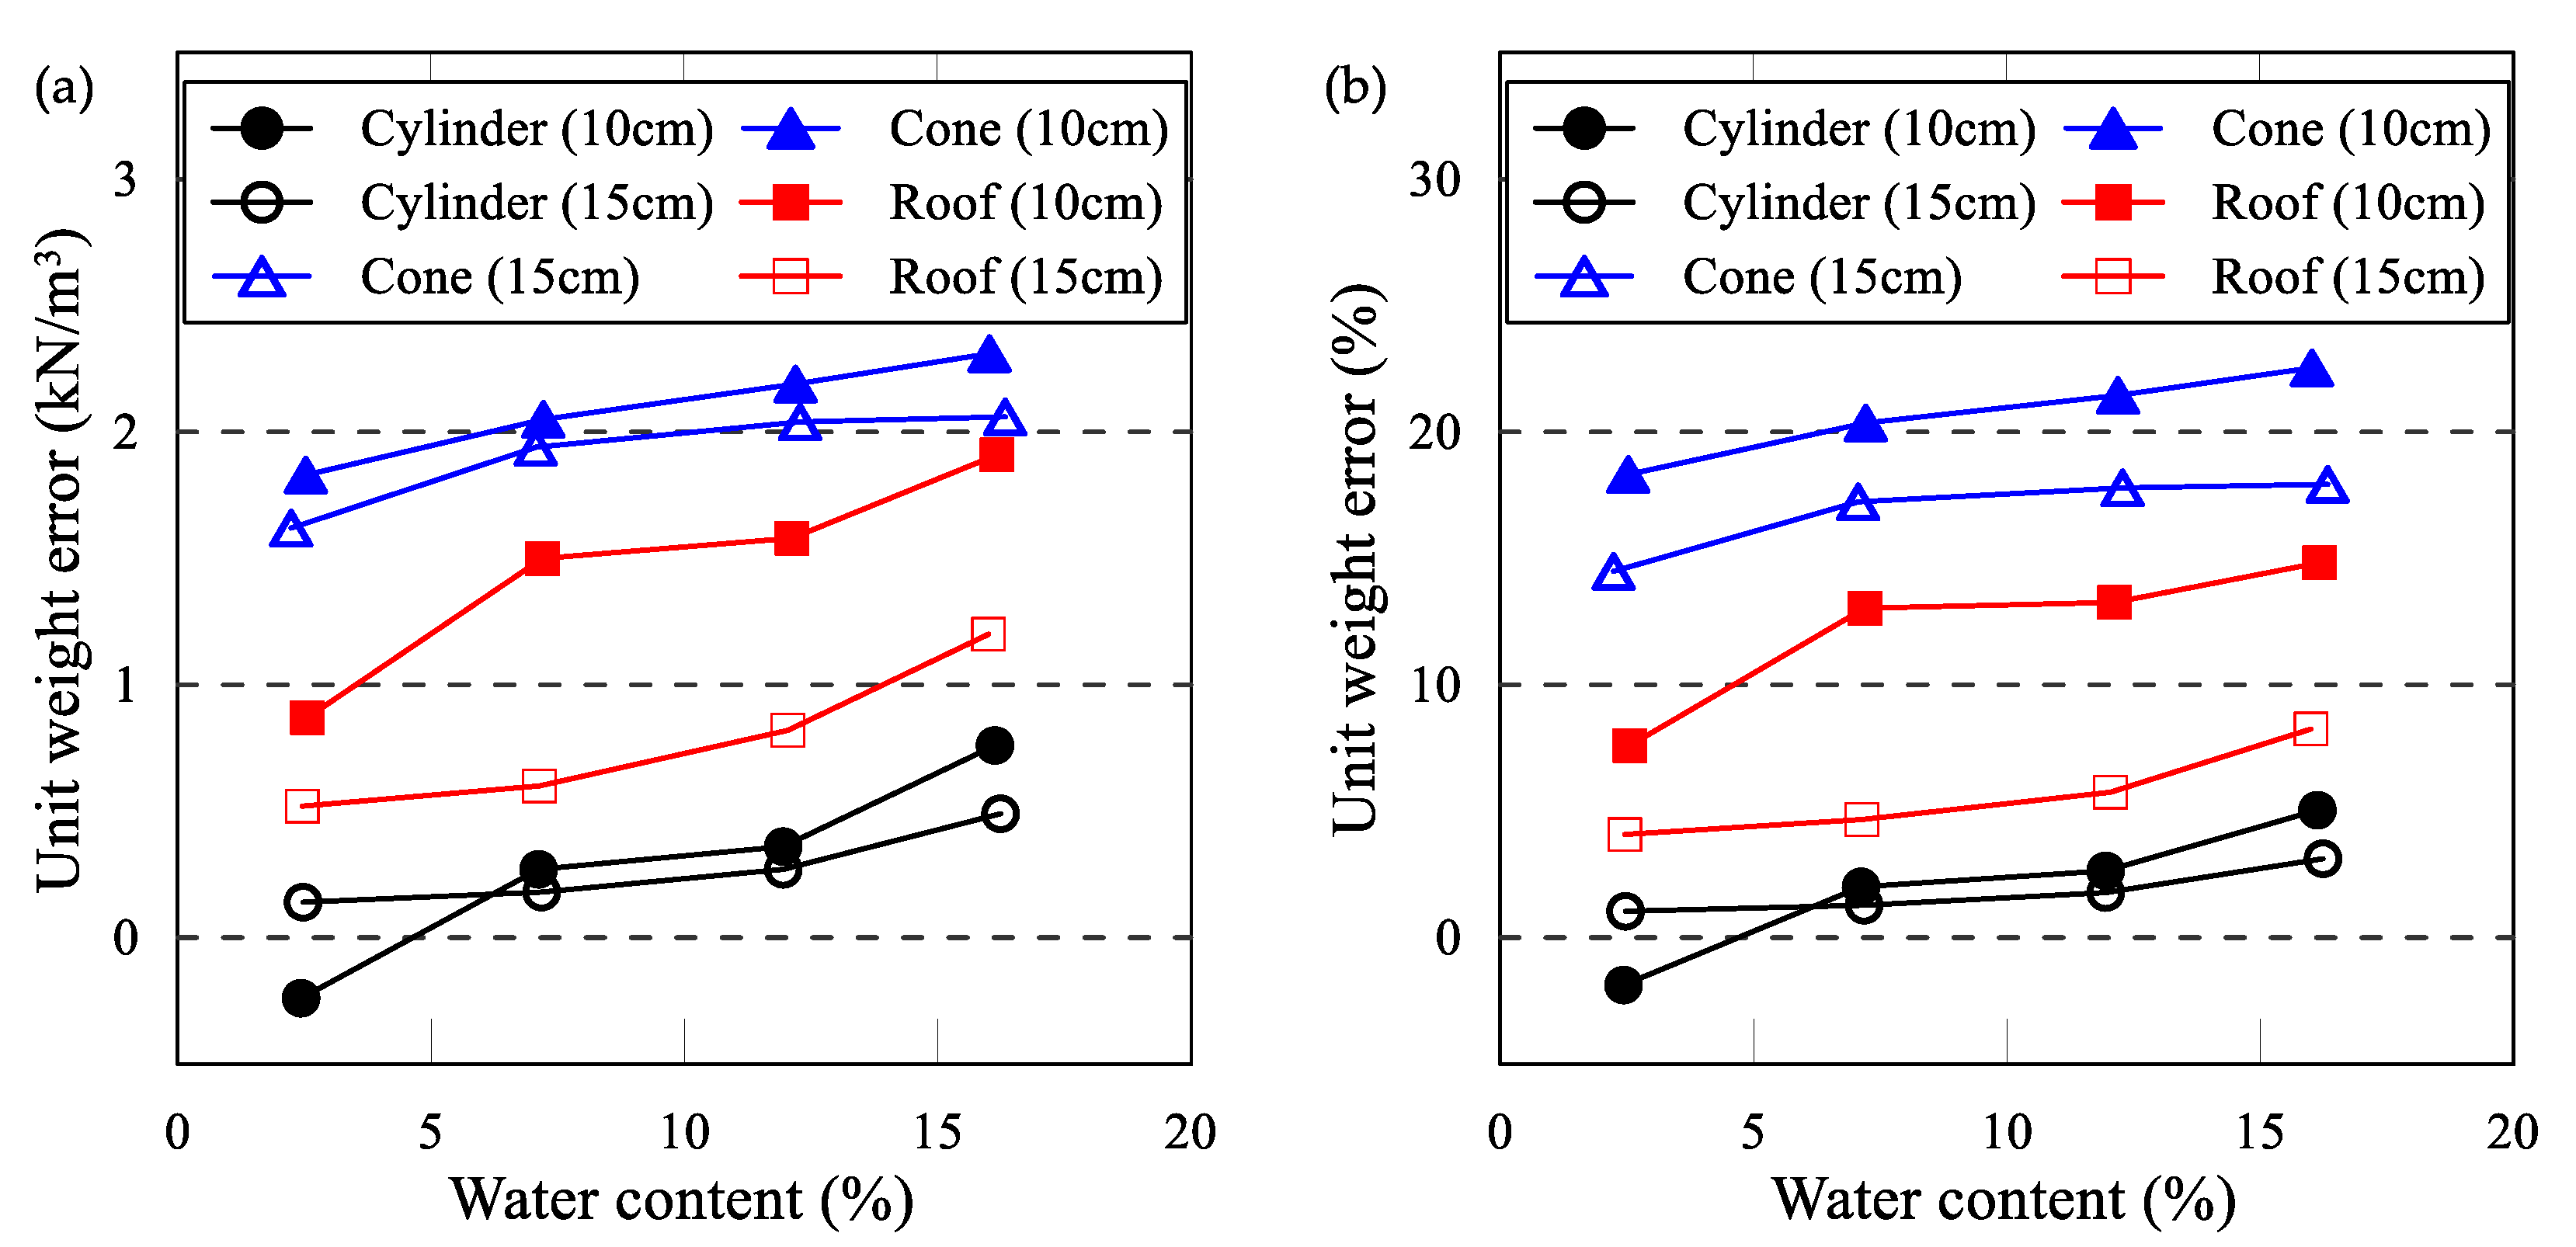
3.1. Effect of Moist Ground

Table 4 summarizes the results of the sand-cone method for four different moist ground conditions. It compares the effect of a moist ground for test holes with different shapes and depths. The exact dry unit weight (γd(exact)) was calculated with the weight and volume of the vessel, which included the compacted soil before digging the artificial hole. The experiment dry unit weight (γd(experiment)) is the result of the sand-cone method. The dry unit weight determined from the sand-cone method (γd(experiment)) increased as the water content of compacted soil increased from 2% to 16%, regardless of the shape and depth of the test hole, as shown in Figure 6. In general, the unit weight of soil increased until the moisture content reached the optimum moisture content (OMC). The increase in the unit weight of soil, as shown in Figure 6, also illustrated this trend.
The variation in the calculated dry unit weight and its error, depending on the water content of the compacted ground, were compared for the different types of holes (Figure 7). As the base shape of the test hole was changed from flat to sharp, and as the moisture content of the compacted soil increased, the error became increasingly severe. As the hole depth increased from 10 to 15 cm, the error generally decreased, regardless of the test-hole shape and the water content in the ground. In particular, the result for the cylindrical test hole with a flat base and a depth of 15 cm under slightly wet conditions (2%) had the lowest error, 1.04%. By contrast, the value for the conical test hole with a sharp base and a depth of 10 cm under fully wet conditions (16%) showed the highest error, i.e., 22.54%. When the density degree of soil was expressed as loose and dense in previous studies [7,8,9], the difference in dry unit weight (density) between loose and dense appeared as 2–3 kN/m3 (0.20–0.31 g/cm3). In this study, the result of the conical test hole, showing the highest dry unit-weight (density) error, showed a difference of 2.31 kN/m3 (0.24 g/cm3), which can cause a very large defect when judging the compaction condition of the soil. On the other hand, the results of the cylindrical test hole with a depth of 15 cm showed a difference of less than 0.491kN/m3 (0.05 g/cm3).
Figure 8 shows several wet, compacted grounds filled with dry colored sand. Similar behavior was observed, regardless of soil types, as shown in Figure 8a–d. Therefore, the field density could be incorrectly evaluated due to the ground wetness. When investigating the dry unit weight with the sand-cone method in the field, the use of a deep hole in a cylindrical shape can minimize the error due to ground wetting.
Additionally, the water content was measured by drying in a microwave oven for 15 min. The measured value was similar to the value measured after drying in an oven for over 24 h. The measurement of soil moisture content using a microwave oven was based on ASTM D 4643-08 [10], which has been reported to yield reliable values. For example, Park et al. [11] also tested various soils (sand, kaolinite, and organic soils) and showed similar results. The microwave oven is also portable and readily available [12].

3.2. Effect of Moist Sand

The presence of high humidity at some sites is unfavorable and can render sand calibration unreliable in density tests involving the sand-cone method [13]. The calculated dry unit weight of moist test sand is presented in Table 5. For the cylindrical artificial test hole, the calculated volume of the test hole decreased as the water content of the sand increased from 0% to 0.8% (Figure 9). With an increase in the soil moisture, a smaller mass of sand filled the test hole because of the bulking of sand, and, therefore, the test-hole volume was underestimated. Moisture creates a thin film around sand particles and causes them to move away from each other, increasing the sand volume. This phenomenon is known as bulking of sand. The percentage of bulking is inversely proportional to the particle size [14]. In addition, the test sand clumped together at moisture content of 1% (and above), thereby rendering the sand calibration difficult. At 1% moisture content, the clumped sand blocked the valve, and the sand did not reach the hole.

4. Conclusions

In this study, the effect of wetting conditions on the determination of the density of compacted soil with the sand-cone method was investigated for a moist ground and moist filling sand. The unit weight of soil was determined in the laboratory by using a small model of the ground. The ground model contained field soil classified as CL and was compacted in a cylindrical container (with a diameter of 41.5 cm and height of 17 cm). The water content of the ground surface varied between 2% and 16%. Furthermore, artificial test holes with cylindrical, conical, and roof shapes, and with depths of 10 and 15 cm, were considered. For these conditions, the test hole volume was determined by the sand-cone method and the dry unit weight was calculated. The results obtained can be summarized as follows:
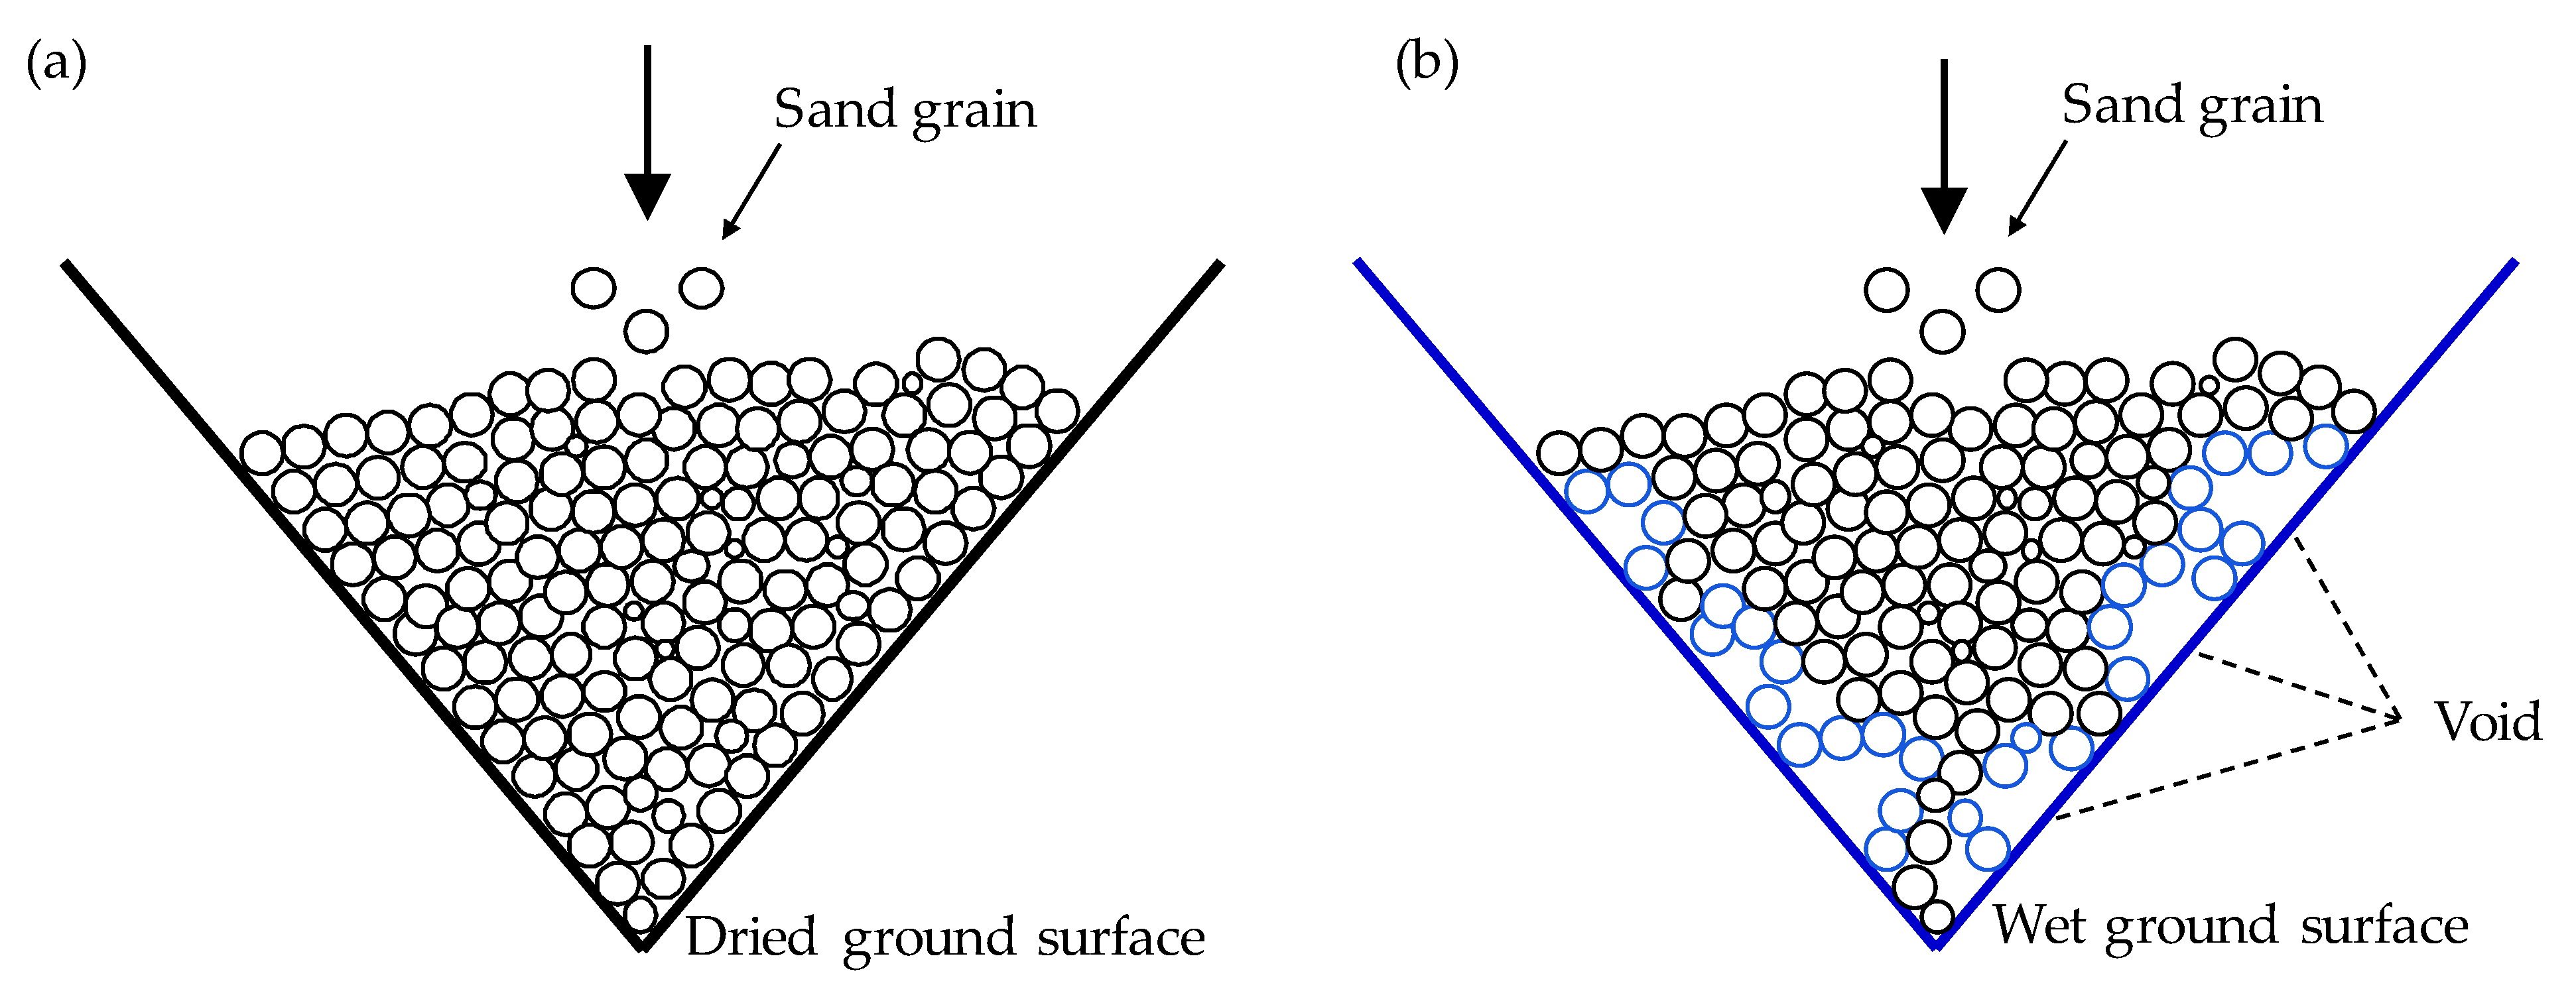
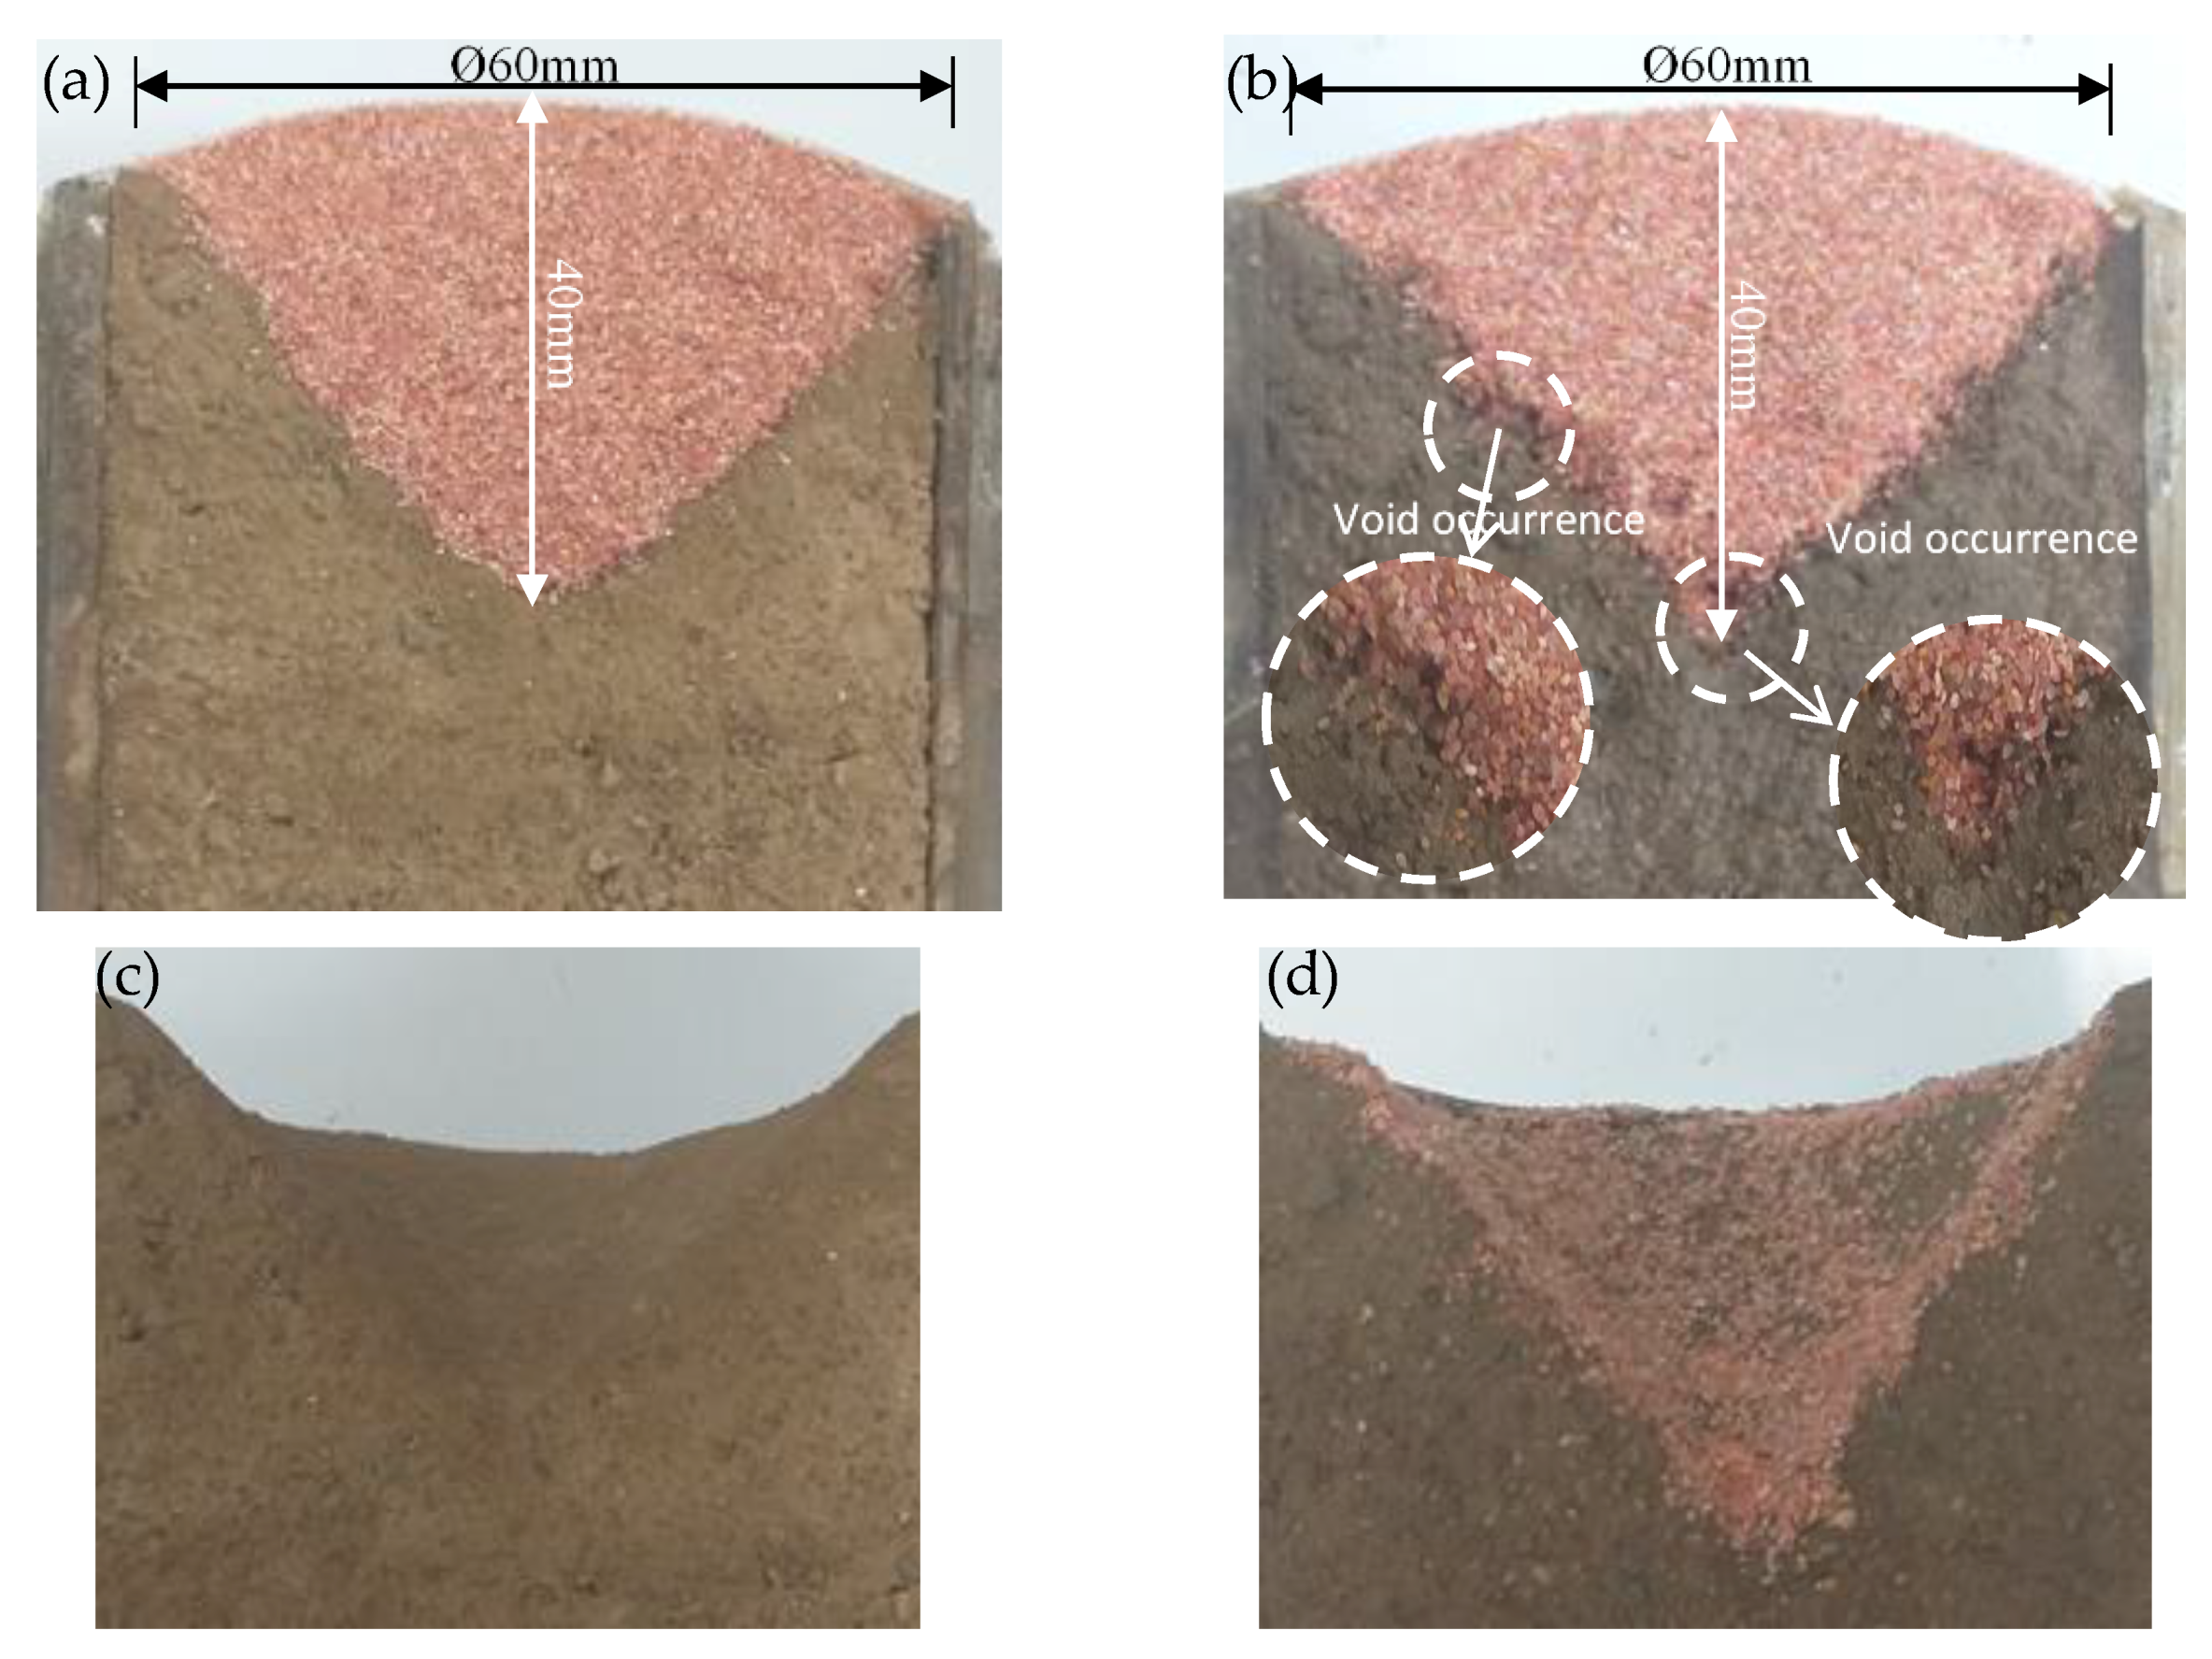
  • As the water content of the compacted ground increased from 2% to 16%, the calculated volume of the test hole decreased and the dry unit weight was overestimated by up to 20%. The accumulation of moisture increased the number of voids in the test hole, and, therefore, the calculated volume was lower than the actual volume.
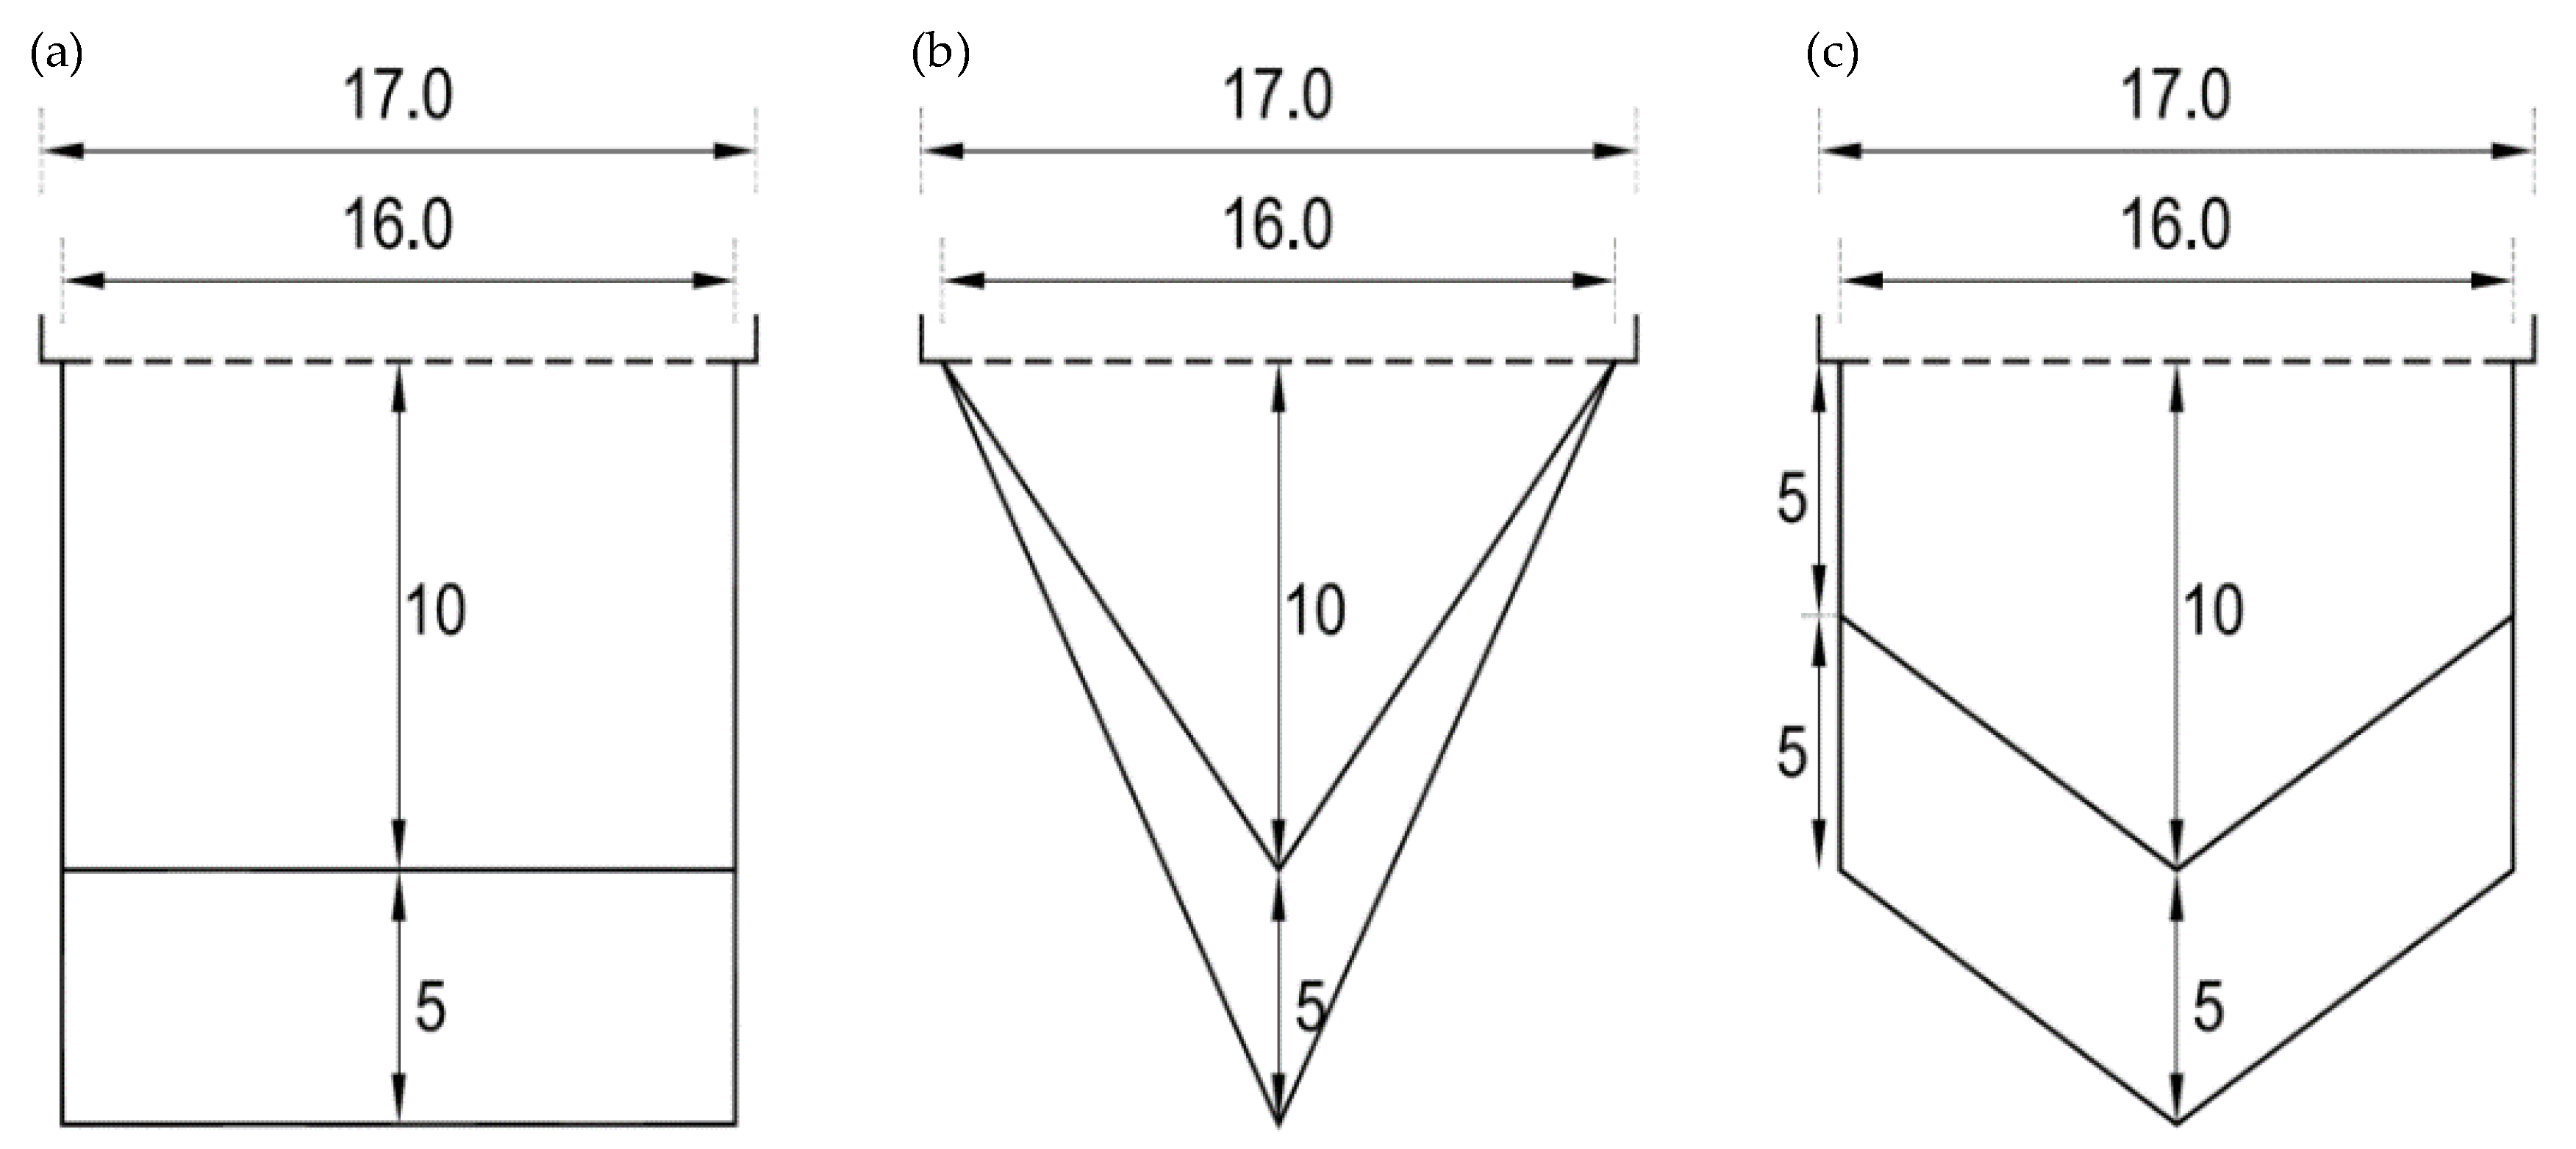
  • For the cylindrical hole, the dry unit weight obtained was similar to the actual dry unit weight. When a sand-cone method is conducted after heavy rainfall at a site, appropriate precautions should be taken since the presence of moisture can lead to the relative compaction of the ground being overestimated. The error in the calculated density can be minimized by considering the wetting condition of the ground. The water content measured after heating in a microwave oven for 15 min was similar to that obtained after heating in a dry oven for 24 h.
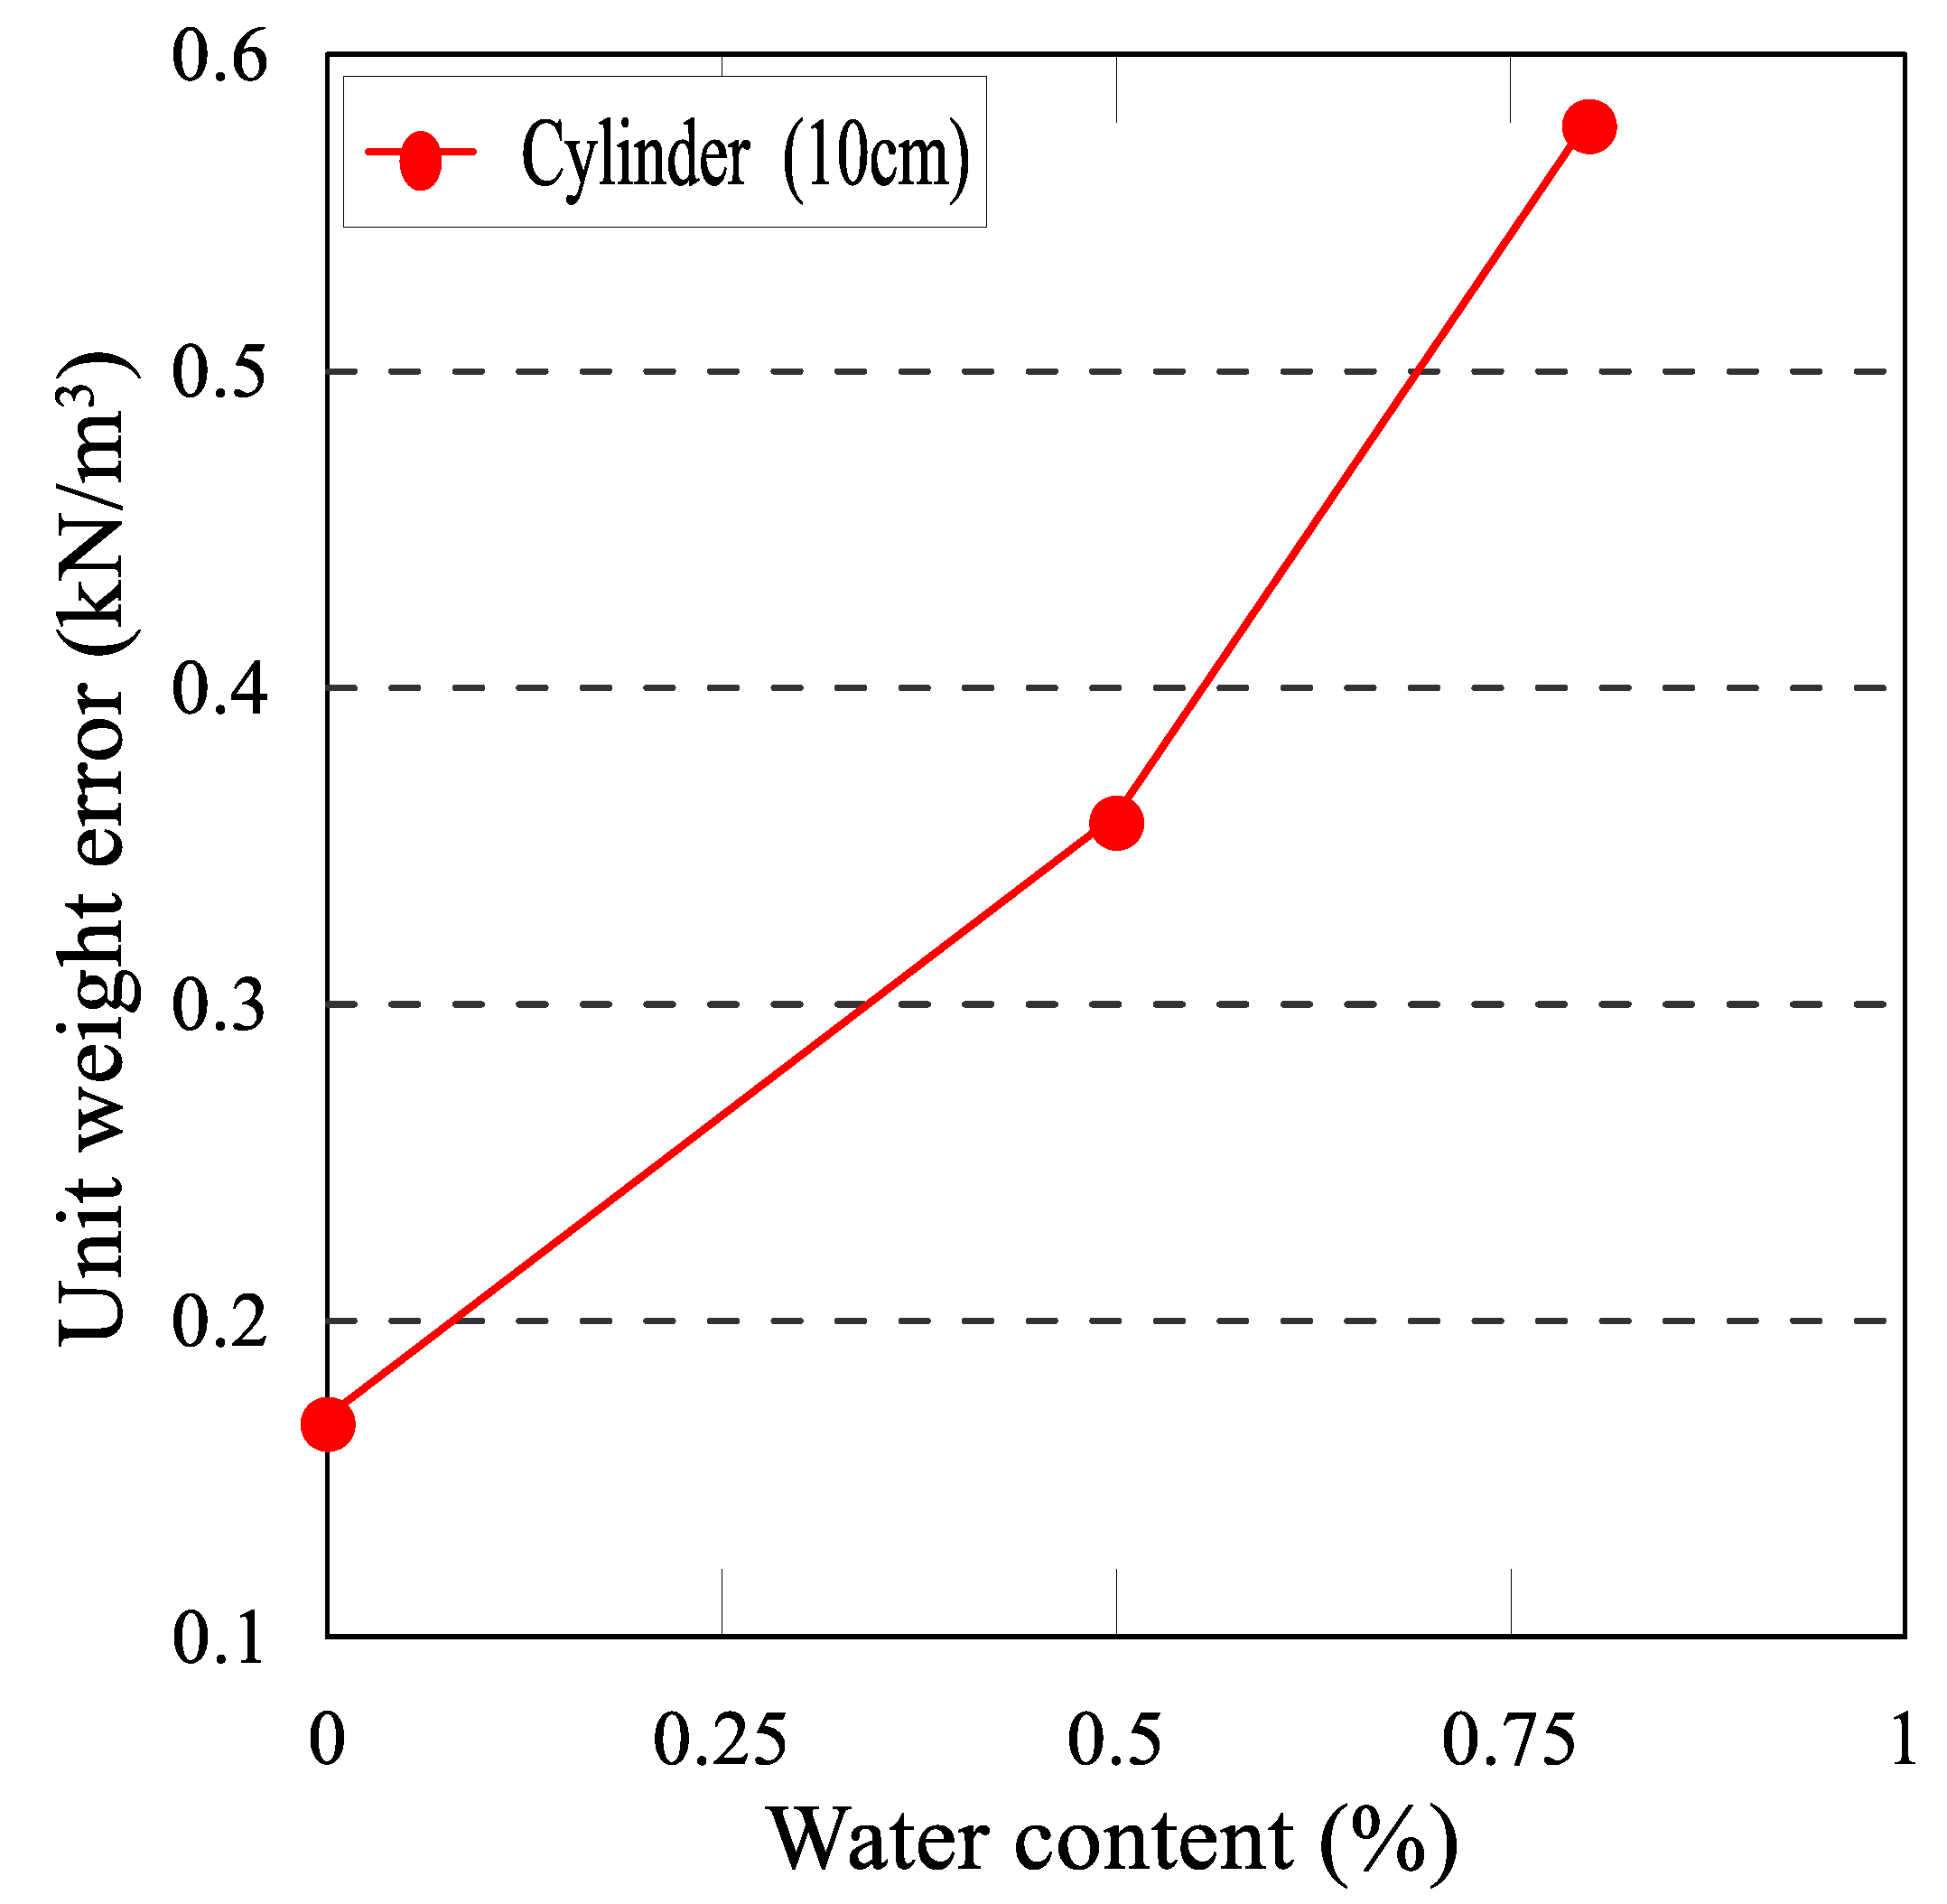
  • The effect of moist test sand was relatively insignificant. However, the experimental results showed that the calculated volume of the test hole decreased as the water content of the sand increased from 0% to 0.8%.
  • At a moisture content of 1% (and above), the test sand clumped together, rendering the sand calibration difficult. Therefore, sand used for sand-cone tests should be dry. In humid environments, the moisture content of the sand should not exceed 0.8%.

Author Contributions

Conceptualization, S.-S.P. and P.D.O.; methodology, S.-S.P. and P.D.O.; formal analysis, S.-S.P. and S.-W.W.; data curation, S.-W.W.; writing—original draft preparation, S.-S.P. and H.-I.L.; writing—review and editing, S.-S.P., P.D.O., S.-W.W., and D.-E.L.; visualization, P.D.O. and S.-W.W.; supervision, D.-E.L. and S.-S.P.; project administration, D.-E.L.; funding acquisition, D.-E.L. All authors have read and agreed to the published version of the manuscript.

Funding

This work was supported by the National Research Foundation of Korea (NRF) grant funded by the Korean government (MSIT) (No. NRF-2019R1A2C3003890).

Conflicts of Interest

The authors declare no conflict of interest.

References

  1. Freeman, R.B.; Gartrell, C.A.; Wakeley, L.D.; Berney, E.S.; Kelley, J.R. Steel-shot method for measuring the density of soils. Can. Geotech. J. 2010, 47, 1299–1304. [Google Scholar] [CrossRef]
  2. Park, S.S. Evaluation of the sand-cone method for determination of the in-situ density of soil. Géotechnique 2010, 60, 701–707. [Google Scholar] [CrossRef]
  3. ASTM. Standard Test Method for Density and Unit Weight of Soil in Place by the Sand-Cone Method. D1556-07; American Society for Testing and Materials: West Conshohocken, PA, USA, 2007. [Google Scholar]
  4. BS 1377-9. Methods of Test for Soils for Civil Engineering Purposes. In-Situ Tests; British Standards Institution: Milton Keynes, UK, 1990. [Google Scholar]
  5. KS F 2311. Standard Test Method for Density of Soil in Place by the Sand Cone Method; Korean Industrial Standards (KS): Chungcheongbuk-do, Korea, 2001. [Google Scholar]
  6. Park, S.S.; Nong, Z. A proposal of flow limit for soils at zero undrained shear strength. J. Korean Geotech. Soc. 2013, 29, 73–84. [Google Scholar] [CrossRef] [Green Version]
  7. Ansari, Y.; Kouretzis, G.; Sloan, S.W. Development of a prototype for modelling soil–pipe interaction and its application for predicting uplift resistance to buried pipe movements in sand. Can. Geotech. J. 2018, 55, 1451–1474. [Google Scholar] [CrossRef] [Green Version]
  8. Fattah, M.Y.; Shlash, K.T.; Mohammed, H.A. Bearing capacity of rectangular footing on sandy soil bounded by a wall. Arab. J. Sci. Eng. 2014, 39, 7621–7633. [Google Scholar] [CrossRef]
  9. Oh, E.Y.N.; Huang, M.; Surarak, C.; Adamec, R.; Balasurbamaniam, A.S. Finite element modelling for piled raft foundation in sand. In Proceedings of the Eleventh East Asia-Pacific Conference on Structural Engineering & Construction (EASEC-11) “Building a Sustainable Environment”, Taipei, Taiwan, 19–21 November 2008; Volume 8. [Google Scholar]
  10. ASTM. Standard Test Method for Determination of Water (Moisture) Content of Soil by Microwave Oven Heating. D 4643-08; American Society for Testing and Materials: West Conshohocken, PA, USA, 2008. [Google Scholar]
  11. Park, S.S.; Choi, S.G.; Ryu, J.H. A study on the measurement of moisture content in the organic soils. J. Korean Geotech. Soc. 2013, 29, 29–37. [Google Scholar] [CrossRef]
  12. Berney, I.V.; Ernest, S.; Kyzar, J.D.; Oyelami, L.O. Device Comparison for Determining Field Soil Moisture Content (No. ERDC/GSL TR-11-42); Engineer Research and Development Center: Vicksburg, Mississippi, USA, 2011. [Google Scholar]
  13. McCook, D.K.; Shanklin, D.W. NRCS experience with field density test methods including the sand-cone, nuclear gage, rubber balloon, drive-cylinder, and clod test. In Constructing and Controlling Compaction of Earth Fills; ASTM International: West Conshohocken, PA, USA, 2000. [Google Scholar]
  14. Kosmatka, S.H.; Kerkhoff, B.; Panarese, W.C. Design and Control of Concrete Mixtures, 14th ed.; Portland Cement Association: Skokie, IL, USA, 2002; pp. 88–89. [Google Scholar]
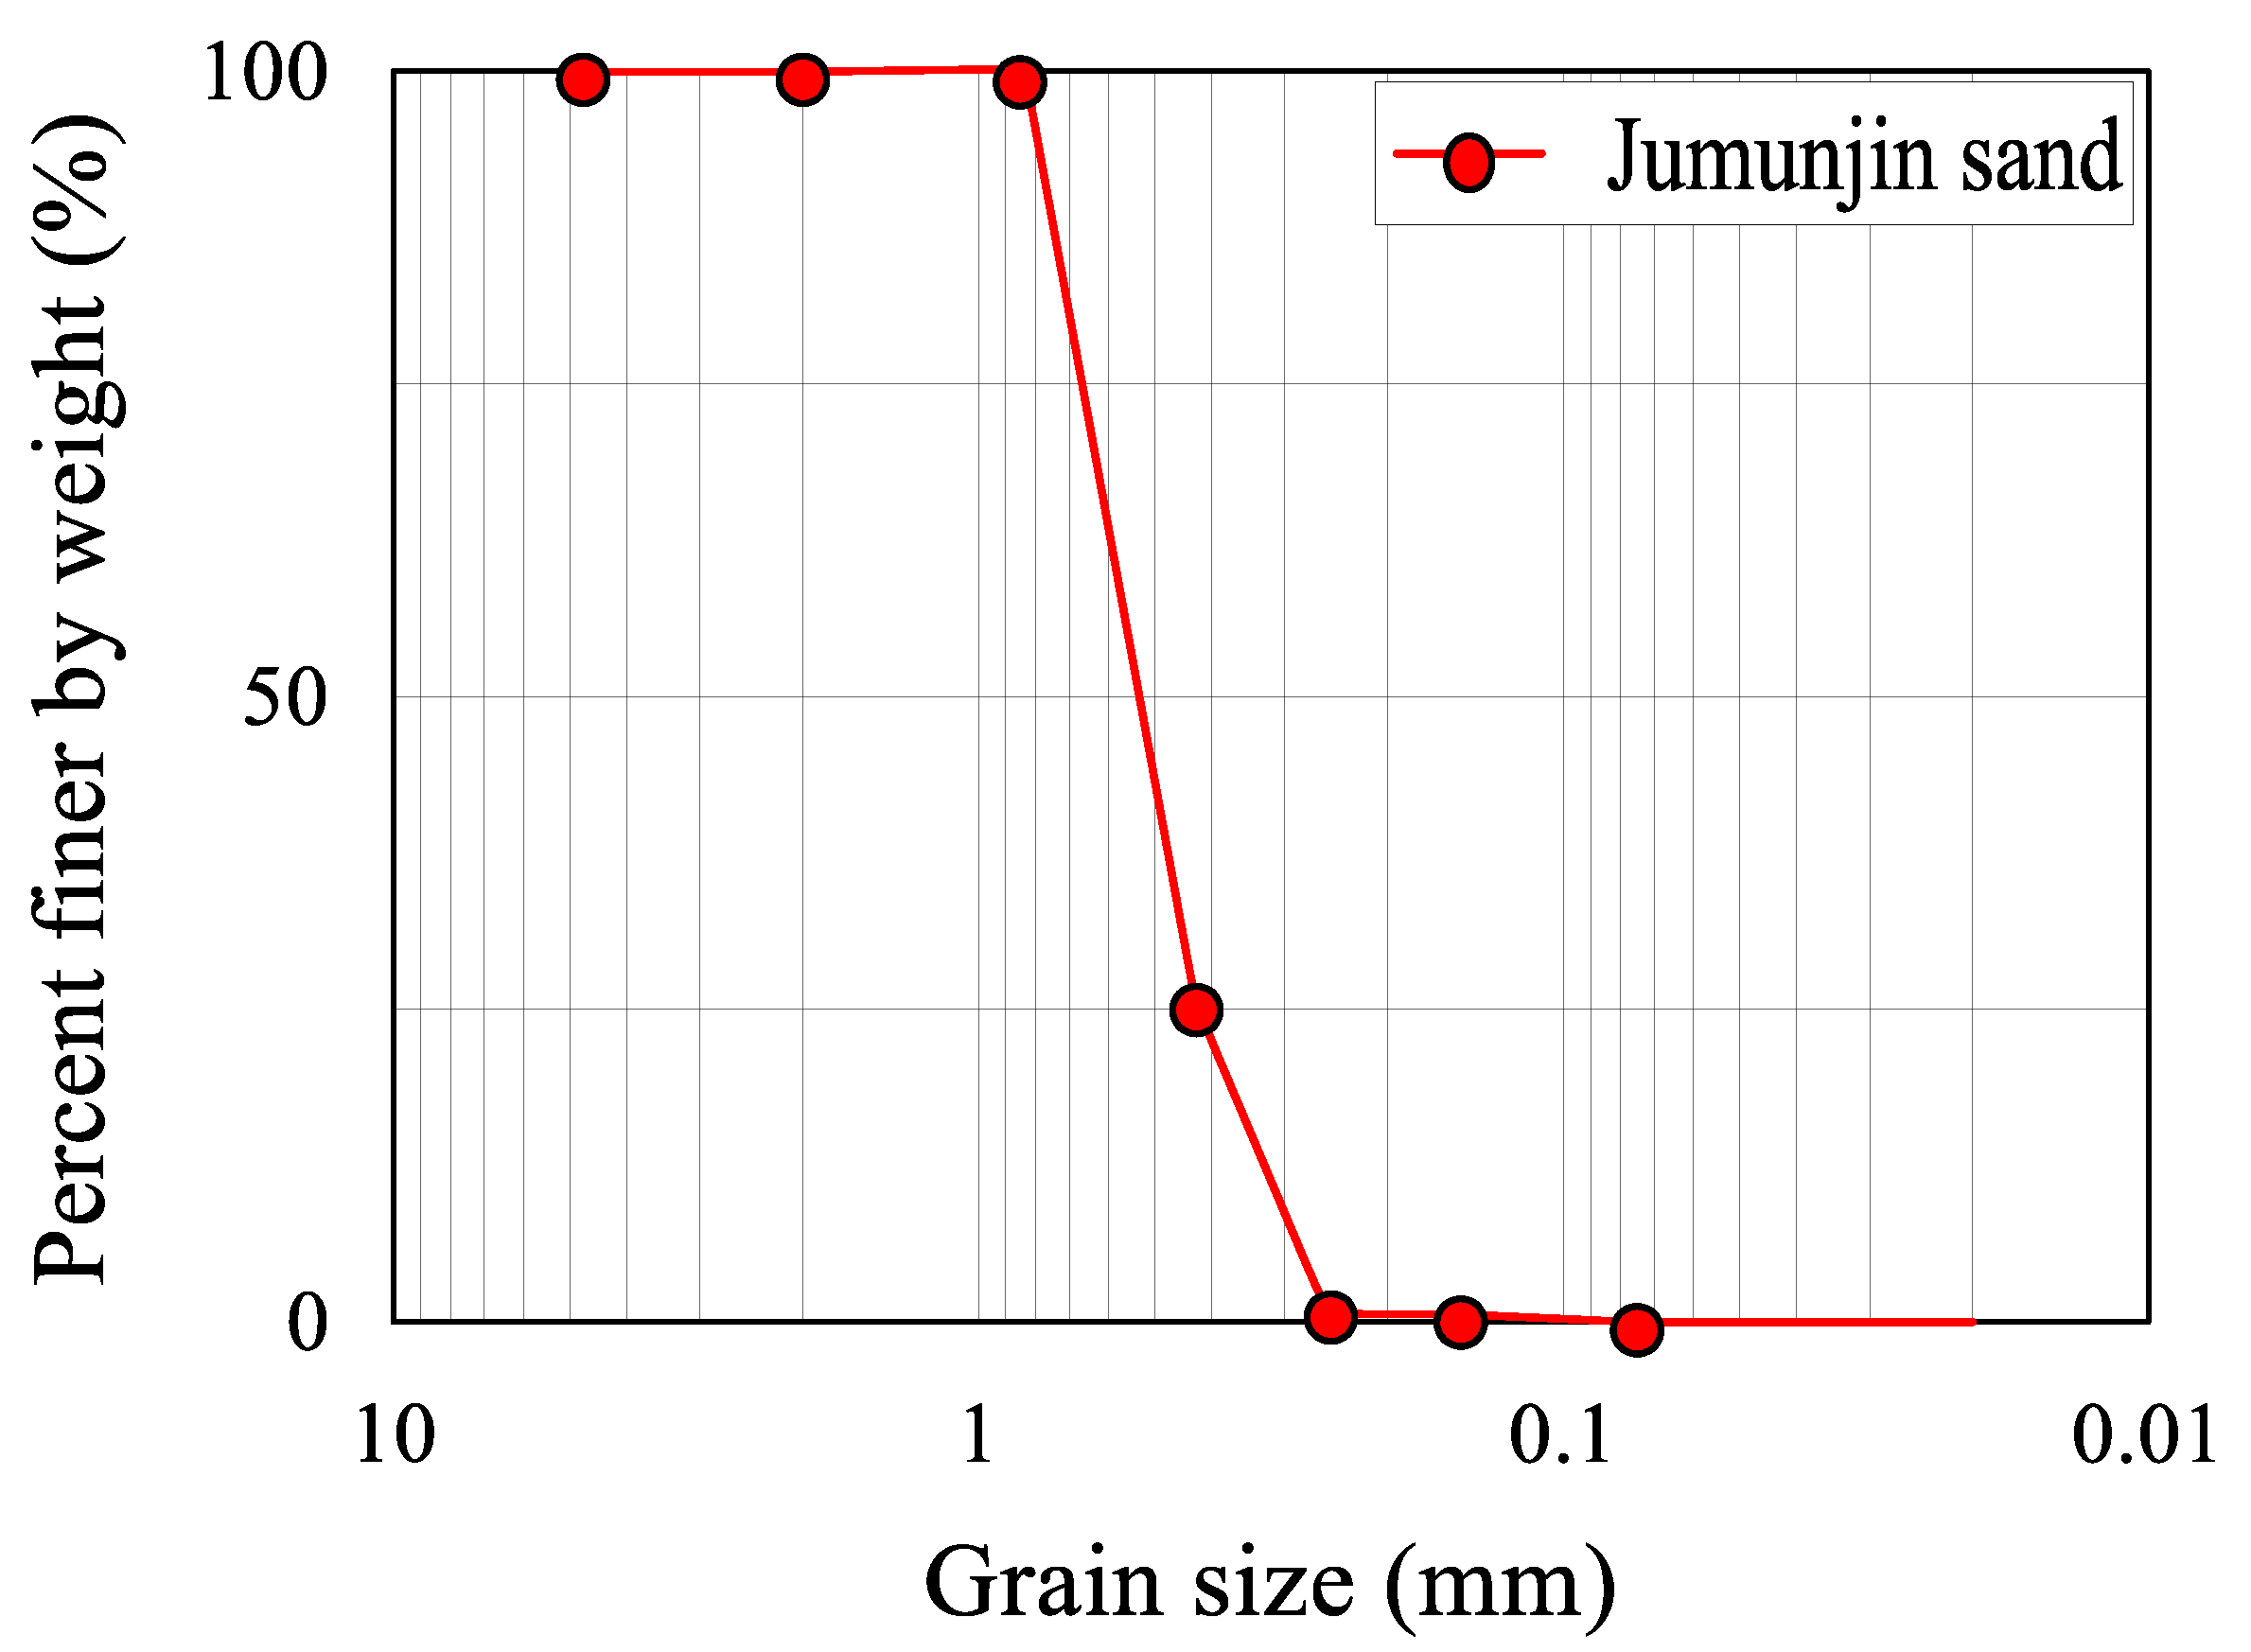
Figure 1. Sand-filling process in dry (a) and wet (b) ground holes.
Applsci 11 00718 g001
Figure 2. Cross-sections showing dry (a,c) and wet (b,d) compacted grounds filled with sand (a,b) and after removal of sand (c,d).
Applsci 11 00718 g002
Figure 3. Grain-size distribution curve for the Jumunjin sand used in this study.
Applsci 11 00718 g003
Figure 4. Detailed sizes and shapes of artificial holes (cylinder (a), cone (b), and roof (c); unit: cm).
Applsci 11 00718 g004
Figure 5. The test procedure (a): detailed compaction process, (b): compacted soil and rammer, (c): sand-cone method tools, and (d): the hole filled with test sand).
Applsci 11 00718 g005
Figure 6. Variation in the calculated dry unit weight of moist ground for different types of holes.
Applsci 11 00718 g006
Figure 7. Variation of the error in unit weight with moist ground for different types of holes ((a): kN/m unit, and (b): percentage of the exacted value).
Applsci 11 00718 g007
Figure 8. Cross-sections showing compacted grounds filled with sand.
Applsci 11 00718 g008
Figure 9. Variation of the error in unit weight with the sand wetness.
Applsci 11 00718 g009
Table 1. Sieve-analysis results of Jumunjin sand.
Sieve number410204060100200
Mesh size (mm)4.752.000.850.4250.250.150.075
Soil passing (%)10010099.8025.601.000.600.00
Table 2. Soil-physical properties of Jumunjin sand.
Specific Gravity, GsD60
(mm)
D30
(mm)
D10
(mm)
Coefficient of Uniformity, CuCoefficient of Curvature, CcUnified Soil Classification System
2.650.620.450.312.001.06SP
Table 3. Properties of the compacted soil.
No.200 Passing Rate
(%)
Liquid Limit, LL
(%)
Plastic Index, PI
(%)
Unified Soil Classification System
92.240.117.7CL
Table 4. The results of the effect of moist ground.
Hole TypeGround Water Content (%)Depth
(cm)
Volume
(cm3)
Moist Unit Weight
(kN/m3)
Moisture Content (%)Dry Unit Weight
γd(experiment)
(kN/m3)
Dry Unit Weight
γd(exact)
(kN/m3)
Error
kN/m3
(%)
Microwave OvenDrying
Oven
C
Y
L
I
N
D
E
R
2101815.5212.872.442.4312.5612.80−0.24(−1.88)
71695.4614.687.107.1213.7013.430.27(2.01)
121558.5715.6911.9711.9514.0213.660.36(2.64)
161465.5918.4016.1616.1315.8415.080.76(5.04)
2152803.0713.892.472.4713.5513.410.14(1.04)
72735.0715.217.187.1814.1914.010.18(1.28)
122135.4317.2711.9011.9515.4215.150.27(1.78)
162114.2018.8416.2716.2416.2015.710.49(3.12)
C
O
N
E
210972.1812.122.522.5311.829.991.83(18.32)
7801.6113.007.217.2212.1210.072.05(20.36)
12756.2213.9212.2212.2012.4010.212.19(21.45)
16737.9214.5716.0516.0312.5610.252.31(22.54)
2151539.5313.082.282.2412.8011.181.62(14.49)
71222.5514.127.087.0713.1911.251.94(17.24)
121145.6815.1712.3112.2913.5111.472.04(17.79)
161112.7415.7716.3716.3413.5511.492.06(17.93)
R
O
O
F
2101196.9312.632.562.5612.3211.450.87(7.60)
71171.3013.957.207.1813.0111.511.50(13.03)
121080.5315.1312.1312.1113.5011.921.58(13.26)
161046.1217.1816.1816.1214.7912.881.91(14.83)
2151667.6413.602.462.4613.2812.760.52(4.08)
71587.1214.407.137.1413.4412.840.60(4.67)
121486.8216.9112.0912.0515.0914.270.82(5.75)
161462.6618.2716.0816.0115.7514.551.20(8.25)
Dry unit weight (density) of the test sand = 13.40 kN/m3 (1.37 g/cm3).
Table 5. The results of the effect of moist sand.
Moisture Condition of The SandCalculated
Volume from the Filled Sand
(cm3)
Unit Weight with Moist Sand, γd(experiment)
(kN/m3)
Calibrated Unit Weight,
γd (calibrated) (kN/m3)
Error (kN/m3)
0%2157.9113.5713.400.17
0.5%2129.0713.760.36
0.8%2094.3713.980.58
Dry unit weight (density) of test sand = 13.40 kN/m3 (1.37 g/cm3).
Publisher’s Note: MDPI stays neutral with regard to jurisdictional claims in published maps and institutional affiliations.

