Abstract
Aero-engine core compressor preliminary design strategy has been successfully applied to the advanced design of gas turbines compressors. However, few researchers have addressed the application of the aero-engine core compressor preliminary design strategy in the preliminary optimal design of industrial process compressors. Here we embedded the aero-engine core compressor preliminary design strategy into a preliminary optimal design method, in which six types of design parameters widely used to define the aero-engine compressor configuration, i.e., aspect ratio, solidity, reaction, rotation speed, outlet axial Mach number, and inlet radius ratio, were used as the design variables. The 4-stage, 5-stage, 6-stage, and 7-stage compressor configuration with the same overall design requirements for a large-scale air separation main compressor were preliminarily optimized by the developed method, in which the 4-stage design has a stage pressure rise level of current aero-engine core compressors, whereas the 7-stage design has that of current industrial process compressors. The optimized compressor configurations were then refined with the throughflow-based detailed design method and finally verified with computational fluid dynamic simulations. It is found that the developed method can optimize design efficiency and accurately predict aerodynamic performance of compressors in a few minutes. Several design guidelines for the advanced industrial process compressors were also identified. This work is of significance in extending aero-engine core compressor design strategy to the design of advanced industrial process compressors.
1. Introduction
In the past few decades, the high-efficiency and reliable aero-engine core compressor design strategy has been applied to the aerodynamic design of compressors used in other important fields, such as marine ship and natural gas pipeline median-duty [1], and electricity generation heavy-duty gas turbines [2]. The design of an advanced compressor is a time-consuming and highly experience-dependent process, requiring a variety of design and analysis phases ranging from the preliminary design to the full three-dimensional computational fluid dynamics (CFD) [3]. Extending the aero-engine core compressors design strategy into the preliminary design method of industrial compressors represents a significant breakthrough in the area of energy and power engineering.
During the design process of an aero-engine compressor, the preliminary design is of great importance, as it can largely explore the aerodynamic performance potential [4]. In 1977, Wisler et al. [5] carried out a preliminary design study to verify the feasibility of high pressure ratio compressor design in an advanced aero-engine core. A manual parametric screening technique was applied to illustrate impacts of eight design parameters on the mechanical and aerodynamic performance. Similar work was reported by Massardo and Satta [6], who optimized an aerospace compressor configuration by using a one-dimensional meanline design method. In 2020, Zhang et al. [7] presented a comprehensive study on the accuracy and sensitivity of a total of 2448 model combinations (36 deviation angle models times 68 flow loss models) of on-design and off-design performance predictions for compressors in aero-engine applications. They concluded that at the design point, most of the widely used empirical deviation and loss models are capable of predicting the overall aerodynamic performance within a 2 percent error band, though prediction error at the off-design points was a little higher.
One of the most successful engine core aero-derivative technologies is LM2500, the most widely used gas turbine in marine ships and natural gas pipelines. Klapproth et al. [8] reviewed the early evolution of aero-derivative technologies used in the LM2500 gas turbine compressors, a descendent of the J93 engine compressor. The work input and reaction per stage and annulus area per row were selected as key design parameters during the preliminary design phase. Subsequently, Wadia et al. [1] developed the LM2500+ compressor by zero staging the LM2500 compressor to upgrade the flow and pressure ratio. Another successful engine core aero-derivative technology was reported by Novak et al. [2], in which a series of aero-engine compressor design technologies were used to upgrade a high pressure ratio 22-stage compressor for applications in power-generation heavy-duty gas turbines. At the preliminary design phase, channel shape, channel exit radius, number of stages, specific inlet mass flow, reaction, stage pressure ratio, and solidity were selected as the design parameters. However, most applications of aero-derivative technologies to date have been limited to power generation heavy-duty gas turbines, and marine ship and natural gas pipeline median-duty gas turbines. The application of aero-derivative technologies in the design of large-scale industrial process compressors were quite scarce.
A detailed design was conducted after the one-dimensional preliminary design to further refine the meridional configuration and to generate detailed blade profiles, the core of which is the throughflow design method, generally regarded as a simplified theory proposed by Wu [9] in the 1950s. Afterward, many studies had been devoted to develop throughflow design methods, which were mainly implemented with the streamline curvature method [10,11,12,13]. The throughflow design method plays a crucial role in the design process of compressors [14,15,16,17,18] due to the reasonable compromise between design accuracy and computational cost. The higher accuracy is attainable by the application of a high-fidelity but time-consuming CFD method [19]. In recent years, some multi-fidelity design systems have been developed for axial-flow compressors. In 2012, Bruna et al. [20] developed a compressor design software made up of 3 modules: a one-dimensional meanline module, a throughflow solver, and a throughflow grid generator. In 2017, Denton [19] opened his multi-fidelity compressor design codes that consist of a one-dimensional meanline code (Mangen) and a three-dimensional CFD solver (Multall).
The main drawback of the above aero-engine compressor design systems is the parametric analysis method employed during the preliminary design phase, which limits the automatic and extensive exploration of design space. As noted by Banjac and Petrivic [21], the preliminary optimization would greatly exploit the aerodynamic performance potential of compressor. Keskin and Bestle [22] indicated that optimization of annulus geometry and stagewise distribution of pressure ratio at the one-dimensional design phase can obviously increase efficiency and margin potentials. The objective of the present work is three-fold. The primary objective is to develop a preliminary optimal design method for industrial compressors by virtue of the engine core compressor preliminary design strategy. The secondary objective is to combine the developed preliminary optimal design method with the throughflow-based detailed design method and CFD method to develop a multi-fidelity design system. The third objective is to apply the system to the optimization of axial-flow compressors with a varying number of stages but with the same total performance requirements in large-scale air separation applications.
The remainder of this article is organized as follows. Section 2 demonstrates the aerodynamic design system framework. Section 3 illustrates the preliminary optimal design method. The CFD model and detailed design method are described in Section 4. Application of the developed system to 4-stage, 5-stage, 6-stage, and 7-stage industrial compressors is demonstrated in Section 5. Conclusions are summarized in Section 6.
2. Optimal Design Chart
The current aerodynamic optimal design method consists of two main modules, i.e., a detailed design module and a preliminary optimal design module, and three additional modules, i.e., an input module, a CFD verification module, and an output module (Figure 1).
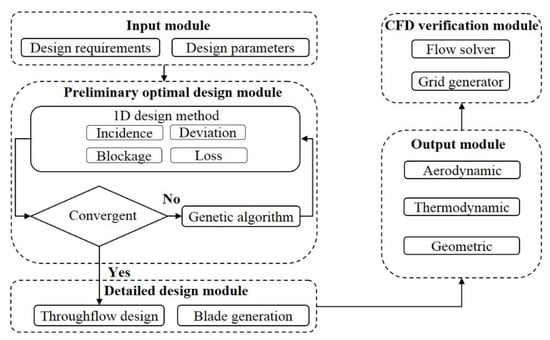
Figure 1.
Optimization flow chart.
The input module mainly consists of the design requirements and design parameters. The design requirements comprise pressure ratio, design mass flow rate, structural constraints, and inlet conditions. Six design parameters are applied, i.e., aspect ratio, solidity, reaction, rotation speed, outlet axial Mach number, and inlet radius ratio.
The main purpose of the second module is to accurately and rapidly explore the compressor configuration. This module aims at maximizing design adiabatic efficiency while keeping flow mass rate and total pressure ratio unchanged by simultaneously optimizing six types of design parameters. The applied one-dimensional meanline design method consists of widely used empirical models of loss, deviation, incidence, and blockage. To obtain optimized compressor configuration, the compressor design parameters were initialized and then optimized in following iterations.
It is challenging to catch the global optimal solution for a compressor as a mass of variables and corresponding nonlinearity. The genetic algorithm (GA) [23], as a type of global optimization algorithm, was used the present research.
The throughflow method used in the detailed design phase was based on the streamline curvature method. The governing equation was solved to obtain the aerodynamic and geometric parameters along the spanwise distribution of each row. The solution was then applied to refine the flow path, guaranteeing the mass flow conservation at the calculation station under consideration.
The blade section airfoil is used to generate blade geometry. The advanced airfoils, such as the high performance airfoil (HPA) and the controlled diffusion airfoil (CDA), lack reliable and publicly available empirical models. Therefore, the NACA 65-series and double-circular-arc (DCA) airfoils were selected as subsonic and transonic two-dimensional blade section airfoils, respectively. The two-dimensional blade section airfoils were then stacked spanwise along the radial line. The design process ended with output data of design results and CFD verification.
3. Preliminary Optimal Design Method
3.1. One-Dimensional Design Method
The objective of the one-dimensional design method is to acquire the meanline geometric, aerodynamic, and thermodynamic parameters of each blade row and the initial flow path.
The theoretical mechanical work is expressed by Euler equation:
where subscript 1 and 2 denote inlet and outlet of each row, respectively; subscript denotes a tangential component; is velocity; and is local blade speed. is converted into kinetic energy and pressure energy, and overcome the flow loss, which is written as:
where is density, is static pressure, and is flow loss. is calculated by using loss correlations, as will be introduced in Section 3.2. The one-dimensional mass conservation equation [21] is:
where the subscript denotes an axial component; is flow cross area; is the flow coefficient; and is an aerodynamic blockage factor. Deviation angle and incidence angle are defined respectively as the following:
where is the blade angle and is the flow angle.
Based on Equations (1)–(3), together with the flow loss and aerodynamic blockage models, the meanline parameters and the initial flow path are calculated. The flow angles are converted into the blade angles according to incidence and deviation angle models.
Once flow path is specified, blade height can be obtained. The corresponding blade number and chord can be obtained with the obtained solidity and aspect ratio. Lieblein [24] pointed out that the flow loss is a function of wake momentum thickness, solidity, velocity distribution, and chord length. Additionally, solidity will influence the reflections of oblique shock in cascade passage [25]. Reaction of stage indicates the allocation of static pressure rise capacity between stator and rotor in a stage, which influences magnitudes of Mach number and stage flow quality. From Equation (1), rotation speed will directly determine the theoretical work, the rotor tip Mach number, and thus the shock loss of the transonic and supersonic stage. Outlet axial Mach number will greatly affect the Mach number distribution along the stagewise direction as well as the meridional flow path contraction ratio. Moreover, the outlet axial Mach number is an important factor affecting the downstream component, such as the combustor in the aero engine and the heat transfer device in the air separation system. Lastly, the inlet radius ratio determines the inlet area and thus the inlet axial Mach number, rotor tip Mach number, and the average blade height.
Overall, aspect ratio, solidity, reaction, rotation speed, outlet axial Mach number, and inlet radius ratio are six key parameters and regarded as design parameters in the current preliminary optimal design phase. It should be noted here that beside the six design parameters mentioned above, Wisler et al. [5] adopted another three design parameters, i.e., the number of stages, the inlet flow/annulus area, and flow path shape to maximize the compressor design efficiency potential. Meeting the same overall design requirements, the axial-flow compressors with different number of stages are particularly investigated in Section 5. The constant outer radius is here adopted and set to be the same value for each design, and thus as long as the inlet radius ratio, design flow mass rate, and inlet conditions are known, inlet flow/annulus area as well as the flow path shape are naturally determined. As a result, the inlet flow/annulus area and flow path shape have not been taken as the dependent design parameters in this work.
3.2. Empirical Models
Four types of models are applied in the preliminary design phase:
- Flow loss, which is twofold, i.e., shock loss and profile loss:where is total pressure loss coefficient; subscript and denote shock loss and profile loss, respectively.
- Incidence angle,
- Deviation angle,
- Aerodynamic blockage.
Profile loss was calculated by Lieblein’s model [24]. The effects of inlet Mach number, Reynolds number, and annulus area contraction were revised by the method presented by Koch and Smith [26]. Ronald [27] derived a simple but reasonable shock loss correlation, which was applied in the present study. The incidence angle model proposed by Lieblein [28] is widely used and also recommended in NASA report [29]. This model was applied here for subsonic NACA 65-series airfoils. Ronald’s minimum loss suction incidence angle model was adopted [27] for DCA profiles. The deviation angle models proposed by Lieblein [28] for both of the subsonic NACA 65-series airfoils and transonic DCA airfoils were employed. The aerodynamic blockage correlation developed by Jansen [30] is used to properly match stage flow. A comprehensive estimation of these popular empirical models was given in our previous work [7].
3.3. Optimization Problem
The preliminary design method suffers from a lack of reliable design guidelines and extremely complex relations between aerodynamic performance and design parameters. These problems can only be settled with an optimization algorithm rather than repeated trial and error adjustment [5,21]. To avoid the well-known phenomenon of local extreme value, a GA was applied to explore the global optimal solution. Here, arithmetic crossover, roulette wheel reproduction, and non-uniform mutation operators were applied in the optimization process. The design adiabatic efficiency was selected as fitness. For each generation, population size was 200 and the number of generations was 100. Details of the GA, and its application, and validation in compressor optimization can be found in our other studies [31,32,33].
The current preliminary optimal design problem is illustrated as follows:
Objective: To maximize design adiabatic efficiency
where the superscript denotes the design condition, the superscript is the air heat capacity ratio, is total temperature, and is total pressure.
Constraints: To keep total pressure ratio equal to design total pressure ratio
and flow rate equal to design requirement
As demonstrated in Section 2, mass flow rate and total pressure ratio are input as design requirements in the input module and remain unchanged in the following preliminary optimal design process. Then the constraints can be handled in the optimization algorithm and finally fulfilled.
Design variables: Six types of design parameters, including aspect ratio , solidity , reaction , rotation speed , outlet axial Mach number , and inlet radius ratio , were used in the preliminary design phase. The definition of , , , and are:
where is blade height; is blade chord length.
where is the blade pitch.
where is the compressor inlet hub radius and is the compressor inlet tip radius. We referred to Wisler et al.’s [5] research for the range of solidity, aspect ratio, reaction, and outlet axial Mach number selected in the present work. For IGV aspect ratios of 4-stage, 5-stage, 6-stage, and 7-stage compressors, the upper bounds were 1.9, 2.0, 2.1, and 2.2, and the lower bounds were 1.45, 1.55, 1.65, and 1.75, respectively. The upper bound was 1.45 and the lower bound was 1.00 for the outlet stator aspect ratio of four types of compressors. A linear variation was employed for aspect ratio upper bounds and lower bounds of each blade row along row-wise pattern from IGV to outlet stator of four types of compressors. The upper and lower bounds of solidity, reaction, and outlet Mach number were kept the same for four types of compressors (Table 1), respectively, which were basically consistent with the bounds of corresponding variables in Wisler et al.’s work. Importantly, the rotation speed and the inlet radius ratio can affect the magnitude of the relative Mach number. To keep the relative Mach number below 1.4, and to meet the applicable range of the shock loss model adopted [27], the upper bounds of the rotation speed were linearly decreased from 6500 rpm to 5000 rpm. Similarly, the lower bounds were linearly decreased from 5500 rpm to 4000 rpm as the number of stages increased. The inlet radius ratio varied between 0.25 and 0.5. The initial value of each variable was equal to the arithmetic average of its upper and lower bounds.

Table 1.
The bounds of four design parameters.
4. Detailed Design Method and CFD Model
The two fundamental objectives of detailed design were (1) to get spanwise and stagewise distribution of aerodynamic, geometric, and thermodynamic parameter constraints of preliminary design results, and (2) to get a more detailed meridional flow path.
The full radial equilibrium equation is expressed as the following equation [15]:
where the subscript denotes meridional component; is the radial line; is quasi orthogonal line; is Meridional streamline curvature; is specific entropy, and is specific enthalpy. The , , and are illustrated in Figure 2.
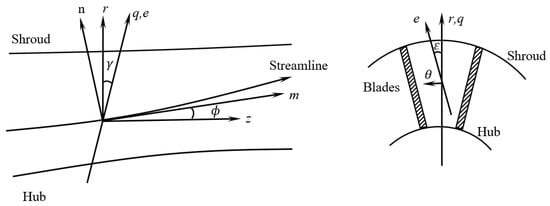
Figure 2.
Coordinate graph of the streamline curvature method.
The spanwise distribution of is pre-set by:
and are set as nonzero constants for the entire compressor (all stages with identical swirl). and are determined by Equation (1), Equations (16) and (17), and midspan reaction. The at the midspan obtained from the preliminary design results was set as the definite condition to sufficiently obtain the unique solution of Equation (15), which is numerically and iteratively solved by a finite differencing method. In the iteration process, 13 nodes are set at each calculation station. These nodes are initialized by being evenly distributed along the spanwise direction. The one-dimensional solution of is equal to midspan . After each iteration, the nodes (except the casing node) are simultaneously updated, and the iteration process was considered to be completed when the node radii are no longer changed. From the assumptions of axisymmetric, the principle of streamline curvature method can be obtained, i.e., the flow can be restricted to the meridional plane. Hence the is settled to equal zero in this work. The value of and are calculated by performing cubic spline interpolation on the calculation stations along the meridional streamline direction. The is obtained by calculating the included angle between the axial gap centerline and the radial direction. The spanwise distribution of is obtained by the definition of the Euler equation and kept unchanged along the spanwise in this work. The viscous effects as well as the spanwise distribution of are reflected in flow loss, flow deviation, and aerodynamic blockage.
From the solution of Equation (15), the flow angles and the other thermodynamic and aerodynamic parameters can be obtained. The blade metal angles were determined by flow angles, incidence angle, and deviation angle. Subsequently, the resultant three-dimensional geometry of the blade was attainable by radially stacking the two-dimensional airfoils. The shroud curve and hub curve were parameterized by two cubic spline interpolation curves. A constant spanwise chord of each blade was adopted in this work.
To validate the numerical model used in the present research, CFD simulation of NASA Stage 35 [34] was first carried out. The energy equations and three-dimensional steady Reynolds-averaged Navier-Stokes equations were solved with EURANUS/TURBO. The turbulence was closed by an S-A model. The second-order central scheme coupled with the second- and fourth-order artificial dissipation terms were used to discretize spatial derivative terms. The pseudo-time derivatives were discretized by an explicit four-stage Runge-Kutta scheme. The local time stepping, multi-grid strategy, and the implicit residual smoothing techniques were applied to accelerate the process. Total pressure, total temperature, and flow angles were specified at inlet, and the static pressure was set as outlet condition. The non-slip adiabatic solid wall was applied and the mixing planes were used to treat rotor-stator interfaces. To capture the boundary layer in detail, should be kept below 5.
Figure 3 compares the CFD results with the test data [34]. The overall trend was accurately predicted by the numerical model. The relative error of the peak adiabatic efficiency was 0.26%. The CFD slightly underestimated total pressure ratio and mass flow rate by 0.01% and 0.10% at peak efficiency, respectively. The validation demonstrates that the CFD model can accurately predict the aerodynamic performance of compressor.
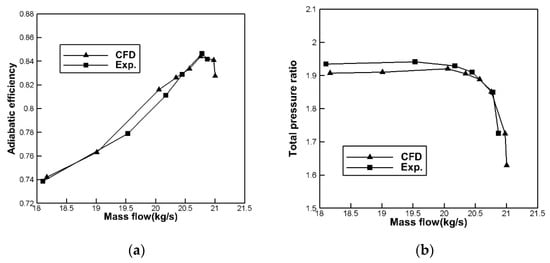
Figure 3.
Stage 35 Performance curves: (a) Adiabatic Efficiency; (b) Pressure ratio.
5. Optimal Design of Four Kinds of Axial Compressors
5.1. Problem Description
The developed method was then used to optimize compressors used for a large-scale air separation system with 100,000 cubic meter oxygen production per hour. In this study, 4-stage, 5-stage, 6-stage, and 7-stage compressors were examined with the same overall design requirements, i.e., total pressure ratio and mass flow rate. Due to mechanical constraints, a constant outer diameter configuration was chosen and set to 1.67 m in the four types of compressors. The functional requirements are listed in Table 2. The average stage total pressure ratio in the four types of compressors ranged from 1.22 to 1.41, which roughly corresponds to the average pressure ratio per stage of the well-known jet engine high pressure compressor (HPC), and is shown in Figure 4.
Table 2.
Functional requirements of the compressor.
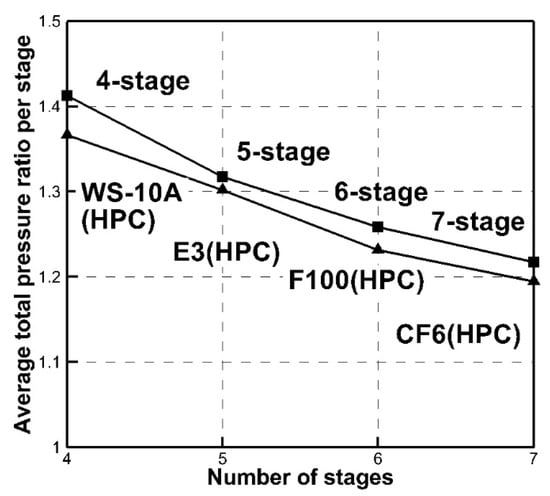
Figure 4.
Average total pressure ratio per stage of four compressors and jet engine HPC.
5.2. Results and Discussion
The optimal convergence curves of the four kinds of compressors are illustrated in Figure 5. The initial and optimal design results of 4-stage, 5-stage, 6-stage, and 7-stage compressors are demonstrated in Table 3. The design adiabatic efficiency of the four kinds of compressors increases effectively while mass flow rate and total pressure ratio changes are negligible after optimization. It can also be found that the optimal design adiabatic efficiency decreases with a decrease of the number of stages. With the same total pressure ratio for those four types of compressors, the increase of the number of stages brings about the decline of the pressure ratio and the Lieblein equivalent diffusion factor [24] of each stage (Figure 6). Figure 7 illustrates the spanwise distribution of optimal Lieblein equivalent diffusion factors of rotor 1 and stator 1 for 4-stage, 5-stage, 6-stage, and 7-stage compressors. The lower optimal reaction of 4-stage and 5-stage compressors (Table 4) means the relatively higher loading of the stator. The equivalent diffusion factors of stator 1 of 4-stage and 5-stage compressors are quite higher than those of 6-stage and 7-stage compressors. On the whole, for both rotor 1 and stator 1 of these four compressors, the equivalent diffusion factors along the spanwise direction decrease among the most span range as the number of stages increases. Hence fewer stages will penalize efficiency within a reasonable loading range.
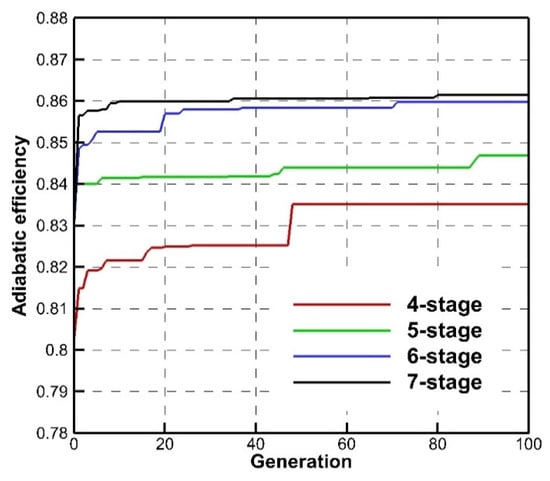
Figure 5.
Convergence of the proposed GA for the four compressors.
Table 3.
Initial and optimal design results of four compressors.
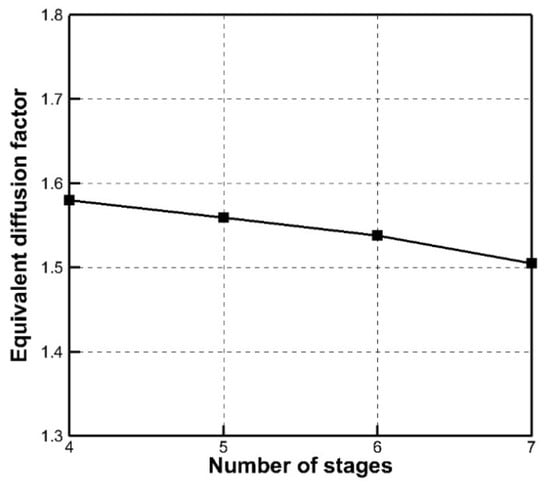
Figure 6.
Optimal average stage equivalent diffusion factor for four compressors.
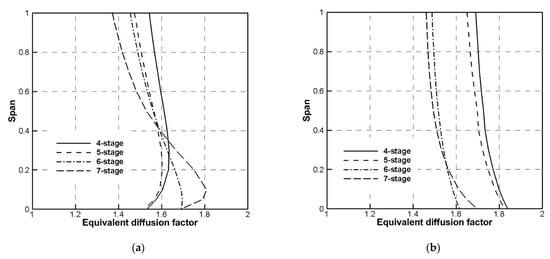
Figure 7.
Optimal equivalent diffusion factor for the first stage of four compressors: (a) Rotor; (b) Stator.
Table 4.
Initial and optimal design results of six design parameters.
To reveal the aerodynamic mechanism behind the optimization of performance, the variations of the six types of design parameters, including aspect ratio, solidity, reaction, rotation speed, outlet axial Mach number, and inlet radius ratio, are analyzed in detail below.
Table 4 shows that a higher efficiency is obtained with a little decline of solidity. As solidity decreases, will decrease [28]. The optimal average solidities at midspan of the four types of compressors vary within a small range from 1.28 to 1.33. As shown in Figure 8, the stagewise optimal solidities of the four compressors are around 1.3. These optimal results reveal that for a compressor with an aforementioned stage load level, an average solidity between 1.28 and 1.33 would be beneficial to the efficiency. Notably, the IGV was denoted as the first row.
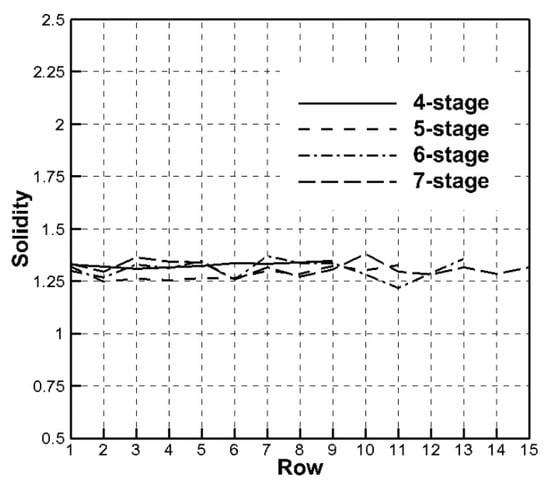
Figure 8.
Stagewise optimal solidity distribution.
As shown in Table 4, optimal efficiency was achieved after the average aspect ratio slightly increased. This is also consistent with the fact that a higher aspect ratio results in a larger blade height, which in turn reduces the axial velocity. Accordingly, the relative Mach number would be kept lower as well as the flow loss would be improved. Notably, the optimal average aspect ratio increases from 1.44 to 1.58 as the number of stages increases. When the number of stages increases, the pressure ratio and density ratio of all stages decrease, as does the axial velocity. Hence a larger flow area is required to maintain the same flow rate. This could be achieved with a higher aspect ratio. Figure 9 illustrate the optimal aspect ratio along the stagewise direction. As can be seen, its nearly linear descent gradually approaches the same level of around 1.25 at the final outlet.
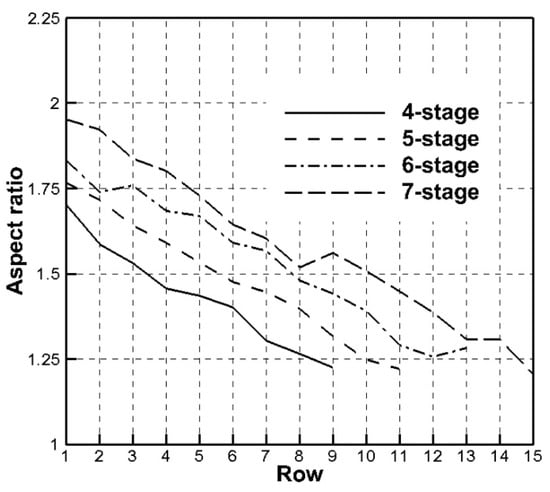
Figure 9.
Optimal aspect ratio distribution along the stagewise direction.
Meanwhile, the optimal efficiency corresponds to a lower value of the average reaction relative to the initial reactions. The optimal average reaction increases from 0.44 to 0.49 as the number of stages increases. Reaction reflects the compression capacity of the rotor with respect to that of the stator. A higher reaction level means higher compression capacity as well as extremely high inlet Mach number of rotors, which will deteriorate the efficiency of rotors. Similarly, a lower reaction will deteriorate the efficiency of the stators. Hence a moderate level of the reaction would be preferred for better efficiency of a stage.
Table 4 also shows that optimal efficiency can be obtained with a slight decline of rotation speed. At optimal operating conditions, relative velocity or equivalently the relative Mach number is slightly reduced, and thereby the shock intensity becomes moderate, with a little less shock loss. As seen, the optimal rotation speed decreases from 6125 rpm to 4053 rpm as the number of stages increases. It can be deduced from the Euler equation that a positive correlation between the rotation speed and the theoretical work exists. Under the same total pressure ratio, the average stage theoretical work decreases as the number of stages increases, resulting in a decrease of the rotation speed.
As shown in Table 4, an increase of outlet axial Mach number can give rise to improved efficiency. The initial and optimal outlet axial Mach number are basically at the same level (around 0.34). An acceleration treatment for axial velocity at the inlet and outlet of the IGV is applied to get a meridional contraction, and axial Mach number decreases almost linearly along the stagewise direction from the inlet of the first rotor to the outlet of the exit stator.
Efficiency increases as the inlet radius ratio decreases. The optimal inlet radius ratio of the four types of compressors is basically at the same level (around 0.3). The lower inlet radius ratio means larger blade height and fewer blade numbers, which is beneficial to a decrease of weight and cost. Moreover, a lower inlet radius ratio can decrease the inlet axial Mach number and thus the average axial Mach number, which can weaken the intensity of shock structure.
Because of the above variations of six design parameters, the flow characteristics inside the compressors have been affected. On account of the higher rotation speed, there exist an intense shock wave for rotor 1 of 4-stage, 5-stage, and 6-stage compressors. The alleviation of the shock wave of rotor 1 at 95% span of 4-stage, 5-stage, and 6-stage compressors can be seen in Figure 10. This is consistent with the aforementioned analysis that a higher average aspect ratio, a lower inlet radius ratio, and a lower rotation speed will commonly bring about the decrease of relative Mach number level, as well as the intensity of the shock wave.
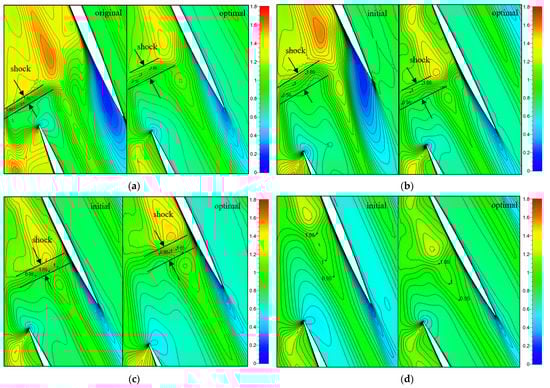
Figure 10.
Comparison of initial and optimal relative Mach number at 95% span of rotor 1: (a) 4-stage; (b) 5-stage; (c) 6-stage; (d) 7-stage.
Figure 11 illustrates the CFD results of the difference of entropy rise of rotor 1, which is defined as:
where the subscript initial denotes the initial results and the subscript optimal denotes the optimal results.
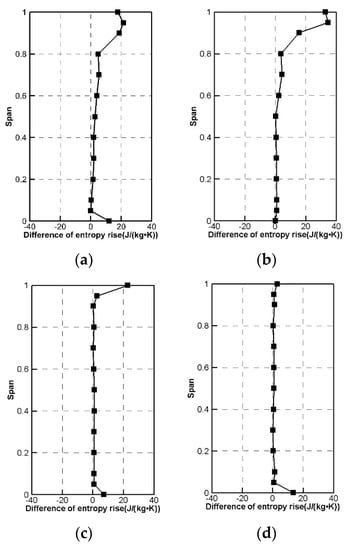
Figure 11.
Comparison of initial and optimal spanwise distribution of the difference of entropy rise of rotor 1: (a) 4-stage; (b) 5-stage; (c) 6-stage; (d) 7-stage.
It can be seen that a lower entropy rise is attainable along the entire blade height after optimization. The reduction of entropy rise is particularly noticeable near the tip region for the 4-stage, 5-stage, and 6-stage compressors, which is consistent with the aforementioned analysis that shock loss dominates total loss in the supersonic region and alleviation of shock can largely improve the efficiency. Apart from the supersonic region, the profile loss occupies a dominant proportion of total pressure loss. The reduced entropy rise among the subsonic region indicates the reduction of profile loss, which is consistent with the analysis of the variation of solidity and its influence on the profile loss.
This work aims to develop a preliminary optimal design method by virtue of aero-engine compressor design strategy, i.e., the aforementioned six design parameters widely applied in the preliminary design of aero-engine compressors were applied in the preliminary optimal design of industrial process compressors. Wisler et al. [5] performed a manual parametric screening analysis of an advanced aero-engine core compressor considering eight preliminary design parameters, including aspect ratio, solidity, reaction, inlet radius ratio, outlet Mach number, number of stages, inlet flow/annulus area, and flowpath shape. On the basis of their manual parametric screening analysis, this work first embedded the similar preliminary design strategy into a preliminary optimal design method for the optimization of industrial process compressors. In addition to these design parameters in the research of Wisler et al., rotation speed is also adopted as a design parameter, which has an important impact on the Mach number, stage loading, and velocity triangle shape, and therefore has a profound impact on the performance. Apart from sole compressor configurations in terms of 3.94:1 total pressure ratio in this work, two types of compressor configurations were studied in Wisler et al.’s work: 14:1 total pressure ratio compressor configuration and 23:1 total pressure ratio compressor configuration. However, the average total pressure ratio per stage of these two types of compressor configurations with three different stage load levels in Wisler et al.’s work varies from 1.25 to 1.55, which are basically consistent with those in this work.
By comparing their parametric screening analysis for aero-engine compressors and our analysis of the six design parameters critical to industrial process compressor design efficiency potential, several new preliminary design guidelines can be further confirmed for the advanced design of industrial process compressors. Similar to our present study, aspect ratio declined from inlet to outlet of the compressor in their result. Best efficiency can be obtained with average aspect ratio being in the range from 1.3 to 2.0, covering the range of optimal average aspect ratio in the present study. Their work implies that average solidity ranging from 1.2 to 1.5 provides best efficiency, which also contains the range of optimal average solidity from 1.28 to 1.33 in the present work. For reaction, unlike the research of Wisler et al., a higher reaction level is adopted considering a higher Mach number level in our work. A low value (less than 0.28) of compressor outlet Mach number is desirable, which is slightly below the optimal outlet axial Mach number level (around 0.34) in our study. Wisler et al.’s work shows that high inlet radius ratio will penalize efficiency, which is consistent with the corresponding results in our research.
5.3. CFD Verification
The aerodynamic performance of the aforementioned four types of compressors will be illustrated by NUMECA.
As Table 5 displays, the predicted total pressure ratio and adiabatic efficiency of the 4-stage compressor have converged with the node number of 6,009,601, which will be used in this work. The computational grid is demonstrated in Figure 12.
Table 5.
Grid independency examination.
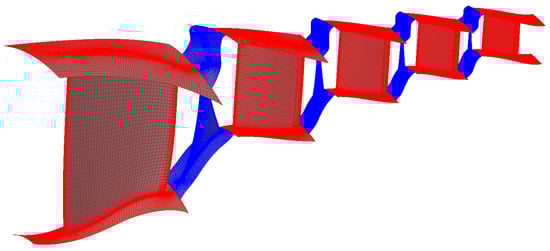
Figure 12.
Computational grid of the 4-stage compressor.
Table 6 presents a comparison between detailed design results and CFD prediction of the 4-stage, 5-stage, 6-stage, and 7-stage compressors. The maximum relative errors between the design results and CFD prediction are 1.70%, 1.02%, and 1.92% for adiabatic efficiency, total pressure ratio, and mass flow rate, respectively. The CFD simulation confirms that the design adiabatic efficiencies increase 0.80%, 2.44%, 0.56%, and 1.34% for the 4-stage, 5-stage, 6-stage, and 7-stage compressors after optimization, respectively.
Table 6.
The design results and CFD prediction of four compressors.
Figure 13 displays total pressure along the row-wise direction for CFD prediction and optimal design intention of four kinds of compressors at design conditions. It could be concluded that the developed method can accurately predict total pressure ratio.
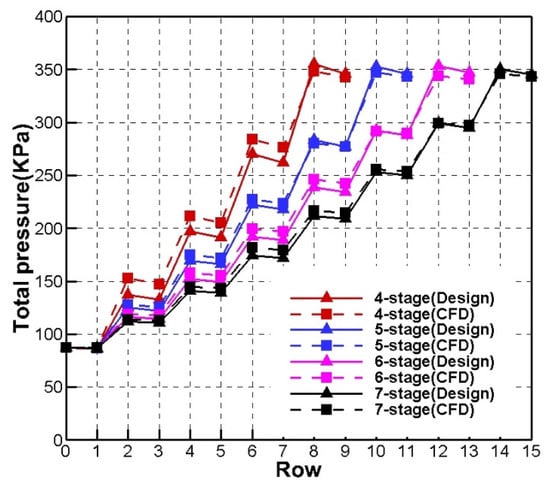
Figure 13.
Rowwise total pressure.
Figure 14 presents rotor 1 outlet total pressure for CFD prediction and optimal design results of four kinds of compressors. The results of the comparative studies indicate a pretty good consistency of the stage match in the main flow region.
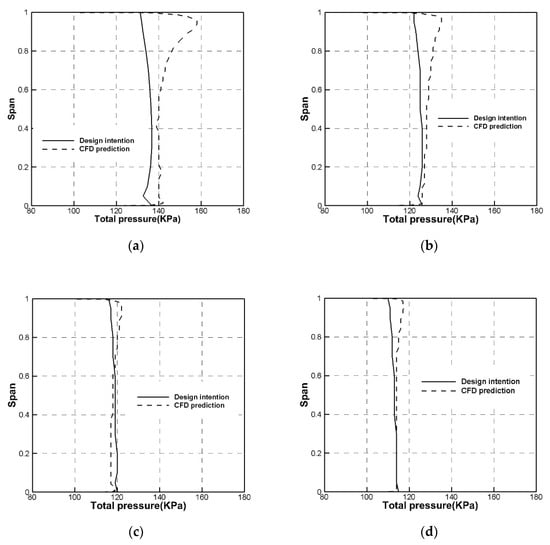
Figure 14.
Rotor 1 outlet total pressure: (a) 4-stage; (b) 5-stage; (c) 6-stage; (d) 7-stage.
Overall, the developed method is sufficient for the optimization of 4-stage, 5-stage, 6-stage, and 7-stage compressor configuration. The preliminary optimal design consumed a few minutes and the detailed throughflow design only needed several seconds on a PC. The optimal design results were verified with the CFD prediction. Each CFD calculation used four cores in parallel on a PC and required about 2 h to 3 h before reaching sufficient convergence for 4-stage, 5-stage, 6-stage, and 7-stage axial-flow compressors. Throughflow-based optimization and three-dimensional blade optimization will be conducted in future.
6. Conclusions
This work embedded the aero-engine core compressor preliminary design strategy into a preliminary optimal design method for the preliminary optimization of large-scale air separation main compressors. Six design parameters widely used to define the aero-engine compressor configuration, i.e., aspect ratio, reaction, solidity, rotation speed, outlet axial Mach number, and inlet radius ratio, were decomposed into design variables. Optimized compressor configurations were then refined with the throughflow theory-based detailed design and finally verified with CFD simulations.
The method was illustrated by the optimization of 4-stage, 5-stage, 6-stage, and 7-stage axial-flow industrial process compressors with the same mass flow rate and total pressure ratio. The stage average total pressure ratio of the four compressors varies from 1.22 to 1.41. The CFD prediction indicated that the optimized design adiabatic efficiencies increased 0.80%, 2.44%, 0.56% and 1.34% compared to the initial design adiabatic efficiency for the 4—stage, 5—stage, 6—stage, and 7—stage axial-flow industrial process compressors, respectively.
From the analysis of the optimal results, some important preliminary design guidelines can be obtained for the best design efficiency potential of multi-stage axial-flow compressors in a large-scale air separation device, as follows:
- As the number of stages increases, the optimal average aspect ratio increases from 1.44 to 1.58.
- The optimal average solidity varies within a small range from 1.28 to 1.33.
- The best efficiency is attainable at the average reaction range from 0.44 to 0.49 as the stage number increases.
- As the stage number increases, optimal rotation speed decreases from 6125 rpm to 4053 rpm.
- The optimal outlet axial Mach number is approximately 0.34.
- The best efficiency is attainable when the inlet radius ratio is about 0.3.
The developed method is quite generic, releasing the designers to be free from experience dependence. The extension to two-dimensional throughflow-based optimization and three-dimensional blade optimization of compressor is ongoing.
Author Contributions
Conceptualization, F.L. and C.Z.; methodology, F.L.; validation, F.L.; formal analysis, F.L.; investigation, F.L.; resources, F.L.; writing—original draft preparation, F.L.; writing—review and editing, C.Z. All authors have read and agreed to the published version of the manuscript.
Funding
This research received no external funding.
Institutional Review Board Statement
Not applicable.
Informed Consent Statement
Not applicable.
Conflicts of Interest
The authors declare no conflict of interest.
References
- Wadia, A.R.; Wolf, D.P.; Haaser, F.G. Aerodynamic design and testing of an axial flow compressor with pressure ratio of 23.3:1 for the LM2500+ gas turbine. J. Turbomach 2002, 124, 331–340. [Google Scholar] [CrossRef]
- Novak, D.; Loetzerich, M.; Boese, M. Aerodynamic Design and Testing of an Axial Flow Compressor for the GT24/26 Gas Turbines; ASME Paper No. GT2013-95067, June 2013; ASME Press: New York, NY, USA, 2013. [Google Scholar]
- Gallimore, S.J. Axial flow compressor design. Proc. Inst. Mech. Eng. Part C J. Mech. Eng. Sci. 1999, 213, 437–449. [Google Scholar] [CrossRef]
- Smith, L.H. Axial compressor aerodesign evolution at general electric. J. Turbomach 2002, 124, 321–330. [Google Scholar] [CrossRef]
- Wisler, D.C.; Koch, L.H.; Smith, L.H. Preliminary Design Study of Advanced Multistage Axial Flow Code Compressors; Report No. CR-135133; NASA: Washington, DC, USA, 1977.
- Massardo, A.; Satta, A. Axial flow compressor design optimization: Part I—Pitchline analysis and multivariable objective function influence. J. Turbomach 1990, 112, 399–404. [Google Scholar] [CrossRef]
- Zhang, X.W.; Ju, Y.P.; Zhang, C.H. Accuracy and Sensitivity Analysis of Aerodynamic Performance Prediction Models for Multi-Stage Transonic Axial-Flow Compressors; ASME Paper No. GT 2020-15172, June 2020; ASME Press: New York, NY, USA, 2010. [Google Scholar]
- Klapproth, J.F.; Miller, M.L.; Parker, D.E. Aerodynamic development and performance of the CF-6/LM2500 compressor. In Proceedings of the 4th International Symposium on Air Breathing Engines, Orlando, FL, USA, 1–6 April 1979; Paper No. 1979-7030. AIAA: Reston, VA, USA; pp. 243–249. [Google Scholar]
- Wu, C.H. A General Theory of Three-Dimensional Flow in Subsonic and Supersonic Turbomachines of Axial-, Radial, and Mixed-Flow Types; Report no. TN-2604; NACA: Washington, DC, USA, 1952.
- Swan, W. A practical method of predicting transonic-compressor performance. J. Eng. Power 1961, 88, 322–330. [Google Scholar] [CrossRef]
- Smith, L.H. The radial-equilibrium equation of turbomachinery. J. Eng. Power 1966, 88, 1–12. [Google Scholar] [CrossRef]
- Novak, R. Streamline curvature computing procedures for fluid-flow problems. J. Eng. Power 1967, 89, 478–490. [Google Scholar] [CrossRef]
- Boyer, K.M.; O’Brien, W.F. An improved streamline curvature approach for off-design analysis of transonic axial compression systems. J. Turbomach 2003, 125, 475–481. [Google Scholar] [CrossRef]
- Banjac, M.; Petrovic, M.V.; Wiedermann, A. Secondary flows, endwall effects, and stall detection in axial compressor design. J. Turbomach 2015, 137, 051004. [Google Scholar] [CrossRef]
- Li, B.; Gu, C.W.; Li, X.T.; Liu, T.Q.; Xiao, Y.B. Development and application of a throughflow method for high-loaded axial flow compressors. Sci. China Ser. E Technol. Sci 2016, 59, 93–108. [Google Scholar] [CrossRef]
- Acarer, S.; Özkol, Ü. An extension of the streamline curvature through-flow design method for bypass fans of turbofan engines. Proc. Inst. Mech. Eng. Part G J. Aerosp. Eng. 2016, 231, 240–253. [Google Scholar] [CrossRef]
- Zhang, L.Y.; Congiu, F.; Gan, X.P.; Karunakara, D. Performance Prediction and Optimization of Low Pressure Steam Turbine Radial Diffuser at Design and Off-Design Conditions Using Streamline Curvature Method. J. Eng. Gas Turbines Power 2017, 139, 072601. [Google Scholar] [CrossRef]
- Yang, C.; Wu, H.; Yang, J.G.; Ferlauto, M. Time-marching throughflow analysis of multistage axial compressors based on a novel inviscid blade force model. Proc. Inst. Mech. Eng. Part G J. Aerosp. Eng. 2019, 233, 5239–5252. [Google Scholar] [CrossRef]
- Denton, J.D. Multall: An Open Source, CFD Based, Turbomachinery Design System; ASME Paper No. GT2017-63993, September 2017; ASME Press: New York, NY, USA, 2017. [Google Scholar]
- Bruna, D.; Cravero, C.; Turner, M.G.; Merchant, A. An educational software suite for teaching design strategies for multistage axial flow compressors. J. Turbomach 2012, 134, 051010. [Google Scholar] [CrossRef]
- Banjac, M.; Petrovic, M.V. Development of Method and Computer Program for Multistage Axial Compressor Design: Part I—Mean Line Design and Example Cases; ASME paper no. GT2018-75410, June 2018; ASME Press: New York, NY, USA, 2018. [Google Scholar]
- Keskin, A.; Bestle, D. Application of multi-objective optimization to axial compressor preliminary design. Aerosp. Sci. Technol 2006, 10, 581–589. [Google Scholar] [CrossRef]
- Adjei, R.A.; Wang, W.Z.; Liu, Y.Z. Aerodynamic Design Optimization of an Axial Flow Compressor Stator Using Parameterized Free-Form Deformation. J. Eng. Gas Turbines Power 2019, 141, 101015. [Google Scholar] [CrossRef]
- Lieblein, S. Loss and stall analysis of compressor cascades. J. Basic Eng. 1959, 81, 387–400. [Google Scholar] [CrossRef]
- Cui, C.; Zhou, Z.G.; Zhang, J.H.; Tao, S. Influence of key geometric parameters on the aerodynamic performance of a supersonic compressor cascade. Proc. Inst. Mech. Eng. Part G J. Aerosp. Eng. 2018, 232, 2338–2348. [Google Scholar] [CrossRef]
- Koch, C.C.; Smith, L.H. Loss sources and magnitudes in axial-flow compressors. J. Eng. Power 1976, 98, 411–424. [Google Scholar] [CrossRef]
- Ronald, J.S. Design of 9.271-Pressure-Ratio Five-Stage Core Compressor and Overall Performance for First Three Stages; Report no. TP-2597; NASA: Washington, DC, USA, 1986.
- Lieblein, S. Incidence and deviation-angle correlations for compressor cascades. J. Basic Eng. 1960, 82, 575–584. [Google Scholar] [CrossRef]
- Johnsen, I.A.; Bullock, R.O. Aerodynamic Design of Axial Flow Compressors; Report No. SP-36; NASA: Washington, DC, USA, 1965.
- Jansen, W. The Application of End-Wall Boundary Layer Effects in the Performance Analysis of Axial Compressors; ASME Paper No. 67-WA/GT-11, June 1967; ASME Press: New York, NY, USA, 1967. [Google Scholar]
- Ju, Y.P.; Zhang, C.H. Multi-point and multi-objective optimization design method for industrial axial compressor cascades. Proc. Inst. Mech. Eng. Part C J. Mech. Eng. Sci. 2011, 225, 1481–1493. [Google Scholar] [CrossRef]
- Ju, Y.P.; Zhang, C.H. Multi-point robust design optimization of wind turbine airfoil under geometric uncertainty. Pro IMechE Part A J. Power Energy 2012, 226, 245–261. [Google Scholar] [CrossRef]
- Ju, Y.P.; Zhang, C.H. Optimization of centrifugal impellers for uniform discharge flow and wide operating range. J. Propul. Power 2012, 28, 888–899. [Google Scholar] [CrossRef]
- Lonnie, R.; Royce, D.M. Performance of Single-Stage Axial-Flow Transonic Compressor with Rotor and Stator Aspect Ratios of 1.19 and 1.26, Respectively, and with Design Pressure Ratio of 1.82; Report No. TP-1338; NASA: Washington, DC, USA, 1978.
Publisher’s Note: MDPI stays neutral with regard to jurisdictional claims in published maps and institutional affiliations. |
© 2021 by the authors. Licensee MDPI, Basel, Switzerland. This article is an open access article distributed under the terms and conditions of the Creative Commons Attribution (CC BY) license (https://creativecommons.org/licenses/by/4.0/).