
Experimental Reflection Evaluation for Attitude Monitoring of Space Orbiting Systems with NRL Arch Method


Abstract
:1. Introduction
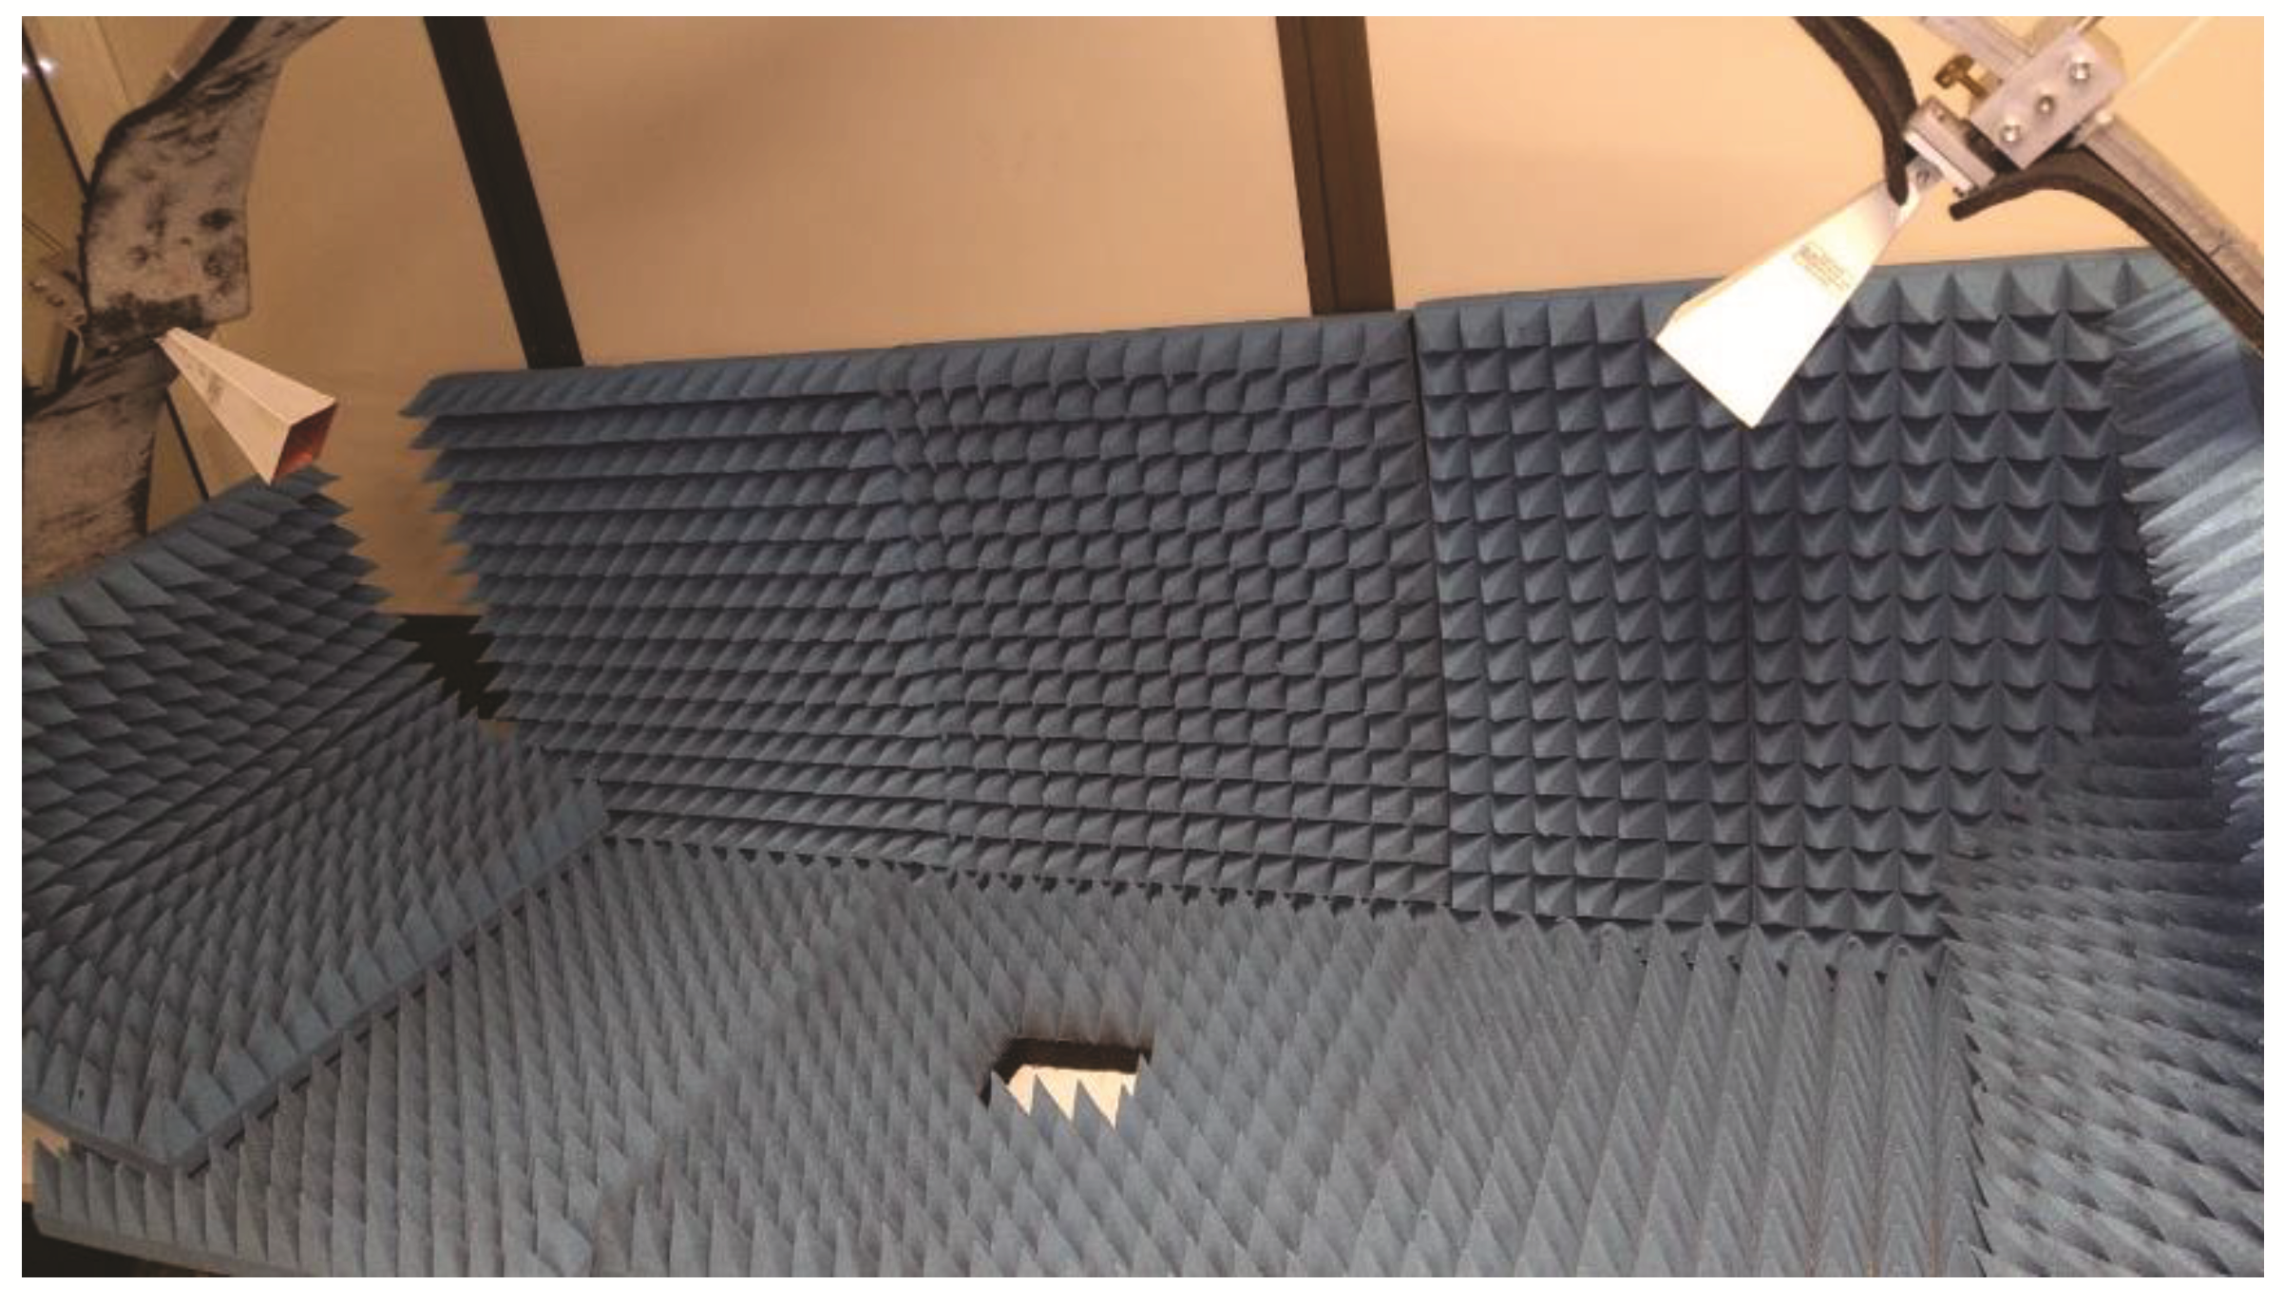
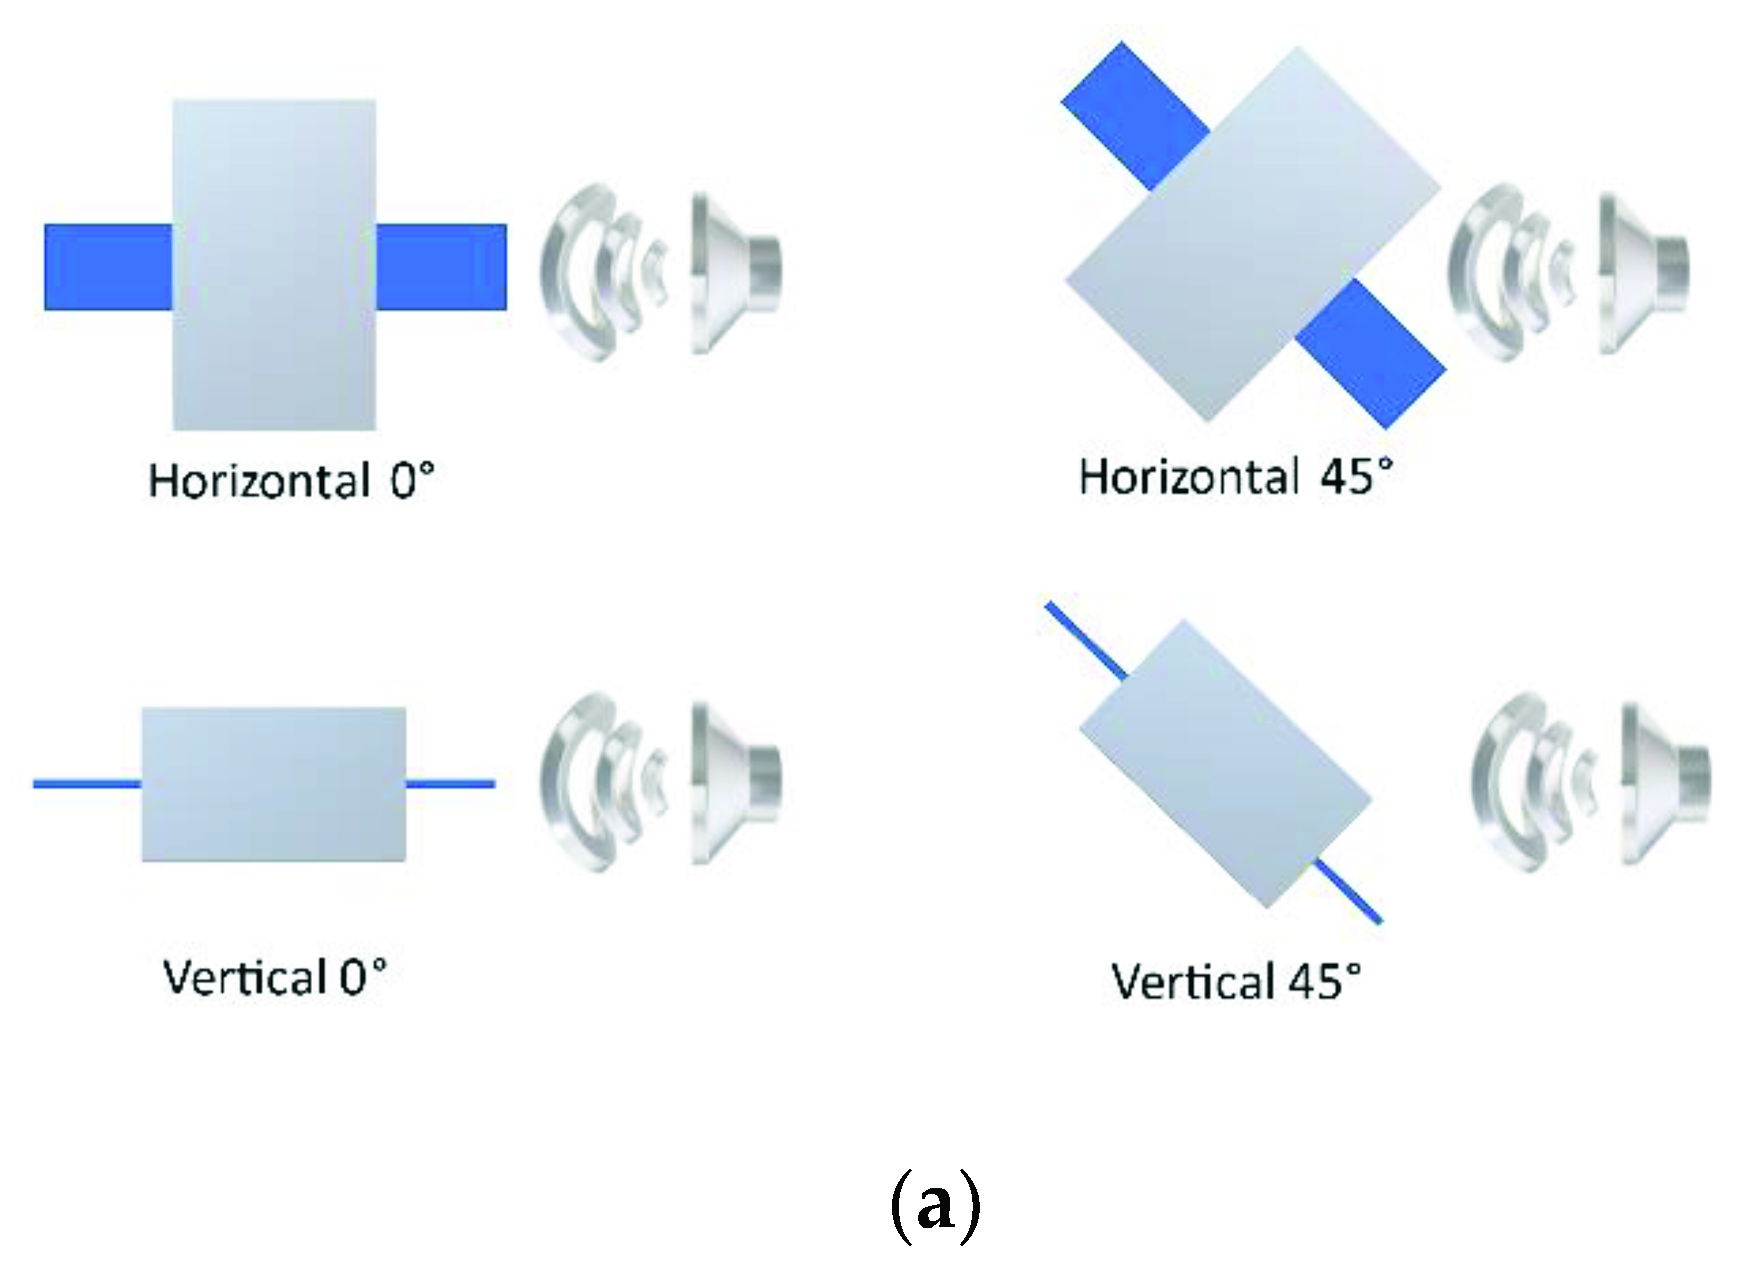
2. Materials and Methods
3. Results and Discussion
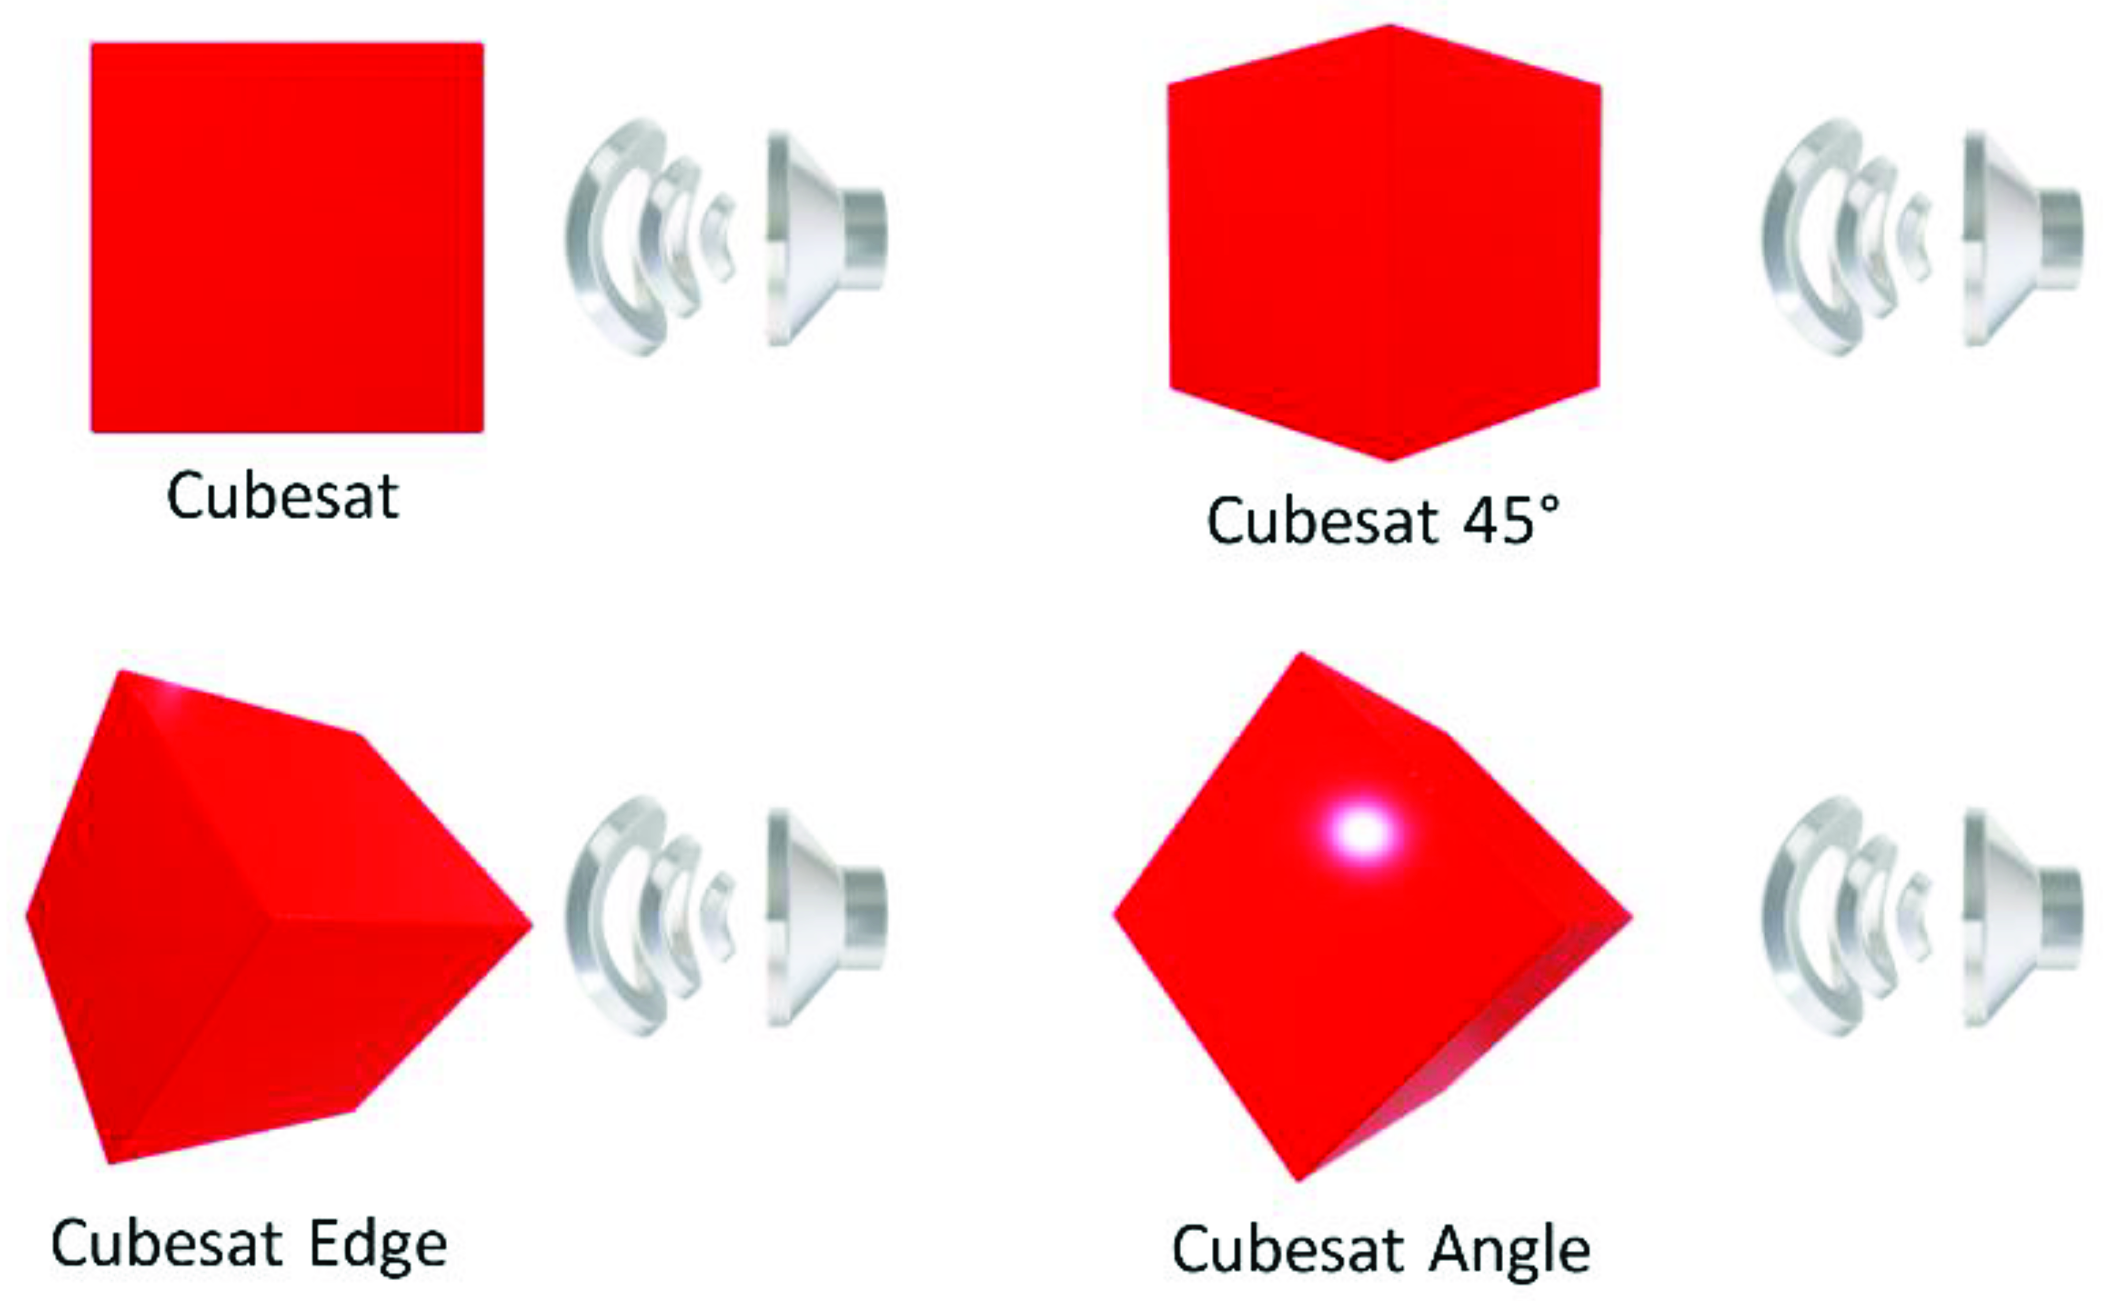
3.1. Cubesat
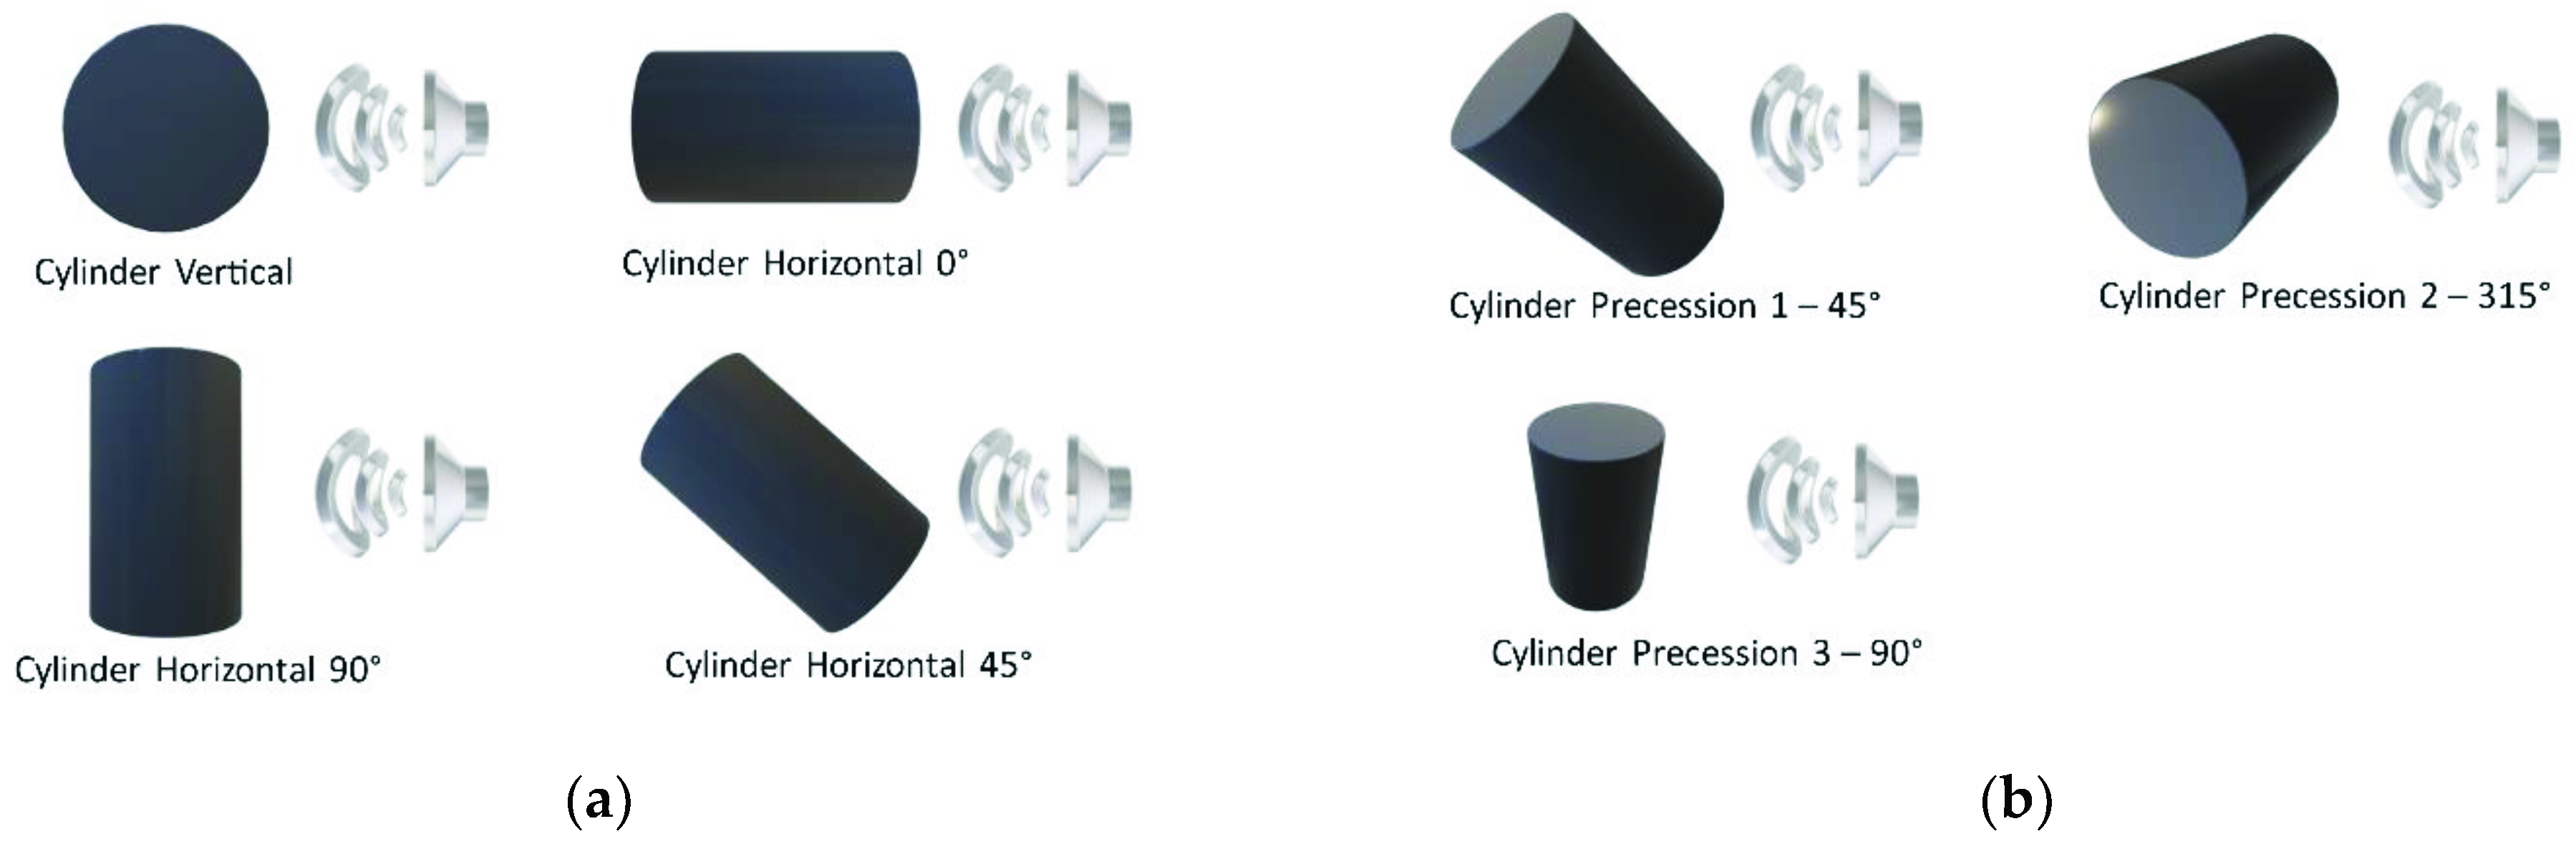
3.2. Cylinder
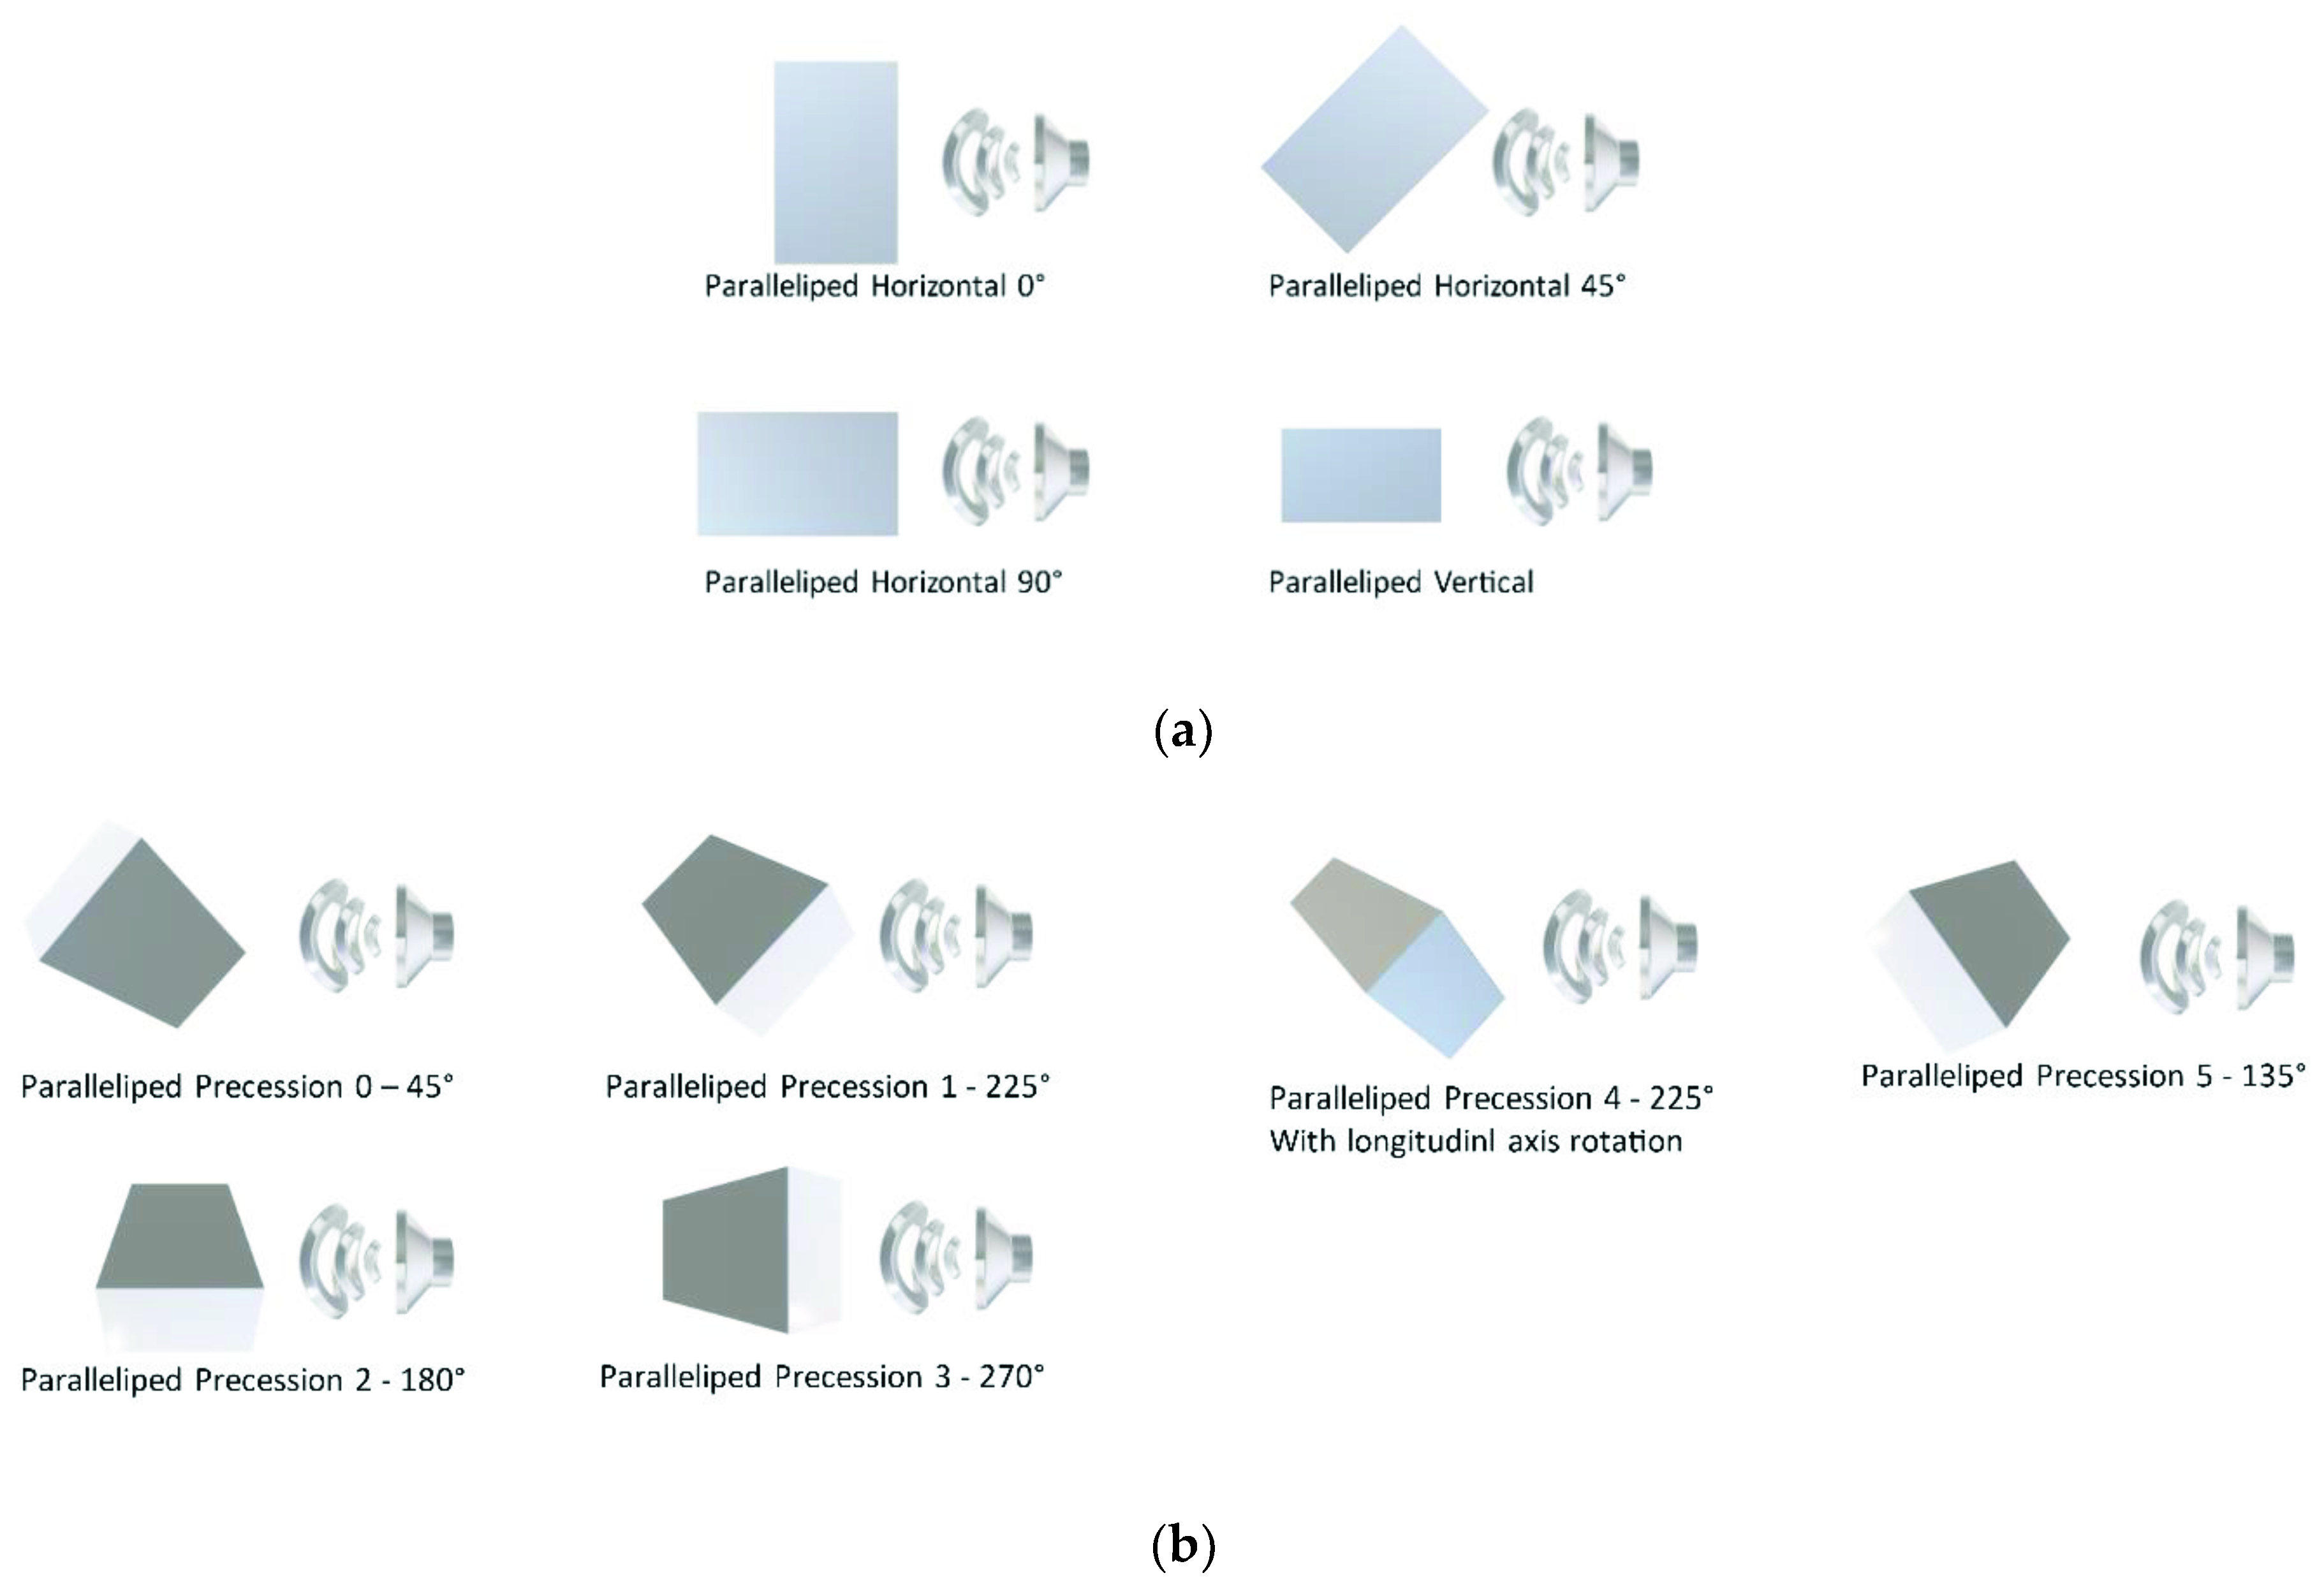
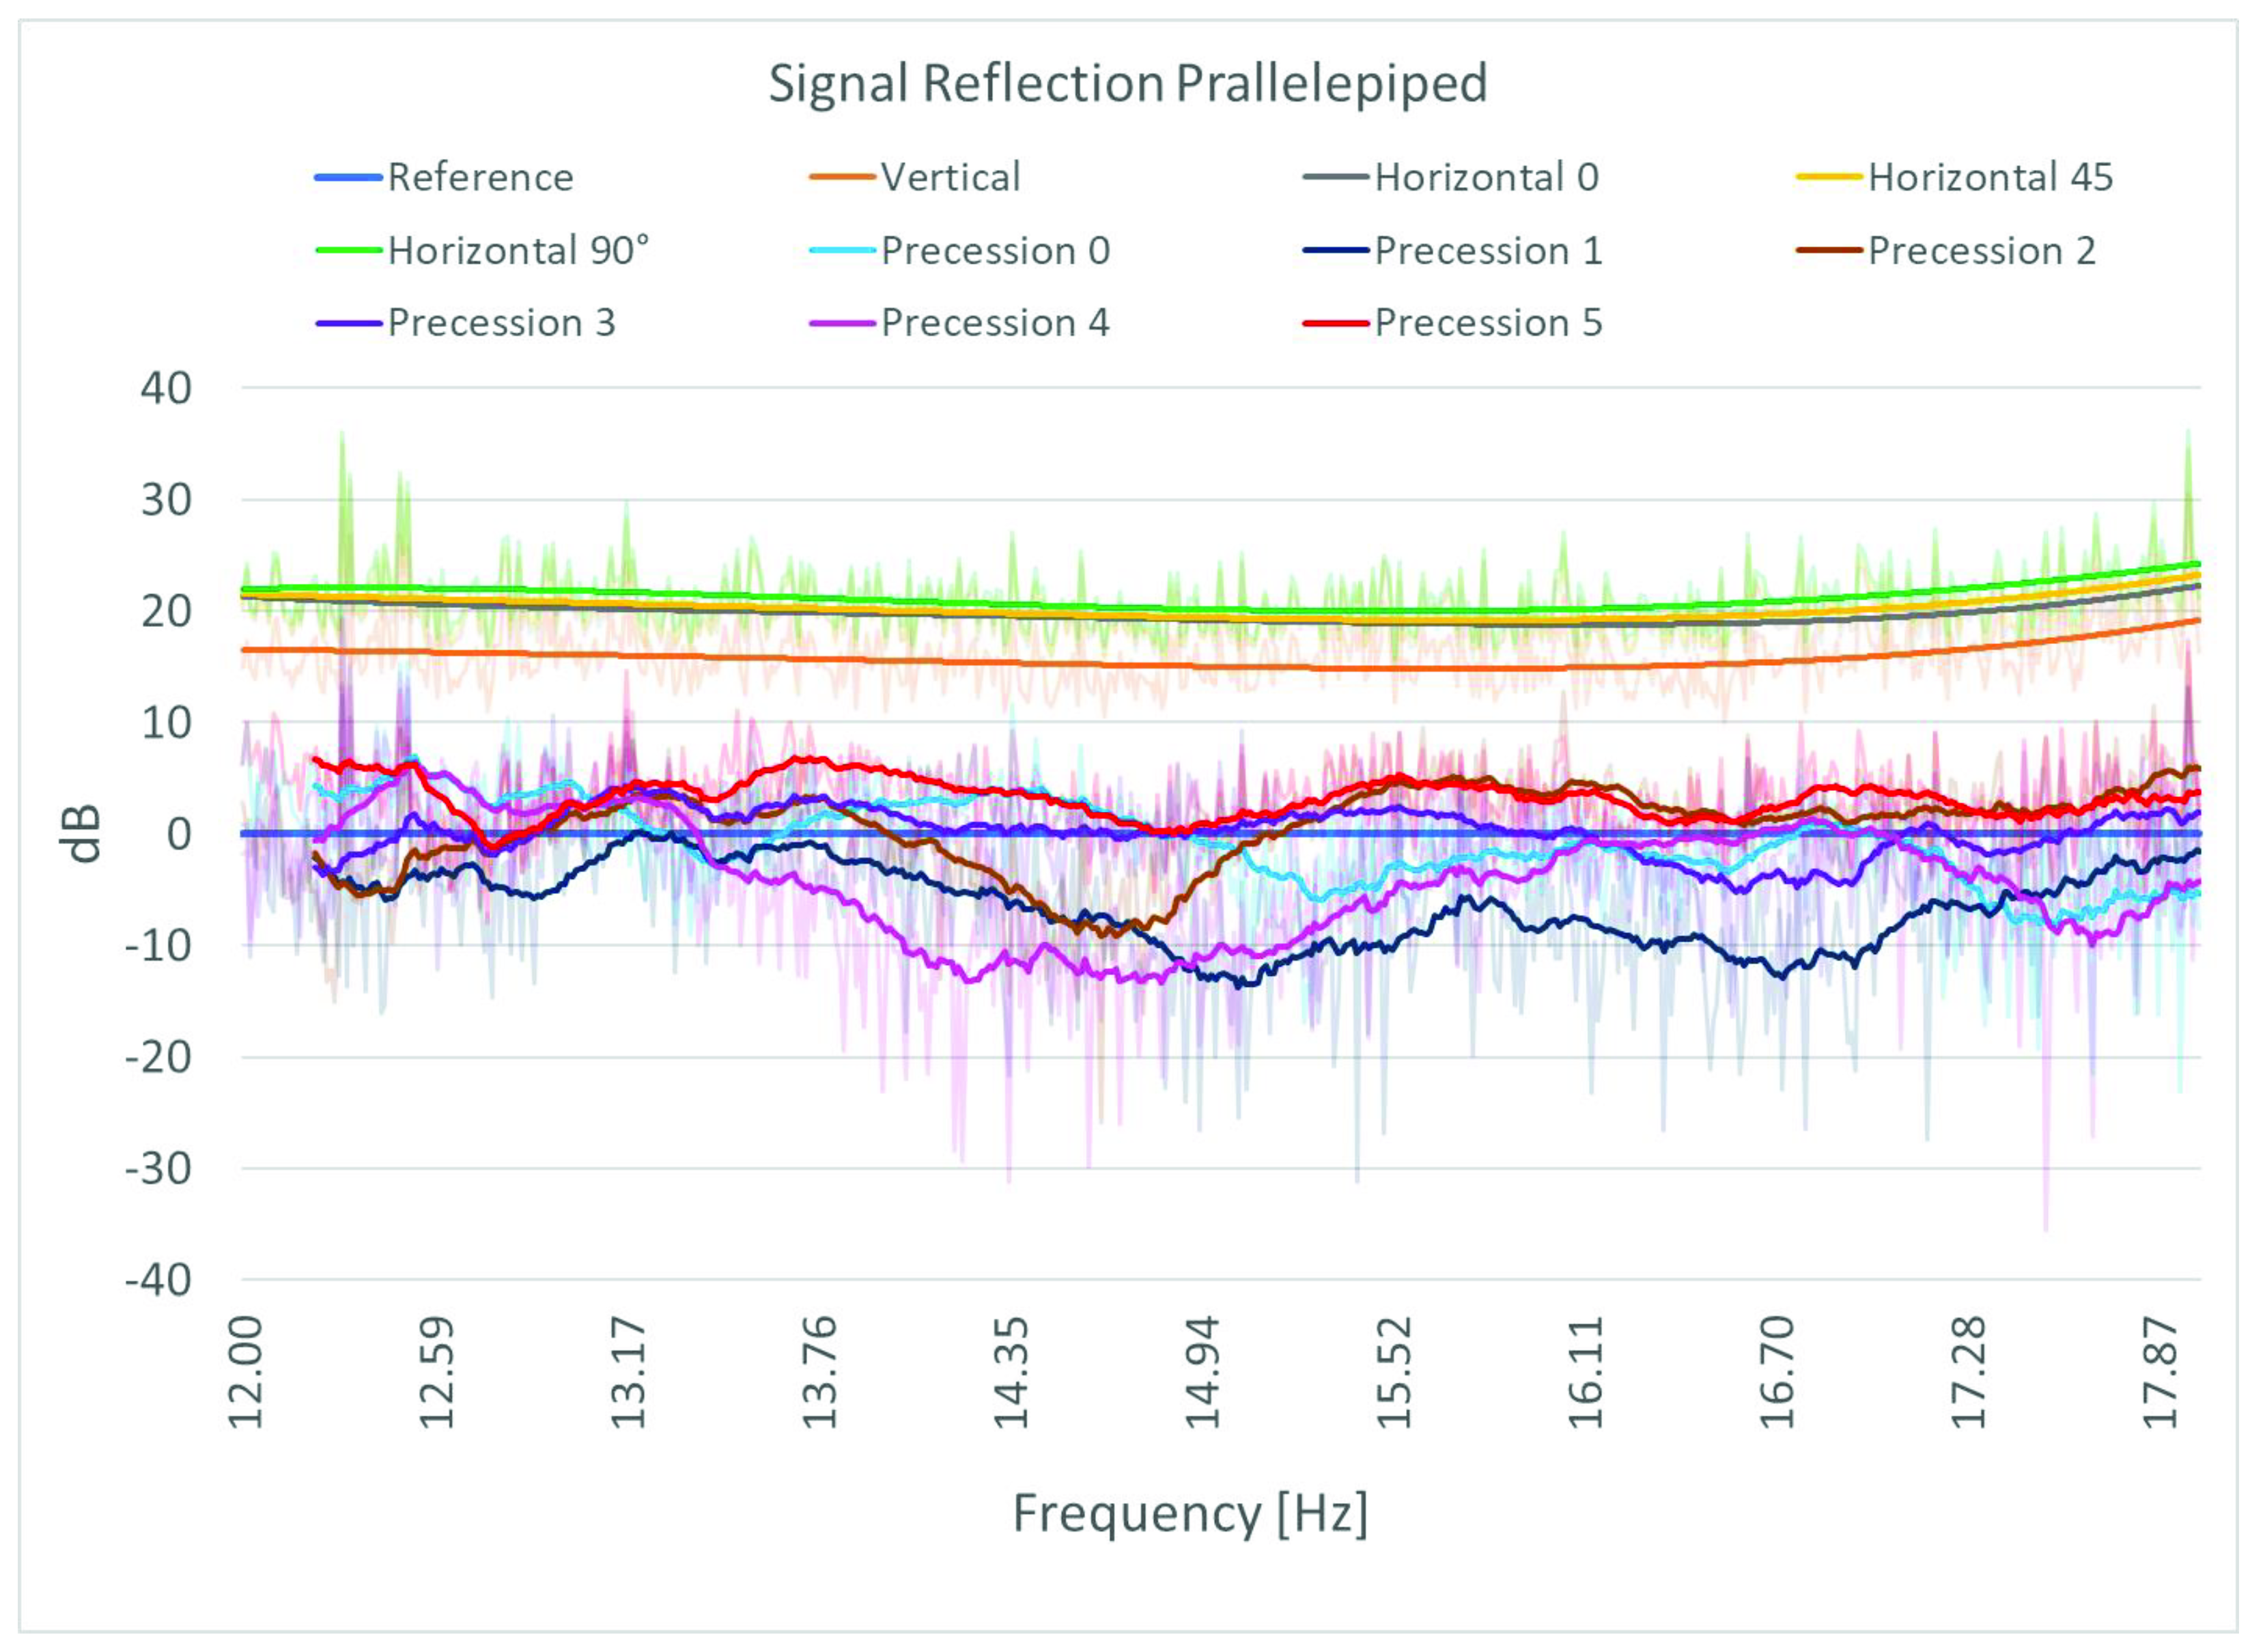
3.3. Parallelepiped
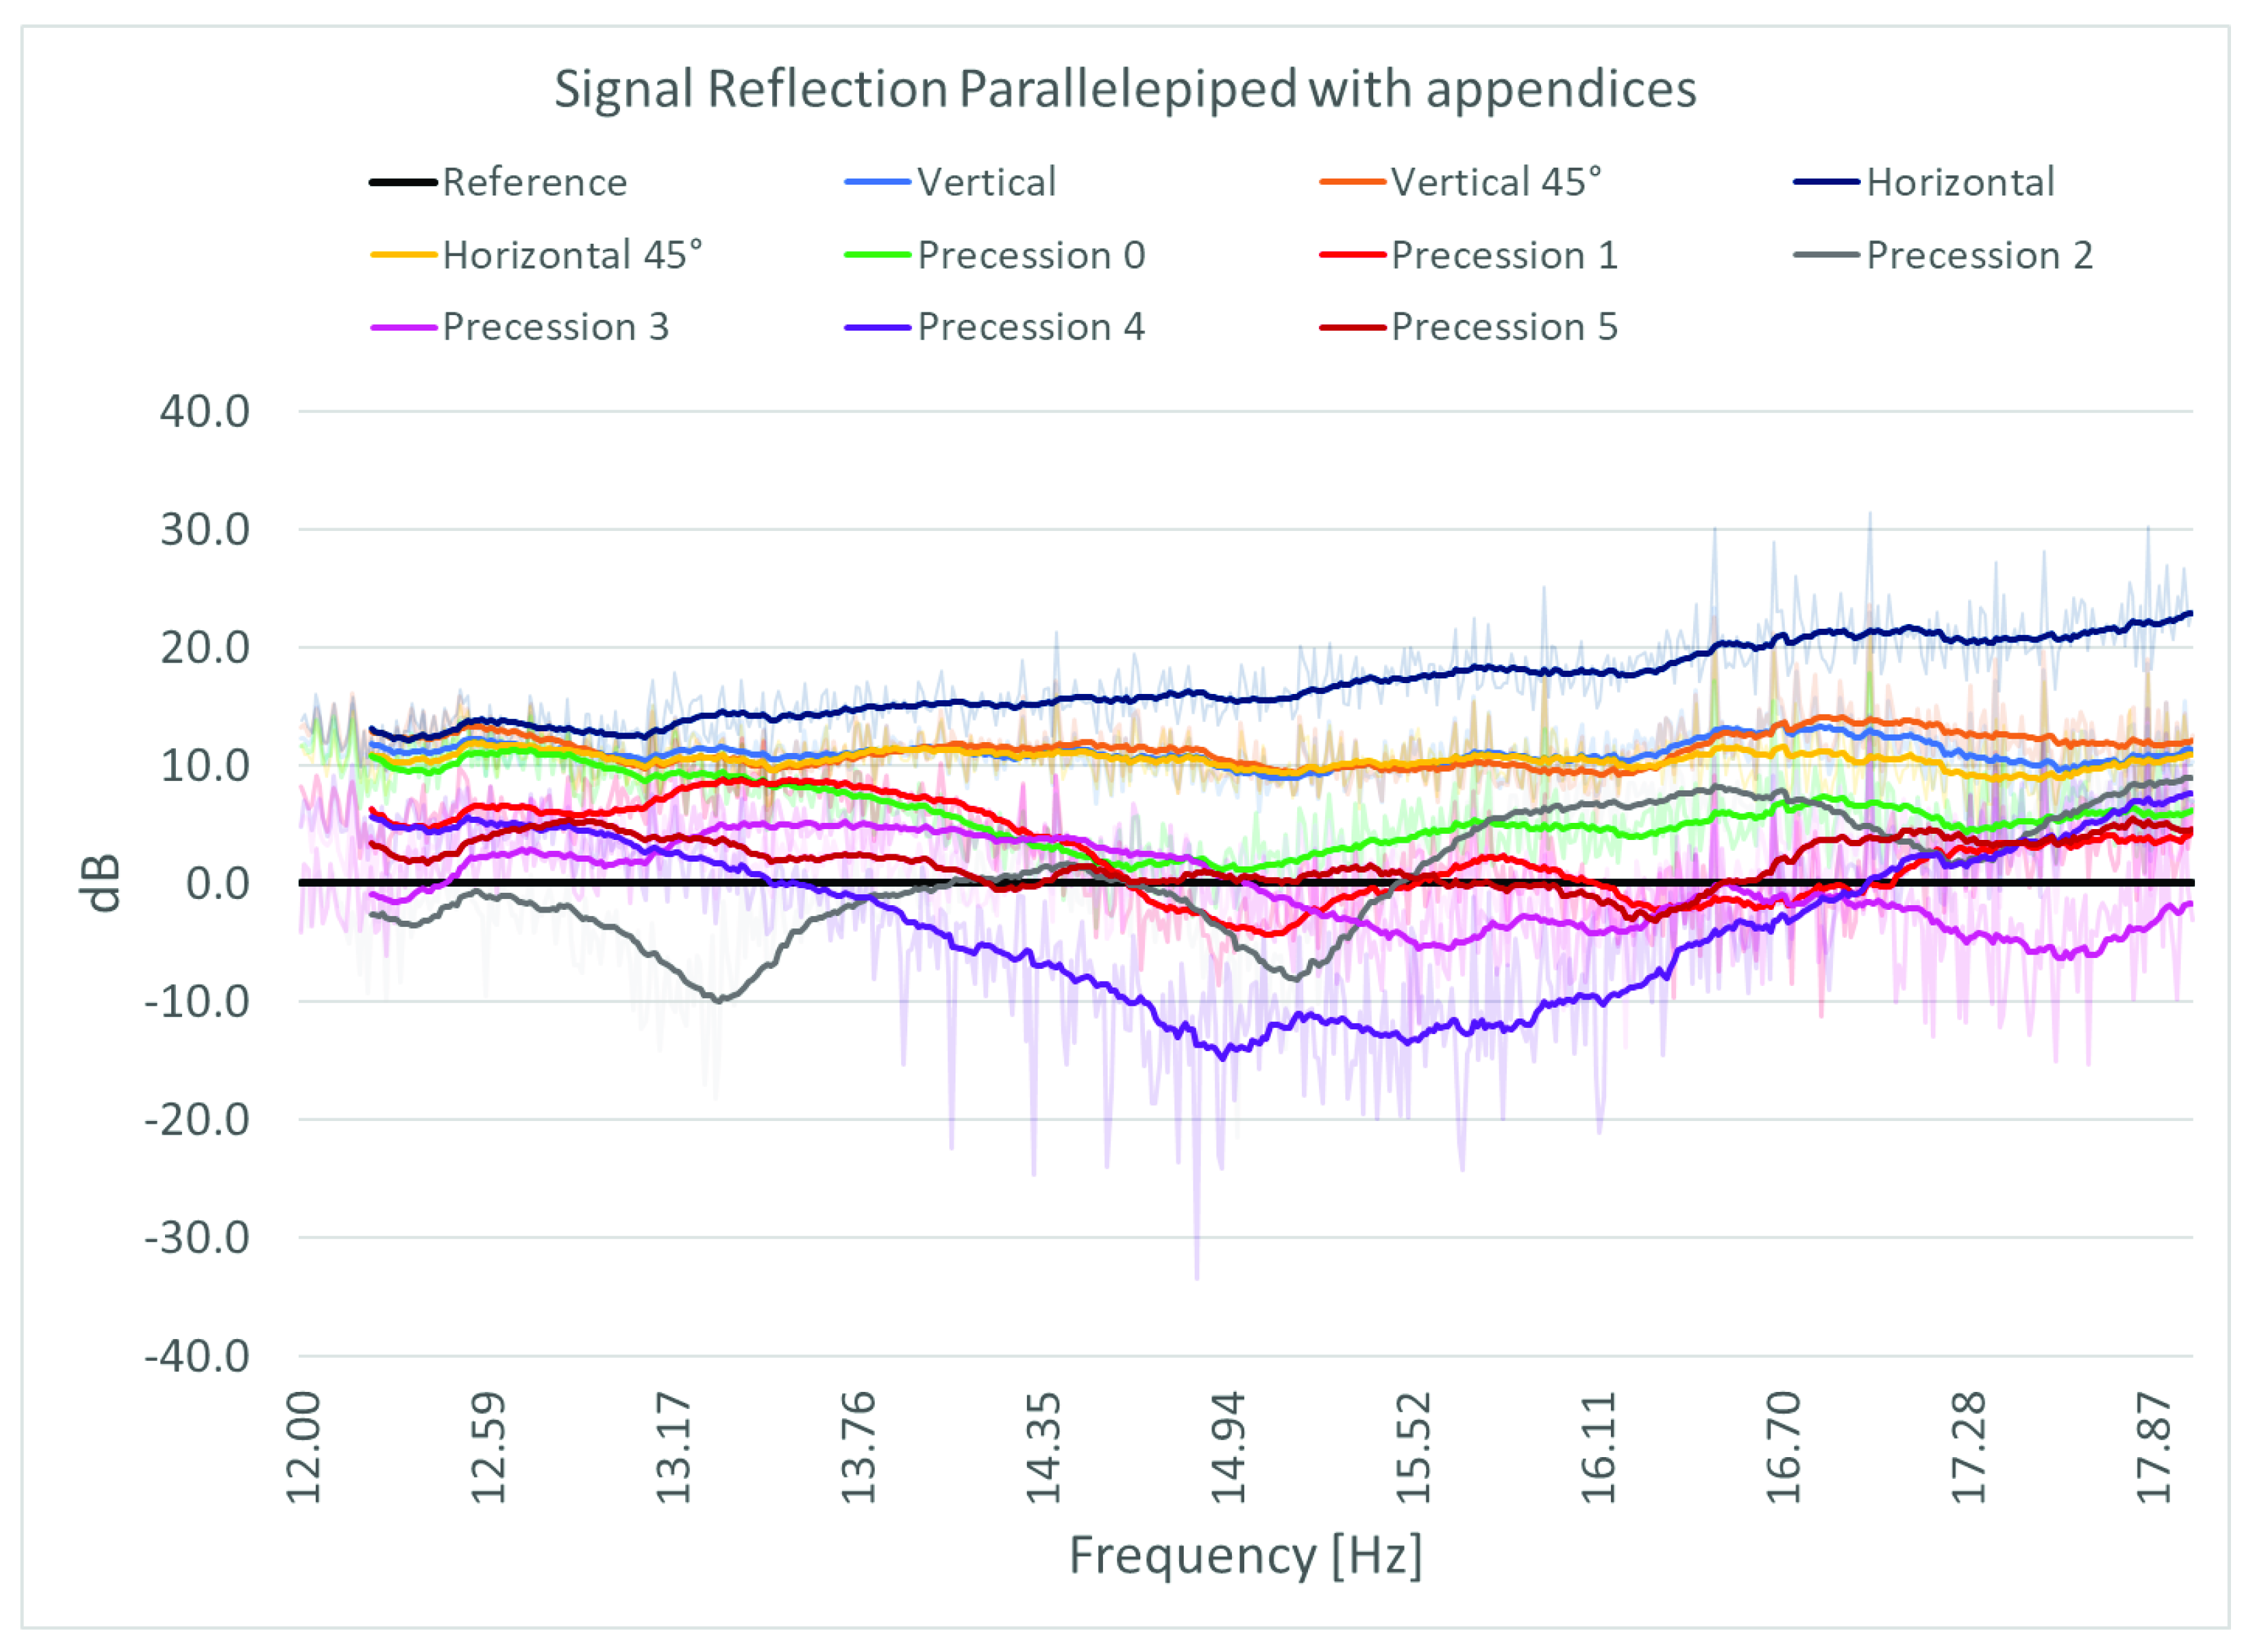
3.4. Prallelepiped with Appendices
4. Conclusions
Author Contributions
Funding
Conflicts of Interest
References
- European Union. Decision No 541/2014/EU of the European Parliament and of the Council establishing a framework for space surveillance and tracking support. Off. J. Eur. Union 2014, 1, 158–227. [Google Scholar]
- Shan, M.; Guo, J.; Gill, E. Review and comparison of active space debris capturing and removal methods. Prog. Aerosp. Sci. 2016, 80, 18–32. [Google Scholar] [CrossRef]
- Hossein, S.H.; Acernese, M.; Cardona, T.; Cialone, G.; Curianò, F.; Mariani, L.; Marini, V.; Marzioli, P.; Parisi, L.; Piergentili, F.; et al. Sapienza space debris observatory network (SSON): A high coverage infrastructure for space debris monitoring. J. Space Saf. Eng. 2020, 7, 30–37. [Google Scholar] [CrossRef]
- Marzioli, P.; Gianfermo, A.; Frezza, L.; Amadio, D.; Picci, N.; Curianò, F.; Pancalli, M.G.; Vestito, E.; Schachter, J.; Szczerba, M.; et al. Usage of light emitting diodes (LEDs) for improved satellite tracking. Acta Astronaut. 2021, 179, 228–237. [Google Scholar] [CrossRef]
- Picci, N.; Pancalli, M.G.; Gianfermo, A.; Marzioli, P.; Frezza, L.; Amadio, D.; Curianò, F.; Vestito, E.; Schachter, J.; Szczerba, M.; et al. Development and qualification of a LED-based payload for a CubeSat platform: LEDSAT mission. In Proceedings of the International Astronautical Congress, IAC, Dubai, United Arab Emirates, 12–16 October 2020. [Google Scholar]
- Piergentili, F.; Ravaglia, R.; Santoni, F. Close approach analysis in the geosynchronous region using optical measurements. J. Guid. Control. Dyn. 2014, 37, 705–710. [Google Scholar] [CrossRef]
- Porfilio, M.; Piergentili, F.; Graziani, F. The 2002 Italian optical observations of the geosynchronous region. Adv. Astronaut. Sci. 2003, 114, 1237–1252. [Google Scholar]
- Piergentili, F.; Zarcone, G.; Parisi, L.; Mariani, L.; Hossein, S.H.; Santoni, F. LEO object’s light-curve acquisition system and their inversion for attitude reconstruction. Aerospace 2020, 8, 4. [Google Scholar] [CrossRef]
- Cardona, T.; Seitzer, P.; Rossi, A.; Piergentili, F.; Santoni, F. BVRI photometric observations and light-curve analysis of GEO objects. Adv. Space Res. 2016, 58, 514–527. [Google Scholar] [CrossRef]
- Piergentili, F.; Santoni, F.; Seitzer, P. Attitude determination of orbiting objects from lightcurve measurements. IEEE Trans. Aerosp. Electron. Syst. 2017, 53, 81–90. [Google Scholar] [CrossRef]
- Santoni, F.; Piergentili, F. UNISAT-3 attitude determination using solar panel and magnetometer data. In Proceedings of the International Astronautical Congress, IAC, Fukuoka, Japan, 16–21 October 2005. [Google Scholar]
- Vellutini, E.; Bianchi, G.; Pardini, C.; Anselmo, L.; Pisanu, T.; Di Lizia, P.; Piergentili, F.; Monaci, F.; Reali, M.; Villadei, W.; et al. Monitoring the final orbital decay and the re-entry of Tiangong-1 with the Italian SST ground sensor network. J. Space Saf. Eng. 2020, 7, 487–501. [Google Scholar] [CrossRef]
- Micheli, D.; Vricella, A.; Pastore, R.; Marchetti, M. Synthesis and electromagnetic characterization of frequency selective radar absorbing materials using carbon nanopowders. Carbon 2014, 77, 756–774. [Google Scholar] [CrossRef]
- Umari, M.; Ghodgaonkar, D.; Varadan, V. A free-space bistatic calibration technique for the measurement of parallel and perpendicular reflection coefficients of planar samples. IEEE Trans. Instrum. Meas. 1991, 40, 19–24. [Google Scholar] [CrossRef]
- Emerson & Cuming Microwave Products. Nrl arch reflectivity testing basic notes. Tech. Bull. 101.
- Joseph, J.C. Multiple Angle of Incidence Measurement Technique for the Permittivity and Permeability of Lossy Materials at Millimeter Wavelengths. Master’s Thesis, Air Force Institute of Technology, Wright-Patterson, OH, USA, 1 December 1986. [Google Scholar]
- Ghodgaonkar, D.K.; Varadan, V.V.; Varadan, V.K. A new free-space method for explicit determination of complex permittivity and complex permeability of magnetic materials at microwave frequencies using bistatic measurements. In Proceedings of the URSI Radio Science Meeting Program and Abstracts, University of Colorado, Boulder, CO, USA, 4–6 January 1989. [Google Scholar]
- Cullen, A.L. A new free-wave method for ferrite measurement at millimeter wavelengths. Radio Sci. 1987, 22, 1168–1170. [Google Scholar] [CrossRef]
- Hassan, N.; Idris, H.A.; Abd Malek, M.F.; Taib, M.N.; Ali, W.K.W.; Soh, P.J.; Al-Hadi, A.A.; Hoon, W.F. Measurement of pyramidal microwave absorbers using RCS methods. In Proceedings of the 2010 International Conference on Intelligent and Advanced Systems, Kuala Lumpur, Malaysia, 15–17 June 2010. [Google Scholar]
- Micheli, D.; Apollo, C.; Gradoni, G.; Pastore, R.; Bueno Morless, R.; Marchetti, M. Experimental validation of theoretical microwave absorbing structure design methods, in electromagnetic absorption and shielding of composite materials and nanomaterials. Riv. Ital. Compos. Nanotecnol. 2011, 7, 257–282. [Google Scholar]


| Specimen | Dimensions |
|---|---|
 | Cubesat Characteristics Dimensions of 0.1 m per side, attributable respectively to a satellite of 3 m per side at 12 GHz and to one of 4.4 m at 18 GHz. |
 | Cylinder Characteristics Dimensions: Height: 0.075 m, Diameter: 0.065 m attributable respectively to a satellite of 2.25 m in height at 12 GHz and to one of 3.3 m at 18 GHz. |
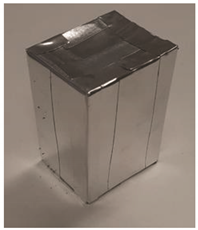 | Parallelepiped Characteristics Dimensions: Height: 0.08 m, Width: 0.06 m, Thickness: 0.04 m attributable respectively to a satellite 2.4 m high at 12 GHz and one of 3.5 high at 18 GHz. |
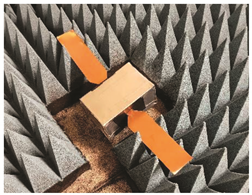 | Parallelepiped Characteristics plus Appendices size: 0.12 × 0.02 each, the whole object corresponding to satellites with a body 2.4 m high at 12 GHz and a body 3.5 m high at 18 GHz, with appendices spanning 3.6 m and 5.3 m, respectively. |
Publisher’s Note: MDPI stays neutral with regard to jurisdictional claims in published maps and institutional affiliations. |
© 2021 by the authors. Licensee MDPI, Basel, Switzerland. This article is an open access article distributed under the terms and conditions of the Creative Commons Attribution (CC BY) license (https://creativecommons.org/licenses/by/4.0/).
Share and Cite
Delfini, A.; Pastore, R.; Piergentili, F.; Santoni, F.; Marchetti, M. Experimental Reflection Evaluation for Attitude Monitoring of Space Orbiting Systems with NRL Arch Method. Appl. Sci. 2021, 11, 8632. https://doi.org/10.3390/app11188632
Delfini A, Pastore R, Piergentili F, Santoni F, Marchetti M. Experimental Reflection Evaluation for Attitude Monitoring of Space Orbiting Systems with NRL Arch Method. Applied Sciences. 2021; 11(18):8632. https://doi.org/10.3390/app11188632
Chicago/Turabian StyleDelfini, Andrea, Roberto Pastore, Fabrizio Piergentili, Fabio Santoni, and Mario Marchetti. 2021. "Experimental Reflection Evaluation for Attitude Monitoring of Space Orbiting Systems with NRL Arch Method" Applied Sciences 11, no. 18: 8632. https://doi.org/10.3390/app11188632
APA StyleDelfini, A., Pastore, R., Piergentili, F., Santoni, F., & Marchetti, M. (2021). Experimental Reflection Evaluation for Attitude Monitoring of Space Orbiting Systems with NRL Arch Method. Applied Sciences, 11(18), 8632. https://doi.org/10.3390/app11188632