Featured Application
Dual-modal T1 and T2 magnetic resonance imaging contrast agent.
Abstract
Surface-coating polymers contribute to nanoparticle-based magnetic resonance imaging (MRI) contrast agents because they can affect the relaxometric properties of the nanoparticles. In this study, polyaspartic acid (PASA)-coated ultrasmall Gd2O3 nanoparticles with an average particle diameter of 2.0 nm were synthesized using the one-pot polyol method. The synthesized nanoparticles exhibited r1 and r2 of 19.1 and = 53.7 s−1mM−1, respectively, (r1 and r2 are longitudinal and transverse water–proton spin relaxivities, respectively) at 3.0 T MR field, approximately 5 and 10 times higher than those of commercial Gd-chelate contrast agents, respectively. The T1 and T2 MR images could be obtained due to an appreciable r2/r1 ratio of 2.80, indicating their potential as a dual-modal T1 and T2 MRI contrast agent.
1. Introduction
Biocompatible magnetic nanoparticles have drawn attention owing to their potential applications in biomedical theragnosis [1,2,3,4]. Among various biomedical applications, magnetic resonance imaging (MRI) contrast agents have been an issue because MR image sensitivity and resolution can be improved using contrast agents [5,6,7,8]. Thus, nanoparticles with advanced magnetics properties have been investigated to develop advanced MRI contrast agents [9,10,11].
The clinically available Gd-chelates act as positive (or T1) MRI contrast agents due to their efficient induction of longitudinal (or T1) water–proton spin relaxation with respect to transverse (or T2) water–proton spin relaxation, providing r2/r1 ratios (r1 and r2 are longitudinal and transverse water–proton spin relaxivities, respectively), which are close to one [5,6]. This is due to a high pure spin magnetic moment (S = 7/2) of Gd3+ [5]. The r1 values of Gd-chelates are low [5,6,7,8]. However, the r1 values and as a result, imaging performance can be improved using ultrasmall Gd2O3 nanoparticles because of their high Gd-densities per nanoparticle and appreciable nanoparticle magnetic moments [11]. The ultrasmall Gd2O3 nanoparticles have shown r1 values higher than those of commercial Gd-chelates [11,12,13,14].
To use ultrasmall Gd2O3 nanoparticles as T1 MRI contrast agents, surface coating is necessary to endow them with hydrophilicity and biocompatibility [15]. In addition, surface-coating ligands can affect their r1 and r2 values [16,17] because these values depend on the water-attracting power of surface-coating ligands around Gd2O3 nanoparticles. According to the inner-sphere model [5], water molecules close to Gd2O3 nanoparticles can affect the r1 value, whereas the remaining water molecules can contribute to the r2 value according to the outer-sphere model [5,18]. Therefore, surface-coating ligands may allow us to vary the r2/r1 ratio and as a result, T1 and T2 imaging modes of ultrasmall Gd2O3 nanoparticles. In this study, polyaspartic acid (PASA), which is a biodegradable and hydrophilic amino acid polymer [19], was used as a surface-coating ligand. PASA-coated ultrasmall Gd2O3 nanoparticles exhibited an appreciable r2/r1 ratio, thus allowing us to obtain both T1 and T2 MR images.
In this study, PASA-coated ultrasmall Gd2O3 nanoparticles were synthesized using the one-pot polyol method. The synthesized nanoparticles were subject to various analyses to characterize their particle size, colloidal stability, surface coating, in vitro cellular toxicity, and magnetic and relaxometric properties. They were applied to in vivo MRI in mice to obtain both T1 and T2 MR images.
2. Materials and Methods
2.1. Chemicals
GdCl3∙6H2O (99.9%), NaOH (99.9%), triethylene glycol (TEG) (99.9%), and poly–(αβ)-DL-aspartic acid (PASA) sodium salt (Mw = ~9900 amu) were purchased from Sigma Aldrich, St. Louis, MO, USA. C2H5OH (99.99%) was purchased from Duksan, Anshan, South Korea, and used for the initial washing of nanoparticles. All chemicals were used as received. Triple-distilled water was used for the final washing of nanoparticles and preparation of nanoparticle solution (i.e., suspension) samples.
2.2. Synthesis
PASA-coated Gd2O3 nanoparticles were synthesized through a polyol method (Figure 1). An amount of 0.5 mmol of GdCl3∙6H2O and 0.1 mmol of PASA were added to 10 mL TEG in a three-necked round-bottom flask. The mixture was magnetically stirred at room temperature under atmospheric conditions until the precursor and PASA dissolved in TEG. In a separate beaker, NaOH solution was prepared by dissolving 2.0 mmol of NaOH in 10 mL TEG at room temperature using a magnetic stirrer. The NaOH solution was slowly added to the precursor solution using a pipette until the pH of the solution reached ~10. At constant pH, the reaction temperature increased from room temperature to 110 °C and was maintained at that temperature for 15 h with magnetic stirring. After the reaction completion, the product solution was cooled to room temperature and transferred to a 500 mL beaker. The product nanoparticles were washed thrice with 400 mL ethanol. For this step, the product solution was magnetically stirred for 10 min and then, stored at a cool place (4 °C) until the nanoparticles settled down. The supernatant was decanted and the remaining product solution was washed again using ethanol. To remove ethanol and concentrate the nanoparticle solution sample, 400 mL triple-distilled water was added to the product solution and rotary evaporation was used to reduce the solution volume to approximately 50 mL. This process was repeated thrice. The obtained concentrated nanoparticle solution sample was split into two equal volumes: one part was subject to air-drying to obtain a powder sample for various characterizations and the other part was diluted using triple-distilled water to obtain a nanoparticle solution sample (30–50 mM Gd) for cytotoxicity and MRI analyses.

Figure 1.
One-step polyol synthesis of PASA-coated Gd2O3 nanoparticles.
2.3. Characterizations
The particle diameter (d) of the nanoparticles was measured using a high-resolution transmission electron microscope (HRTEM) (Titan G2 Chemi STEM CS Probe, FEI, Hillsboro, OR, USA) operated at 200 kV acceleration voltage. The copper grid (PELCO No.160, TED PELLA, Inc., Redding, CA, USA) covered with carbon film was used to support nanoparticles for imaging. The hydrodynamic diameter (a) and zeta potential (ξ) were measured using a dynamic light scattering (DLS) particle size and zeta potential analyzer (Zetasizer Nano ZS, Malvern, Malvern, UK) using a 0.01 mM Gd solution sample. The crystal structural analyses of the nanoparticles before and after thermogravimetric analysis (TGA) were conducted using a multi-purpose powder X-ray diffraction (XRD) spectrometer (X’PERT PRO MRD, Philips, The Netherlands) with unfiltered CuKα radiation (λ = 1.54184 Å). The Gd-concentration of the aqueous nanoparticle solution sample was measured using an inductively coupled plasma-atomic emission spectrometer (ICP-AES) (IRIS/AP, Thermo Jarrell Ash Co., Waltham, MA, USA). A Fourier transform-infrared (FT-IR) absorption spectrometer (Galaxy 7020A, Mattson Instrument, Inc., Madison, WI, USA) was used to study the surface coating of the nanoparticles. To record FT-IR absorption spectra, pellets of the powder samples in KBr were prepared and the spectra were recorded between 400 and 4000 cm−1. A TGA instrument (SDT-Q600, TA Instrument, New Castle, DE, USA) was used to record the TGA curve of the powder sample between room temperature and 900 °C while air flowed over the sample. The average amount of PASA polymers coating a nanoparticle was quantified from the mass drop in the TGA curve after considering the initial mass drop from room temperature to ~110 °C due to water desorption. A vibrating sample magnetometer (VSM) (7407-S, Lake Shore Cryotronics Inc., Westerville, OH, USA) was used to obtain the magnetic properties of the powder sample by recording a magnetization (M) versus applied field (H) (or M−H) curve (−2.0 T ≤ H ≤ 2.0 T) at 300 K. The net M value of the sample (i.e., only the Gd2O3 nanoparticles without PASA coating) was estimated using the net mass of Gd2O3 nanoparticles extracted from the TGA curve.
2.4. In Vitro Cytotoxicity Tests
Cellular toxicity of an aqueous nanoparticle solution sample was assessed using a CellTiter-Glo Luminescent Cell Viability Assay (Promega, Madison, WI, USA). In this assay, a luminometer (Synergy HT, BioTek, Winooski, VT, USA) was used to quantify intracellular adenosine triphosphate. Human prostate cancer (DU145) and normal mouse hepatocyte (NCTC 1469) cell lines were used as test cells. Dulbecco’s Modified Eagle medium and Rosewell Park Memorial Institute-1640 culture media were used for NCTC1469 and DU145 cells, respectively. Both cells were seeded on a 24-well cell culture plate and incubated for 24 h (5 × 10⁴ cell densities, 500 μL cells per well, 5% CO2, and 37 °C). Five test nanoparticle solution samples were prepared by diluting an original nanoparticle solution sample with a sterile phosphate buffer saline solution. Two microliters of each test solution sample were added to the cells to obtain 10, 50, 100, 200, and 500 μM Gd-concentration, and the treated cells were then incubated for 48 h. The viability of the treated cells was measured and normalized with respect to the control cells. The measurement was repeated thrice for all treated cells to obtain average cell viabilities.
2.5. Relaxivity Measurements
Both longitudinal (T1) and transverse (T2) relaxation times as well as longitudinal (R1) and transverse (R2) map images were measured using a 3.0 T MRI scanner (MAGNETOM Trio Tim, Siemens, Munchen, Bayern, Germany) at 20 °C. Various concentrations of aqueous nanoparticle solution samples (0.1, 0.05, 0.025, 0.0125, 0.00625, and 0.0 mM Gd) were prepared in a series by diluting an original aqueous nanoparticle solution sample using triple-distilled water. T1 relaxation times were measured using an inversion recovery method. T2 relaxation times were obtained using a multiple spin-echo method with a Carr–Purcell–Meiboom–Gill pulse sequence. Then, r1 and r2 values were estimated from the slopes in the plots of 1/T1 and 1/T2 versus Gd-concentration, respectively.
2.6. In Vivo T1 and T2 MR Image Measurements
In vivo animal imaging was conducted based on the rules and regulations and permission of the animal research committee of the Korea Institute of Radiological and Medical Sciences (KIRAMS). The same 3.0 T MRI scanner used for relaxivity measurements was used to obtain T1 and T2 MR images. Two Institute of Cancer Research mice weighing ~30 g (Nmice = 2) were used for each modal imaging. The mice were anesthetized using 1.5% isoflurane in oxygen. Measurements were made before and after injecting an aqueous nanoparticle solution sample into mice tail veins. The injection doses were approximately 0.013 and 0.1 mmol Gd/kg for T1 and T2 MR image measurements, respectively. During measurements, the body temperature of the mice was maintained at 37 °C using a warm water blanket. After measurements, the mice were revived from anesthesia and placed in a cage with free access to food and water. The spin-echo sequence was used for MR image measurements at 3.0 T. The typical measurement parameters were as follows: echo time = 10 (or 37) ms, repetition time = 385 (or 1620) ms, pixel bandwidth = 299 (or 197) Hz, number of acquisitions = 8 (or 4), echo train length = 3 (or 13), flip angle = 120o (or 120o), slice thickness = 1.0 (or 1.0) mm, and slice gap = 1.1 (or 1.1) mm for T1 (or T2) MR image measurements.
3. Results
3.1. Nanoparticle Size and Structure
The particle diameters were ultrasmall (Figure 2a) and the average particle diameter (davg) was estimated to be 2.0 nm by fitting an observed particle diameter distribution to a log-normal function (Figure 2b and Table 1). The average hydrodynamic diameter (aavg) of the nanoparticles dispersed in triple-distilled water (0.01 mM Gd) was estimated to be 12.7 nm by fitting an observed DLS pattern to a log-normal function (Figure 2c and Table 1). An aqueous nanoparticle solution sample is presented in Figure 3a. To confirm the colloidal dispersion of the nanoparticles in aqueous media, laser scattering (i.e., Tyndall effect) was conducted (Figure 3b). Laser scattering was observed only in the nanoparticle solution sample whereas no such scattering was observed in reference triple-distilled water, confirming the colloidal dispersion. In addition, the average zeta potential (ξavg) was estimated to be −28.0 mV in aqueous media (Figure 3c). This high value supported the observed good colloidal stability.
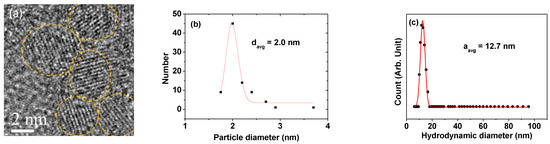
Figure 2.
(a) HRTEM image (dotted circles indicate PASA-coated Gd2O3 nanoparticles). (b) Log-normal function fit to the particle size distribution to obtain davg. (c) Log-normal function fit to a DLS pattern to obtain aavg.

Table 1.
Average particle diameter (davg), average hydrodynamic diameter (aavg), surface-coating amount (P, σ, NPAA), magnetic properties, and water-proton spin relaxivities (r1, r2) of PASA-coated Gd2O3 nanoparticles.
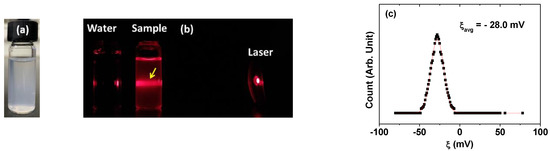
Figure 3.
(a) Photograph of an aqueous solution of PASA-coated Gd2O3 nanoparticles. (b) Laser scattering (or Tyndall effect) (indicated using an arrow) due to collisions between laser light and nanoparticle colloids in solution whereas no such laser scattering was observed in triple-distilled water. (c) Zeta potential curve.
XRD patterns of the synthesized nanoparticles before and after TGA were recorded (Figure 4). The XRD pattern of the as-synthesized nanoparticles was broad and structureless, indicating that they were poorly crystallized (i.e., amorphous) due to their ultrasmall particle size [20]. However, sharp peaks were obtained after TGA, indicating crystallization and particle size growth of the nanoparticles after TGA, as observed previously [21]. The observed XRD pattern after TGA was in good agreement with that of cubic Gd2O3 (JCPDS card no: 43-1014) and the estimated lattice constant (10.81 Å) was comparable to the reported value (10.818 Å) [22].
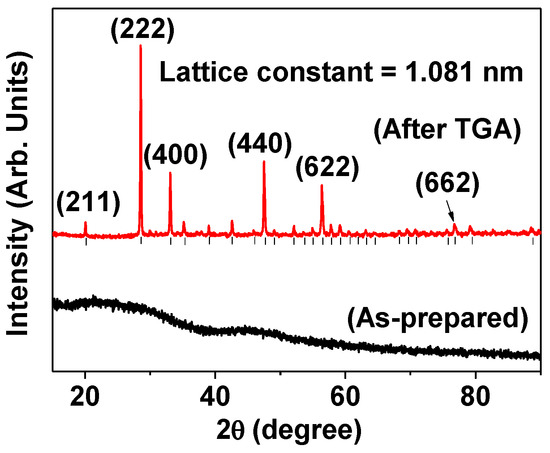
Figure 4.
XRD patterns of PASA-coated Gd2O3 nanoparticles before (bottom) and after (top) TGA. Vertical bars below the peaks after TGA indicate peak positions of cubic Gd2O3 and only the strong peaks were assigned to (hkl) Miller indices.
3.2. Surface Coating
The coating of PASA polymers on the nanoparticle surface was demonstrated by recording an FT-IR absorption spectrum (bottom spectrum labeled III in Figure 5a). In addition, FT-IR absorption spectra of bare Gd2O3 nanoparticles and PASA were taken (top and middle spectra labeled I and II in Figure 5a, respectively) as reference. The observed absorption frequencies are provided in Table 2. Characteristic absorption peaks of PASA [23,24] were also observed in the FT-IR absorption spectrum of PASA-coated Gd2O3 nanoparticles, confirming the surface coating. The frequency difference of ~196 cm−1 between symmetric and asymmetric COO− stretches indicated that COO− groups were electrostatically bonded to Gd3+ on a nanoparticle surface through a bridge bond [25], as drawn in Figure 5b. Considering numerous COO− groups per PASA (i.e., n = ~72), numerous bridge bonds are expected per PASA with a nanoparticle although only one bond is presented in Figure 5b.
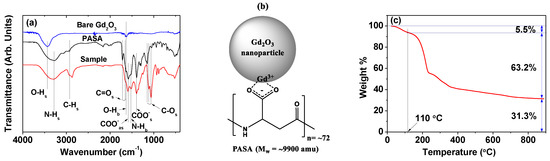
Figure 5.
(a) FT-IR absorption spectra of bare Gd2O3, PASA, and sample (i.e., PASA-coated Gd2O3 nanoparticles): Subscripts s, as, and b indicate stretch, antisymmetric stretch, and bend, respectively. (b) Bonding structure of a PASA with a Gd2O3 nanoparticle. Only one bridge bond is shown, but numerous bridge bonds are expected per PASA with a nanoparticle and approximately four PASA are bonded to a nanoparticle. (c) TGA curve of PASA-coated Gd2O3 nanoparticles.
Table 2.
Observed FT-IR absorption frequencies in cm−1.
The coating amount of PASA polymers per nanoparticle was estimated in weight percentage (%) from a TGA curve (Figure 5c). The initial mass drop of 5.5% between room temperature and ~110 °C was due to water desorption, and the next mass drop of 63.2% was due to PASA burning through its reaction with flowing hot air. The final mass drop of 31.3% was due to the remaining Gd2O3 nanoparticles. To estimate the average number of PASA polymers coating a nanoparticle per unit surface area, a grafting density (σ) [26] was calculated to be 0.29 nm−2 using a molecular mass of PASA (i.e., 9900 amu), the average particle diameter estimated from HRTEM (i.e., 2.0 nm), and the bulk density of 7.407 g/cm3 [27] for Gd2O3. By multiplying σ with the average nanoparticle surface area (= πdavg2), the average number of PASA polymers coating a nanoparticle was estimated to be ~4. The results are provided in Table 1.
3.3. In Vitro Cell Viability
As free Gd3+ ions are toxic in vivo [28,29], in vitro cytotoxicity of PASA-coated Gd2O3 nanoparticles was measured in DU145 and NCTC1469 cells. As shown in Figure 6, cell viabilities were approximately 100 and 77% in DU145 and NCTC1469 cells at 500 μM Gd, respectively, indicating good biocompatibility of the nanoparticles.
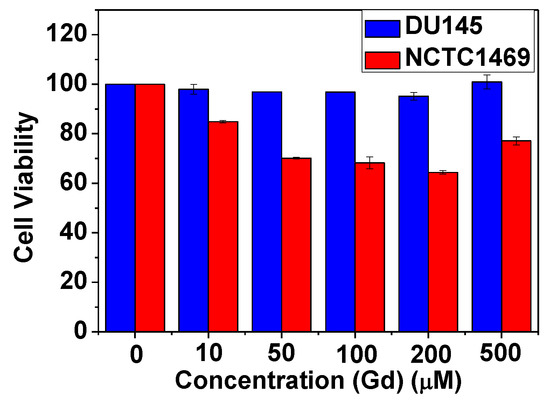
Figure 6.
In vitro cell viabilities of PASA-coated Gd2O3 nanoparticles in DU145 and NCTC1469 cells up to 500 μM Gd.
3.4. Magnetic Properties
Magnetic properties of PASA-coated Gd2O3 nanoparticles were characterized by obtaining an M−H curve at T = 300 K. As shown in Figure 7, the M−H curve showed no hysteresis (i.e., zero value in coercivity and remanence), indicating paramagnetism of the nanoparticles, similar to bulk Gd2O3 [30,31]. In the plot, the net M value of the nanoparticles (i.e., only Gd2O3 nanoparticles without PASA) was used, which was estimated using the net mass of Gd2O3 nanoparticles extracted from a TGA curve. The net M at H = 2.0 T was estimated to be 1.95 emu/g (Table 1). This appreciable M value is due to a high-spin magnetic moment (S = 7/2) of 4f-electrons of Gd3+.
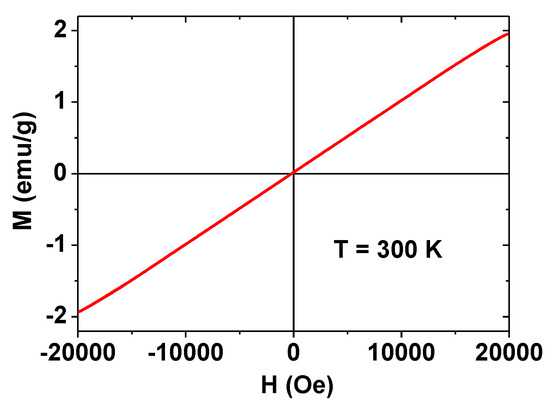
Figure 7.
M−H curve at 300 K. Net M value (i.e., only Gd2O3 nanoparticles without PASA) was estimated using the net mass of Gd2O3 nanoparticles obtained from TGA and used in the plot.
3.5. R1 and R2 Values and R1 and R2 Map Images
As shown in Figure 8a, r1 and r2 values were estimated to be 19.1 and 53.7 s−1mM−1 (r2/r1 = 2.80) (Table 1), respectively, from the slopes in the plots 1/T1 and 1/T2 versus Gd-concentration using an equation 1/Ti = riC + I (i = 1, 2) where C is the Gd-concentration and I is the intercept. The obtained r1 and r2 values were approximately 5 and 10 times higher than those of commercial Gd-chelates [5,6], respectively. Dose-dependent contrast enhancements were observed in both R1 and R2 map images (Figure 8b), demonstrating the ability of the nanoparticles to enhance both T1 and T2 MR contrasts in vitro.
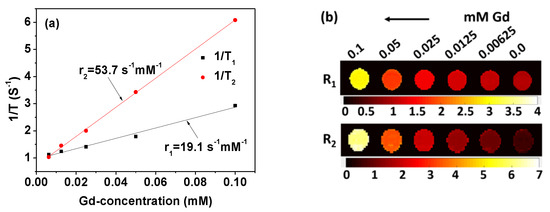
Figure 8.
(a) Plots of 1/T1 and 1/T2 versus Gd-concentration (slopes are r1 and r2 values, respectively). (b) Dose-dependent R1 and R2 map images showing contrast changes with Gd-concentration.
3.6. In Vivo T1 and T2 MR Images: Dual-Modal Imaging
As shown in Figure 9a, positive (or brightened) and negative (or darkened) contrasts were observed in T1 and T2 MR images of mice livers, respectively, after intravenous injection of the nanoparticle solution sample into mice tails. Time-course contrast changes of signal-to-noise ratios (SNRs) of a region-of-interest (ROI) (labeled as dotted circles) are plotted as a function of time before and after injection in Figure 9b. The contrast increased initially and then, decreased with time in T1 MR images whereas the contrast decreased initially and then, slowly increased with time in T2 MR images. These results indicated that PASA-coated Gd2O3 nanoparticles should act as a dual-modal T1 and T2 MRI contrast agent. Ultrasmall nanoparticles (d <3.0 nm) can be excreted via the renal system [32,33]. Therefore, most of the nanoparticles were likely to be excreted via the renal system.
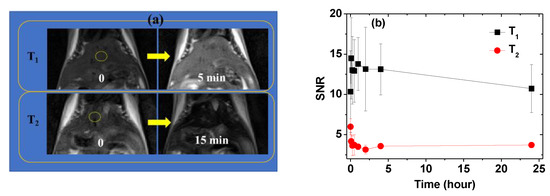
Figure 9.
(a) T1 and T2 MR images of mice liver before (labeled as “0”) and 5 and 15 min after intravenous injection of an aqueous solution of PASA-coated Gd2O3 nanoparticles into mice tails, respectively (Nmice = 2 for each modal imaging). (b) Plots of SNR-ROIs (labeled as dotted circles) as a function of time.
4. Discussion
In this study, PASA-coated Gd2O3 nanoparticles were synthesized via the one-pot polyol method and characterized with various techniques. Their relaxometric and MRI imaging properties were studied. Surface-coating ligands can affect r1 and r2 values of Gd2O3 nanoparticles [16,17]. The PASA has not been used as a surface-coating ligand and thus, was investigated here. The r1 and r2 values of PASA-coated Gd2O3 nanoparticles were 19.1 and 53.7 s−1mM−1, respectively, which are much higher than those [5,6,7] of commercial Gd-chelates. Interestingly, PASA-coated ultrasmall Gd2O3 nanoparticles exhibited an appreciable r2/r1 ratio of 2.80 and provided both T1 and T2 MR images. To explain this, we used the relationship between hydrophilicity of polymers and r2/r1 ratio of polymer-coated Gd2O3 nanoparticles using various polymer-coated Gd2O3 nanoparticles studied here and previously [34,35,36]. As provided in Table 3, the r2/r1 ratio of PASA-coated Gd2O3 nanoparticles was higher than those [34,35,36] of the other hydrophilic polymer-coated Gd2O3 nanoparticles. To understand this, the r2/r1 ratio of various polymer-coated Gd2O3 nanoparticles [34,35,36] was plotted as a function of COO− group weight percentage of polymers in Figure 10, showing that the r2/r1 ratio generally decreased with increasing COO− group weight percentage of the polymers. In this plot, it was assumed that among hydrophilic groups of the polymers, the COO− group could most strongly attract water molecules around the Gd2O3 nanoparticles through its negative charge and electronegative oxygens. Thus, other hydrophilic groups such as C−O, C=O, and NH were excluded from the hydrophilic group weight percentage of the polymers. This plot indicates that a more water-attracting (or more hydrophilic) polymer can provide the r2/r1 ratio which is closer to one. This is because T1 water–proton spin relaxation can be more strongly induced if more water molecules are attracted closer to the Gd2O3 nanoparticles according to the inner-sphere model [5]. Under such conditions, the r2/r1 ratio will be close to one; thus, contrast agents can efficiently act as T1 MRI contrast agents. However, PASA has the lowest COO− group weight percentage among the polymers (Table 3 and Figure 10) and thus, the lowest water-attracting power around the Gd2O3 nanoparticles. Therefore, PASA-coated Gd2O3 nanoparticles will most weakly induce T1 water–proton spin relaxation among polymer-coated Gd2O3 nanoparticles in Table 3. This explains the observed appreciable r2/r1 ratio of 2.80 in this study, which is higher than those of the other hydrophilic polymer-coated Gd2O3 nanoparticles in Table 3. Due to this, PASA-coated Gd2O3 nanoparticles showed T2 MR images as well as T1 MR images, thus acting as a dual-modal T1 and T2 MRI contrast agent. This result indicates that dual-modal T1 and T2 MRI is possible through a proper choice of hydrophilic polymers as surface-coating ligands of Gd2O3 nanoparticles with which the r2/r1 ratio is appreciable.
Table 3.
r1 and r2 values of various polymer-coated Gd2O3 nanoparticles.
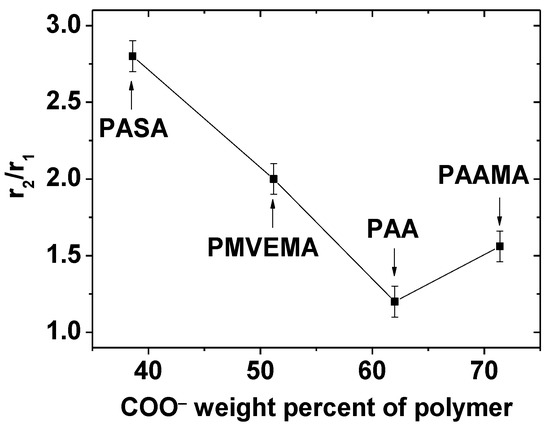
Figure 10.
Plot of r2/r1 ratio of polymer-coated Gd2O3 nanoparticles dispersed in aqueous media as a function of COO− group weight percentage of polymers (polymer = PASA, PMVEMA, PAA, and PAAMA).
5. Conclusions
In summary, surface-coating ligand plays an important role in relaxometric and MRI properties of Gd2O3 nanoparticles. The PASA has not been used as a surface-coating ligand of Gd2O3 nanoparticles and thus, was investigated here. PASA-coated ultrasmall Gd2O3 nanoparticles were synthesized using the one-pot polyol method and their relaxometric and imaging properties in MRI were investigated. The PASA-coated Gd2O3 nanoparticles were ultrasmall with a davg of 2.0 ± 0.1 nm and exhibited good biocompatibility up to 500 μM Gd as determined from cellular cytotoxicity tests. The PASA-coated Gd2O3 nanoparticles were paramagnetic and exhibited r1 = 19.1 ± 0.1 s−1mM−1 and r2 = 53.7 ± 0.1 s−1mM−1, which are higher than those of commercial Gd-chelates. Due to an appreciable r2/r1 ratio of 2.80, the PASA-coated ultrasmall Gd2O3 nanoparticles exhibited both in vivo T1 and T2 MR images in mice. This result indicates that dual-modal T1 and T2 MRI is possible through a proper choice of hydrophilic polymers as surface-coating ligands of Gd2O3 nanoparticles which provide appreciable r2/r1 ratios.
Author Contributions
Methodology, S.M. and H.Y.; conceptualization, S.M.; formal analysis, S.M., H.Y., A.G., S.L.H., S.L., T.T., M.Y.A., A.K.A.A.S., D.Z. and Y.L.; investigation, S.M., H.Y., J.A.P., S.K., H.C. and K.-S.C.; data curation, S.M., H.Y., J.A.P., S.K., H.C. and K.-S.C.; writing—original draft preparation, S.M.; writing—review and editing, G.H.L.; supervision, G.H.L. and Y.C.; funding acquisition, G.H.L., Y.C. and J.A.P. All authors have read and agreed to the published version of the manuscript.
Funding
This work was supported by the Basic Science Research Program of the National Research Foundation (NRF) funded by the Ministry of Education, Science, and Technology (No. 2016R1D1A3B01007622 to GHL and 2020R1A2C2008060 to YC), the Korea government (Ministry of Science, and Information and Communications Technology: MSIT) (No. 2021R1A4A1029433), and by a grant of the KIRAMS funded by MSIT (No. 50461-2021).
Institutional Review Board Statement
The in vivo animal imaging experiments were conducted according to the rules and regulation of the animal research committee of the Korea Institute of Radiological and Medical Sciences (approval number: Kirams2018-0072 and approval date: 9 January 2019).
Informed Consent Statement
Not applicable.
Data Availability Statement
The data presented in this study are available on request from the corresponding authors.
Acknowledgments
The XRD machine belongs to the Korea Basic Science Institute.
Conflicts of Interest
The authors declare no conflict of interest.
References
- Roca, A.G.; Costo, R.; Rebolledo, A.F.; Veintemillas-Verdaguer, S.; Tartaj, P.; González-Carreño, T.; Morales, M.P.; Serna, C.J. Progress in the preparation of magnetic nanoparticles for applications in biomedicine. J. Phys. D Appl. Phys. 2009, 42, 224002. [Google Scholar] [CrossRef]
- Pankhurst, Q.A.; Thanh, N.T.K.; Jones, S.K.; Dobson, J. Progress in applications of magnetic nanoparticles in biomedicine. J. Phys. D Appl. Phys. 2009, 42, 224001. [Google Scholar] [CrossRef] [Green Version]
- Sun, C.; Lee, J.S.; Zhang, M. Magnetic nanoparticles in MR imaging and drug delivery. Adv. Drug Deliv. Rev. 2008, 60, 1252–1265. [Google Scholar] [CrossRef] [Green Version]
- Salata, O.V. Applications of nanoparticles in biology and medicine. J. Nanobiotechnol. 2004, 2, 1–6. [Google Scholar] [CrossRef] [PubMed] [Green Version]
- Lauffer, R.B. Paramagnetic metal complexes as water proton relaxation agents for NMR imaging: Theory and design. Chem. Rev. 1987, 87, 901–927. [Google Scholar] [CrossRef]
- Caravan, P.; Ellison, J.J.; McMurry, T.J.; Lauffer, R.B. Gadolinium (III) chelates as MRI contrast agents: Structure, dynamics, and applications. Chem. Rev. 1999, 99, 2293–2352. [Google Scholar] [CrossRef]
- Wahsner, J.; Gale, E.M.; Rodríguez-Rodríguez, A.; Caravan, P. Chemistry of MRI contrast agents: Current challenges and new frontiers. Chem. Rev. 2018, 119, 957–1057. [Google Scholar] [CrossRef] [PubMed]
- Geraldes, C.F.; Laurent, S. Classification and basic properties of contrast agents for magnetic resonance imaging. Contrast Media Mol. Imaging 2009, 4, 1–23. [Google Scholar] [CrossRef] [PubMed]
- Na, H.B.; Song, I.C.; Hyeon, T. Inorganic nanoparticles for MRI contrast agents. Adv. Mater. 2009, 21, 2133–2148. [Google Scholar] [CrossRef]
- Jun, Y.W.; Lee, J.H.; Cheon, J. Chemical design of nanoparticle probes for high-performance magnetic resonance imaging. Angew. Chem. Int. Ed. 2008, 47, 5122–5135. [Google Scholar] [CrossRef]
- Xu, W.; Kattel, K.; Park, J.Y.; Chang, Y.; Kim, T.J.; Lee, G.H. Paramagnetic nanoparticle T1 and T2 MRI contrast agents. Phys. Chem. Chem. Phys. 2012, 14, 12687–12700. [Google Scholar] [CrossRef] [PubMed]
- Park, J.Y.; Baek, M.J.; Choi, E.S.; Woo, S.; Kim, J.H.; Kim, T.J.; Jung, J.C.; Chae, K.S.; Chang, Y.; Lee, G.H. Paramagnetic ultrasmall gadolinium oxide nanoparticles as advanced T1 MRI contrast agent: Account for large longitudinal relaxivity, optimal particle diameter, and in vivo T1 MR images. ACS Nano 2009, 3, 3663–3669. [Google Scholar] [CrossRef] [PubMed]
- Bridot, J.-L.; Faure, A.-C.; Laurent, S.; Rivière, C.; Billotey, C.; Hiba, B.; Janier, M.; Josserand, V.; Coll, J.-L.; Elst, L.V.; et al. Hybrid gadolinium oxide nanoparticles: Multimodal contrast agents for in vivo imaging. J. Am. Chem. Soc. 2007, 129, 5076–5084. [Google Scholar] [CrossRef] [PubMed]
- Hifumi, H.; Yamaoka, S.; Tanimoto, A.; Citterio, D.; Suzuki, K. Gadolinium-based hybrid nanoparticles as a positive MR contrast agent. J. Am. Chem. Soc. 2006, 128, 15090–15091. [Google Scholar] [CrossRef] [PubMed]
- Singh, R.; Singh, S. Surface Modification of Nanomaterials for Biomedical Applications: Strategies and Recent Advances. In Nanobiotechnology, 1st ed.; Dhawan, A., Singh, S., Kumar, A., Shanker, R., Eds.; CRC Press: Boca Raton, FL, USA, 2018. [Google Scholar]
- Fang, J.; Chandrasekharan, P.; Liu, X.L.; Yang, Y.; Lv, Y.B.; Yang, C.T.; Ding, J. Manipulating the surface coating of ultra-small Gd2O3 nanoparticles for improved T1-weighted MR imaging. Biomaterials 2014, 35, 1636–1642. [Google Scholar] [CrossRef] [PubMed]
- Kim, C.R.; Baeck, J.S.; Chang, Y.; Bae, J.E.; Chae, K.S.; Lee, G.H. Ligand-size dependent water proton relaxivities in ultrasmall gadolinium oxide nanoparticles and in vivo T1 MR images in a 1.5 T MR field. Phys. Chem. Chem. Phys. 2014, 16, 19866. [Google Scholar] [CrossRef]
- Roch, A.; Muller, R.N.; Gillis, P. Theory of proton relaxation induced by superparamagnetic particles. J. Chem. Phys. 1999, 110, 5403–5411. [Google Scholar] [CrossRef]
- Adelnia, H.; Tran, H.D.N.; Little, P.J.; Blakey, I.; Ta, H.T. Poly(aspartic acid) in biomedical applications: From polymerization, modification, properties, degradation, and biocompatibility to applications. ACS Biomater. Sci. Eng. 2021, 7, 2083–2105. [Google Scholar] [CrossRef] [PubMed]
- Söderlind, F.; Pedersen, H.; Petoral, R.M., Jr.; Käll, P.O.; Uvdal, K. Synthesis and characterisation of Gd2O3 nanocrystals functionalised by organic acids. J. Colloid Interface Sci. 2005, 288, 140–148. [Google Scholar] [CrossRef] [PubMed]
- Kattel, K.; Park, J.Y.; Xu, W.; Kim, H.G.; Lee, E.J.; Bony, B.A.; Heo, W.C.; Lee, J.J.; Jin, S.; Baeck, J.S.; et al. A facile synthesis, in vitro and in vivo MR studies of d-glucuronic acid-coated ultrasmall Ln2O3 (Ln = Eu, Gd, Dy, Ho, and Er) nanoparticles as a new potential MRI contrast agent. ACS Appl. Mater. Interfaces 2011, 3, 3325–3334. [Google Scholar] [CrossRef] [PubMed]
- Card No. 43-1014, JCPDS-International Centre for Diffraction Data; Version 1.30; PCPDFWIN: Newtown Square, PA, USA, 1997; Available online: https://www.icdd.com/ (accessed on 4 July 2021).
- Shen, Z.; Zhi, X.; Zhang, P.Z. Preparation of fluorescent polyaspartic acid and evaluation of its scale inhibition for CaCO3 and CaSO4. Adv. Technol. 2017, 28, 367–372. [Google Scholar] [CrossRef]
- Ma, G.; Yang, Q.; Ran, F.; Dong, Z.; Lei, Z. High performance and low cost composite superabsorbent based on polyaspartic acid and palygorskite clay. Appl. Clay Sci. 2015, 118, 21–28. [Google Scholar] [CrossRef]
- Deacon, G.B.; Phillips, R.J. Relationships between the carbon-oxygen stretching frequencies of carboxylate complexes and the type of carboxylate coordination. Coord. Chem. Rev. 1980, 33, 227–250. [Google Scholar] [CrossRef]
- Corbierre, M.K.; Cameron, N.S.; Lennox, R.B. Polymer-stabilized gold nanoparticles with high grafting densities. Langmuir 2004, 20, 2867–2873. [Google Scholar] [CrossRef] [PubMed]
- Bulk density of Gd2O3. Sigma-Aldrich Catalog, 1260, 2005–2006. Available online: https://www.sigmaaldrich.com/ (accessed on 4 July 2021).
- Sadowski, E.A.; Bennett, L.K.; Chan, M.R.; Wentland, A.L.; Garrett, A.L.; Garrett, R.W.; Djamali, A. Nephrogenic systemic fibrosis: Risk factors and incidence estimation. Radiology 2007, 243, 148–157. [Google Scholar] [CrossRef]
- Marckmann, P.; Skov, L.; Rossen, K.; Dupont, A.; Damholt, M.B.; Heaf, J.G.; Thomsen, H.S. Nephrogenic systemic fibrosis: Suspected causative role of gadodiamide used for contrast-enhanced magnetic resonance imaging. J. Am. Soc. Nephrol. 2006, 17, 2359–2362. [Google Scholar] [CrossRef] [Green Version]
- Wolf, W.P.; Meissner, H.; Catanese, C.A. Magnetic properties of rare earth hydroxides. J. Appl. Phys. 1968, 39, 1134–1136. [Google Scholar] [CrossRef]
- Lal, H.B.; Pratap, V.; Kumar, A. Magnetic susceptibility of heavy rare-earth sesquioxides. Pramana 1978, 10, 409–412. [Google Scholar] [CrossRef]
- Choi, H.S.; Liu, W.; Misra, P.; Tanaka, E.; Zimmer, J.P.; Ipe, B.I.; Bawendi, M.G.; Frangioni, J.V. Renal clearance of quantum dots. Nat. Biotechnol. 2007, 25, 1165–1170. [Google Scholar] [CrossRef] [PubMed] [Green Version]
- Longmire, M.; Choyke, P.L.; Kobayashi, H. Clearance properties of nano-sized particles and molecules as imaging agents: Considerations and caveats. Nanomedicine 2008, 3, 703–717. [Google Scholar] [CrossRef] [PubMed] [Green Version]
- Miao, X.; Ho, S.L.; Tegafaw, T.; Cha, H.; Chang, Y.; Oh, I.T.; Ahmad, M.Y.; Marasini, S.; Ghazanfari, A.; Yue, H.; et al. Stable and non-toxic ultrasmall gadolinium oxide nanoparticle colloids (coating material = polyacrylic acid) as high-performance T1 magnetic resonance imaging contrast agents. RSC Adv. 2018, 8, 3189–3197. [Google Scholar] [CrossRef] [Green Version]
- Jang, Y.J.; Liu, S.; Yue, H.; Park, J.; Cha, H.; Ho, S.L.; Marasini, S.; Ghazanfari, A.; Ahmad, M.Y.; Miao, X.; et al. Hydrophilic biocompatible poly(acrylic acid-co-maleic acid) polymer as a surface-coating ligand of ultrasmall Gd2O3 nanoparticles to obtain a high r1 value and T1 MR images. Diagnostics 2021, 11, 2. [Google Scholar] [CrossRef] [PubMed]
- Ahmad, M.Y.; Ahmad, M.; Yue, H.; Ho, S.L.; Park, J.; Jung, K.H.; Cha, H.; Marasini, S.; Ghazanfari, A.; Liu, S.; et al. In vivo positive magnetic resonance imaging applications of poly(methyl vinyl ether-alt-maleic acid)-coated ultra-small paramagnetic gadolinium oxide nanoparticles. Molecules 2020, 25, 1159. [Google Scholar] [CrossRef] [PubMed] [Green Version]
Publisher’s Note: MDPI stays neutral with regard to jurisdictional claims in published maps and institutional affiliations. |
© 2021 by the authors. Licensee MDPI, Basel, Switzerland. This article is an open access article distributed under the terms and conditions of the Creative Commons Attribution (CC BY) license (https://creativecommons.org/licenses/by/4.0/).