
A Recent Study on Remediation of Direct Blue 15 Dye Using Halloysite Nanotubes

 ,
,  , , ,
, , ,  ,
,  , ,
, ,  and
and 
Abstract
:1. Introduction
2. Materials and Methods
2.1. Materials
2.1.1. Investigation on Factors Effecting Adsorption of DB15 Dye on HNT
2.1.2. Characterization Methods
2.1.3. Optimization of Process Parameters
3. Results
3.1. Characterization of HNT and DB15–HNT Surfaces
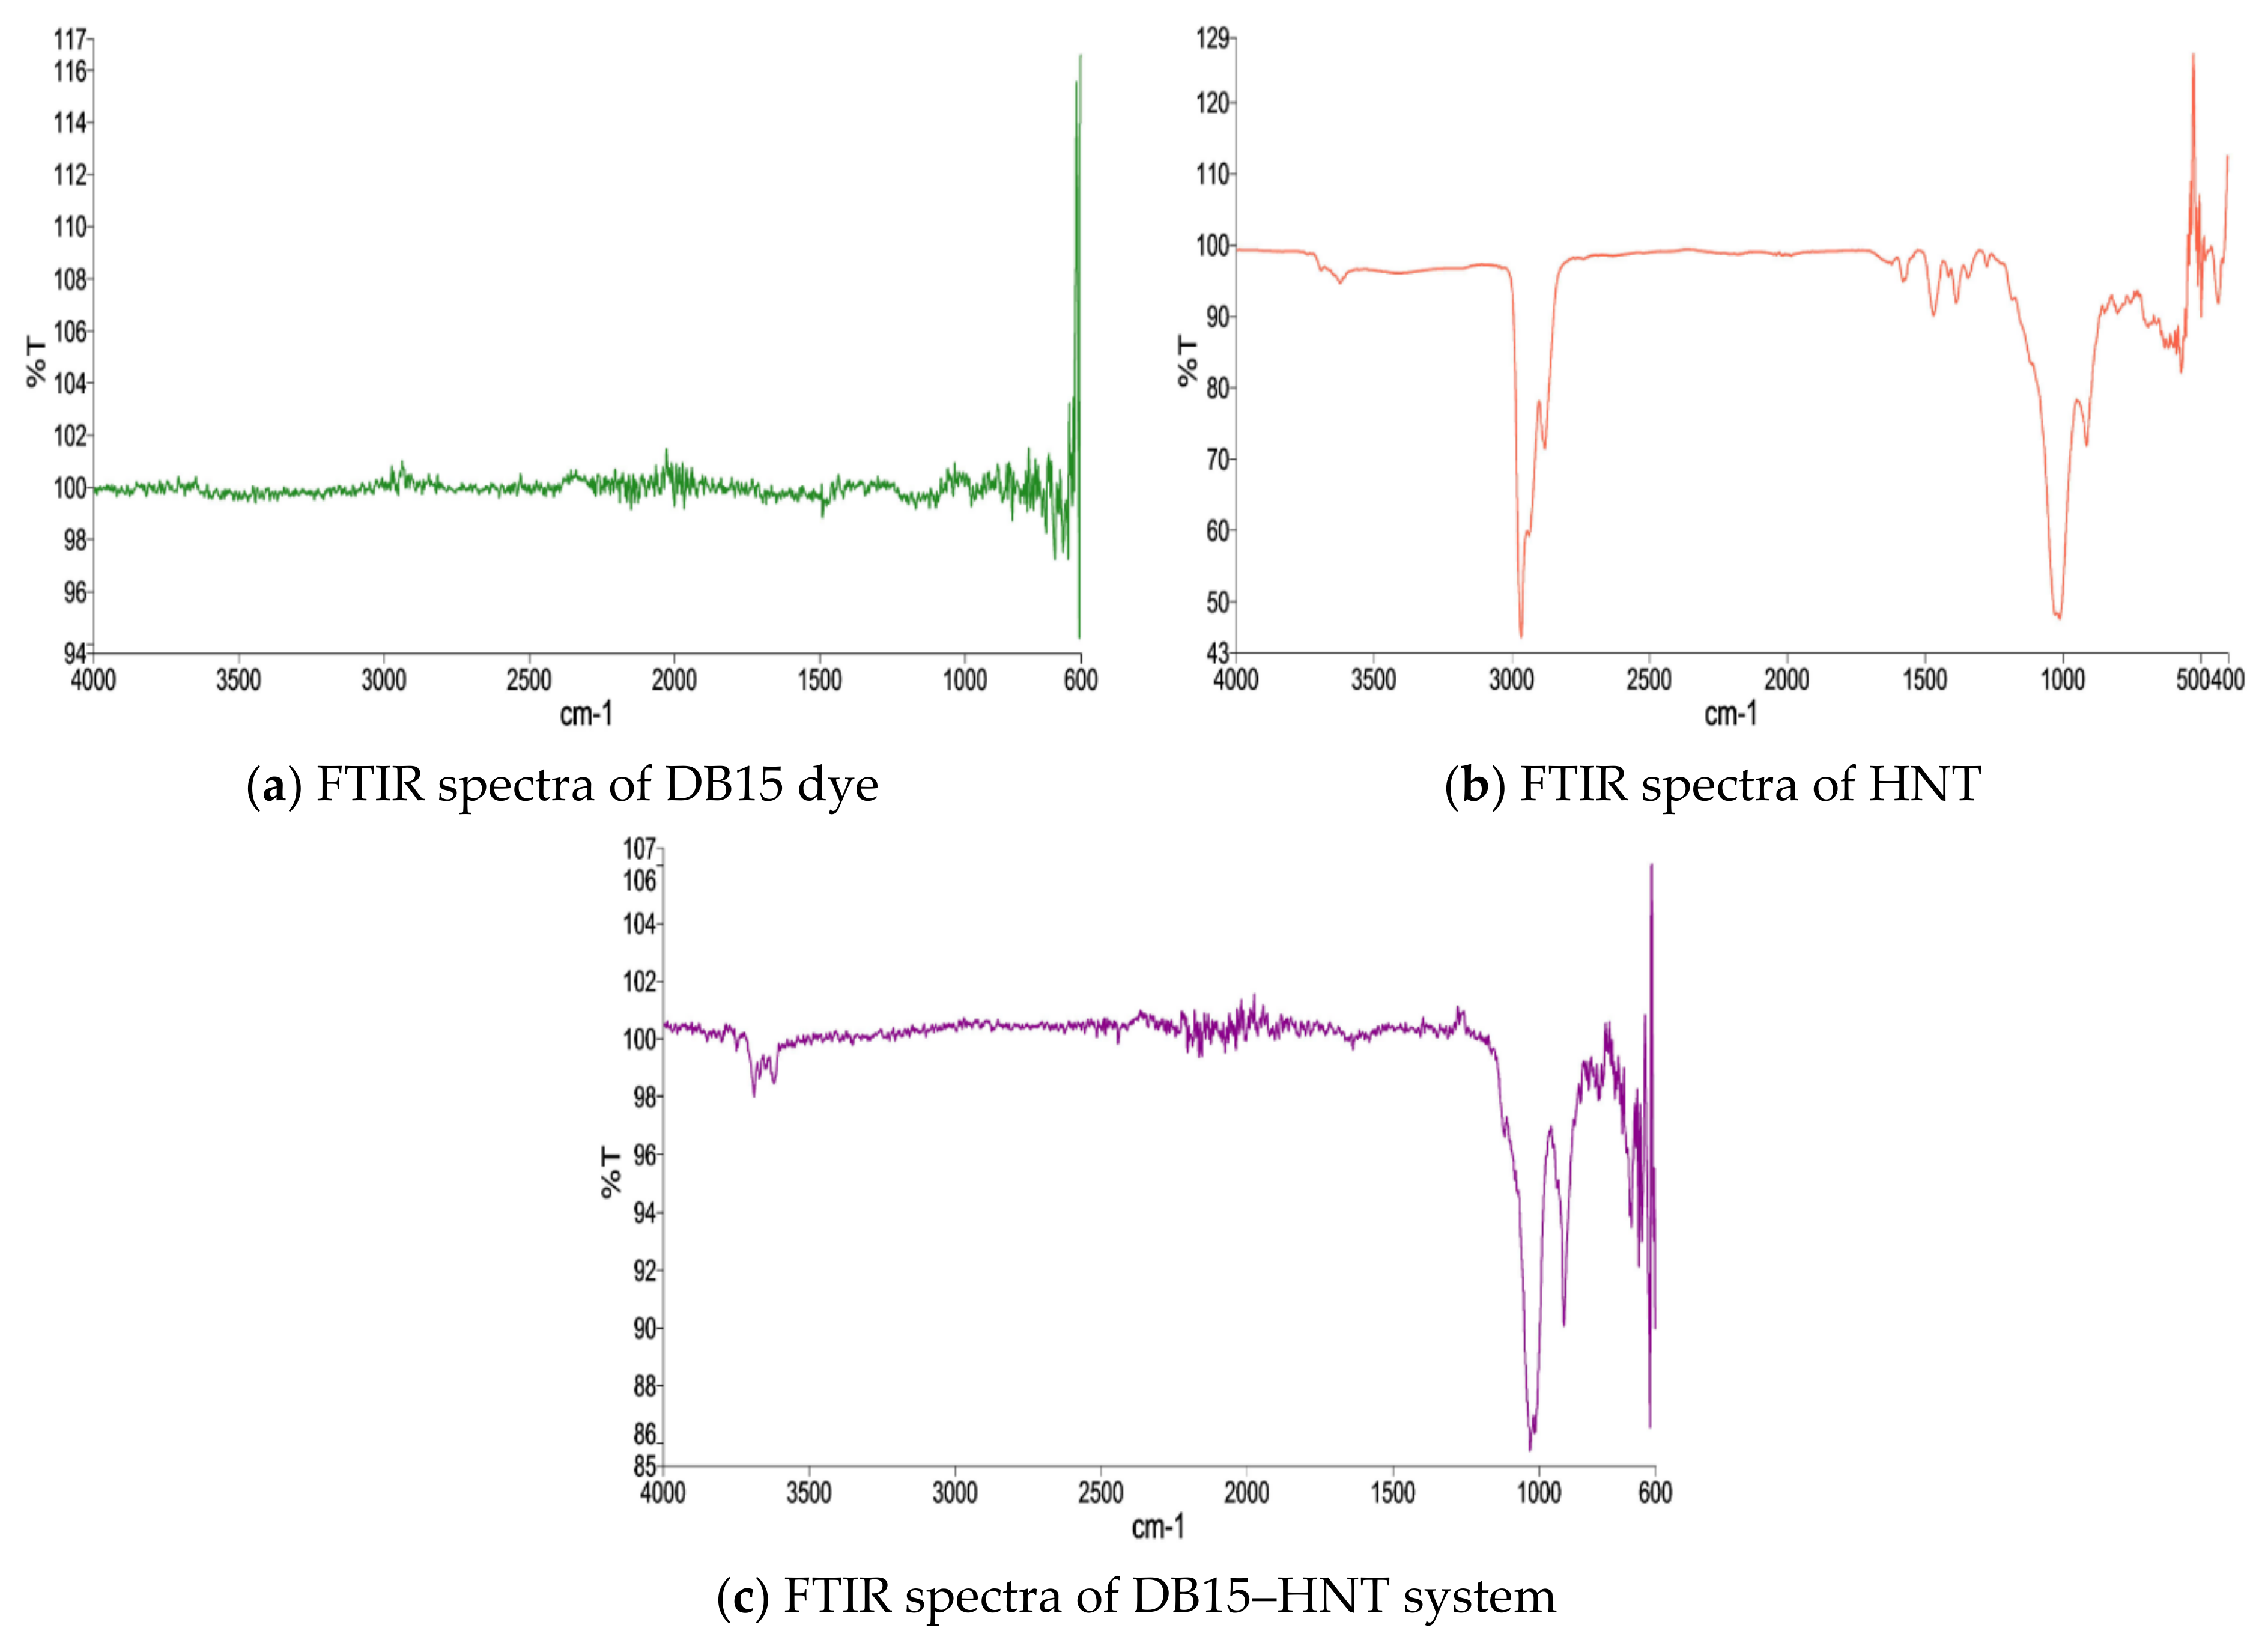
Scanning Electron Microscopy and FTIR Spectrum
3.2. The Impact of Factors on DB15 Adsorption on HNT
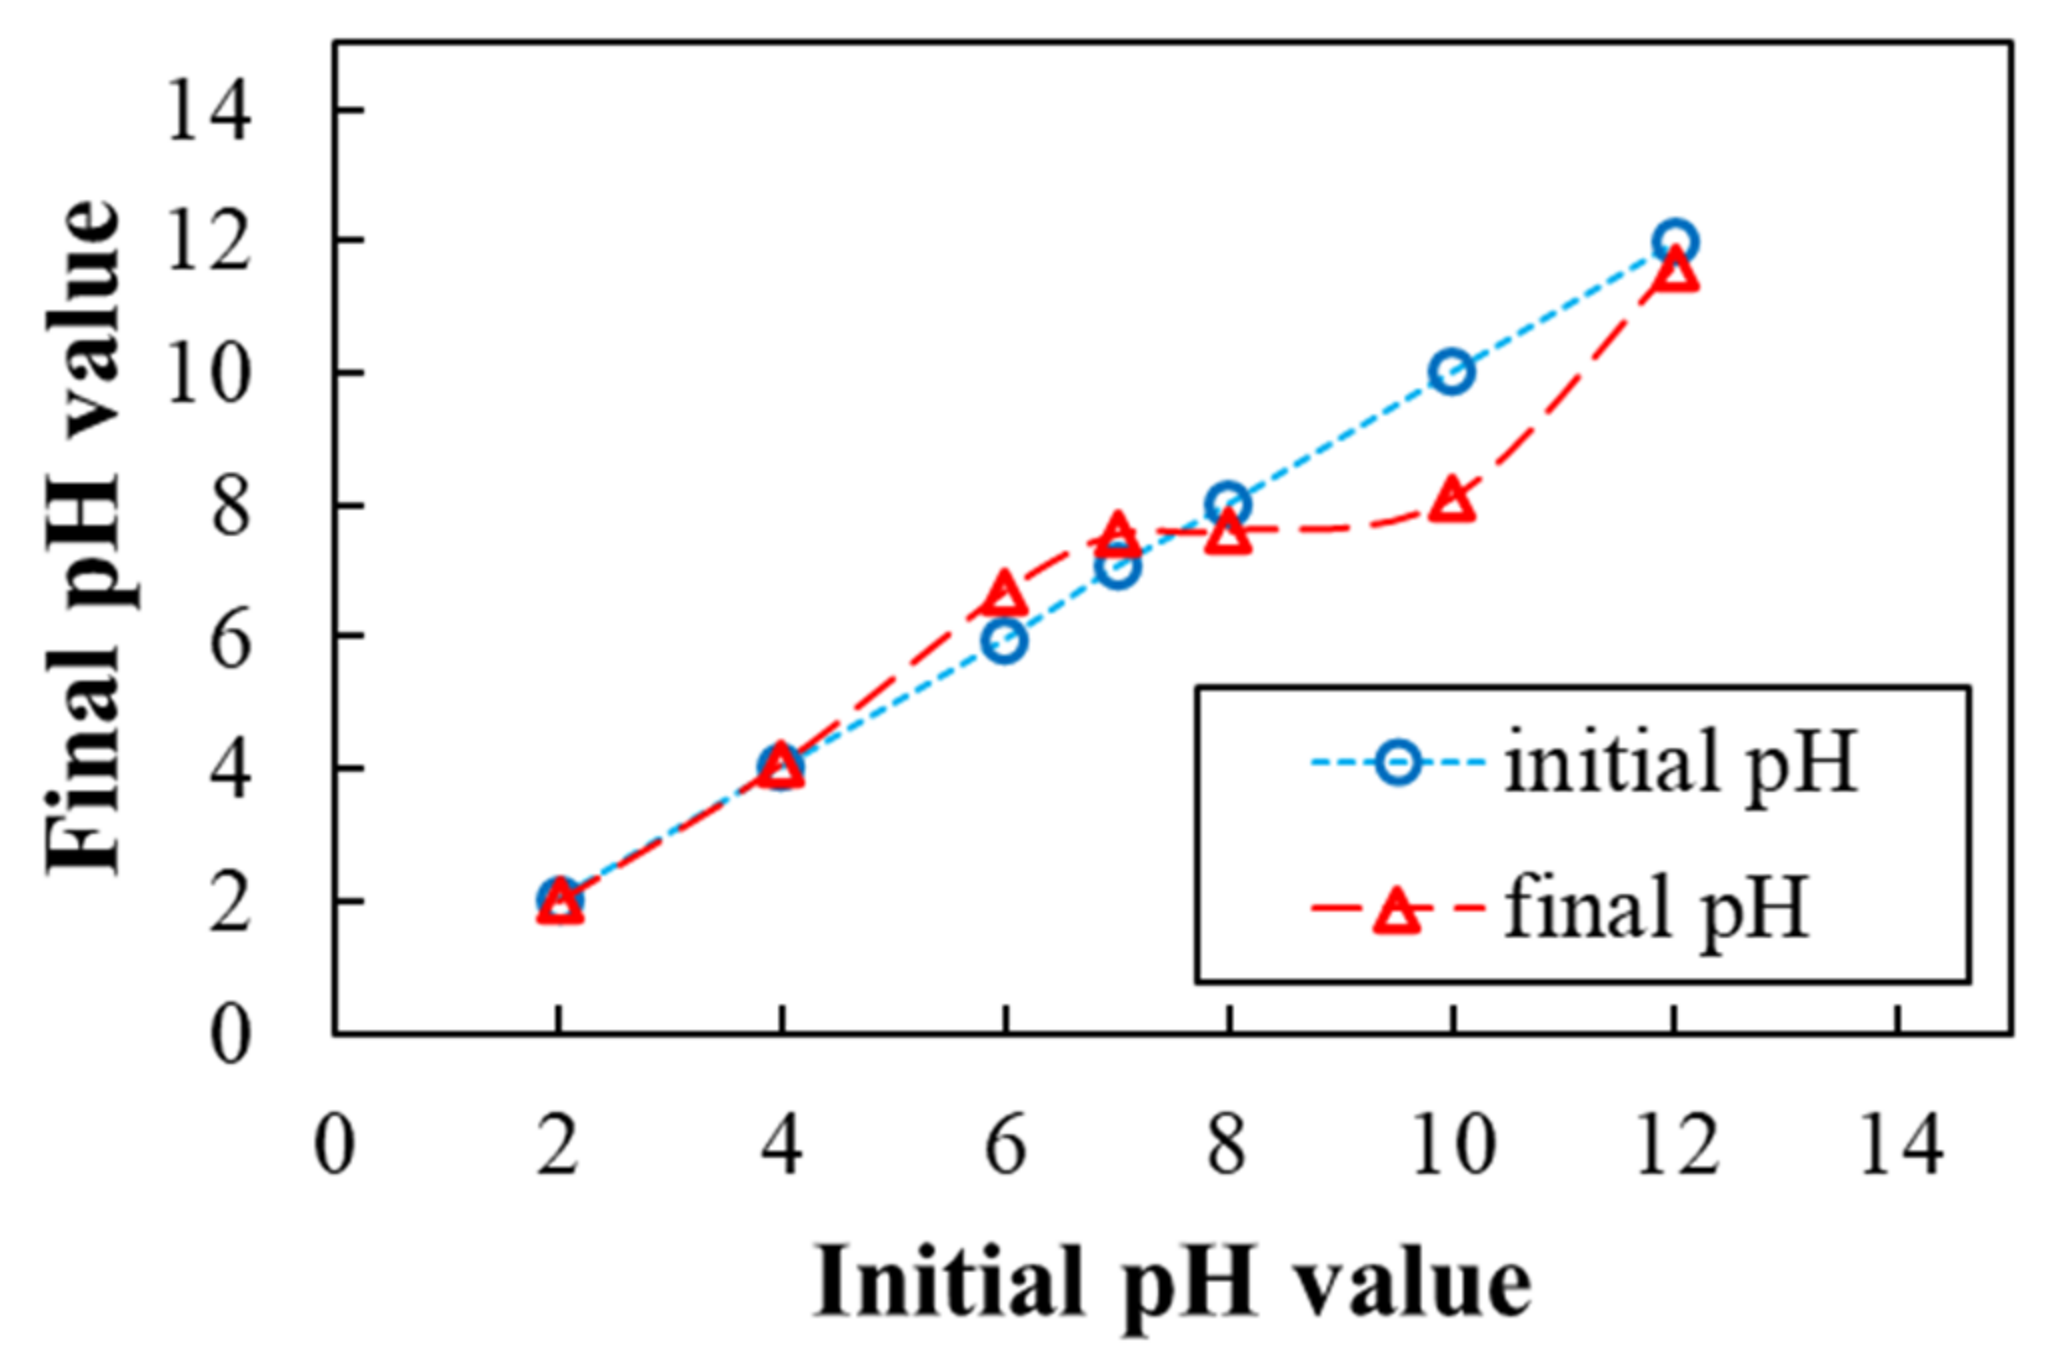
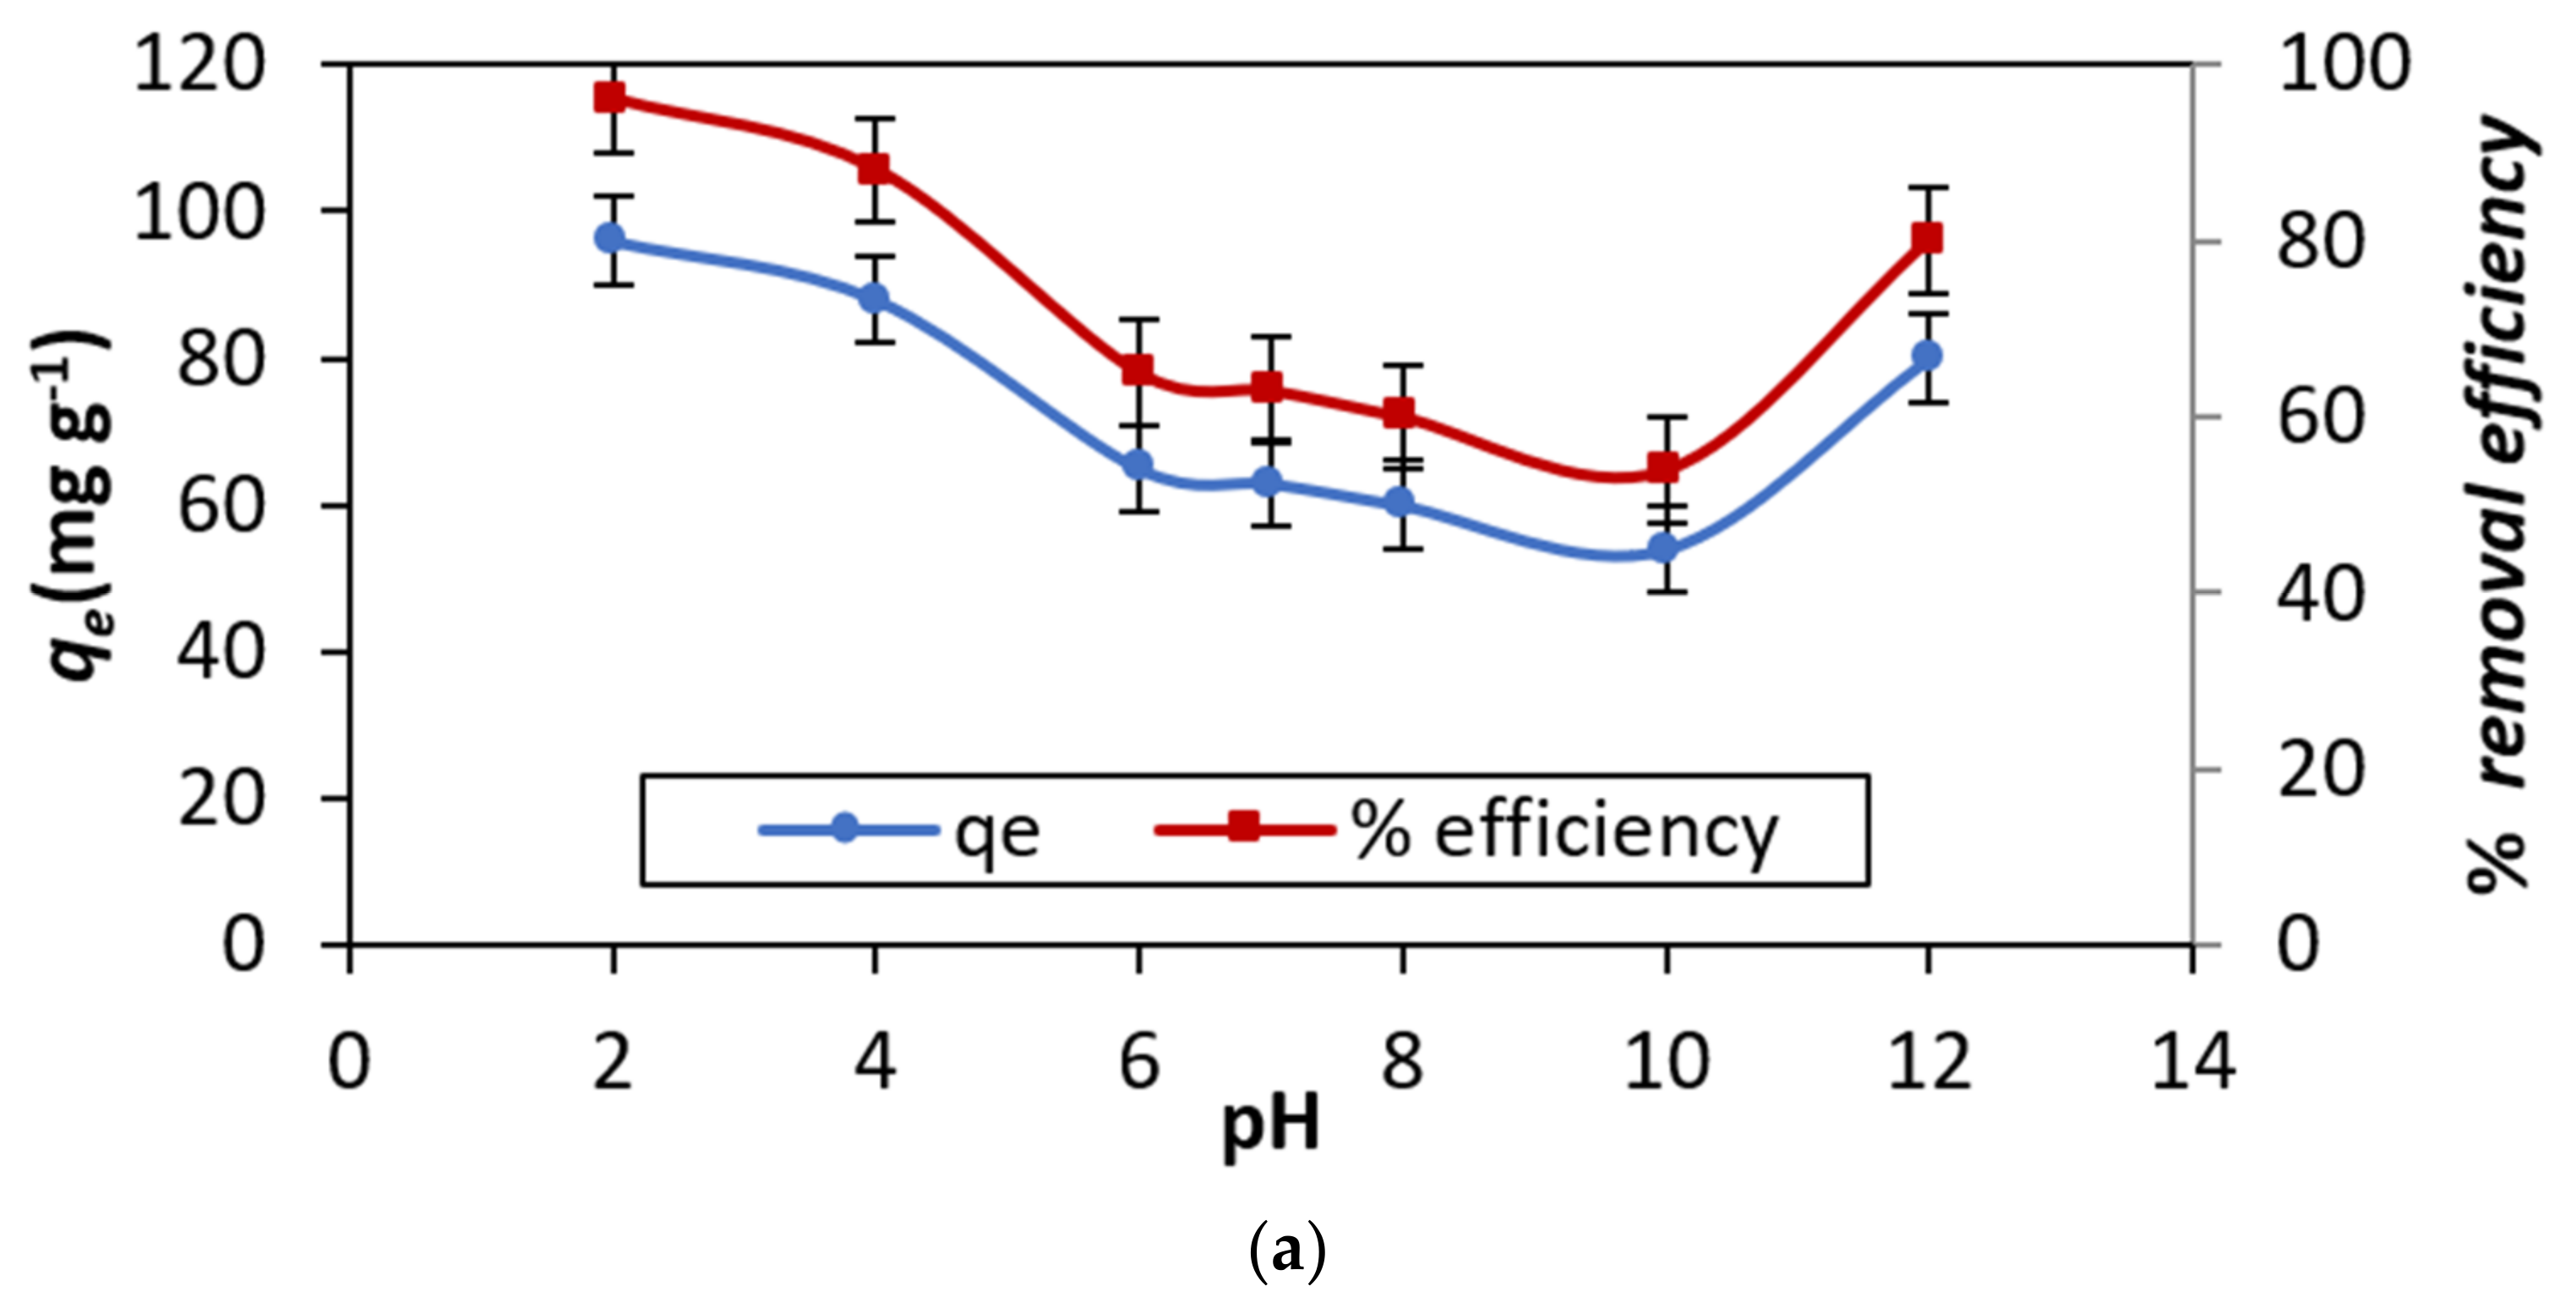
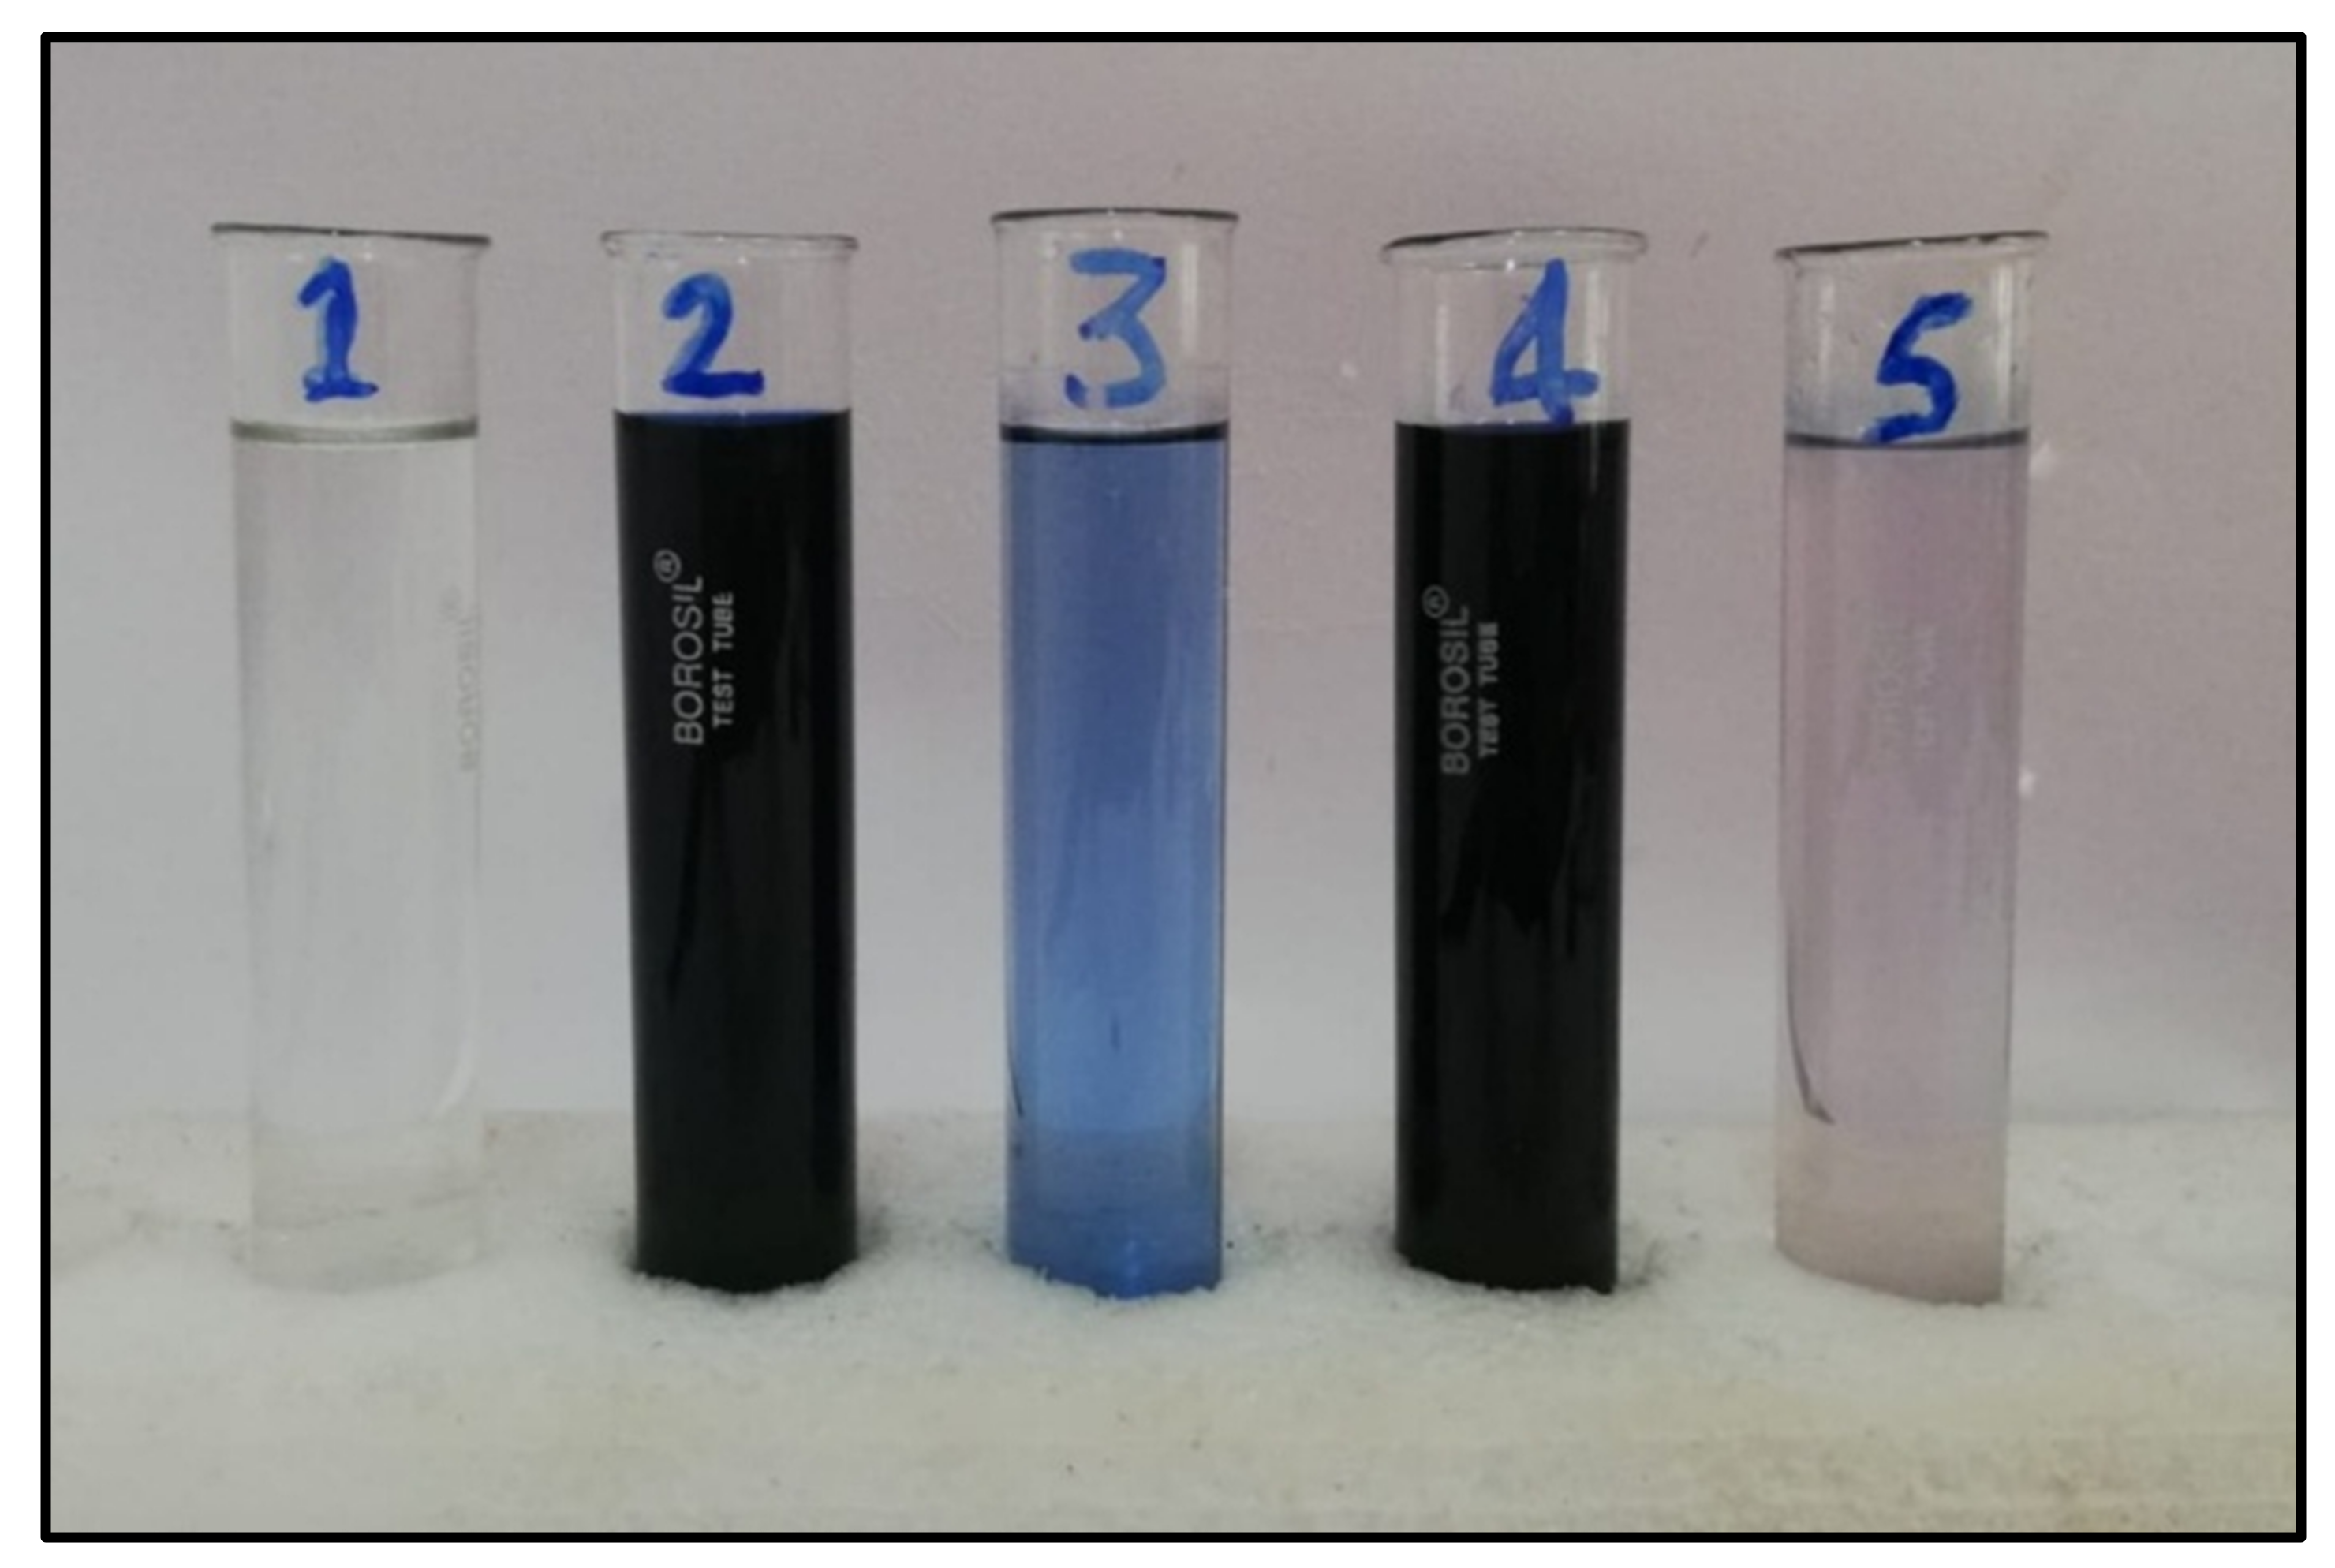
3.2.1. pH Value of Solution
3.2.2. Initial DB15 Dye Concentration
3.2.3. Effect of Adsorbent Dosage
3.2.4. Effect of Temperature
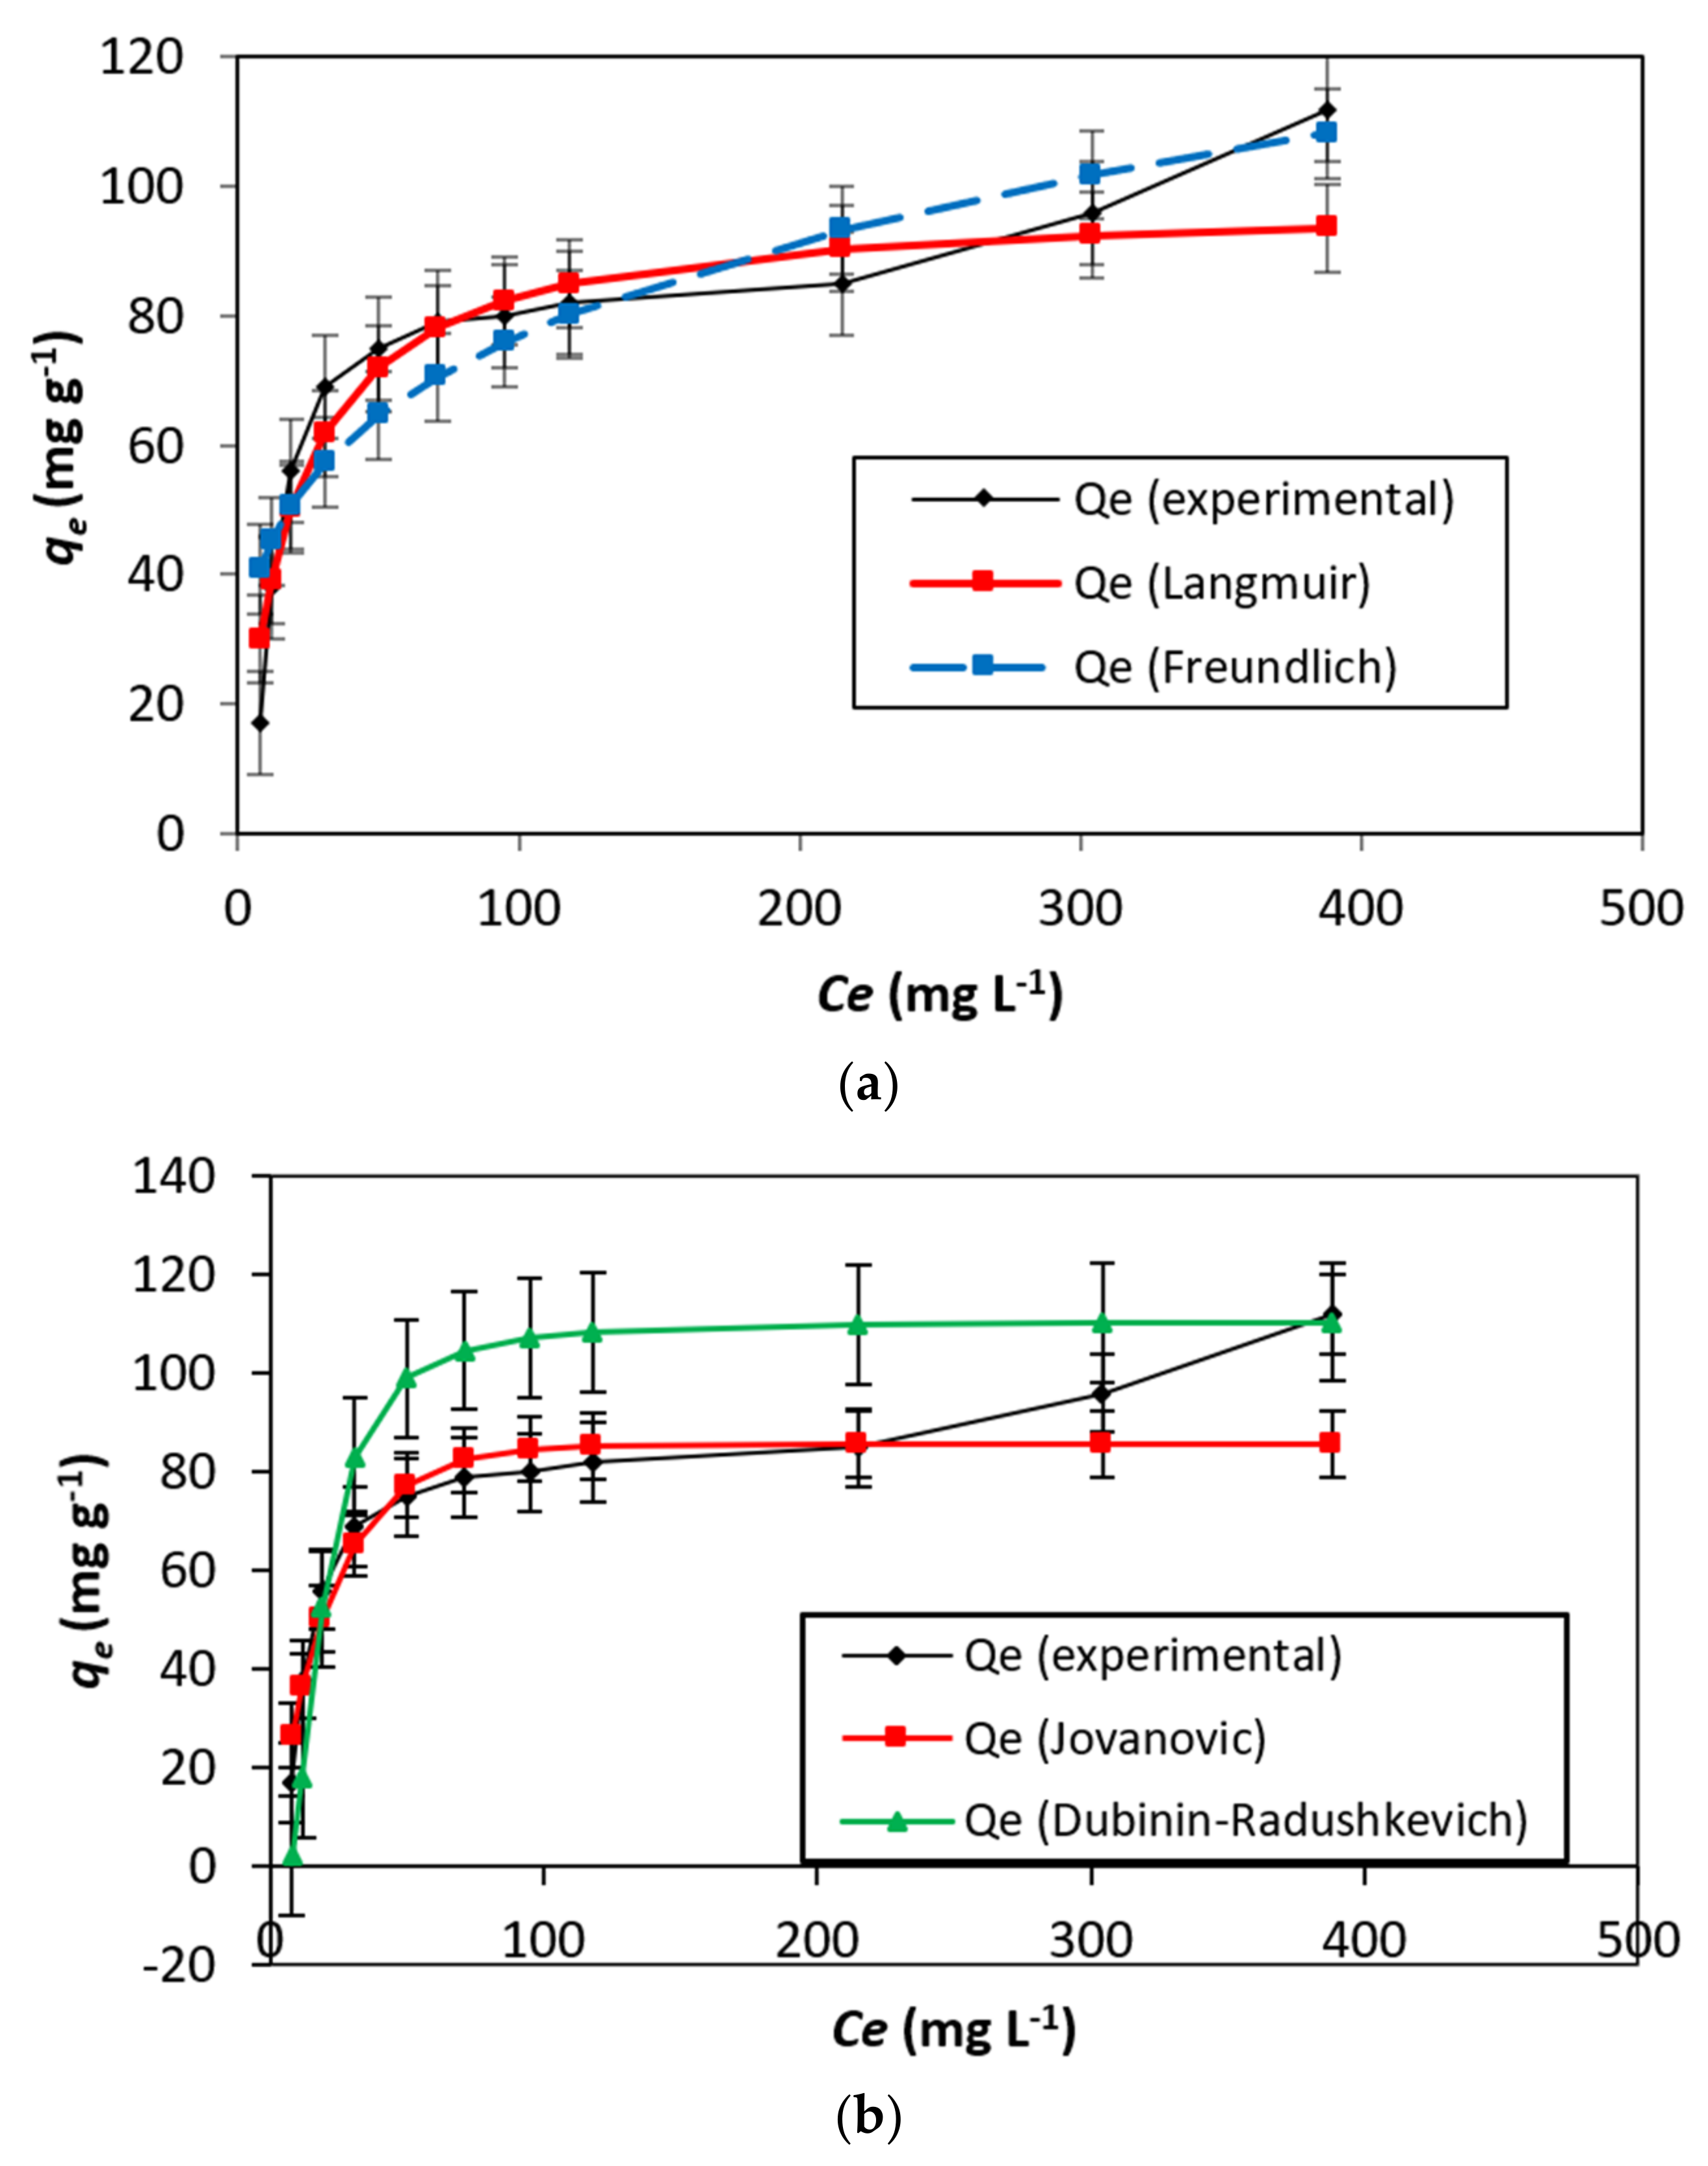
3.3. Adsorption Isotherms—Modeling Examination
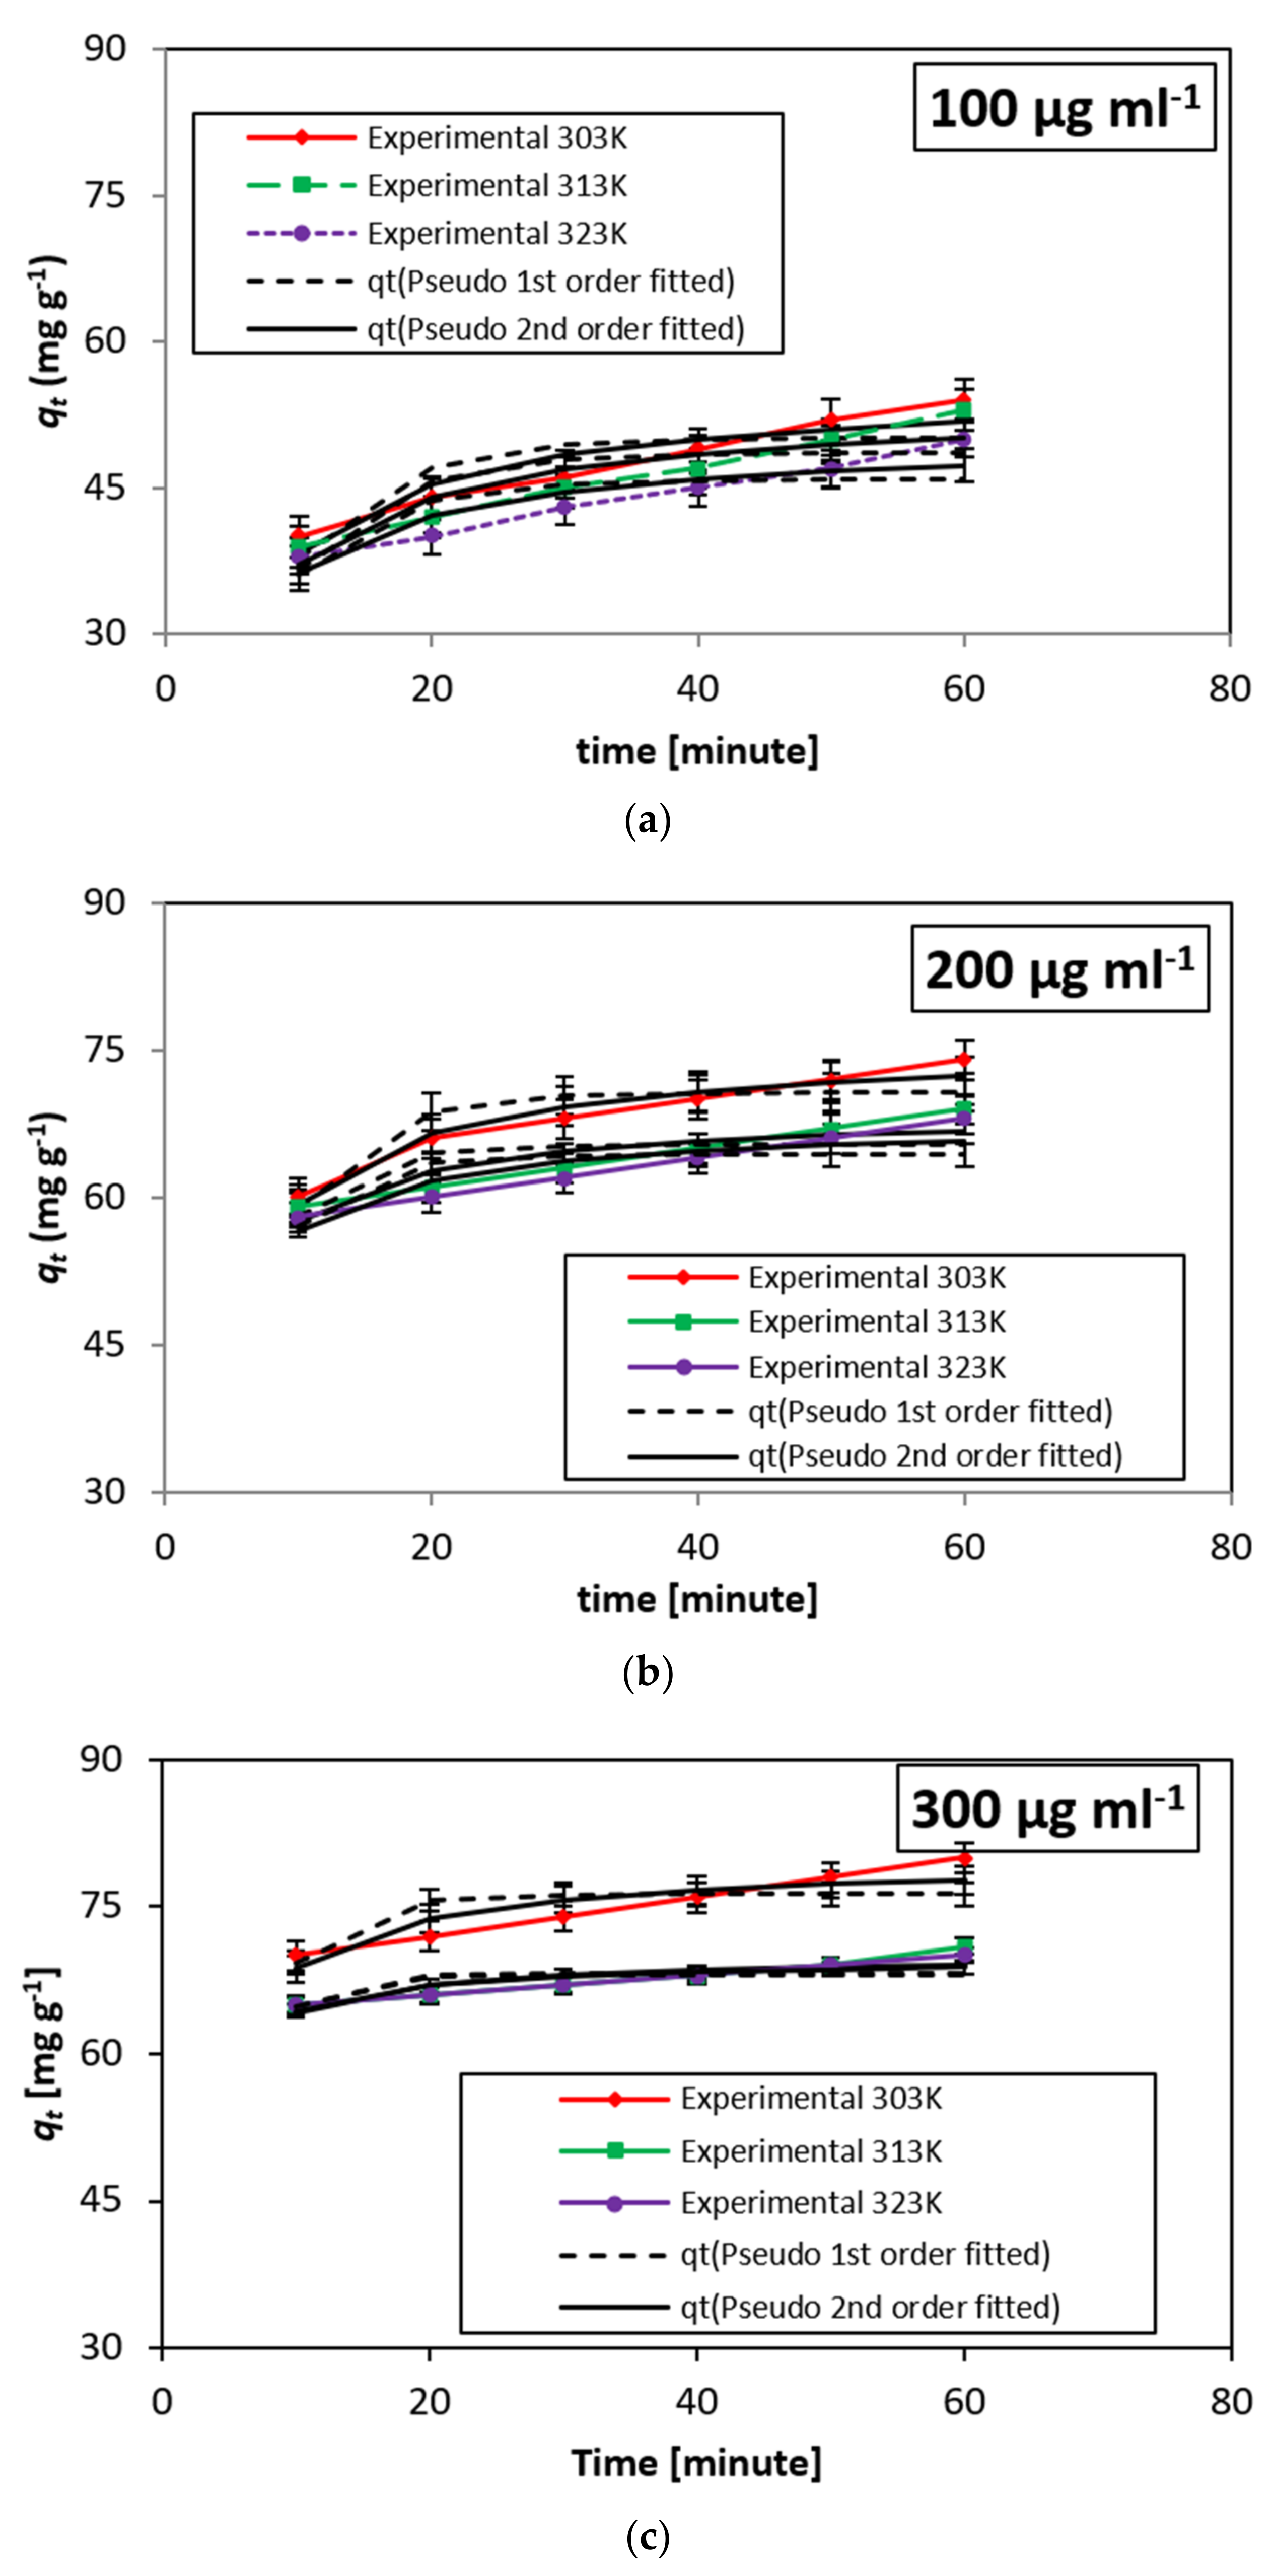
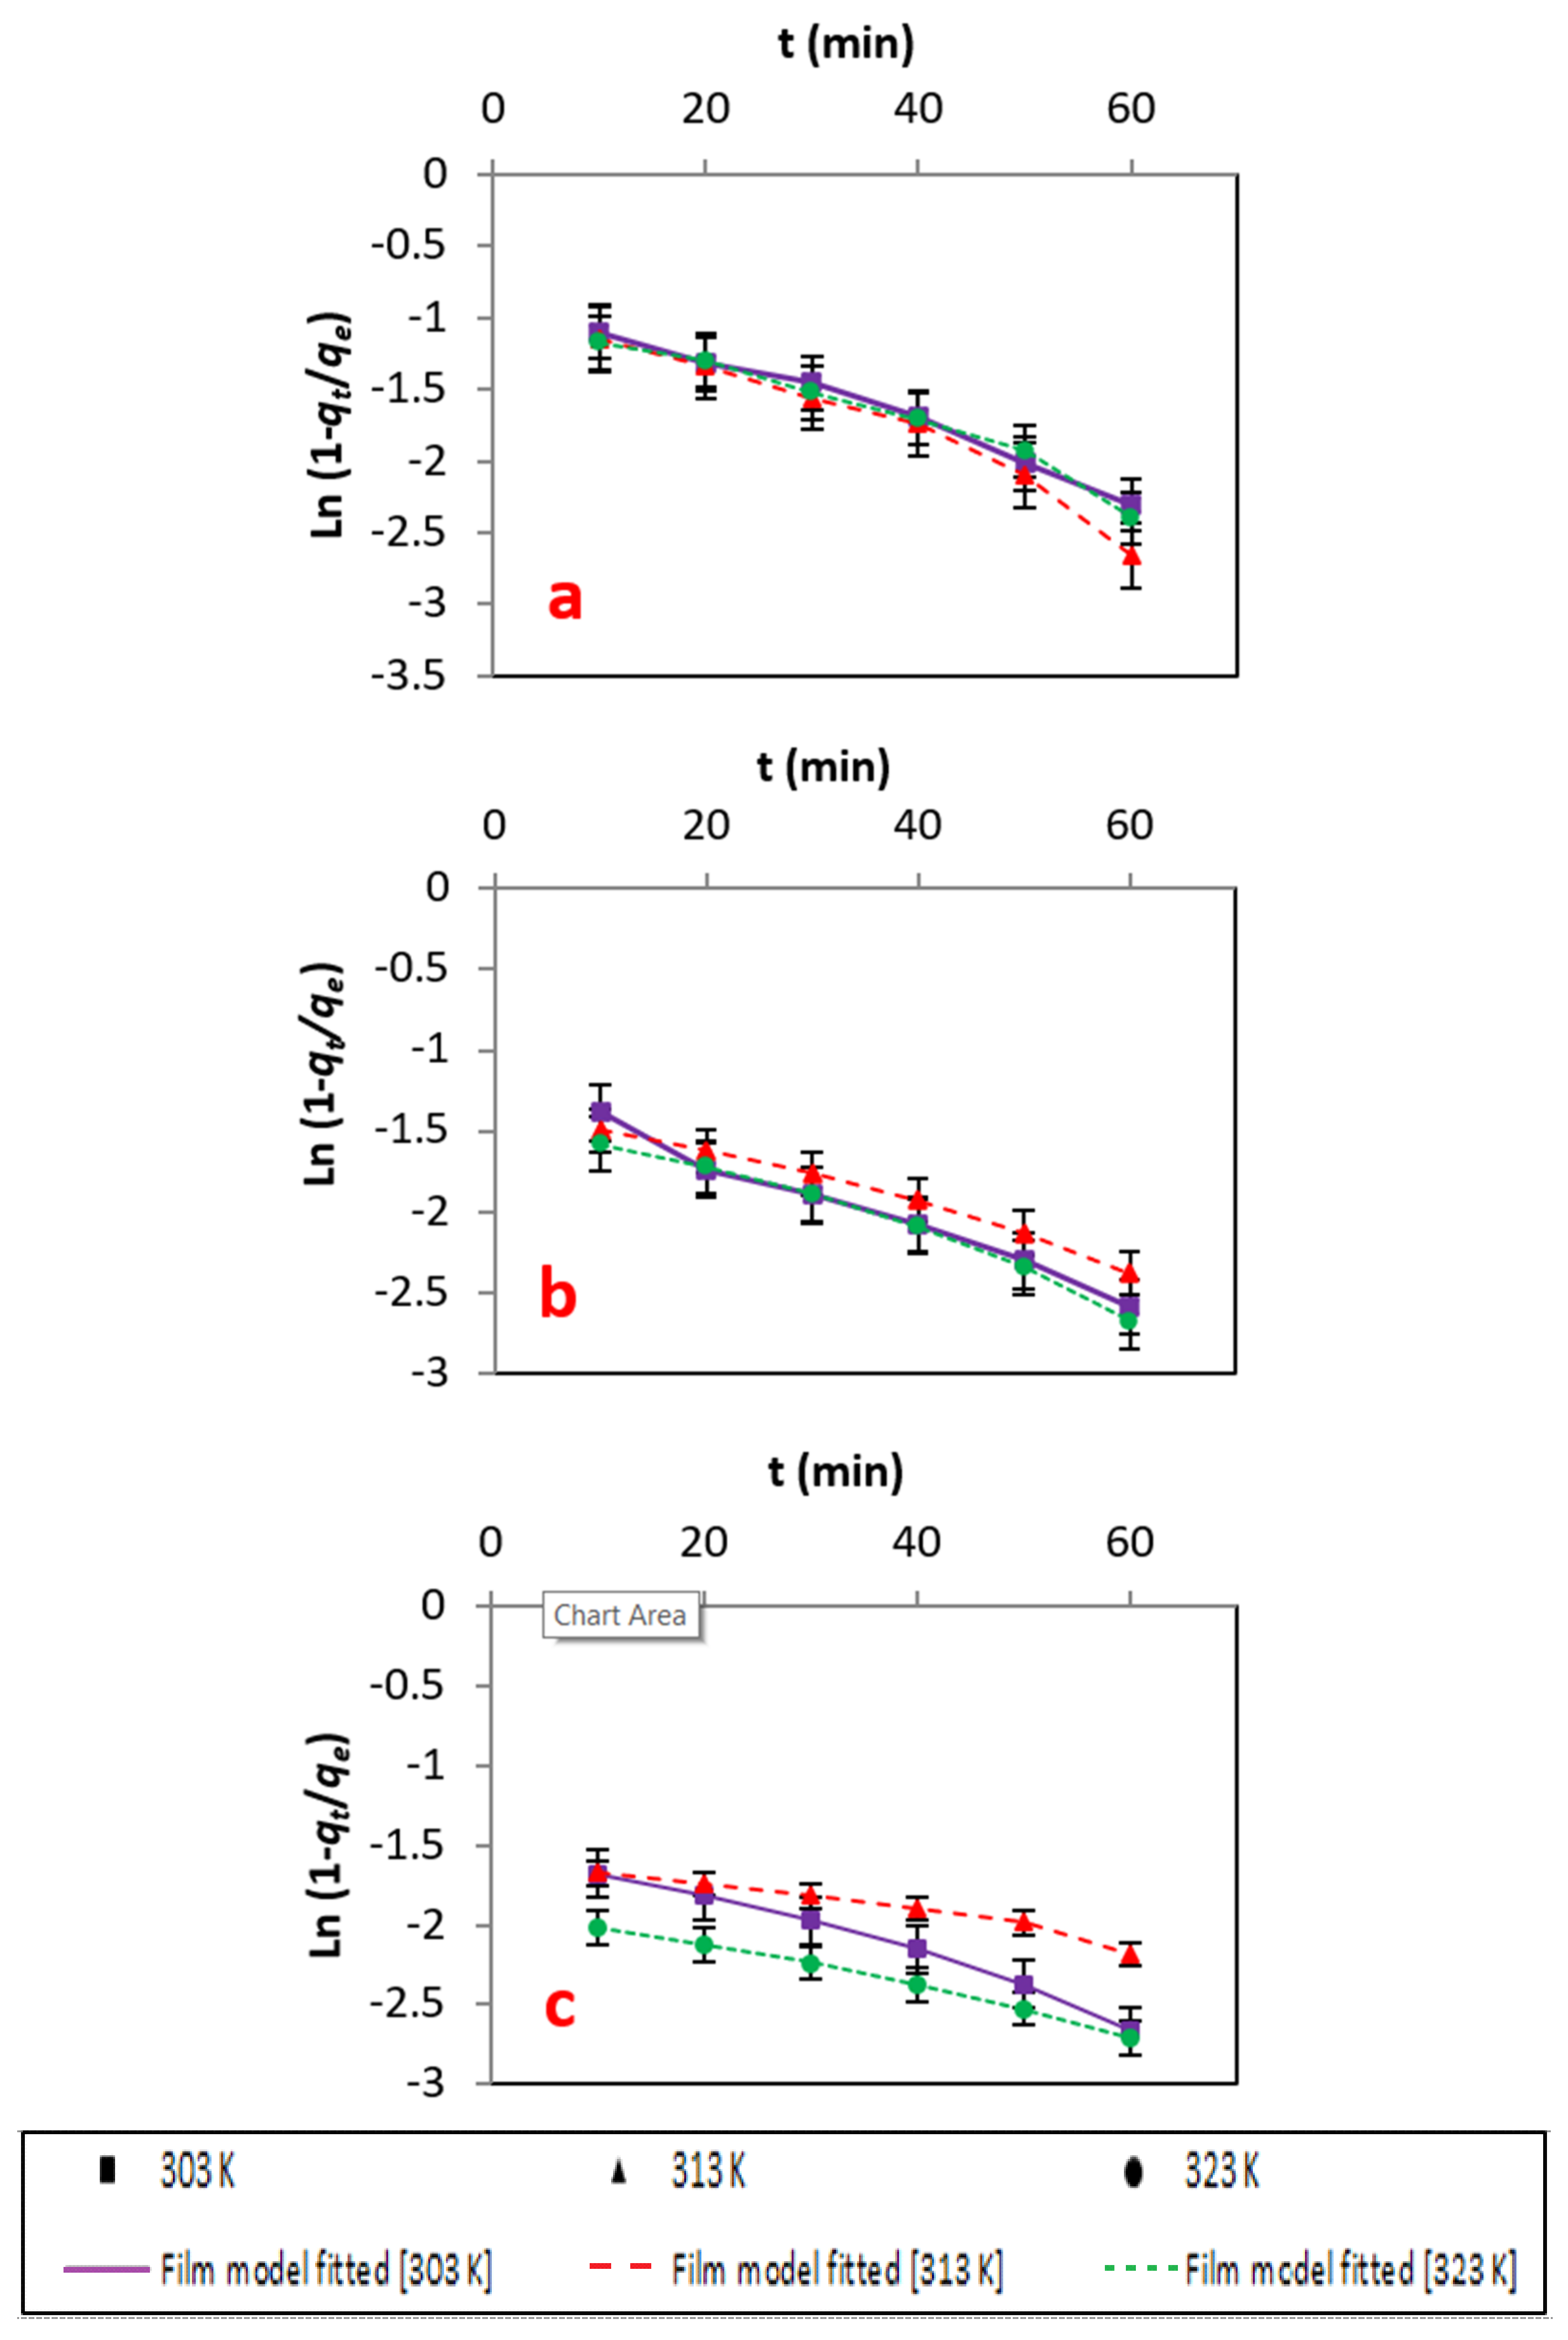
3.4. Adsorption Kinetics
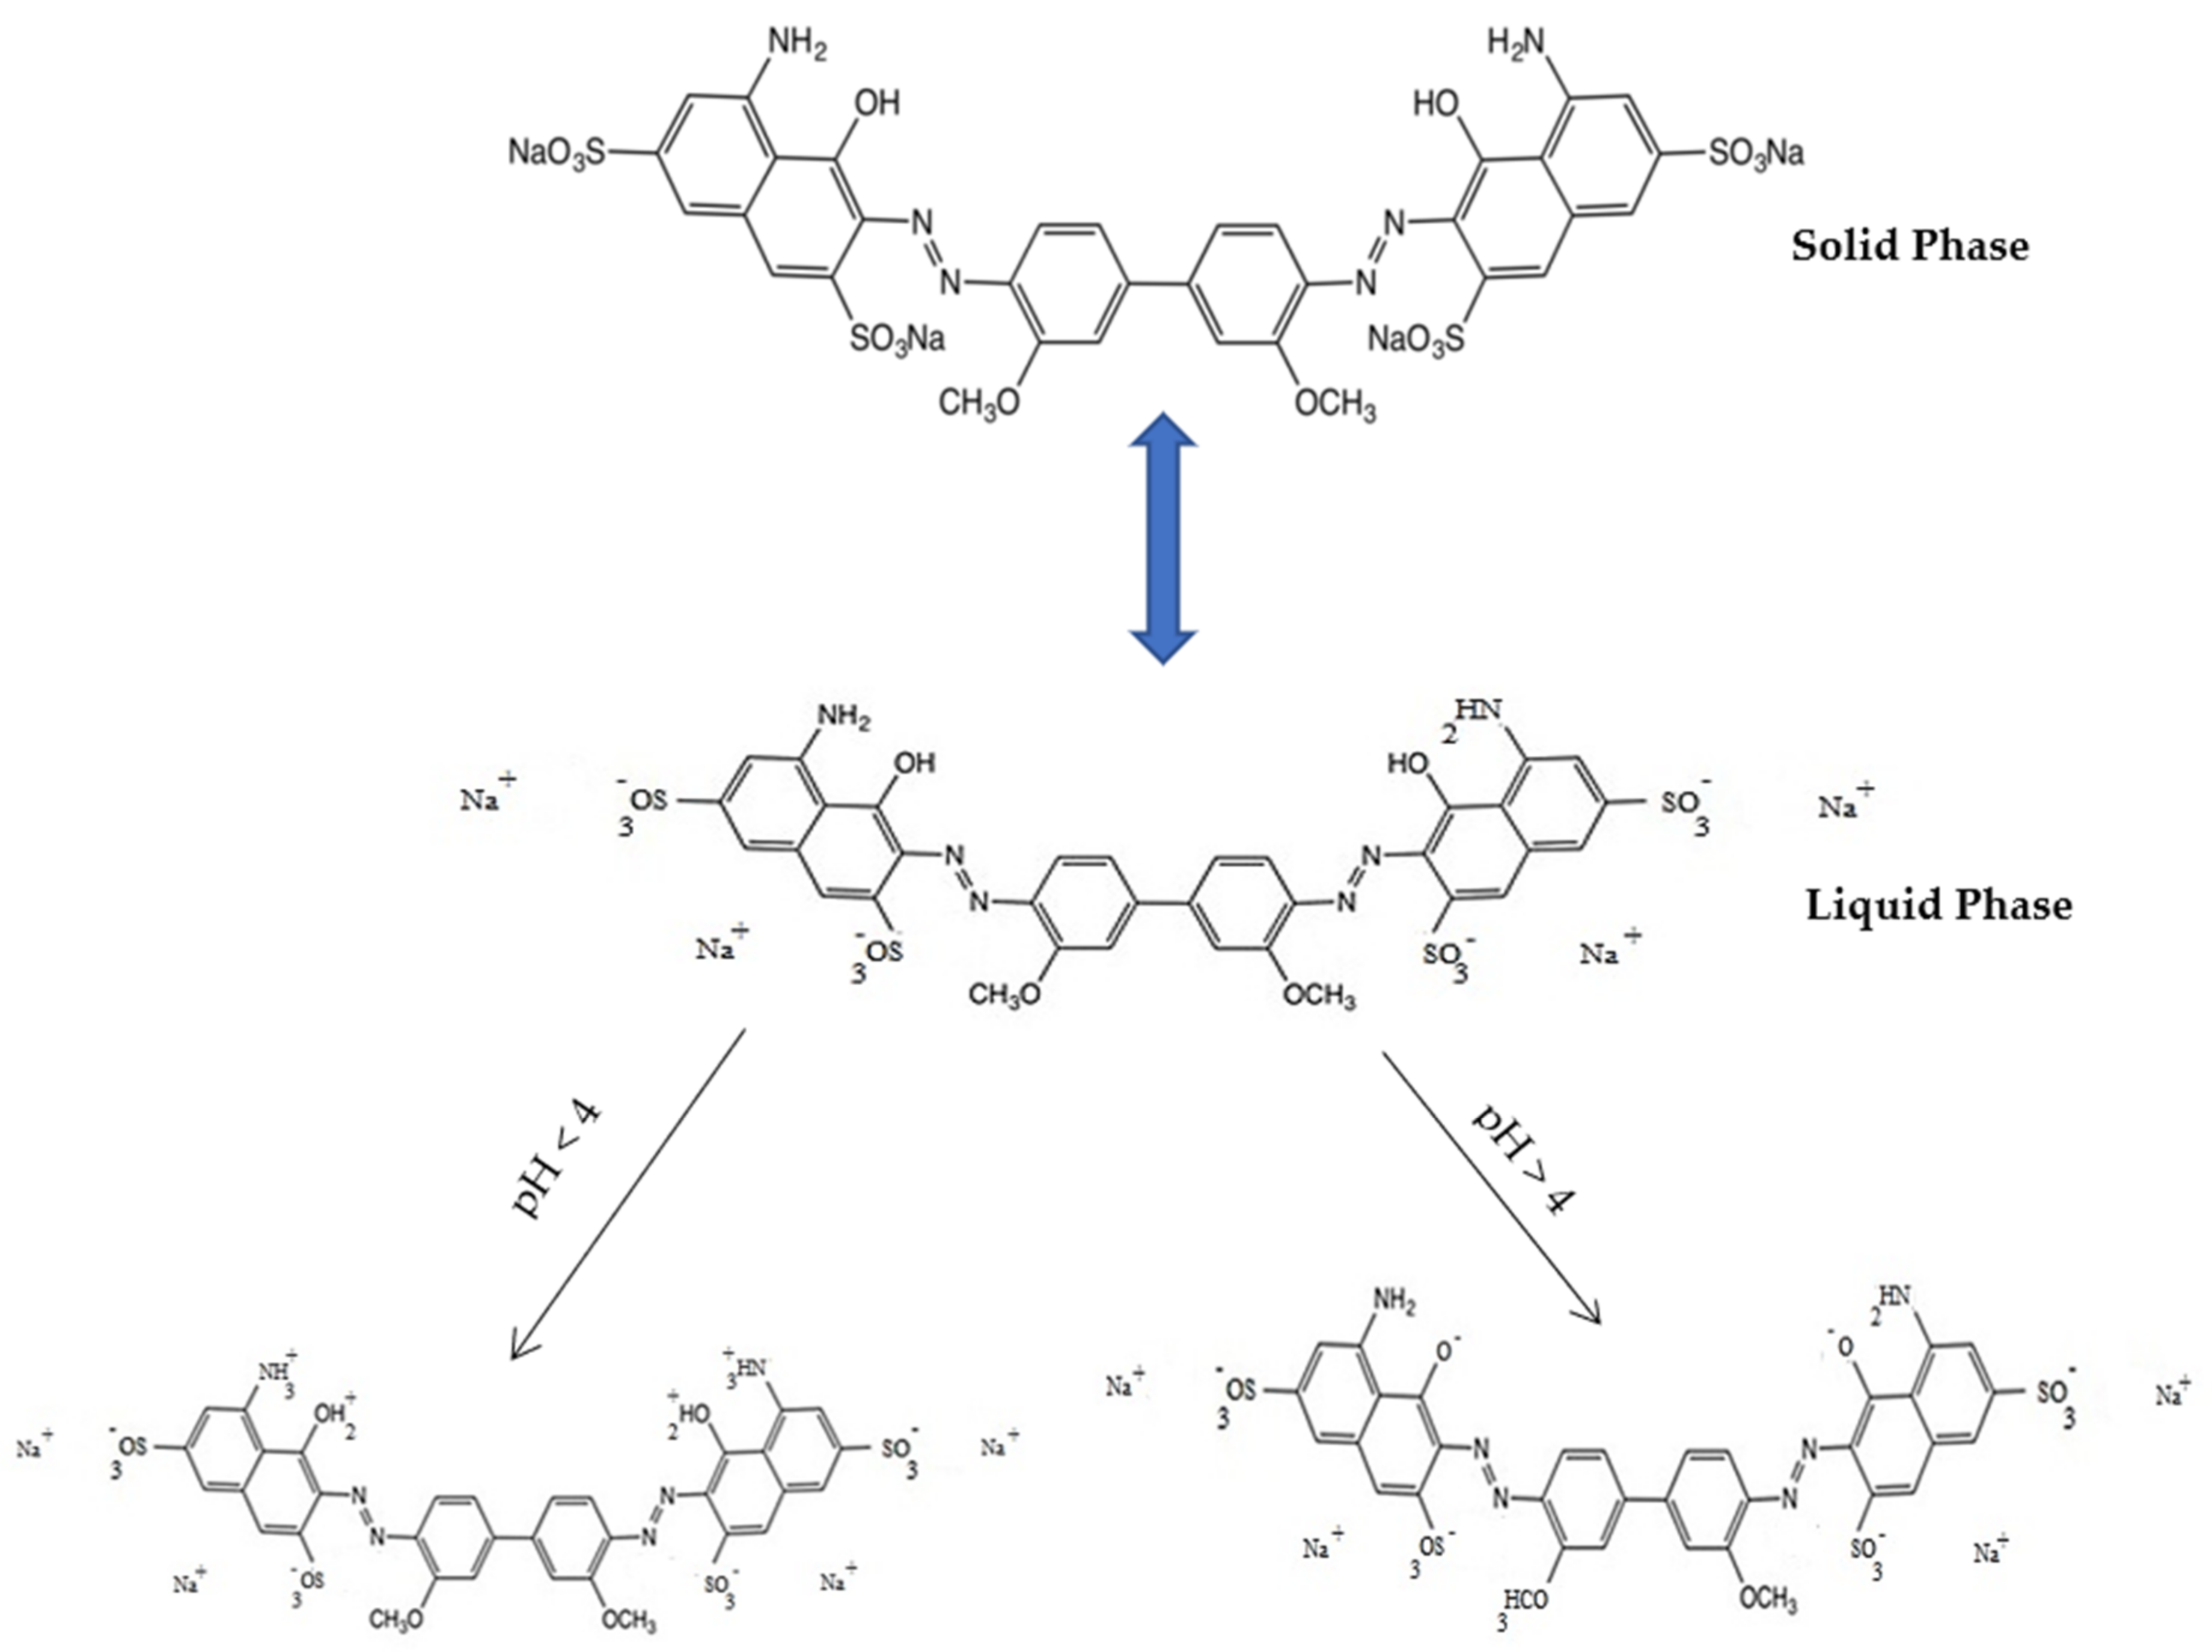
3.5. Mechanistic Study
3.6. Thermodynamics of the Adsorption Process
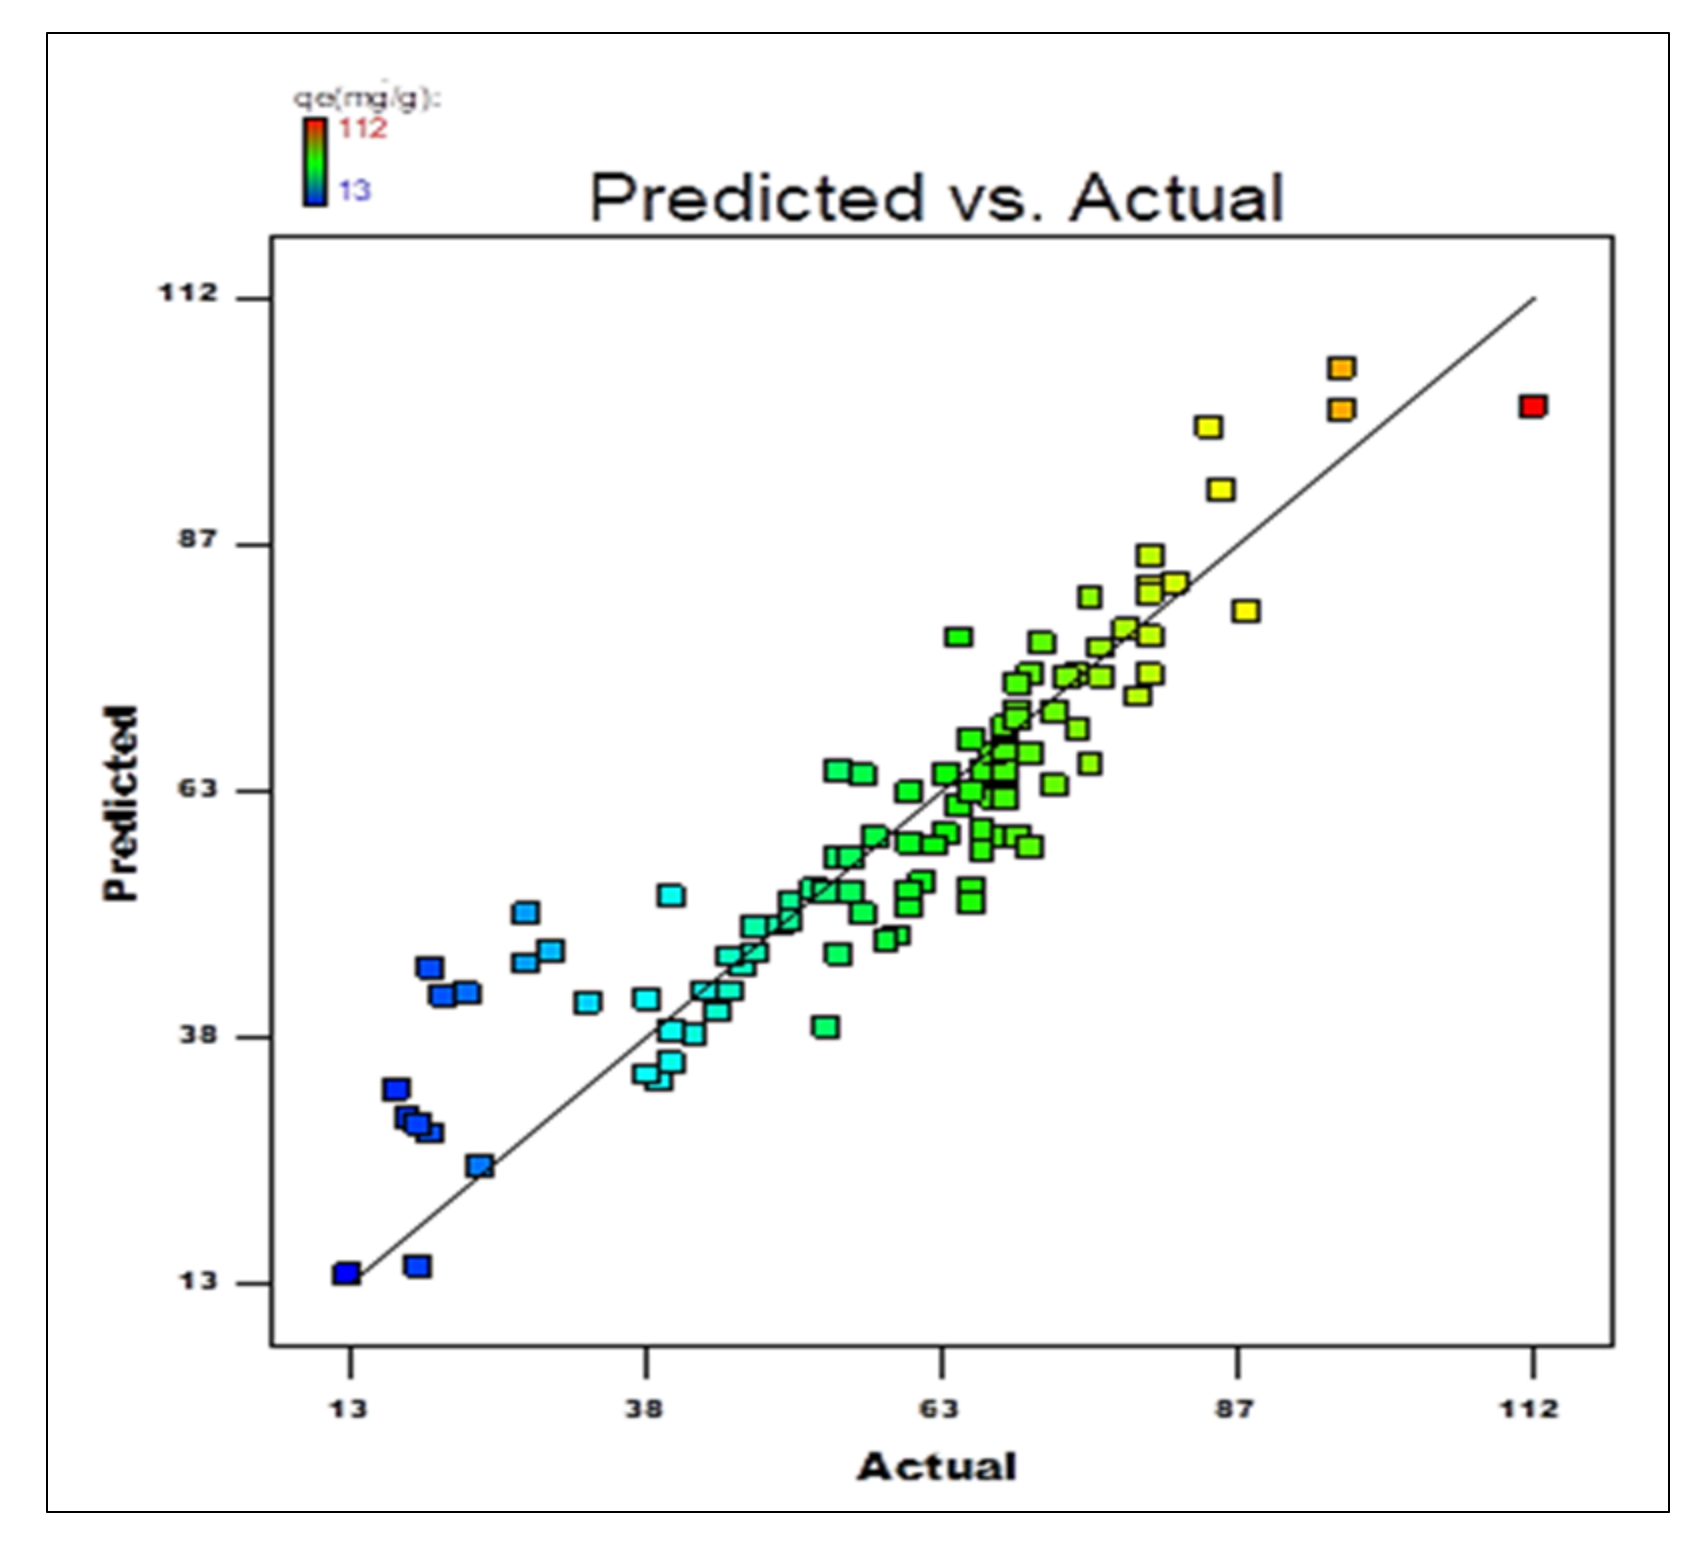
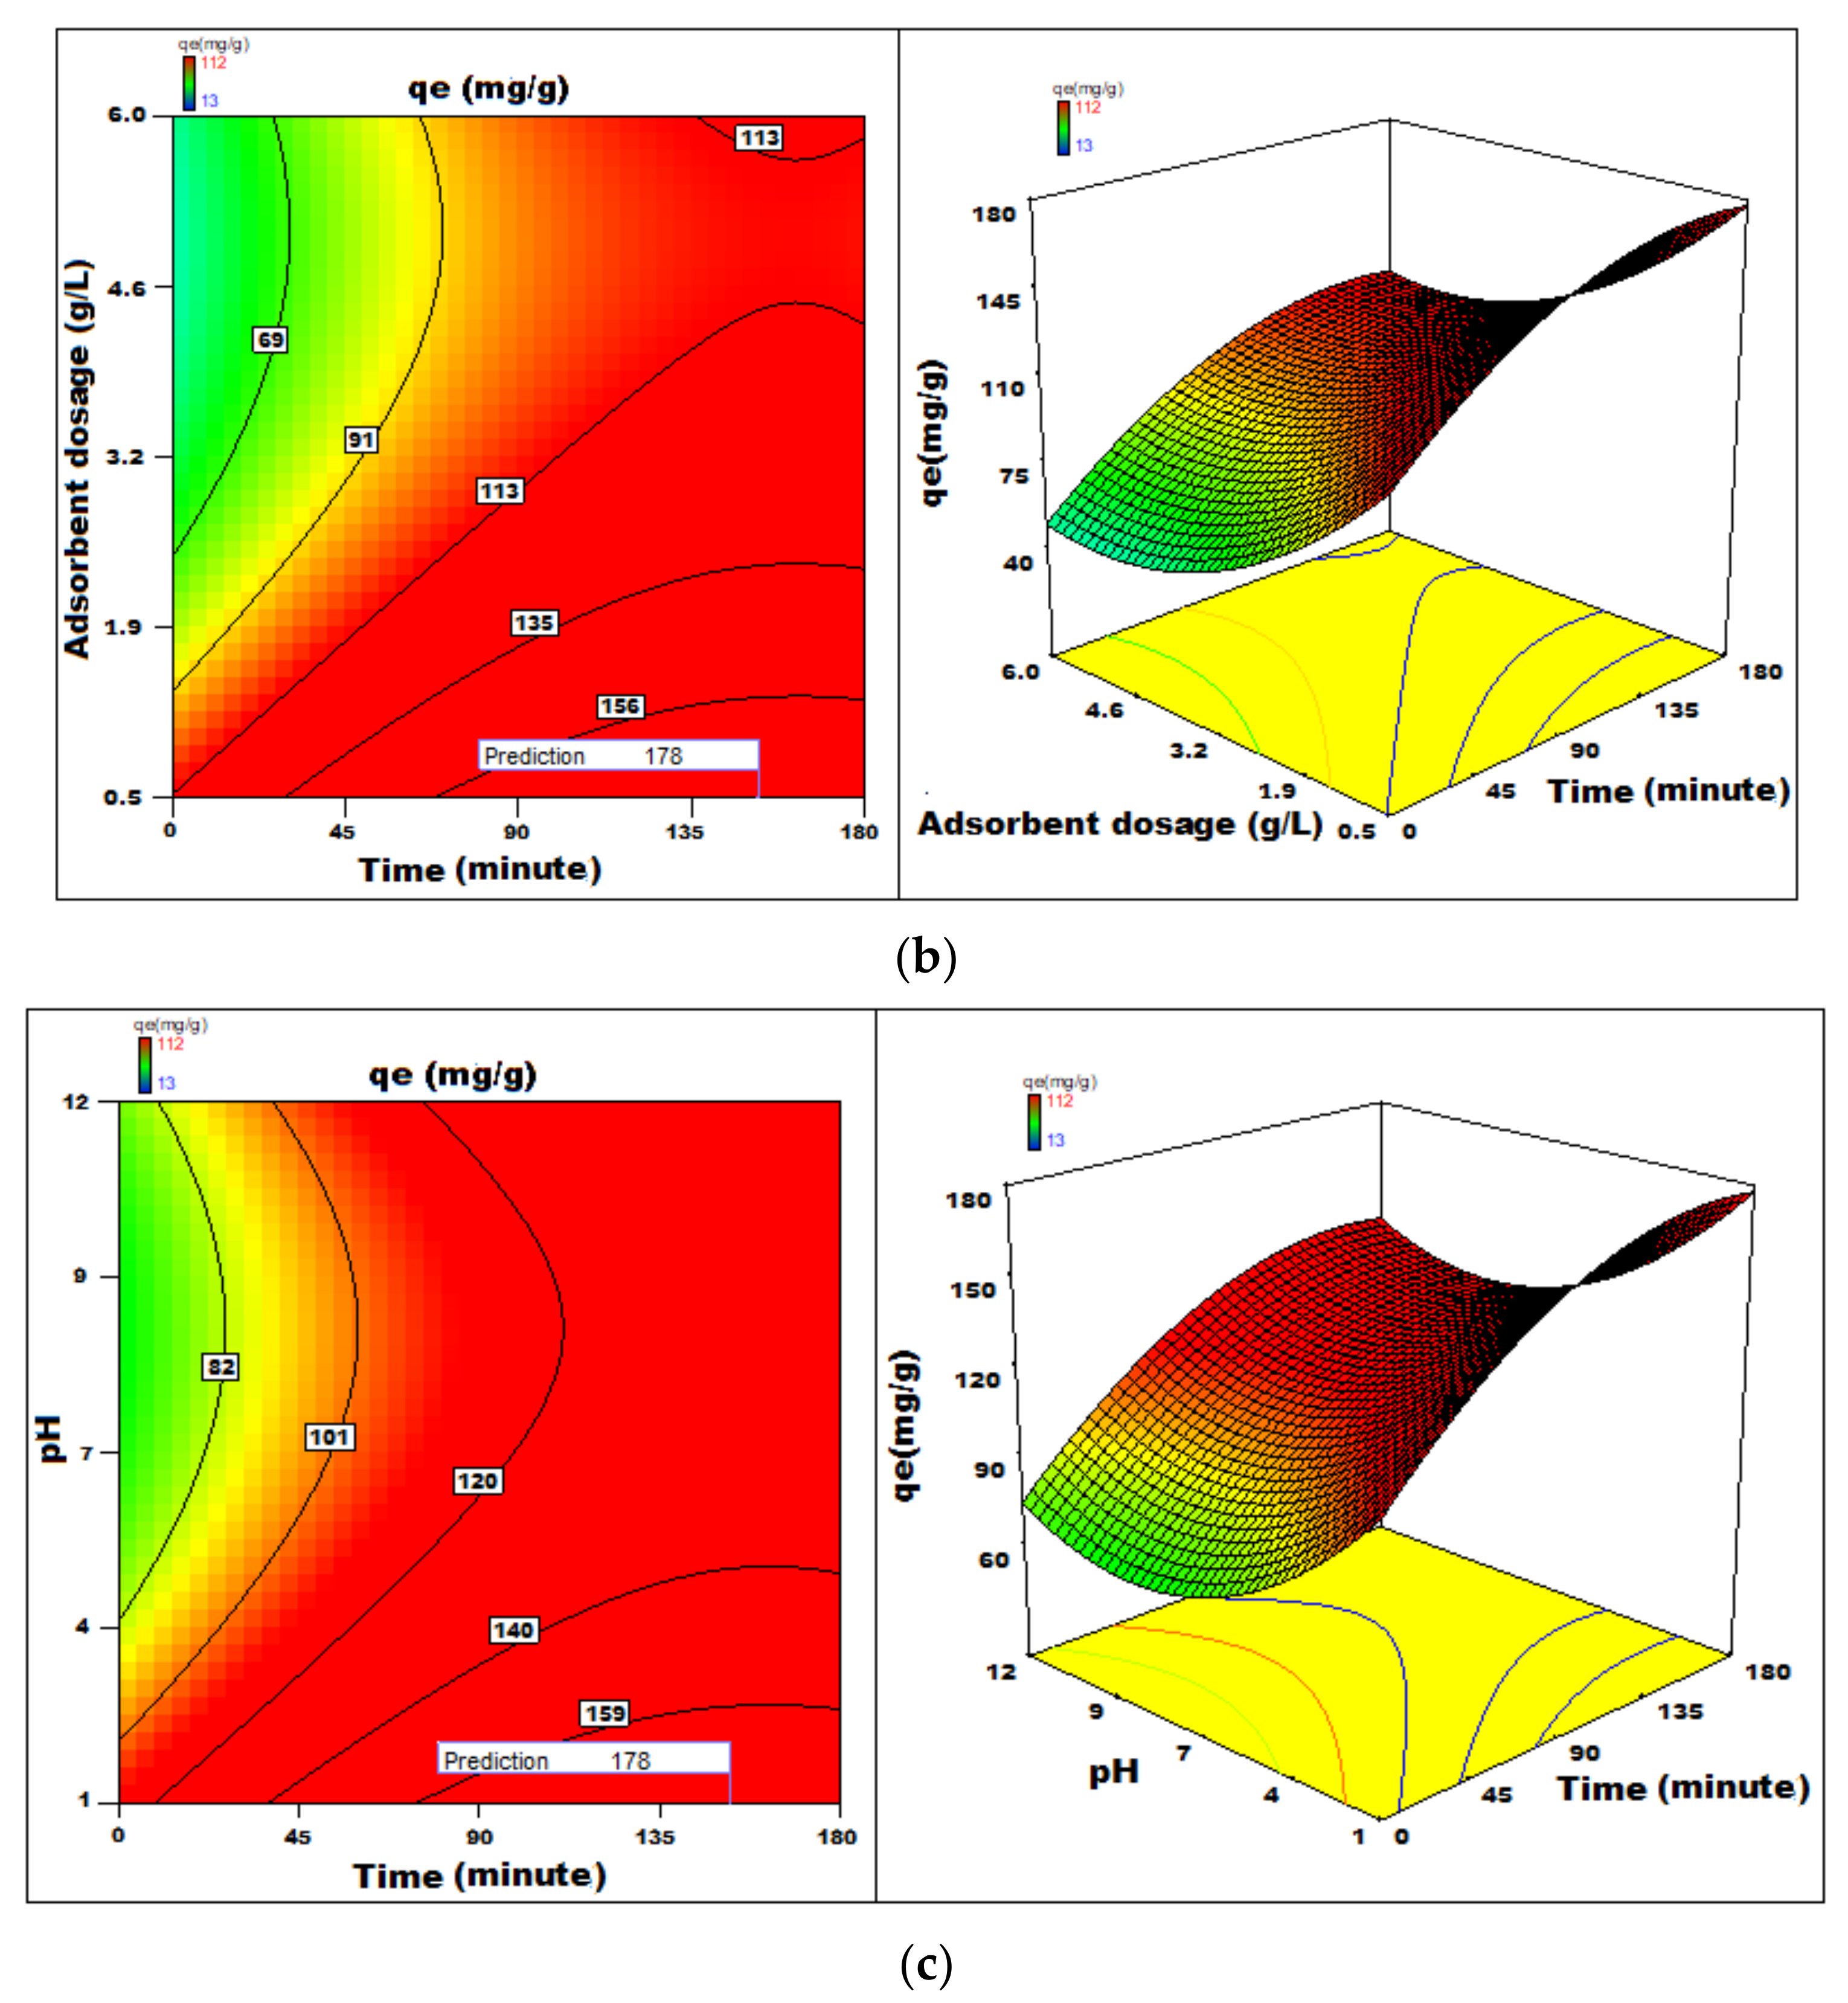
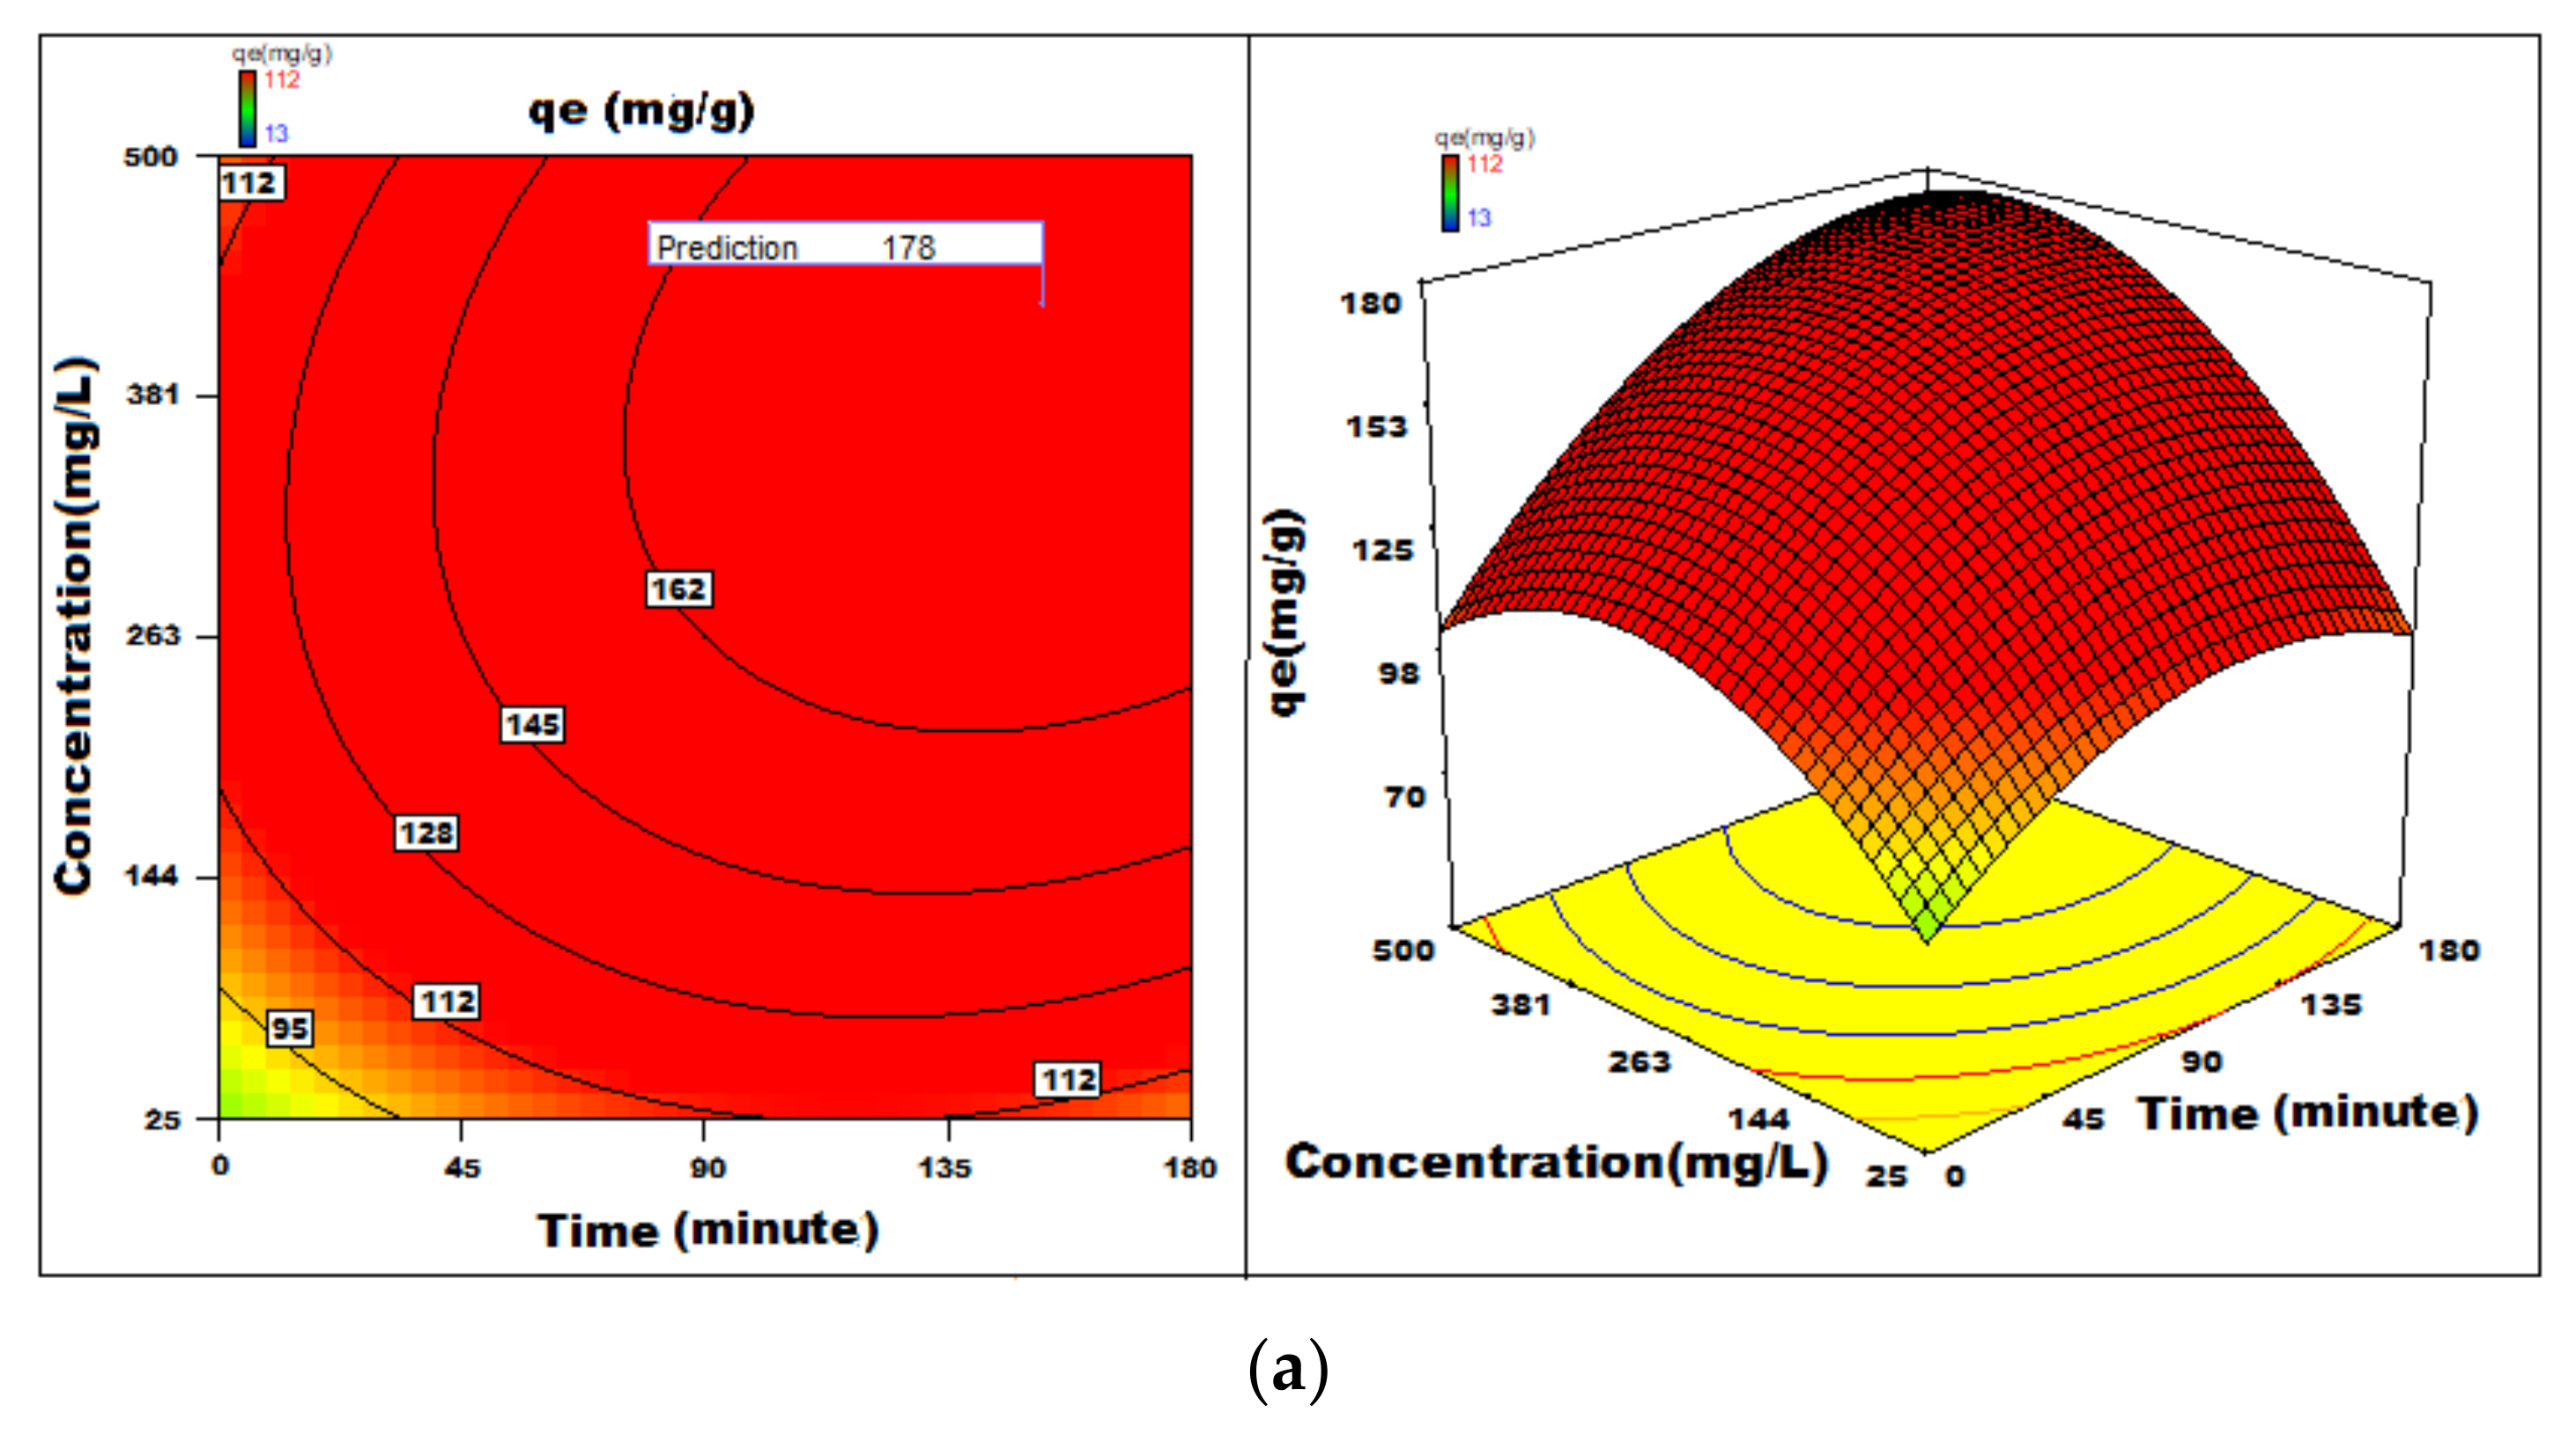
3.7. Statistical Process Optimization
3.8. Adsorption Process for Textile Industrial Effluents
4. Conclusions
Author Contributions
Funding
Institutional Review Board Statement
Informed Consent Statement
Data Availability Statement
Acknowledgments
Conflicts of Interest
References
- Taqui, S.N.; Yahya, R.; Hassan, A.; Nayak, N.; Syed, A.A. A novel sustainable design to develop polypropylene and unsatu-rated polyester resin polymer composites from waste of major polluting industries and investigation on their physicomechan-ical and wear properties. Polym. Compos. 2019, 40, 1142–1157. [Google Scholar] [CrossRef]
- Li, Y.; Lu, L.; Tan, Y.; Wang, L.; Shen, M. Decoupling Water Consumption and Environmental Impact on Textile Industry by Using Water Footprint Method: A Case Study in China. Water 2017, 9, 124. [Google Scholar] [CrossRef]
- Püntener, A.; Page, C. European Ban on Certain Azo Dyes, Quality & Environment. Eur. J. 2004, 14, 231–458. [Google Scholar]
- Kandelbauer, A.; Guebitz, G.M. Bioremediation for the Decolorization of Textile Dyes—A Review. Environ. Chem. 2005, 269–288. [Google Scholar] [CrossRef]
- Robinson, T.; McMullan, G.; Marchant, R.; Nigam, P. Remediation of dyes in textile effluent: A critical review on current treatment technologies with a proposed alternative. Bioresour. Technol. 2001, 77, 247–255. [Google Scholar] [CrossRef]
- Anku, W.W.; Agorku, E.S.; Oppong, S.O.-B.; Karikari, A.Y. Mwcnts attached neodymium doped-ZnOphotocatalysts for efficient removal of dyes from wastewater. SN Appl. Sci. 2020, 2, 1–13. [Google Scholar] [CrossRef]
- Ullah, I.; Ali, S.; Hanif, M.A.; Shahid, S.A. Nanoscience for environmental remediation: A review. Int. J. Chem. Biochem. Sci. 2012, 2, 60–77. [Google Scholar]
- Kheddo, A.; Rhyman, L.; Elzagheid, M.I.; Jeetah, P.; Ramasami, P. Adsorption of synthetic dyed wastewater using activated carbon from rice husk. SN Appl. Sci. 2020, 2, 1–14. [Google Scholar] [CrossRef]
- Strapasson, G.B.; Scheffer, F.R.; Cendron, S.W.; Silva, F.D.C.; Lazzari, N.H.; Azambuja, C.; Peyrot, A.; Weibel, D.E. Visible light sensitization of TiO2/Ag/N nanostructures synthesized by microwave irradiation for oxidative degradation of organic dyes. SN Appl. Sci. 2020, 2, 1–12. [Google Scholar] [CrossRef] [Green Version]
- Papegowda, P.K.; Syed, A.A. Isotherm, Kinetic and Thermodynamic Studies on the Removal of Methylene Blue Dye from Aqueous Solution Using Saw Palmetto Spent. Int. J. Environ. Res. 2017, 11, 91–98. [Google Scholar] [CrossRef]
- Demirbas, A. Agricultural based activated carbons for the removal of dyes from aqueous solutions: A review. J. Hazard. Mater. 2009, 167, 1–9. [Google Scholar] [CrossRef]
- Gupta, V.K.; Kumar, R.; Nayak, A.; Saleh, T.A.; Barakat, M.A. Adsorptive removal of dyes from aqueous solution onto carbon nanotubes: A review. Adv. Colloid Interface Sci. 2013, 193, 24–34. [Google Scholar] [CrossRef]
- Garrido-Ramírez, E.G.; Theng, B.K.; Mora, M.L. Clays and oxide minerals as catalysts and nanocatalysts in Fenton-like reac-tions—A review. Appl. Clay Sci. 2010, 47, 182–192. [Google Scholar] [CrossRef]
- Carretero, M.I.; Pozo, M. Clay and non-clay minerals in the pharmaceutical and cosmetic industries Part II. Active ingredients. Appl. Clay Sci. 2010, 47, 171–181. [Google Scholar] [CrossRef]
- Ambre, A.H.; Katti, K.S.; Katti, D. Nanoclay Based Composite Scaffolds for Bone Tissue Engineering Applications. J. Nanotechnol. Eng. Med. 2010, 1, 031013. [Google Scholar] [CrossRef]
- Vinokurov, V.; Novikov, A.; Rodnova, V.; Anikushin, B.; Kotelev, M.; Ivanov, E.; Lvov, Y. Cellulose Nanofibrils and Tubular Halloysite as Enhanced Strength Gelation Agents. Polymers 2019, 11, 919. [Google Scholar] [CrossRef] [PubMed] [Green Version]
- Chequer, F.D.; de Oliveira, G.R.; Ferraz, E.A.; Cardoso, J.C.; Zanoni, M.B.; de Oliveira, D.P. Textile dyes: Dyeing process and environmental impact. In Eco-Friendly Textile Dyeing and Finishing; IntechOpen: London, UK, 2013; Volume 6, pp. 151–176. [Google Scholar]
- Sanghi, R.; Bhattacharya, B. Review on decolorisation of aqueous dye solutions by low cost adsorbents. Color. Technol. 2002, 118, 256–269. [Google Scholar] [CrossRef]
- Sulthana, R.; Taqui, S.N.; Zameer, F.; Syed, U.T.; Syed, A.A. Adsorption of ethidium bromide from aqueous solution onto nutraceutical industrial fennel seed spent: Kinetics and thermodynamics modeling studies. Int. J. Phytoremediat. 2018, 20, 1075–1086. [Google Scholar] [CrossRef]
- Taqui, S.N.; Yahya, R.; Hassan, A.; Nayak, N.; Syed, A.A. Adsorption of Acid Blue 113 from aqueous solution onto nutraceutical industrial coriander seed spent: Isotherm, kinetics, thermodynamics and modeling studies. Desalin. Water Treat. 2019, 153, 321–337. [Google Scholar] [CrossRef]
- Taqui, S.N.; Yahya, R.; Hassan, A.; Nayak, N.; Syed, A.A. Development of sustainable dye adsorption system using nutraceutical industrial fennel seed spent—studies using Congo red dye. Int. J. Phytoremediat. 2017, 19, 686–694. [Google Scholar] [CrossRef] [PubMed]
- Allah, M.A.H.D.; Taqui, S.N.; Syed, U.T.; Syed, A.A. Development of sustainable acid blue 113 dye adsorption system using nutraceutical industrial Tribulusterrestris spent. SN Appl. Sci. 2019, 1, 330. [Google Scholar] [CrossRef] [Green Version]
- Childress, A.E.; Elimelech, M. Effect of solution chemistry on the surface charge of polymeric reverse osmosis and nanofiltra-tion membranes. J. Membr. Sci. 1996, 119, 253–268. [Google Scholar] [CrossRef]
- Baral, S.; Das, N.; Chaudhury, G.R.; Das, S. A preliminary study on the adsorptive removal of Cr (VI) using seaweed, Hydrilla verticillata. J. Hazard. Mater. 2009, 171, 358–369. [Google Scholar] [CrossRef] [PubMed]
- Alkan, M.; Demirbaş, Ö.; Doğan, M. Adsorption kinetics and thermodynamics of an anionic dye onto sepiolite. Microporous Mesoporous Mater. 2007, 101, 388–396. [Google Scholar] [CrossRef]
- Langmuir, I. The constitution and fundamental properties of solids and liquids. Part I. Solids. J. Am. Chem. Soc. 1916, 38, 2221–2295. [Google Scholar] [CrossRef] [Green Version]
- Freundlich, H. Over the adsorption in solution. J. Phys. Chem. 1906, 57, 1100–1107. [Google Scholar]
- Jovanović, D.S. Physical adsorption of gases. Colloid Polym. Sci. 1969, 235, 1214–1225. [Google Scholar] [CrossRef]
- Dubinin, M. The equation of the characteristic curve of activated charcoal. Proc. USSR Acad. Sci. 1947, 55, 327–329. [Google Scholar]
- Yakutha, S.A.; Taquib, S.N.; Syedc, U.T.; Syeda, A.A. Nutraceutical industrial chillies stalk waste as a new adsorbent for the removal of Acid Violet 49 from water and textile industrial effluent: Adsorption isotherms and kinetic models. Desalin. Water Treat. 2019, 155, 94–112. [Google Scholar] [CrossRef] [Green Version]
- Toth, J. State equation of the solid-gas interface layers. Acta Chim. Hung. 1971, 69, 311–328. [Google Scholar]
- Brouers, F.; Sotolongo-Costa, O.; Marquez, F.; Pirard, J.-P. Microporous and heterogeneous surface adsorption isotherms arising from Levy distributions. Phys. A Stat. Mech. Its Appl. 2005, 349, 271–282. [Google Scholar] [CrossRef]
- Vieth, W.; Sladek, K. A model for diffusion in a glassy polymer. J. Colloid Sci. 1965, 20, 1014–1033. [Google Scholar] [CrossRef]
- Radke, C.J.; Prausnitz, J.M. Adsorption of Organic Solutes from Dilute Aqueous Solution of Activated Carbon. Ind. Eng. Chem. Fundam. 1972, 11, 445–451. [Google Scholar] [CrossRef]
- Redlich, O.; Peterson, D.L. A Useful Adsorption Isotherm. J. Phys. Chem. 1959, 63, 1024. [Google Scholar] [CrossRef]
- Lagergren, S.K. About the theory of so-called adsorption of soluble substances. Sven. Vetenskapsakad. Handingarl 1898, 24, 1–39. [Google Scholar]
- Ho, Y.-S.; McKay, G. Sorption of dye from aqueous solution by peat. Chem. Eng. J. 1998, 70, 115–124. [Google Scholar] [CrossRef]
- Boyd, E.G.; Adamson, W.A.; Myers, S.L., Jr. The exchange adsorption of ions from aqueous solutions by organic zeolites. II. Kinetics1. J. Am. Chem. Soc. 1947, 69, 2836–2848. [Google Scholar] [CrossRef]
- Wang, H.-L.; Chen, J.-L.; Zhai, Z.-C. Study on thermodynamics and kinetics of adsorption of p-toluidine from aqueous solu-tion by hypercrosslinked polymeric adsorbents. Environ. Chem.-Beijing 2004, 23, 192–196. [Google Scholar]
- Taqui, S.N.; Yahya, R.; Hassan, A.; Khanum, F.; Syed, A.A. Valorization of Nutraceutical Industrial Coriander Seed Spent by the Process of Sustainable Adsorption System of Acid Black 52 from Aqueous Solution. Int. J. Environ. Res. 2019, 13, 639–659. [Google Scholar] [CrossRef]
- Shahsavar, A.; Khanmohammadi, S.; Karimipour, A.; Goodarzi, M. A novel comprehensive experimental study concerned synthesizes and prepare liquid paraffin-Fe3O4 mixture to develop models for both thermal conductivity & viscosity: A new approach of GMDH type of neural network. Int. J. Heat Mass Transf. 2019, 131, 432–441. [Google Scholar] [CrossRef]
- Jiang, Y.; Bahrami, M.; Bagherzadeh, S.A.; Abdollahi, A.; Sulgani, M.T.; Karimipour, A.; Goodarzi, M.; Bach, Q.-V. Propose a new approach of fuzzy lookup table method to predict Al2O3/deionized water nanofluid thermal conductivity based on achieved empirical data. Phys. A Stat. Mech. Its Appl. 2019, 527, 121177. [Google Scholar] [CrossRef]
- Liu, W.; Malekahmadi, O.; Bagherzadeh, S.A.; Ghashang, M.; Karimipour, A.; Hasani, S.; Tlili, I.; Goodarzi, M. A novel comprehensive experimental study concerned graphene oxide nanoparticles dispersed in water: Synthesise, characterisation, thermal conductivity measurement and present a new approach of R87847LSF neural network. Int. Commun. Heat Mass Transf. 2019, 109, 104333. [Google Scholar] [CrossRef]
- Farade, R.A.; Wahab, N.I.B.A.; Mansour, D.E.A.; Azis, N.B.; Jasni, J.; Banapurmath, N.R.; Soudagar, M.E.M. Investigation of the dielectric and thermal properties of non-edible cottonseed oil by infusing h-BN nanoparticles. IEEE Access 2020, 8, 76204–76217. [Google Scholar] [CrossRef]
- Yaradoddi, J.S.; Banapurmath, N.R.; Ganachari, S.V.; Soudagar, M.E.M.; Mubarak, N.M.; Hallad, S.; Hugar, S.; Fayaz, H. Biodegradable carboxymethyl cellulose based material for sustainable packaging application. Sci. Rep. 2020, 10, 1–13. [Google Scholar] [CrossRef] [PubMed]
- Ahmed, W.; Kazi, S.N.; Chowdhury, Z.Z.; Johan, M.R.B.; Soudagar, M.E.M.; Mujtaba, M.A.; Gul, M.; Badruddin, I.A.; Kamangar, S. Ultrasonic assisted new Al2O3@ TiO2-ZnO/DW ternary composites nanofluids for enhanced energy transportation in a closed horizontal circular flow passage. Int. Commun. Heat Mass Transf. 2021, 120, 105018. [Google Scholar] [CrossRef]
- Peng, Y.; Khaled, U.; Al-Rashed, A.A.; Meer, R.; Goodarzi, M.; Sarafraz, M. Potential application of Response Surface Methodology (RSM) for the prediction and optimization of thermal conductivity of aqueous CuO (II) nanofluid: A statistical approach and experimental validation. Phys. A Stat. Mech. Its Appl. 2020, 554, 124353. [Google Scholar] [CrossRef]
- Wu, H.; Bagherzadeh, S.A.; D’Orazio, A.; Habibollahi, N.; Karimipour, A.; Goodarzi, M.; Bach, Q.-V. Present a new multi objective optimization statistical Pareto frontier method composed of artificial neural network and multi objective genetic algorithm to improve the pipe flow hydrodynamic and thermal properties such as pressure drop and heat transfer coefficient for non-Newtonian binary fluids. Phys. A Stat. Mech. Its Appl. 2019, 535, 122409. [Google Scholar] [CrossRef]
- Ghasemi, A.; Hassani, M.; Goodarzi, M.; Afrand, M.; Manafi, S. Appraising influence of COOH-MWCNTs on thermal conductivity of antifreeze using curve fitting and neural network. Phys. A Stat. Mech. Its Appl. 2019, 514, 36–45. [Google Scholar] [CrossRef]
- Afzal, A.; Khan, S.A.; Islam, M.T.; Jilte, R.D.; Khan, A.; Soudagar, M.E.M. Investigation and back-propagation modeling of base pressure at sonic and supersonic Mach numbers. Phys. Fluids 2020, 32, 096109. [Google Scholar] [CrossRef]
- Farade, R.A.; Abdul Wahab, N.I.; Mansour, D.E.A.; Azis, N.B.; Soudagar, M.E.M.; Siddappa, V. Development of Graphene Oxide-Based Nonedible Cottonseed Nanofluids for Power Transformers. Materials 2020, 13, 2569. [Google Scholar] [CrossRef]
- Giwa, S.O.; Sharifpur, M.; Goodarzi, M.; Alsulami, H.; Meyer, J.P. Influence of base fluid, temperature, and concentration on the thermophysical properties of hybrid nanofluids of alumina–ferrofluid: Experimental data, modeling through enhanced ANN, ANFIS, and curve fitting. J. Therm. Anal. Calorim. 2021, 143, 4149–4167. [Google Scholar] [CrossRef]
- Karimipour, A.; Bagherzadeh, S.A.; Goodarzi, M.; Alnaqi, A.A.; Bahiraei, M.; Safaei, M.R.; Shadloo, M.S. Synthesized CuFe2O4/SiO2 nanocomposites added to water/EG: Evaluation of the thermophysical properties beside sensitivity analysis & EANN. Int. J. Heat Mass Transf. 2018, 127, 1169–1179. [Google Scholar] [CrossRef]
- Peng, Y.; Parsian, A.; Khodadadi, H.; Akbari, M.; Ghani, K.; Goodarzi, M.; Bach, Q.-V. Develop optimal network topology of artificial neural network (AONN) to predict the hybrid nanofluids thermal conductivity according to the empirical data of Al2O3-Cu nanoparticles dispersed in ethylene glycol. Phys. A Stat. Mech. Its Appl. 2020, 549, 124015. [Google Scholar] [CrossRef]
- Ahmadi, M.H.; Mohseni-Gharyehsafa, B.; Ghazvini, M.; Goodarzi, M.; Jilte, R.; Kumar, R. Comparing various machine learning approaches in modeling the dynamic viscosity of CuO/water nanofluid. J. Therm. Anal. Calorim. 2019, 139, 2585–2599. [Google Scholar] [CrossRef]
- Alrashed, A.A.; Akbari, O.A.; Heydari, A.; Toghraie, D.; Zarringhalam, M.; Shabani, G.A.S.; Seifi, A.R.; Goodarzi, M. The numerical modeling of water/FMWCNT nanofluid flow and heat transfer in a backward-facing contracting channel. Phys. B Condens. Matter 2018, 537, 176–183. [Google Scholar] [CrossRef]
- Alrashed, A.A.; Gharibdousti, M.S.; Goodarzi, M.; de Oliveira, L.R.; Safaei, M.R.; Filho, E.B. Effects on thermophysical properties of carbon based nanofluids: Experimental data, modelling using regression, ANFIS and ANN. Int. J. Heat Mass Transf. 2018, 125, 920–932. [Google Scholar] [CrossRef]
- Bahrami, M.; Akbari, M.; Bagherzadeh, S.A.; Karimipour, A.; Afrand, M.; Goodarzi, M. Develop 24 dissimilar ANNs by suitable architectures & training algorithms via sensitivity analysis to better statistical presentation: Measure MSEs between targets & ANN for Fe-CuO/Eg–Water nanofluid. Phys. A Stat. Mech. Its Appl. 2019, 519, 159–168. [Google Scholar] [CrossRef]
- Hossain, N.; Mahlia, T.M.I.; Miskat, M.I.; Chowdhury, T.; Barua, P.; Chowdhury, H.; Nizamuddin, S.; Ahmad, N.B.; Zaharin, N.A.B.; Mazari, S.A.; et al. Bioethanol production from forest residues and life cycle cost analysis of bioethanol-gasoline blend on transportation sector. J. Environ. Chem. Eng. 2021, 9, 105542. [Google Scholar] [CrossRef]
- Ahmed, W.; Kazi, S.N.; Chowdhury, Z.Z.; Johan, M.R.B.; Mehmood, S.; Soudagar, M.E.M.; Mujtaba, M.A.; Gul, M.; Ahmad, M.S. Heat transfer growth of sonochemically synthesized novel mixed metal oxide ZnO+ Al2O3+ TiO2/DW based ternary hybrid nanofluids in a square flow conduit. Renew. Sustain. Energy Rev. 2021, 145, 111025. [Google Scholar] [CrossRef]
- Ahmed, W.; Chowdhury, Z.Z.; Kazi, S.N.; Johan, M.R.B.; Abdelrazek, A.H.; Fayaz, H.; Badruddin, I.; Mujtaba, M.A.; Soudagar, M.E.M.; Akram, N.; et al. Experimental evaluation and numerical verification of enhanced heat transportation by using ultrasonic assisted nanofluids in a closed horizontal circular passage. Case Stud. Therm. Eng. 2021, 26, 101026. [Google Scholar] [CrossRef]
- Shahapurkar, K.; Chenrayan, V.; Soudagar, M.E.M.; Badruddin, I.A.; Shahapurkar, P.; Elfasakhany, A.; Mujtaba, M.A.; Siddiqui, M.I.H.; Ali, M.A.; Mahlia, T.M.I. Leverage of Environmental Pollutant Crump Rubber on the Dry Sliding Wear Response of Epoxy Composites. Polymers 2021, 13, 2894. [Google Scholar] [CrossRef]
- Usman, M.; Hussain, H.; Riaz, F.; Irshad, M.; Bashir, R.; Shah, M.H.; Zafar, A.A.; Bashir, U.; Kalam, M.A.; Mujtaba, M.A.; et al. Artificial Neural Network Led Optimization of Oxyhydrogen Hybridized Diesel Operated Engine. Sustainability 2021, 13, 9373. [Google Scholar] [CrossRef]
- Taqui, S.N.; Mohan, C.S.; Khatoon, B.A.; Soudagar, M.E.M.; Khan, T.M.; Mujtaba, M.A.; Ahmed, W.; Elfasakhany, A.; Kumar, R.; Pruncu, C.I. Sustainable adsorption method for the remediation of malachite green dye using nutraceutical industrial fenugreek seed spent. Biomass Convers. Biorefinery 2021, 12. [Google Scholar] [CrossRef]
- Taqui, S.N.; Mohan, C.S.; Goodarzi, M.S.; Elkotb, M.A.; Khatoon, B.A.; Soudagar, M.E.M.; Koki, I.B.; Elfasakhany, A.; Khalifa, A.S.; Ali, M.A.; et al. Sustainable Adsorption Method for the Remediation of Crystal Violet Dye Using Nutraceutical Industrial Fenugreek Seed Spent. Appl. Sci. 2021, 11, 7635. [Google Scholar] [CrossRef]
- Dhaif-Allah, M.A.H.; Taqui, S.N.; Syed, U.T.; Syed, A.A. Kinetic and isotherm modeling for acid blue 113 dye adsorption onto low-cost nutraceutical industrial fenugreek seed spent. Appl. Water Sci. 2020, 10, 1–16. [Google Scholar] [CrossRef] [Green Version]
- Ukkund, S.J.; Puthiyillam, P.; Alshehri, H.M.; Goodarzi, M.; Taqui, S.N.; Anqi, A.E.; Safaei, M.R.; Ali, M.A.; Syed, U.T.; Mir, R.A.; et al. Adsorption Method for the Remediation of Brilliant Green Dye Using Halloysite Nanotube: Isotherm, Kinetic and Modeling Studies. Appl. Sci. 2021, 11, 8088. [Google Scholar] [CrossRef]


| Factor | Name | Units | Minimum | Maximum |
|---|---|---|---|---|
| A | Time | min | 0 | 180 |
| B | Temp. | °C | 27 | 50 |
| C | Conc. | mg L−1 | 25 | 500 |
| D | Adsorbent conc. | g L−1 | 0.500 | 6.000 |
| E | pH | - | 2 | 12 |
| Two Parameter Isotherms | |||||||
|---|---|---|---|---|---|---|---|
| Langmuir | Freundlich | Jovanovic | Dubinin–Radushkevich | ||||
| Qm | 97.96 | KF | 24.17 | Qm | 85.67 | Qs | 110.59 |
| KS | 0.055 | nF | 3.977 | KJ | 0.046 | Kad | 4.46 × 10⁻⁵ |
| Three-Parameter Isotherms | |||||||||
|---|---|---|---|---|---|---|---|---|---|
| Toth | Brouers–Sotolongo | Vieth–Sladek | Radke–Prausnitz | Redlich–Peterson | |||||
| Qm | 87.60 | Qm | 84.00 | ARP | 4.70 | Qm | 114.80 | ARP | 4.70 |
| nT0 | 1.876 | KBS | 0.027 | BRP | 0.034 | Krp | 0.043 | BRP | 0.034 |
| bT0 | 442.37 | α | 1.21 | g | 1.06 | mrp | 1.06 | g | 1.06 |
| Isotherms | Langmuir | Freundlich | Jovanovic | Dubinin–Radushkevich | Toth | Brouers–Sotolongo | Vieth–Sladek | Radke–Prausnitz | Redlich–Peterson |
|---|---|---|---|---|---|---|---|---|---|
| SSE | 321.3 | 1080.3 | 297.4 | 4324.3 | 227.2 | 281.7 | 321.3 | 306.4 | 296.9 |
| χ2 | 12.14 | 40.80 | 8.02 | 67.55 | 6.42 | 5.59 | 12.14 | 10.79 | 10.15 |
| R2 | 0.94 | 0.80 | 0.94 | 0.97 | 0.96 | 0.95 | 0.94 | 0.94 | 0.95 |
| Initial Dye Concentration [µg mL−1] | Temp [K] | Pseudo-First Order | Pseudo-Second Order | |||||||
|---|---|---|---|---|---|---|---|---|---|---|
| qe,expt [mg g−1] | qe,pred [mg g−1] | k1 | R2 | χ2 | qe,pred [mg g−1] | k2 | R2 | χ2 | ||
| 100 | 303 | 60 | 50.18 | 1.40 × 10⁻¹ | 0.68 | 0.96 | 55.64 | 3.99 × 10⁻³ | 0.87 | 1.72 |
| 313 | 57 | 48.58 | 1.40 × 10⁻¹ | 0.63 | 1.10 | 53.92 | 4.10 × 10⁻³ | 0.84 | 0.46 | |
| 323 | 55 | 45.89 | 1.54 × 10⁻¹ | 0.58 | 0.98 | 50.40 | 5.07 × 10⁻³ | 0.81 | 0.42 | |
| 200 | 303 | 80 | 70.67 | 1.79 × 10⁻¹ | 0.78 | 0.39 | 75.69 | 4.78 × 10⁻³ | 0.95 | 0.08 |
| 313 | 76 | 65.34 | 6.53 × 101 | 0.51 | 0.54 | 65.88 | 1.71 × 10⁻³ | 0.76 | 1.65 | |
| 323 | 73 | 64.35 | 2.19 × 10⁻¹ | 0.51 | 0.54 | 67.94 | 7.39 × 10⁻³ | 0.80 | 0.22 | |
| 300 | 303 | 86 | 76.28 | 2.39 × 10⁻¹ | 0.49 | 0.47 | 79.82 | 7.72 × 10⁻³ | 0.80 | 0.19 |
| 313 | 80 | 68.28 | 2.97 × 10⁻¹ | 0.40 | 0.20 | 70.19 | 1.54 × 10⁻² | 0.71 | 0.10 | |
| 323 | 75 | 68.07 | 3.04 × 10⁻¹ | 0.46 | 0.14 | 69.78 | 1.70 × 10⁻² | 0.79 | 0.06 | |
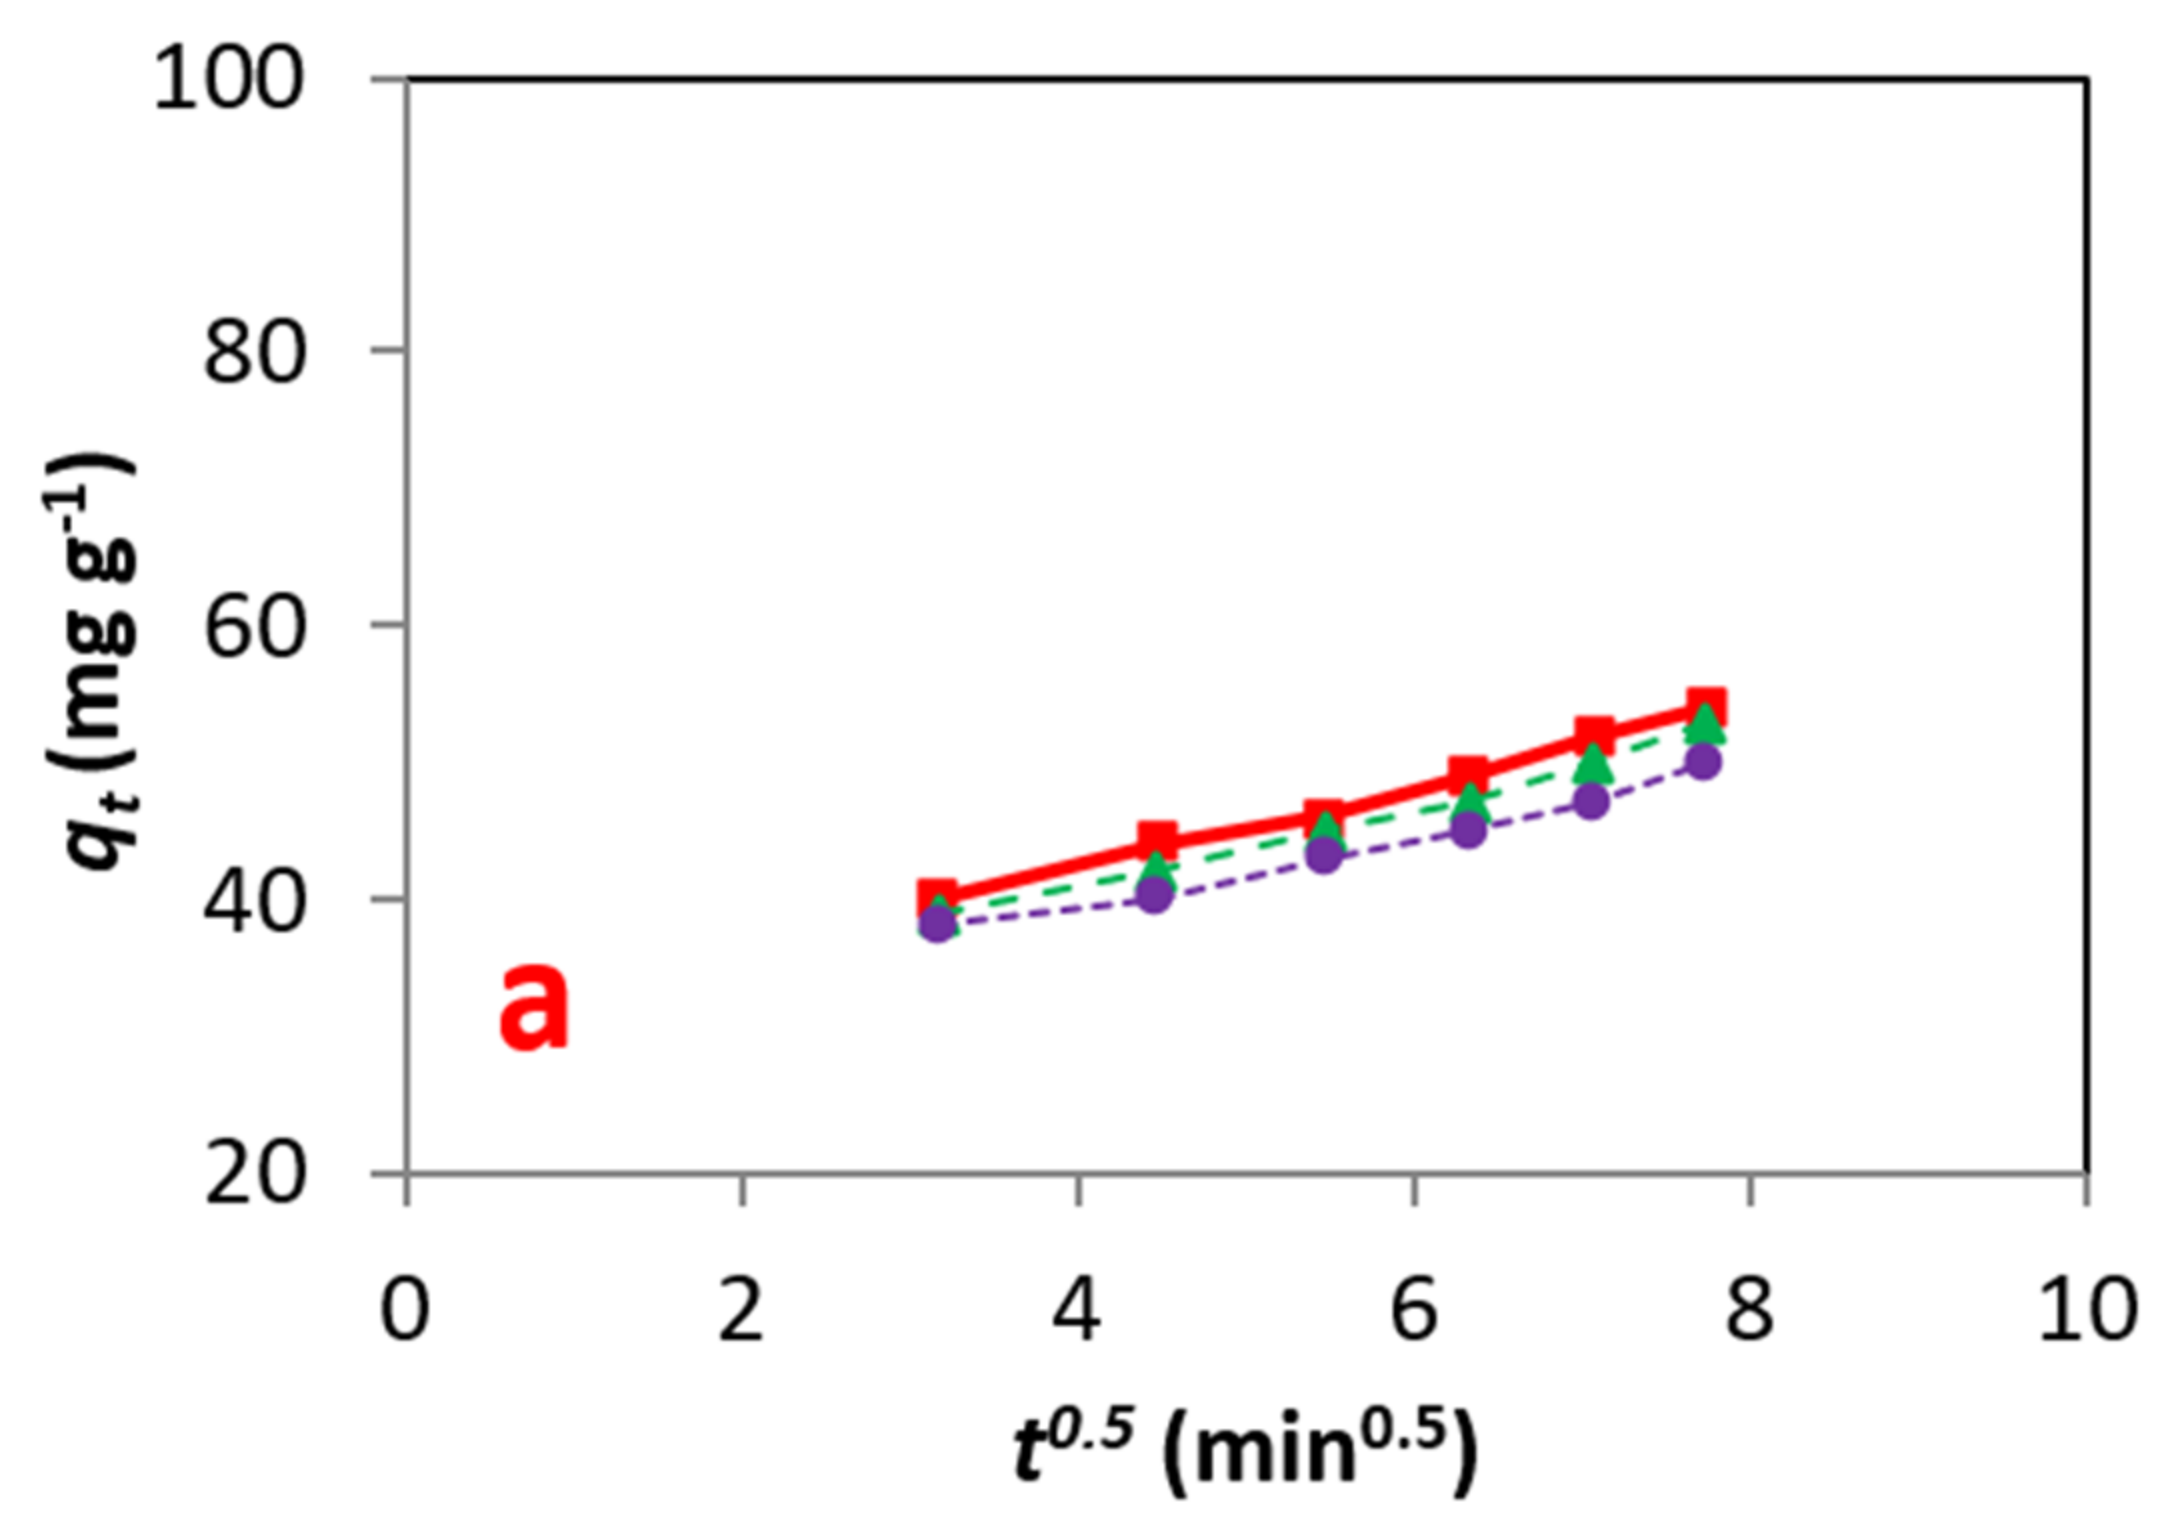
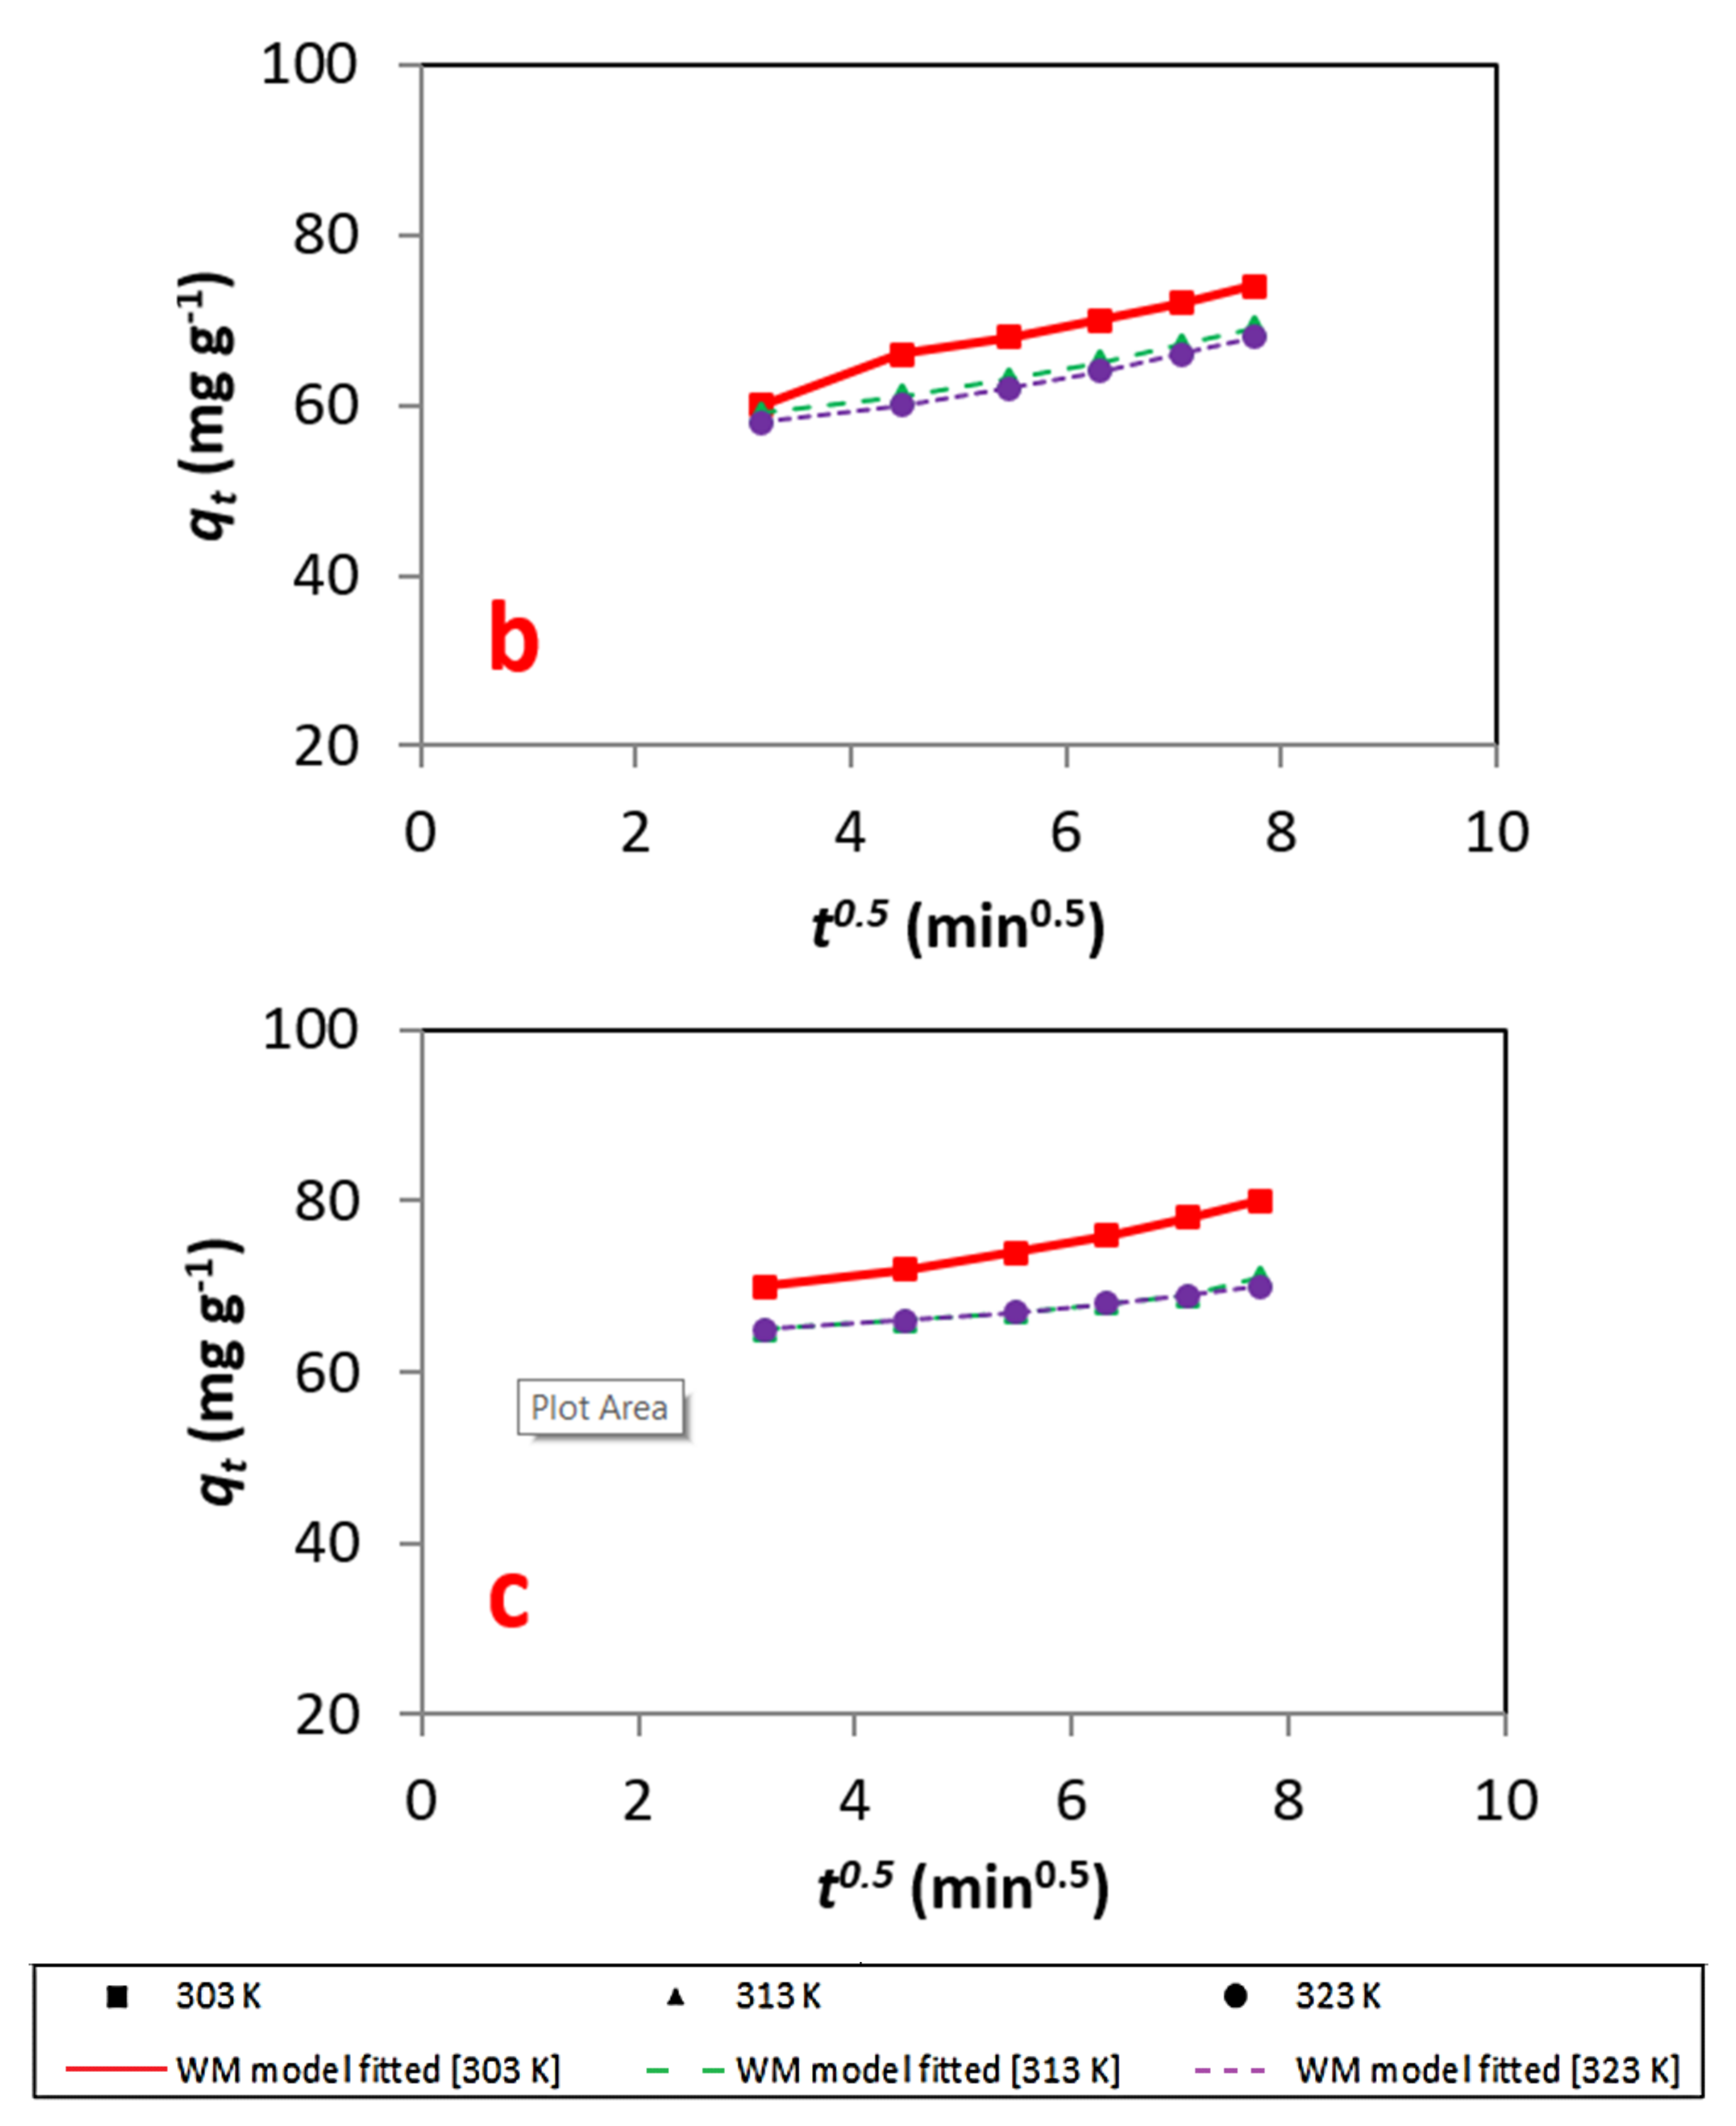
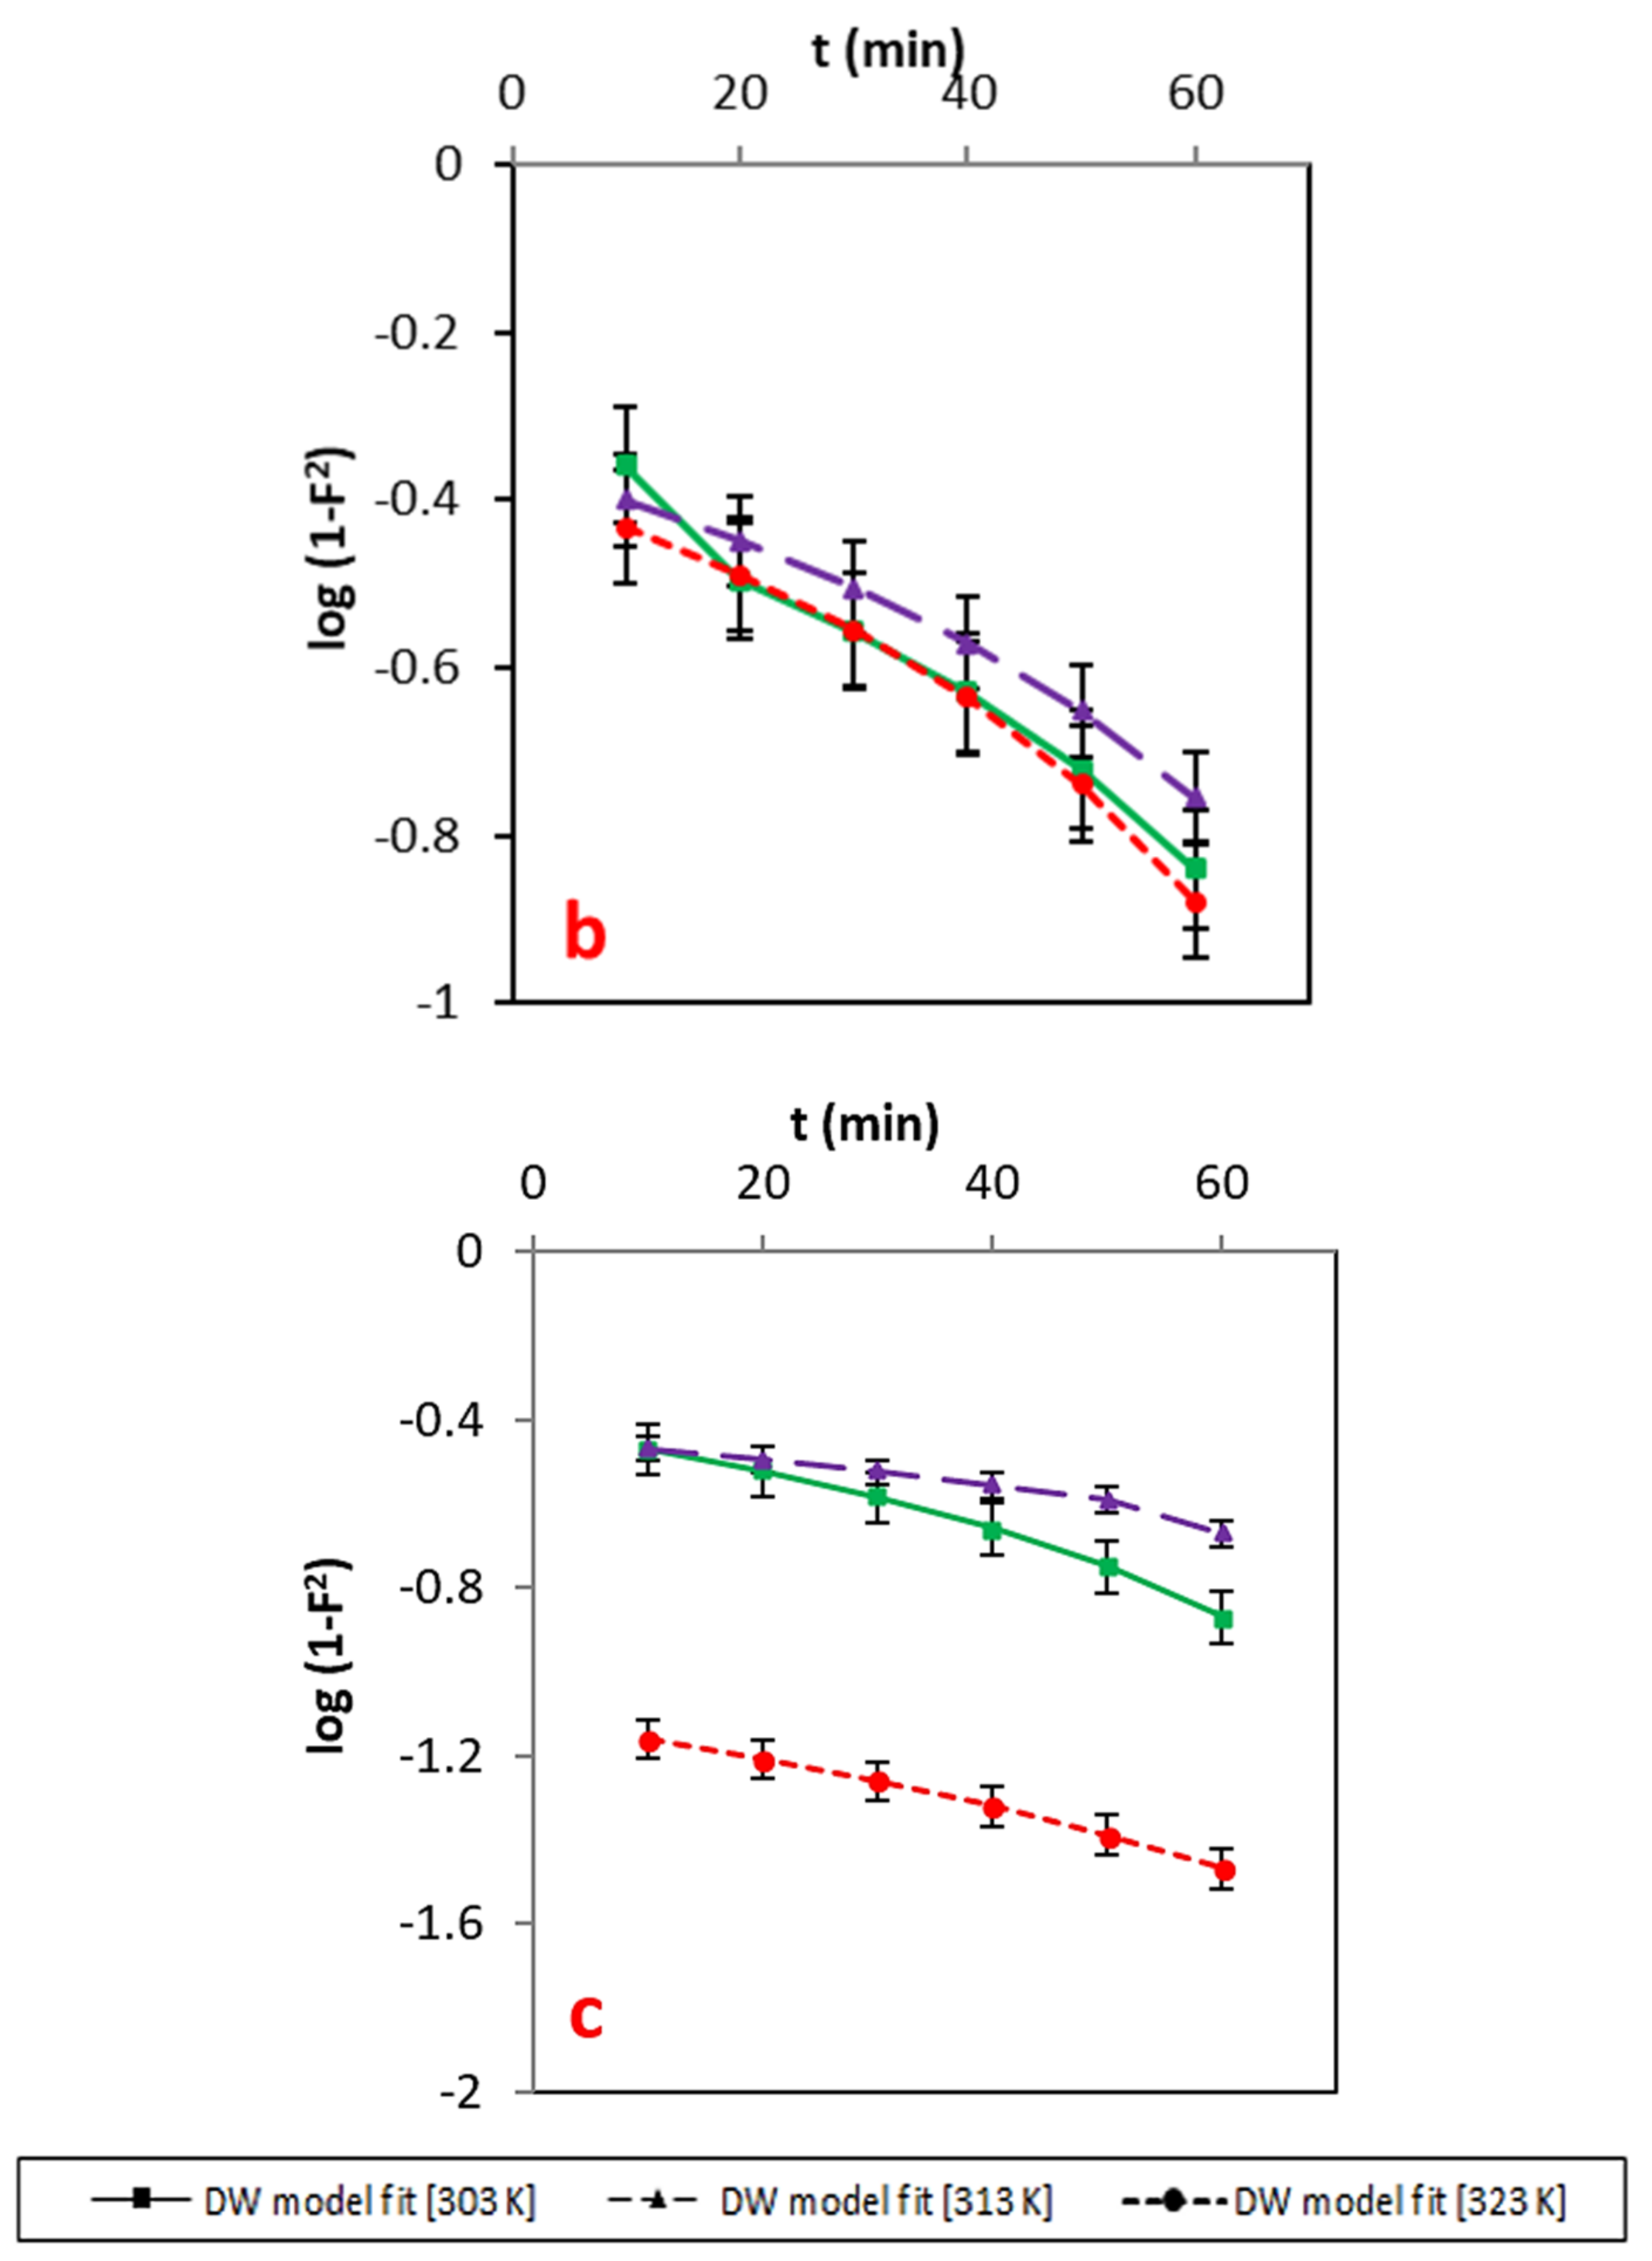
| Initial Dye Concentration [µg mL−1] | Temp [K] | Film Diffusion Model | Weber–Morris Model | Dumwald–Wagner | |||
|---|---|---|---|---|---|---|---|
| R′ [min−1] | R2 | kid [mg g−1 s−0.5] | R2 | k [min−1] | R2 | ||
| 100 | 303 | 0.0238 | 0.98 | 3.05 | 0.99 | 0.021 | 0.98 |
| 313 | 0.0285 | 0.94 | 2.99 | 0.98 | 0.026 | 0.93 | |
| 323 | 0.0234 | 0.95 | 2.59 | 0.98 | 0.021 | 0.94 | |
| 200 | 303 | 0.0225 | 0.99 | 2.89 | 0.98 | 0.021 | 0.99 |
| 313 | 0.0175 | 0.98 | 2.18 | 0.98 | 0.016 | 0.98 | |
| 323 | 0.0216 | 0.97 | 2.18 | 0.98 | 0.020 | 0.97 | |
| 300 | 303 | 0.0193 | 0.98 | 2.18 | 0.98 | 0.018 | 0.98 |
| 313 | 0.0096 | 0.95 | 1.23 | 0.94 | 0.009 | 0.95 | |
| 323 | 0.0138 | 0.99 | 1.09 | 0.98 | 0.014 | 0.99 | |
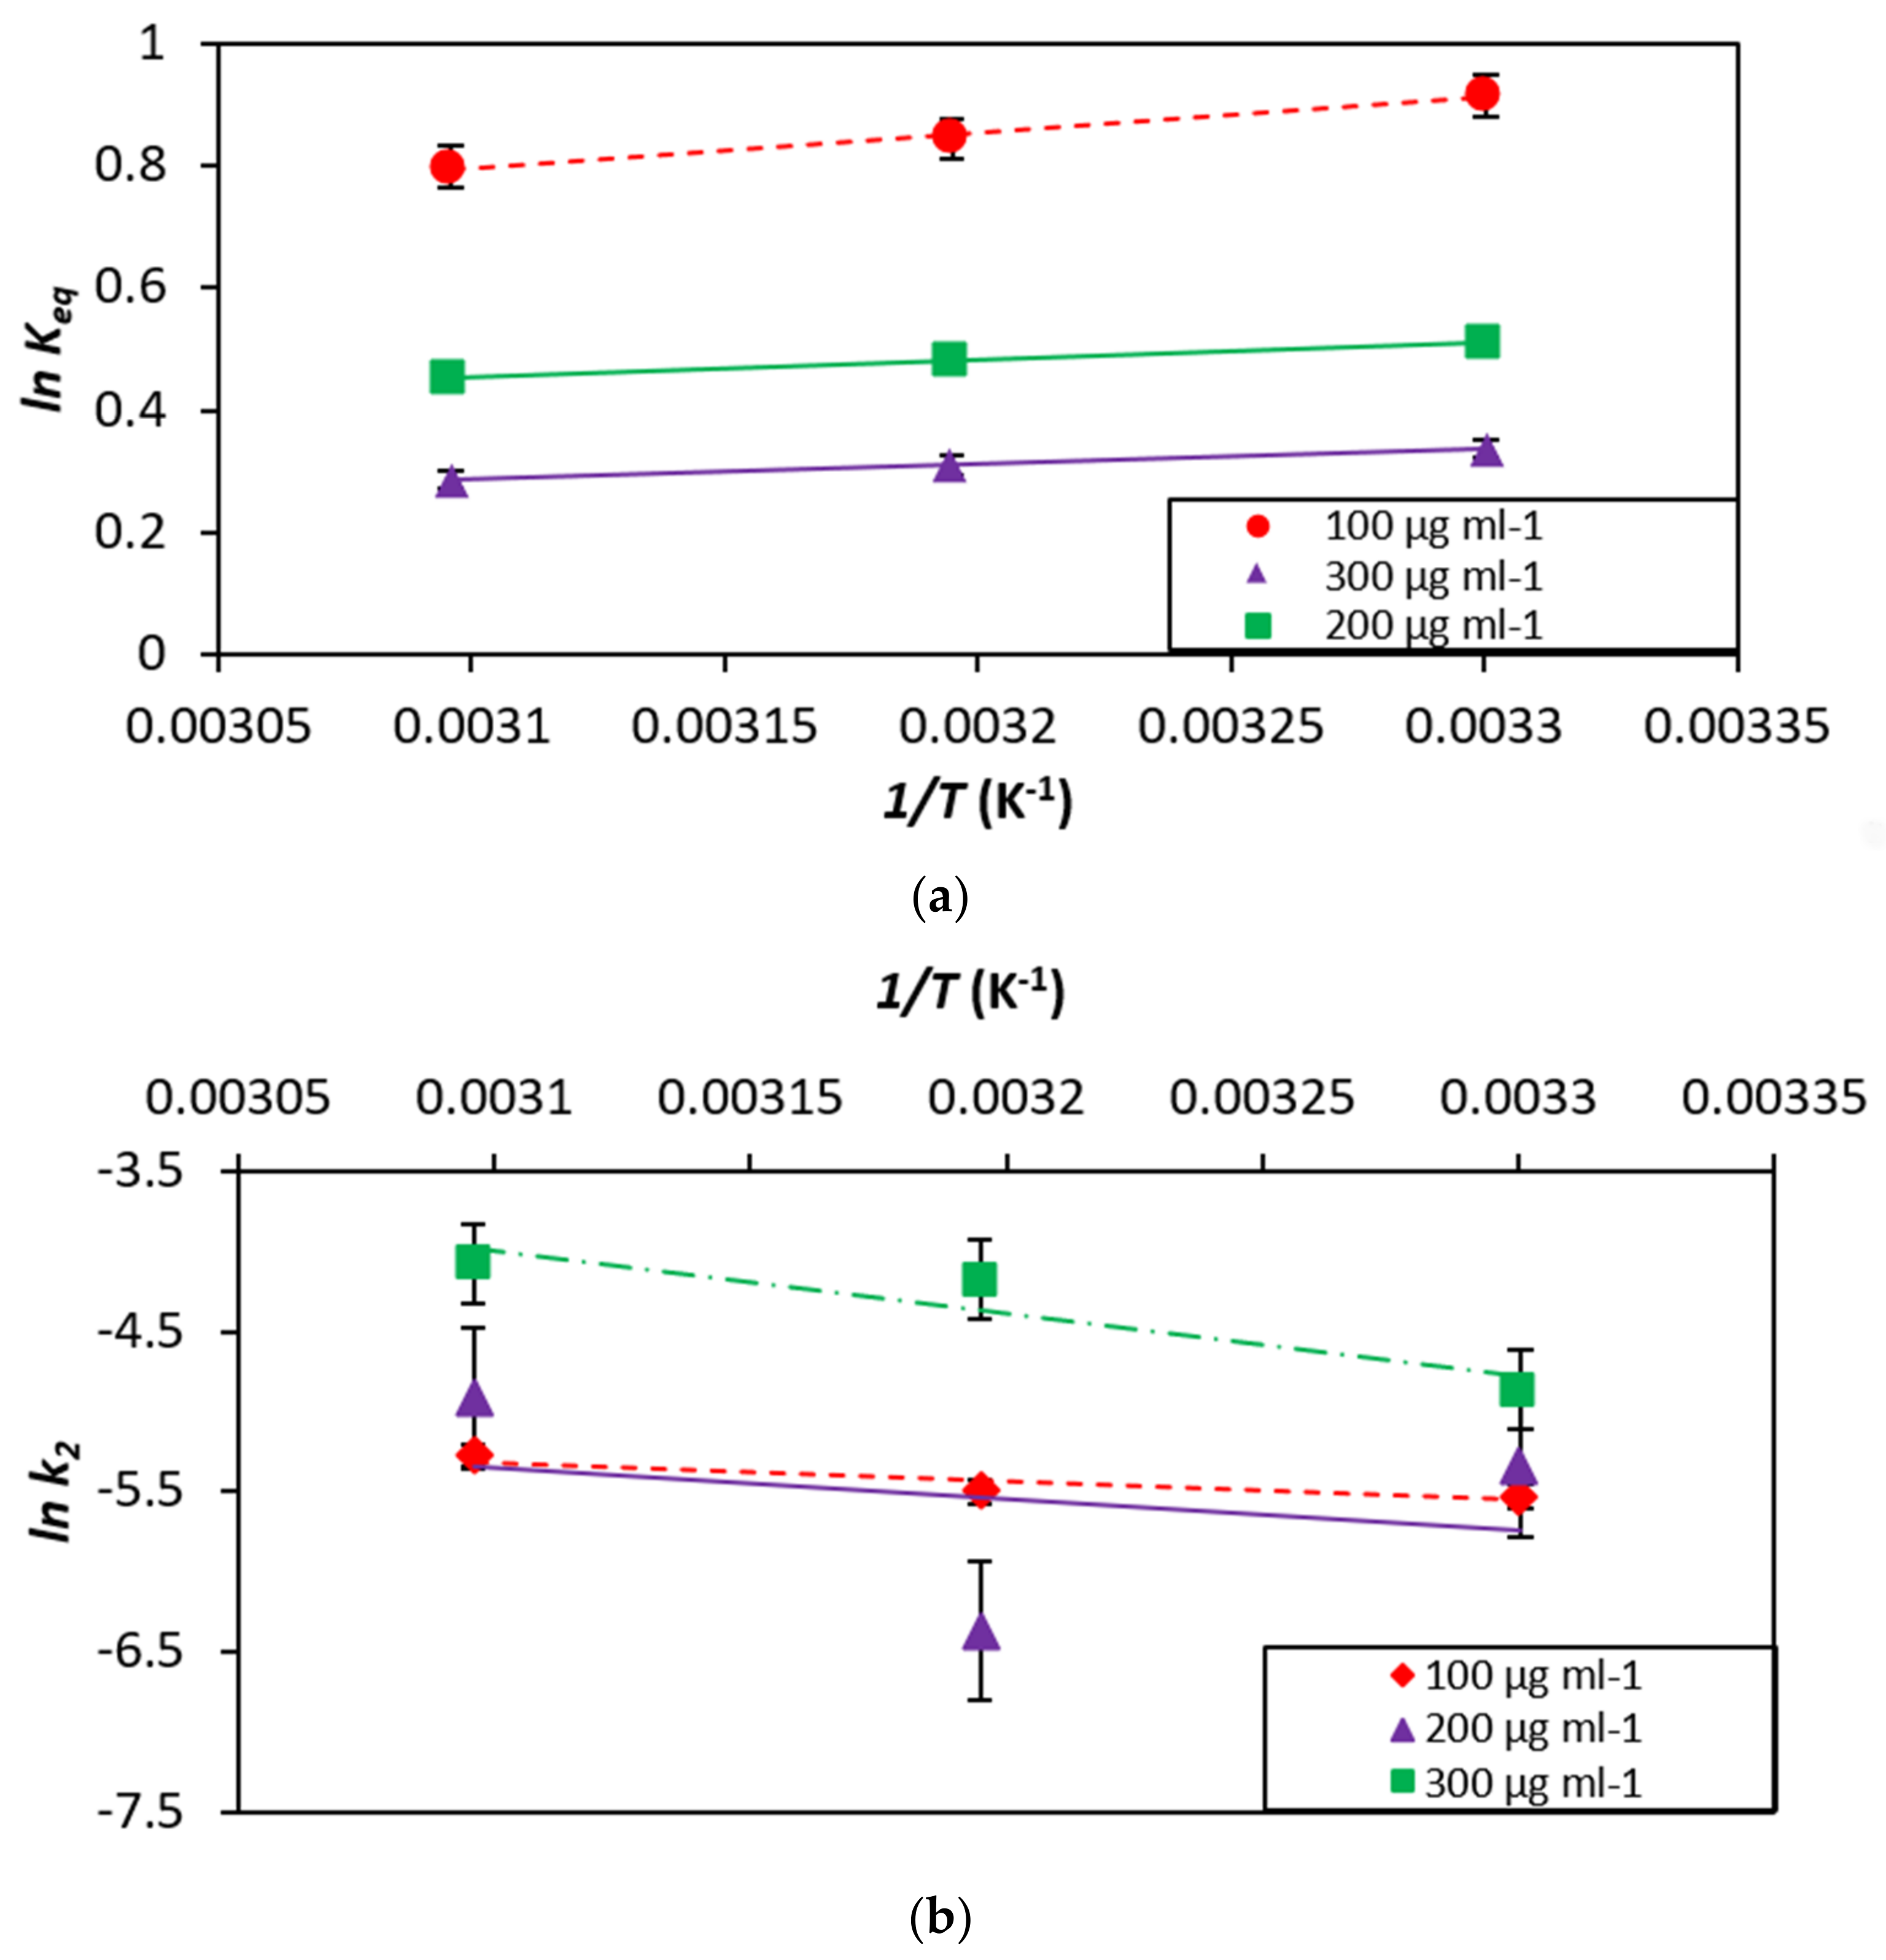
| Initial Dye Concentration | Temp | ΔG° | ΔS° | ΔH° | ln A | Ea |
|---|---|---|---|---|---|---|
| [µg mL−1] | [K] | [kJ mol−1] | [J mol−1 K−1] | [kJ mol−1] | [kJ mol−1] | |
| 100 | 303 | −2.14 | 3.39 | 2.04 | 0.86 | 9.66 |
| 313 | −2.19 | |||||
| 323 | −2.31 | |||||
| 200 | 303 | −1.22 | 5.68 | 3.31 | 1.72 | 16.64 |
| 313 | −1.24 | |||||
| 323 | −1.29 | |||||
| 300 | 303 | −0.75 | 8.73 | 4.80 | 4.07 | 32.36 |
| 313 | −0.81 | |||||
| 323 | −0.87 |
Publisher’s Note: MDPI stays neutral with regard to jurisdictional claims in published maps and institutional affiliations. |
© 2021 by the authors. Licensee MDPI, Basel, Switzerland. This article is an open access article distributed under the terms and conditions of the Creative Commons Attribution (CC BY) license (https://creativecommons.org/licenses/by/4.0/).
Share and Cite
Ukkund, S.J.; Puthiyillam, P.; Anqi, A.E.; Taqui, S.N.; Ali, M.A.; Syed, U.T.; Alghamdi, M.N.; Siddiqui, M.I.H.; Alshehri, H.M.; Safaei, M.R.; et al. A Recent Study on Remediation of Direct Blue 15 Dye Using Halloysite Nanotubes. Appl. Sci. 2021, 11, 8196. https://doi.org/10.3390/app11178196
Ukkund SJ, Puthiyillam P, Anqi AE, Taqui SN, Ali MA, Syed UT, Alghamdi MN, Siddiqui MIH, Alshehri HM, Safaei MR, et al. A Recent Study on Remediation of Direct Blue 15 Dye Using Halloysite Nanotubes. Applied Sciences. 2021; 11(17):8196. https://doi.org/10.3390/app11178196
Chicago/Turabian StyleUkkund, Shareefraza J., Prasad Puthiyillam, Ali E. Anqi, Syed Noeman Taqui, Masood Ashraf Ali, Usman Taqui Syed, Mohammed N. Alghamdi, Md Irfanul Haque Siddiqui, Hashim M. Alshehri, Mohammad Reza Safaei, and et al. 2021. "A Recent Study on Remediation of Direct Blue 15 Dye Using Halloysite Nanotubes" Applied Sciences 11, no. 17: 8196. https://doi.org/10.3390/app11178196
APA StyleUkkund, S. J., Puthiyillam, P., Anqi, A. E., Taqui, S. N., Ali, M. A., Syed, U. T., Alghamdi, M. N., Siddiqui, M. I. H., Alshehri, H. M., Safaei, M. R., Mir, R. A., Elfasakhany, A., Eed, E. M., Goodarzi, M., & Soudagar, M. E. M. (2021). A Recent Study on Remediation of Direct Blue 15 Dye Using Halloysite Nanotubes. Applied Sciences, 11(17), 8196. https://doi.org/10.3390/app11178196