Article

Influence of Seasonal and Yearly Variation on Phenolic Profiles, Caffeine, and Antioxidant Activities of Green Tea (Camellia sinensis (L.) Kuntze) from Azores

1
Gorreana Tea Plantation, Gorreana, 9625-304 Maia, Portugal
2
Institute of Agricultural and Environmental Research and Technology (IITAA), University of Azores, 9700-042 Angra do Heroísmo, Portugal
3
Department of Physics, Chemistry and Engineering (DCFQE), Faculty of Science and Technology, University of Azores, 9500-321 Ponta Delgada, Portugal
4
Department of Food Science, University of Guelph, Guelph, ON N1G 2W1, Canada
*
Author to whom correspondence should be addressed.
Appl. Sci. 2021, 11(16), 7439; https://doi.org/10.3390/app11167439
Submission received: 29 July 2021 / Revised: 6 August 2021 / Accepted: 9 August 2021 / Published: 13 August 2021

Abstract

:
This study compares the antioxidant properties (RSADPPH–DPPH radical scavenging activity, FRAP–ferric reducing activity power, and FIC–ferrous ion-chelating activity), the total phenolics (TP), total flavonoids (TF), and catechin profiles, as well as the caffeine content of Azorean Camellia sinensis green tea collected in seasons of two different years. The RSADPPH showed some variation between 2019 and 2020, and presented, in general, better results in 2020 as well as during the summer seasons. The FRAP was also noted to be at its highest in July and August of the two investigated years (6.64 and 6.40 µg/mL in 2019 and 5.85 and 5.46 µg/mL in 2020). According to FIC activity, the August 2019 sample exhibited the highest value (76.18%). The TP varied between 291.14 and 326.93 mg gallic acid equivalents (GAE)/g of dried extract (DE) in 2019 and between 300.25 and 320.58 mg GAE/g DE in 2020. Concerning the TF, the values varied between 51.85 and 67.93 mg rutin equivalents (RE)/g DE in 2019 and between 50.27 and 69.57 mg RE/g DE in 2020. Epicatechins derivatives, determined by HPLC, presented higher values in all samples from 2020 compared to 2019, and the same was observed for esterified catechins. The epigallocatechin-3-gallate content was also higher in all samples from 2020 (214.52–240.16 mg/g DE) compared to 2019 (140.91–210.83 mg/g DE). Regarding caffeine content (12.86–20.45 mg/g DE in 2019 and 13.19–29.35 mg/g DE in 2020), the samples from April and June exhibited similar values in both years. In general, green tea samples exhibited better results in 2020 than in 2019, with the exception of FIC activity, while the varied TP and TF contents in certain months reflect the impact of climatic variation on tea quality.

1. Introduction

Camellia sinensis (L.) Kuntze from the Theaceae family, and native to Southeast China, gradually expanded into many tropical and subtropical countries [1]. Since the last decade of the 19th century, it has also been commercially produced in one unique place in Europe, the volcanic São Miguel Island of the Azores Archipelago (Portugal). Internationally recognized as a first-class Azorean tea producer, Gorreana Tea Plantation has been a family business since 1883 and, currently, covers an area of 32 hectares, from which around 40 tons of organic tea are produced each year (including black, oolong, and green teas). A small portion of the production is destined for the Azorean local market, and the rest is exported to many countries, including mainland Portugal, France, Italy, Germany, Austria, USA, Canada, Brazil, Angola, Japan, and many others that value the quality (absence of pesticides, fungicides, and synthetic fertilizers) and uniqueness of Gorreana teas. The Azores Archipelago, located on the North Atlantic Ridge, is characterized by a subtropical oceanic temperature climate, with mild temperatures all years around and well-defined and stable environmental seasonal conditions that differ from season to season. Taking into consideration that through the tea-collecting period, particularly during late spring and summer, the anticyclone influences the Azores climate, reducing the amount of rain precipitation, this study supports the selection of the tea leaves in order to improve crop quality as well as maximize the beneficial effects on human health and enhance quality of life.
Green tea, made from C. sinensis leaves, is one of the oldest and most widely consumed non-alcoholic beverages worldwide following water, owing to its stimulant properties, relatively low retail price, pleasant sensory characteristics, and scientifically proven beneficial effects on human health [2]. It is also well known that tea chemical composition, including the level of polyphenols, and therefore, the tea quality, is significantly affected by many factors, such as the genetic background of the plant, the region and altitude where it is grown, horticultural practices, harvested season, leaf age (position of the leaf on the harvested shoot), climatic variations, as well as processing and storage conditions. On the other hand, it should be pointed out that the success of tea cultivation is deeply dependent on temperature, humidity, rainfall, solar radiation, and influence of seasons [3,4,5].
Tea contains an extensive variety of secondary metabolites that are strongly associated with its quality, mainly polyphenols (including flavanols, flavonols, flavones, proanthocyanins, and phenolic acids, which account for approximately 20–36% of the tea dry weight, among which 60–80% are catechins), alkaloids, and free amino acids, which account for its flavor, aroma, and health benefits [6,7]. Recently, there has been increasing interest within the general population in finding plants with high antioxidant capacities since they can protect the human body from the negative effects of free radicals and slow down the progression of many chronic diseases (for recent reviews, see [8,9,10]). They also facilitate the production of food for human consumers that does not contain synthetic antioxidants, which is becoming readily more requested by individuals concerned about the impact of food formulation on health [8]. In this context, the interest in green tea composition has been related to the antioxidant activity and, consequently, with its higher phenolic content. Tea polyphenols, particularly the catechins (flavan-3-ols) group, are considered key contributors to the protective effects that green tea offers against several diseases (e.g., cancer, cardiovascular disease, type 2 diabetes, and neurodegenerative diseases) as well as the aging process [4,9,10,11,12,13]. This is due to their diverse pharmacological activities, in particular, their strong antioxidant properties [9], and more recently, to their reported ability to reduce SARS-CoV-2 replication [14,15].
Generally, the major catechins of tea leaves are (+)-catechin (C), (–)-epicatechin (EC), (+)-gallocatechin (GC), (–)-epigallocatechin (EGC), (–)-epicatechin gallate (ECG), (–)-epigallocatechin gallate (EGCG), and (+)-gallocatechin gallate (GCG) [16]. Among them, EGCG, EGC, ECG, and EC are the major polyphenols present in green tea, with EGCG being the most abundant and the most pharmacologically active catechin. EGCG, which accounts for 50–70% of total catechins, has been shown to provide chemopreventive/chemotherapeutic effects against several cancers [11,17,18,19] and other diseases, such as diabetes, neurological, and cardiovascular diseases, as well as obesity [11]. Tea contains one of the highest flavonoid contents among common food and beverage products. Due to the sensory and health-promoting properties of polyphenols, these compounds are considered important markers of tea quality. High levels of these compounds are therefore desired, challenging scientists at both the pre- and post-harvest stages of tea production and processing in order to improve the health-promoting properties of this beverage [4].
Given that polyphenols and caffeine (CAF) are among the principal metabolites responsible for the various bioactivities of green tea, the aim of the present study was to compare the biochemical profiles (individual catechins, CAF, total phenolics, and total flavonoids contents) and in vitro antioxidant activities (free radical scavenging activity, ferric reducing activity power, and ferrous ion-chelating activity) in Azorean Camellia sinensis green tea obtained from the collection seasons of two different years in order to investigate how these tea quality parameters varied among the seasons and years.

2. Materials and Methods

2.1. Chemicals and Reagents

Catechins, namely (+)-catechin (C, 98%–C1251), (–)-epicatechin (EC, 98%–E4018), (–)-epigallocatechin (EGC, 98%–E3768), (–)-epigallocatechin-3-gallate (EGCG, 95%–E4143), (–)-epicatechin-3-gallate (ECG, 98%–E3893), (+)-gallocatechin (GC, 98%–G6657) and (–)-gallocatechin-3-gallate (GCG, 98%–G6782), caffeine (CAF, 99%–C0750), gallic acid (98%–G7384), rutin, 2,2-diphenyl-1-picrylhydrazyl (DPPH), butylated hydroxytoluene (BHT), ethylenediaminetetraacetic disodium salt (EDTA), Folin–Ciocalteu reagent (FCR), potassium ferricyanide, iron (II) chloride (FeCl2), iron (III) chloride (FeCl3), aluminum chloride (AlCl3), ferrozine, and trichloroacetic acid (TCA), were all obtained from Sigma–Aldrich (St. Louis, MO, USA). Sodium carbonate (Na2CO3), potassium acetate (KCH3CO2), sodium phosphate, and orthophosphoric acid were purchased from E. Merck (Darmstadt, Hessen, Germany). Acetonitrile, methanol, chloroform, and ethyl acetate, HPLC-grade, were obtained from Riedel-de Häen (Aktiengesellschaft, Seelze, Germany). Ultrapure glass-distilled water that was deionized with the Millipore Milli-Q purification system (Millipore, Bedford, MA, USA) was used throughout all the experiments.

2.2. Tea Samples

Tea leaves from Azorean Camellia sinensis (L.) Kuntze var. sinensis were provided by Gorreana Tea Plantation (São Miguel Island, Azores, Portugal—37°49′05.9″ N 25°24′08.2″ W), cultivated in volcanic soil, with an average pH = 5.6 (range of 4.1–6.3) and rich in the basic elements: N = 0.17 g/100 g, P = 58 mg/Kg, K = 0.49 meq/100 g, and Mg = 0.50 meq/100 g expressed per weight of dried soil (average data obtained from Gorreana Tea Plantation). The tea samples, composed of bud, first, and second leaves, were plucked between April and August in both 2019 and 2020 and prepared in the following conditions: the freshly plucked tea leaves were indoor-withered at 25–30 °C for several hours to achieve a relative humidity of 70% before being heated with boiling water vapor to inactivate the polyphenol oxidase enzyme that promotes the oxidation of catechins. The tea leaves were then dried in a heating chamber at 70 °C for 30 min and ground in a mortar to a particle size of 20–30 µm.

2.3. Aqueous Extracts Preparation and Extraction Methodology for Crude Catechins and Caffeine (CAF) Content

Considering the impact of sample preparation conditions on tea extraction yield (e.g., time and temperature of extraction, particle size, and solute-to-solvent ratio) and the preservation of antioxidant activity [20,21], as well as to mimic the green tea infusions used by general people, the aqueous extracts of C. sinensis samples were prepared using 1 g of dried powder material extracted in 20 mL of distilled water under an atmosphere of N2 to prevent oxidation. These were then heated at 70 °C in a water bath for 15 min to avoid the degradation of catechins that can occur at temperatures higher than 70 °C. The extraction process was repeated three times and the combined extract was filtered under vacuum through a cellulose acetate membrane (porosity of 0.45 μm) to remove particulate matter. Then, it was dried on a rotary evaporator and lyophilized for further analysis.
The extraction of crude catechins and CAF was performed according to the method published by Baptista et al. [20], with slight modifications. A 100 mg sample (freeze-dried tea powder) was extracted with water using the methodology described above, concentrated in a vacuum rota evaporator, reconstituted in 25 mL (volumetric flask) of distilled water, and a volume of 10 mL was partitioned with an equal volume of chloroform to remove pigments and other non-polar plant material. Then, the aqueous layer was extracted with ethyl acetate (3 × 10 mL) to obtain the catechin mixture and the solution of the combined ethyl acetate extracts was evaporated in a vacuum rota evaporator. The light-brown residue (crude catechins) was dissolved in 500 µL of water and then subjected to high-performance liquid chromatography/photodiode array detection (RP-HPLC/PDAD) analysis after being filtered through a 0.45 µm polytetrafluoroethylene membrane cartridge.

2.4. Determination of In Vitro of Antioxidant Activity

Taking into account the various mechanisms by which plant antioxidants can exert their actions, the samples under study were evaluated using three different in vitro antioxidant assays.

2.4.1. Determination of DPPH Radical Scavenging Activity (RSADPPH)

The RSADPPH assay, based on both electron transfer and hydrogen atom transfer reactions, was determined according to the method of Molyneux [22], with slight modifications [23]. The RSA of each aqueous extract, at various concentrations, was tested by measuring their ability to quench DPPH, a stable free radical, that was reduced in the presence of antioxidants, causing the change of purple color of the DPPH solution to bright yellow color; the intensity of this change can be monitored spectrophotometrically. An aliquot of 250 µL of each extract (concentration range of 3.33–20 µg/mL) or BHT was added to 500 µL of 100 µM DPPH solution. BHT was used as the reference sample and a mixture without sample, or BHT, was used as the control. The absorbance (Abs) was measured with a Shimadzu UV model 1800 at 517 nm after incubation (at room temperature in the dark) for a period of 30 min. The RSADPPH was calculated as a percentage of DPPH discoloration using the following equation: RSA (%) = (1 − Abssample/Abscontrol) × 100. The results are expressed as an EC50 value (µg/mL), which is defined as the sample concentration that can quench 50% of the DPPH free radicals. A lower EC50 value is indicative of higher antioxidant activity.

2.4.2. Determination of Ferric Reducing Antioxidant Power (FRAP)

The FRAP was determined according to the method of Oyaizu [24], with some modifications [23]. The FRAP of each aqueous extract, at various concentrations, was evaluated based on their abilities to reduce the Fe3+ complex to Fe2+. The Abs was measured with a Shimadzu UV model 1800. An increase in the Abs values indicates an increased reducing power of the samples. An aliquot of 0.4 mL of each extract (concentration range of 3.55–28.41 µg/mL) was mixed with 0.4 mL of 200 mM of phosphate buffer (pH 6.6) plus 0.4 mL of potassium ferricyanide (1%, w/v), and the mixture was incubated for 20 min at 50 °C. After being allowed to cool, 0.4 mL of TCA (10%, w/v) was added, and the mixture was centrifuged at 4000× g for 10 min. The upper layer (1 mL) was mixed with 1 mL of deionized water plus 0.2 mL of FeCl3 (0.1% w/v). The results are expressed as an EC50 value (µg/mL), which is the concentration at which the Abs was 0.5 for reducing power, and they were obtained by interpolation from a linear regression analysis of concentration versus Abs at 700 nm against a blank. The blank solution contained pure methanol instead of the tea extract sample. BHT was used at the same concentration as the extracts for comparison. A lower EC50 value is indicative of higher antioxidant activity.

2.4.3. Determination of Ferrous Ion-Chelating (FIC) Activity

An FIC activity assay was performed to better characterize the antioxidant activity of the samples, given that metal chelating capacity is claimed to be one of the most important mechanisms that underpin antioxidant activity. FIC activity was determined according to the method of Wang et al. [25], with some modifications [23]. The chelating ability of each aqueous extract, at various concentrations, was evaluated by measuring the inhibition of the Fe2+–ferrozine complex formation. An aliquot of 100 µL of each extract (mg/mL) was mixed with 135 µL of methanol plus 5 µL of 2 mM FeCl2. The reaction was initiated by the addition of 10 µL of 5 mM ferrozine. After 10 min at room temperature, the Abs was measured with a Shimadzu UV model 1800 at 562 nm. Methanol, instead of ferrozine solution, was used as a blank sample, which is required for error correction due to the unequal color of the sample solutions. Methanol, instead of a sample solution, was used as a control. The results are expressed as the relative iron-chelating activity compared with the unchelated (without ferrozine) Fe2+ reaction, and EDTA was used as the reference standard. A lower Abs value is indicative of better FIC activity. The FIC activity was calculated as follows: FIC activity (%) = (A0 − (A1 − A2))/A0 × 100, where A0 is the Abs of the control, A1 is the Abs of the sample or standard, and A2 is the Abs of the blank.

2.5. Determination of the Total Phenolics (TP)

The TP of each aqueous extract was determined by using the Folin–Ciocalteu colorimetric methodology, which is based on the oxidation/reduction reaction as described by Waterhouse [26], with some modifications [23]. A 100 µL aliquot of each extract (2 mg/mL) was mixed with 1500 µL of distilled water and 100 µL of 2N FCR, homogenized in a vortex for 15 s, and placed in the dark for 3 min. Then, 300 µL of 10% Na2CO3 (w/v) was added to the mixture, homogenized, and then incubated for 5 min at 50 °C. The Abs of the samples was measured with a Shimadzu UV model 1800 at 760 nm. Gallic acid was used to produce a standard calibration curve at various concentrations, and the results are expressed as milligrams of gallic acid equivalents per gram of dried extract (mg GAE/g DE).

2.6. Determination of the Total Flavonoids (TF)

The TF of each aqueous extract was determined by using a colorimetric method of Chang et al. [27] with some modifications [23]. A 100 µL aliquot of each extract (2 mg/mL) was mixed with 100 µL of 10% AlCl3, 100 µL of 10% KCH3CO2, and 900 µL of distilled water. The mixture was homogenized in a vortex for 15 s, and the Abs was measured with a Shimadzu UV model 1800 at 415 nm after 30 min at room temperature. Rutin was used to produce a standard calibration curve at various concentrations (0.0125 to 0.1 mg/mL) and the results are expressed as milligrams of rutin equivalents per gram of dried extract (mg RE/g DE).

2.7. RP-HPLC Analysis of Catechins and Caffeine (CAF)

The catechin profiles and CAF content of the samples were determined by RP-HPLC/PDAD following the method of Paiva et al. [23], which has already been validated in our previous research focusing on green tea [21] and tea extracts [20]. Since the aromatic structural similarity of the tea catechins made the separation difficult, a Waters Spherisorb ODS2 column (100 × 4.6 mm i.d.) from Waters (Milford MA, USA) was used to separate the individual catechins with high resolution, particularly between EC and EGCG, due to its hydrophobicity, carbon number (12%), and small particle size (3 µm). The mobile phase A was composed of acetonitrile/ethyl acetate/0.1% orthophosphoric acid/water (4.25:1:44.75:50, v/v/v/v), and the mobile phase B was acetonitrile/water (1:1, v/v). Baseline separation was achieved with a gradient elution as follows: 100% A for 10 min, followed by a linear gradient between phase A and phase B at an increasing rate of 2% per min of phase B until 20% of B was reached. This composition was maintained until the end of the run at a flow rate of 0.75 mL/min. The injection volume was 5 µL and the total run time was around 40 min. The column was maintained at 35 ºC and coupled to an Agilent Technologies (Palo Alto, CA, USA) Liquid Chromatograph series 1200 equipped with a PDAD fixed at 280 nm. The chromatograms were recorded according to the retention time (RT), and the quantitative analysis was achieved by the external standard method using the ChemStation Chromatography Software from Agilent Technologies. The sample concentration was limited to the range of linearity in order to avoid peak tailing and RT shifting, which may occur when the sample amount approaches the column sample load capacity. Peak identity was assigned based on the RT following comparison with the authentic standards and/or by spiking the sample with the same standards. The presence of individual catechins was also confirmed by superimposing the spectrum of the peak with the corresponding authentic standard spectrum. The average of the triplicate measurements was used to calculate the catechin and CAF contents, and was expressed as the milligrams per gram of the sample on a dried extract basis. The total ECDs, total esterified catechins, and total non-esterified catechins were obtained by summation as follows: EC + EGC + EGCG + ECG, EGCG + ECG + GCG, and C + EC + EGC + GC, respectively.

2.8. Statistical Analysis

All determinations were performed in triplicate and the results are expressed as the means ± standard deviations (SD). One-way analysis of variance test (ANOVA) was carried out to assess and indicate any significant differences between the mean values obtained from each sample. Correlations between the tea quality parameters evaluated were obtained using Pearson’s correlation coefficient (r) for each referred year [28]. Significance was based on a confidence level of 95% (p < 0.05). The statistical analysis was performed using SPSS 20.0 (SPSS Inc., Chicago, IL, USA).

3. Results and Discussion

3.1. In Vitro Antioxidant Activity of Green Tea Extracts

The studied samples were evaluated by three different antioxidant assays, as reported in Table 1 and Figure 1. The values were also compared to the synthetic antioxidants BHT and EDTA under the same assay conditions, which is a good approach when aiming to compare results to the available literature data.

3.1.1. DPPH Radical Scavenging Activity (RSADPPH)

Table 1 presents the RSADPPH results of green tea samples, expressed as EC50 (µg/mL), showing higher activity in 2020 than in 2019, with the exception of the slightly lower value (higher EC50) in August 2020, which was most likely due to lower sunlight intensity during this month. Furthermore, the results also show better values (lower EC50 indicates higher antioxidant activity) in the summer season (July and August) of both 2020 and 2019, decreasing in the following order: 3.94 µg/mL (July) > 4.38 µg/mL (August) > 4.80 µg/mL (June) > 5.09 µg/mL (April) > 5.76 µg/mL (May) for 2020, and 4.10 µg/mL (July) > 4.13 µg/mL (August) > 5.37 µg/mL (June) > 6.37 µg/mL (April) > 6.67 µg/mL (May) for 2019. The better results in the summer months in comparison to the spring months can be explained by the greater sunlight intensity during this season. Moreover, all samples presented better antioxidant capacity than that of BHT (EC50 = 25.84 µg/mL). Significantly lower RSADPPH values (higher EC50) were reported by some authors [29,30] for green tea samples (EC50 = 30–40 µg/mL) compared to our results.
According to Lee et al. [31], tea extracts enriched with phenolic compounds showed much higher DPPH scavenging ability and, therefore, Azorean tea may also depend on the TP and TF contents in the extracts. However, it is well known that the antioxidant activity of tea samples not only depends on the levels of antioxidants (i.e., high TP) but also on their chemical structure and synergistic, or antagonistic, effect among tea compounds.

3.1.2. Ferric Reducing Antioxidant Power (FRAP)

Table 1 illustrates the FRAP results of green tea samples from 2019 and 2020, expressed as EC50 values (µg/mL). A lower EC50 value is indicative of higher antioxidant activity. Among the green tea samples, those from the summer season (July and August) exhibited the best FRAP activity from the two investigated years (6.64 and 6.40 µg/mL from 2019, and 5.85 and 5.46 µg/mL from 2020), as shown in Table 1. The FRAP results of the samples decreased in the following order in 2019: 6.40 µg/mL (August) > 6.64 µg/mL (July) > 7.02 µg/mL (May) > 7.48 µg/mL (June) > 7.76 µg/mL (April), and in 2020: 5.46 µg/mL (August) > 5.85 µg/mL (July) > 6.58 µg/mL (June) > 6.61 µg/mL (April) > 7.05 µg/mL (May), which can be explained by the same climate conditions referred to for the RSADPPH.. It should also be highlighted that the FRAP of all samples was better than that of the BHT (EC50 = 8.51 µg/mL), which is known to be a strong reducing agent. Significantly lower FRAP (higher EC50) were reported by Tong et al. [30] for green tea samples (EC50 = 72 µg/mL) compared to all Azorean green tea samples that presented higher FRAP.

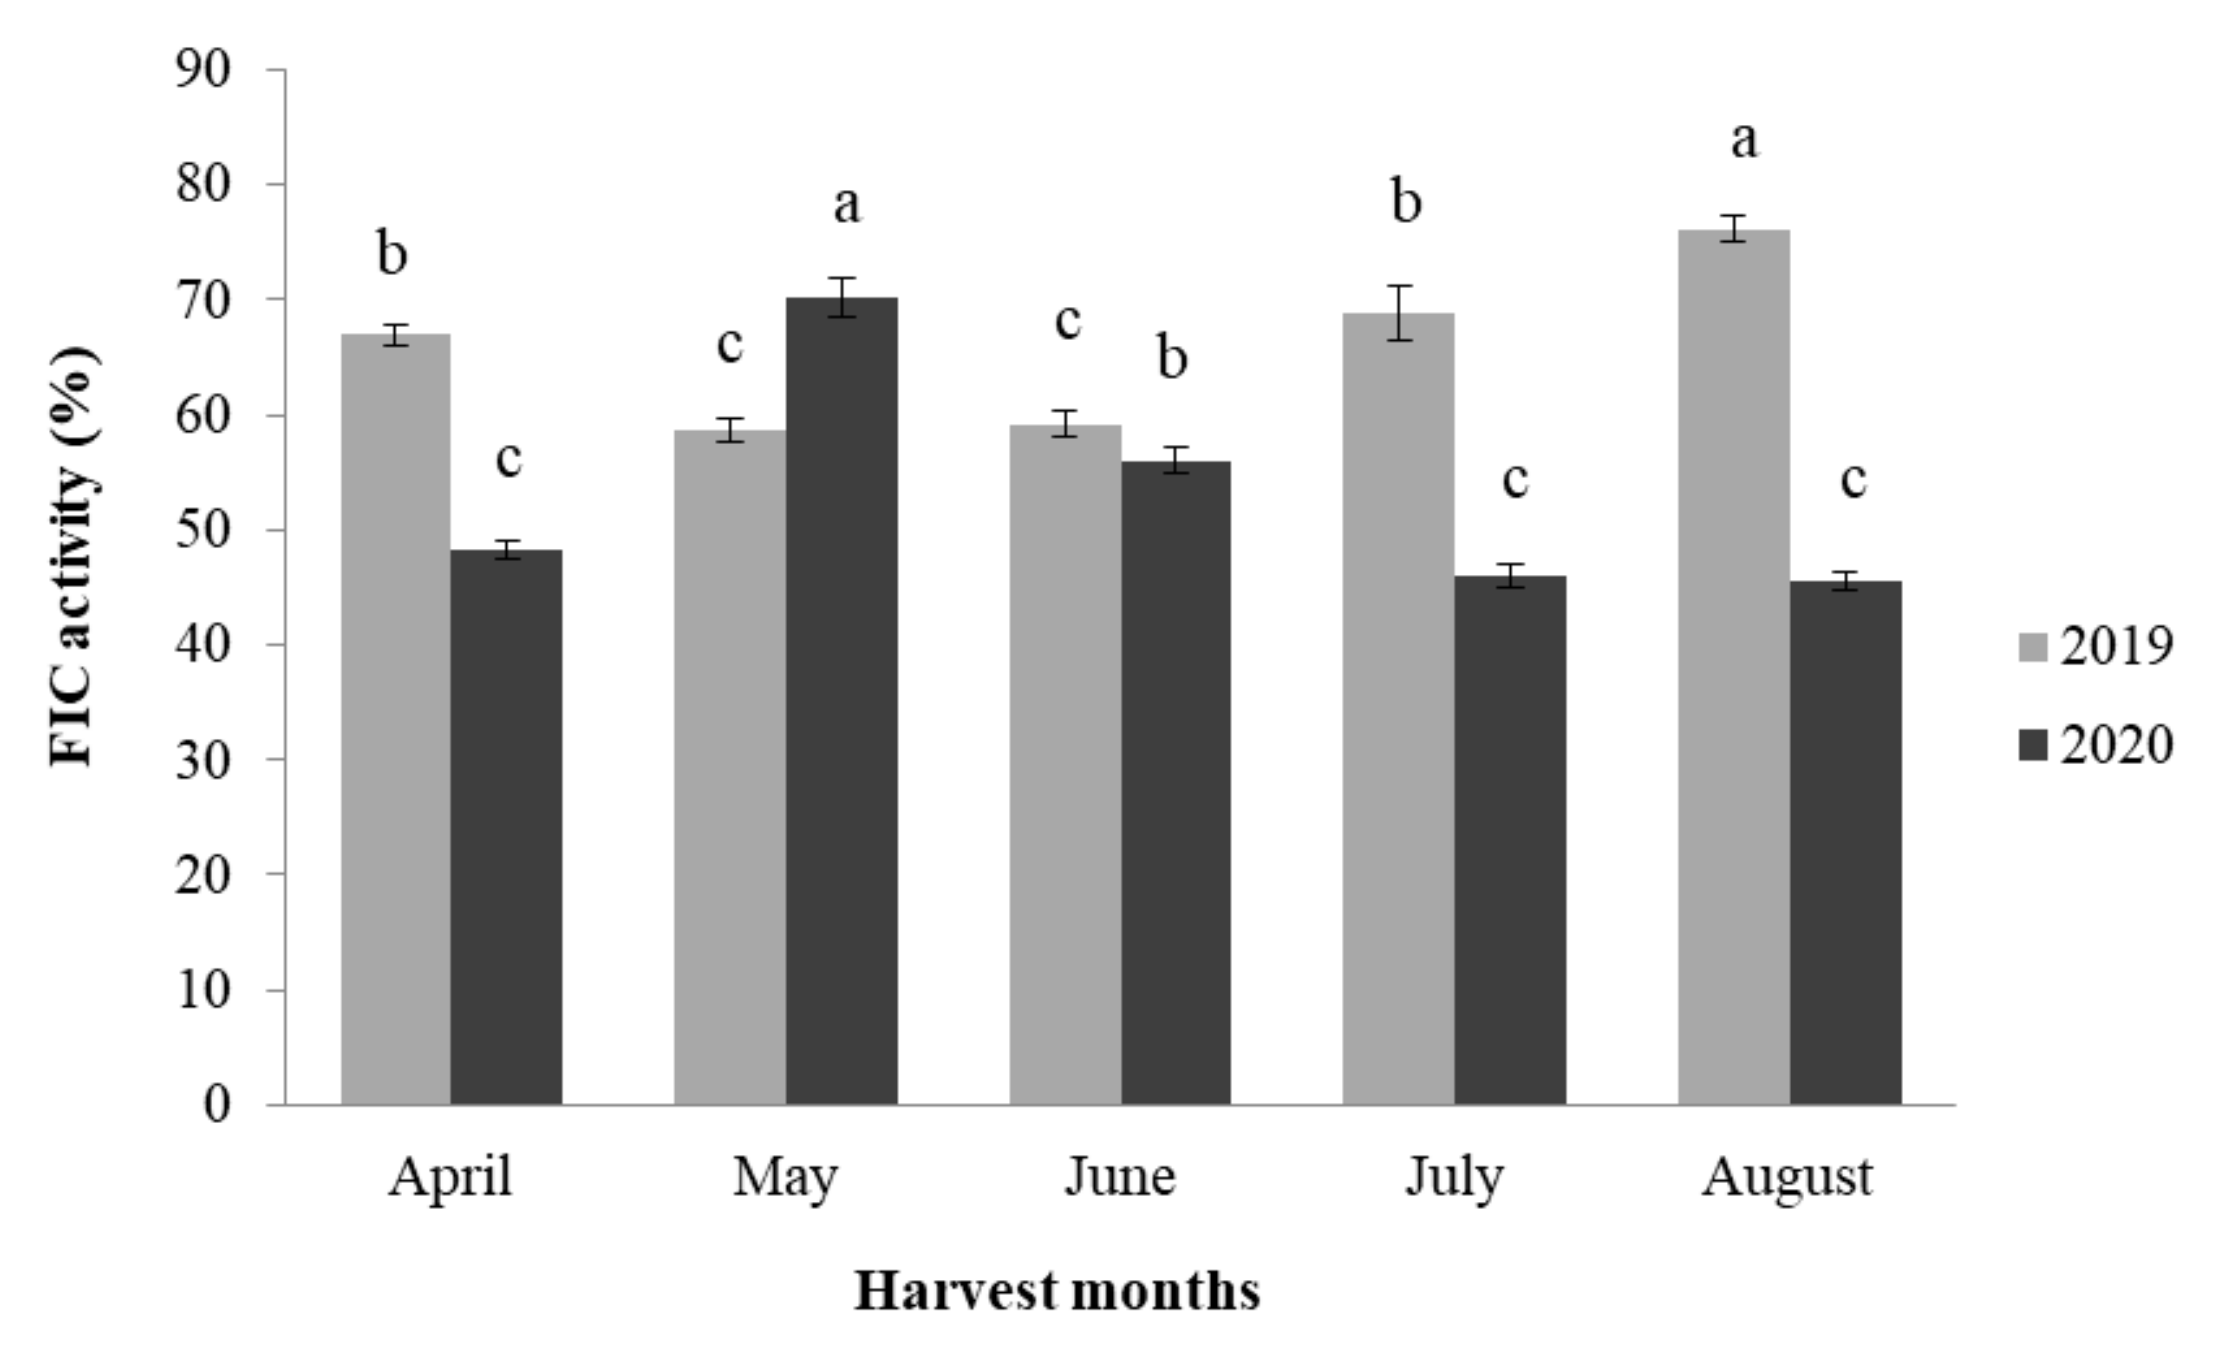
3.1.3. Ferrous Ion-Chelating (FIC) Activity

Figure 1 presents the FIC activity of green tea samples that exhibited the highest values in August 2019 (76.18%). However, they were lower than that of EDTA (97.33%), a potent metal-ion chelator. The FIC activity results obtained from the samples collected in the other months of 2019 decreased in the following order: 68.84% (July) > 66.95% (April) > 59.21% (June) > 58.65% (May). The samples from 2020 present a different order, showing an inconsistent pattern, and decreased as follows: 70.19% (May) > 55.99% (June) > 48.24% (April) > 46.00% (July) > 45.50% (August), which can be explained by fluctuations in climatic conditions.
Figure 1. Ferrous iron-chelating (FIC) activity in dry extracts of Azorean Camellia sinensis (L.) Kuntze green tea samples from Gorreana Tea Plantation that was obtained during the collection seasons of two different years. Values are mean ± SD (n = 3); different letters indicate those values that are significantly different (p < 0.05) within the same column bar.
Applsci 11 07439 g001

3.2. Total Phenolics (TP) and Total Flavonoids (TF) of Green Tea Extracts

Table 2 summarizes the TP and TF values obtained for each green tea sample. The TP levels of the tea samples can be considered an indirect measure of their antioxidant activity because the basic redox mechanism of the Folin–Ciocalteu method was chosen to screen phenolic content. The TP results, expressed in milligrams of GAE/g DE, showed the highest value in July (326.92 mg GAE/g DE and 320.58 mg GAE/g DE in 2019 and 2020, respectively) followed by August (325.14 mg GAE/g DE and 315.86 mg GAE/g DE in 2019 and 2020, respectively) and the lowest value in April (291.14 mg GAE/g DE and 300.25 mg GAE/g DE in 2019 and 2020, respectively). The higher values found in samples from summer can be explained by the longer daylight and sun radiation intensity that characterize this season compared to the spring months. The other investigated samples presented very similar TP values, which ranged from 302.47 to 312.80 mg GAE/g DE and are comparable with those reported by Rohadi et al. [32]. In general, the results from 2019 presented slightly higher values in comparison to 2020. Erturk et al. [33] also studied the seasonal variation of TP in tea leaves and observed that TPs were lower in cool months and higher during the warmer months. The authors also suggested that these differences may be a result of changing temperature, irradiance, and day length. Mahanta and Baruah [34] also reported that the TP increased with sun exposure, while Harbowy and Balentine [35] reported that the biosynthesis of TP is induced by stronger sunlight and longer day length.
Concerning the TF levels of the tea samples, determined by an aluminum chloride colorimetric method, and expressed in milligrams of RE/g DE, differences were also observed between the two years. In 2019, the values ranged from 51.85 to 67.93 mg of RE/g DE and presented higher values in the spring months (67.93 > 67.01 > 53.60 mg of RE/g DE, in April, May, and June, respectively), while decreasing in the summer months (53.26 > 51.85 mg of RE/g DE, in July and August, respectively). Compared with 2020, the results show a similar pattern, with values that range from 50.27 to 69.57 mg of RE/g DE, except for August, which presented the second better value (68.88 mg of RE/g DE). However, these values are higher than those reported by Tong et al. [30], lower than those reported by Rohadi et al. [32], and similar to those reported by Nibir et al. [36].

3.3. Determination of Catechin Profile and Caffeine (CAF) Content

The data presented in Table 3 indicates that the total ECD content (EC, EGC, EGCG, and ECG), which has long been used as an important parameter to evaluate tea quality, was significantly higher in all samples, and ranged from 341.07 to 361.17 mg/g DE (341.07–355.51 mg/g DE in 2019 and 351.18–361.17 mg/g DE in 2020). However, total ECDs were higher in 2020 compared to 2019 for each month, and the same pattern was observed for the total esterified or gallated catechins. The results also show that the individual ECD contents of the studied samples decreased as follows: EGCG > ECG ≫ EC ≫ EGC. In addition, the contents of the esterified catechins (EGCG + ECG + GCG) were significantly higher in all samples with respect to the non-esterified catechins (C + EC + EGC + GC), presenting the following ranges: 283.78–356.20 mg/g DE and 28.20–101.22 mg/g DE, respectively. Regarding CAF content, the values ranged from 12.86 to 20.45 mg/g DE in 2019 and from 13.19 to 29.35 mg/g DE in 2020, and a similar result was also observed by Zhao et al. [37]. The results also show that the samples from April and June exhibited similar CAF values in both years.
The content of EGCG, the major bioactive tea catechin, was higher in all samples from 2020 compared to those from 2019, presenting the following ranges: 214.52–240.16 mg/g DE and 140.91–210.81 mg/g DE, respectively. In 2020, the EGCG and esterified catechins increased from April to August, but in 2019, we found an inconsistent pattern. Conversely, the other esterified catechins, ECG and GCG, exhibited higher values in 2019 compared to 2020, presenting the following ranges: 112.46–119.18 mg/g DE (2019) and 90.01–106.34 mg/g DE (2020) for ECG, and 19.87–37.39 mg/g DE (2019) and 17.74–26.03 mg/g DE (2020) for GCG. According to Lee et al. [16], the combined content of EGCG and ECG has long been considered a key factor affecting the antioxidant activity of tea extracts. Thus, our findings reveal the potential of Azorean C. sinensis green tea as a natural resource with high nutraceutical value.
Relative to the total non-esterified catechin content, the main contributor in all samples was the EC, presenting the values of 18.68–72.61 mg/g DE for 2019, and 17.52–30.45 mg/g DE for 2020. The other non-esterified catechins, GC, C, and EGC, presented significantly lower values of 0.75–6.80 mg/g DE (2019) and 1.39–2.27 mg/g DE (2020) for GC, 2.72–7.16 mg/g DE (2019) and 3.54–5.12 mg/g DE (2020) for C, and 4.49–14.65 (2019) and 0.58–9.86 mg/g DE (2020) for EGC.
Zhao et al. [37] reported significantly lower values for the catechins with respect to our results, which may be related to differences in terms of the extraction/analysis methodologies employed, as well as genetic differences, geographic location, processing, and storage conditions. Furthermore, it should be highlighted that comparing data from several studies is difficult, given that different raw materials, extraction protocols, analytical methods, and units of measurement are used. It should also be pointed out that several studies that focused on tea catechins variations among different cultivars reported that geographic location, genetic variation, and agricultural practices have a significant effect on catechin levels [3]. Additionally, the growing environments (including soil types, soil fertility, temperatures, sunlight intensity, water stress, rainfall distribution, and growth altitude) have an effect on tea’s uniqueness [4] and thus, offer a possible explanation for the higher values of ECDs observed in green tea from Azorean samples. Furthermore, some authors reported that the levels of total and individual catechins show high seasonal fluctuations in reaction to temperature, irradiance, UV doses, and day length [38,39]. According to Tounekti et al. [4], given that tea grows in temperate climates, these influences are difficult to separate from each other but should be considered in the future when seeking to optimize and/or maximize their catechin content.

3.4. Pearson Correlation between Parameters

A significant correlation was observed among the methods used to determine the biological activities (Table 4 (A,B)). RSADPPH and TP (r = 0.881 and 0.951 for 2019 and 2020, respectively) were strongly correlated and the same pattern was observed for RSADPPH and esterified catechins (r = 0.871 and 0.911 for 2019 and 2020, respectively). A strong positive correlation was also observed between RSADPPH and FIC activity (r = 0.743) for 2019; however, a strong negative correlation was found for 2020 (r = −0.781). For RSADPPH and TF, a strong negative correlation was observed in 2019 (r = −0.922), but a weak negative correlation was detected in 2020 (r = −0.271). Concerning the correlation between FIC activity and other parameters, the results present moderate variability, showing both positive and negative correlations. For TP and TF, a negative correlation was observed in both years, showing a strong correlation in 2019 (r = −0.884) and a moderate correlation in 2020 (r = −0.500). For TP and esterified catechins, a positive moderate correlation was noted in 2019 (r = 0.577), while a very strong correlation was observed in 2020 (r = 0.925). In relation to TF and esterified catechins, a strong negative correlation was observed in 2019 (r = −0.819), while a weak negative correlation was found in 2020 (r = −0.383).
These results highlight that polyphenols were the compounds that contributed the most to the antioxidant activities in all samples, with catechins being the major contributor, in particular, for the 2020 samples. Regarding the FIC activity, the correlations observed in the present study may suggest that other compounds, besides polyphenols, are also recognized as effective chelating agents and may also contribute to the moderate correlation.

4. Conclusions

All the studied green tea samples presented high antioxidant activities as well as high values of TP and TF. Additionally, the total ECD contents presented significantly higher values that ranged from 89% to 93% of the total catechins. Thus, Azorean C. sinensis green tea, as a natural nutraceutical product, could have a beneficial impact on human health.
The RSADPPH and FRAP presented, in general, better results in 2020 when compared to 2019, showing higher values in the summer months (July and August) of both years. The FIC activity exhibited the highest value in August 2019 while, in 2020, the best value was observed in May.
The TP presented, in general, slightly higher values in 2019 compared to 2020, showing the highest values in summer (July and August) and the lowest value in April. For TF, higher values were observed in the spring months of 2019, with the same pattern observed in 2020, except for August, which presented the second-highest value.
The ECDs exhibited higher values in 2020 with respect to 2019 in all months, and the same pattern was observed for total esterified catechins and EGCG. Conversely, the other esterified catechins, ECG and GCG, exhibited higher values in 2019 compared to 2020. The individual ECD contents of the studied samples decreased as follows: EGCG > ECG ≫ EC ≫ EGC, which was consistent with their high antioxidant activities.
This study revealed the significant influence of the harvest year on phenolic profiles and the antioxidant capacity of Azorean C. sinensis green tea. However, future studies are required in order to better understand the impact of single and synergistic effects of environmental factors on the observed variability.

Author Contributions

L.P. and J.B. wrote the manuscript. E.L., M.M. (Madalena Motta) and M.M. (Massimo Marcone) contributed to the research aspects carried out by the authors. All authors reviewed the manuscript. All authors have read and agreed to the published version of the manuscript.

Funding

This study was supported by PO Açores 2020 and by the Community Structural Funds FEDER and FSE for the 2014–2020 programming period, with implementation in the Azores Region, under the project “ACORES-01-0247-FEDER-000014”.

Institutional Review Board Statement

Not applicable.

Informed Consent Statement

Not applicable.

Data Availability Statement

Not applicable.

Conflicts of Interest

The authors declare no conflict of interest.

References

  1. Hajiboland, R. Environmental and nutritional requirements for tea cultivation. Folia Hort. 2017, 29, 199–220. [Google Scholar] [CrossRef] [Green Version]
  2. Pastoriza, S.; Pérez-Burillo, S.; Rufián-Henares, J.A. How brewing parameters affect the healthy profile of tea. Curr. Opin. Food Sci. 2017, 14, 7–12. [Google Scholar] [CrossRef]
  3. Ahmed, S.; Griffin, T.S.; Kraner, D.; Schaffner, M.K.; Sharma, D.; Hazel, M.; Leitch, A.R.; Orians, C.M.; Han, W.; Stepp, J.R.; et al. Environmental factors variably impact tea secondary metabolites in the context of climate change. Front. Plant Sci. 2019, 10, 939. [Google Scholar] [CrossRef] [PubMed] [Green Version]
  4. Tounekti, T.; Joubert, E.; Hernández, I.; Munné-Bosch, S. Improving the polyphenol content of tea. Crit. Rev. Plant Sci. 2013, 32, 192–215. [Google Scholar] [CrossRef]
  5. Wijeratne, M.A. Vulnerability of Sri Lanka tea production to global climate change. Water Air Soil Pollut. 1996, 92, 87–94. [Google Scholar]
  6. Chen, M.-L. Tea and health—An overview. In Tea Bioactivity and Therapeutic Potential; Zhen, Y., Chen, Z., Cheng, S., Chen, M., Eds.; Taylor and Francis: London, UK, 2002; pp. 1–16. [Google Scholar]
  7. Too, J.C.; Kinyanjui, T.; Wanyoko, J.K.; Wachira, F.N. Effect of sunlight exposure and different withering durations on theanine levels in tea (Camellia sinensis). Food Nutr. Sci. 2015, 6, 1014–1021. [Google Scholar]
  8. Lourenço, S.C.; Moldão-Martins, M.; Alves, V.D. Antioxidants of natural plant origins: From sources to food industry applications. Molecules 2019, 24, 4132. [Google Scholar] [CrossRef] [PubMed] [Green Version]
  9. Bernatoniene, J.; Kopustinskiene, D.M. The role of catechins in cellular responses to oxidative stress. Molecules 2018, 23, 965. [Google Scholar] [CrossRef] [Green Version]
  10. Khan, N.; Afaq, F.; Mukhtar, H. Cancer chemoprevention through dietary antioxidants: Progress and promise. Antioxid. Redox Signal. 2008, 10, 475–510. [Google Scholar] [CrossRef] [PubMed]
  11. Khan, N.; Mukhtar, H. Tea polyphenols in promotion of human health. Nutrients 2018, 11, 39. [Google Scholar] [CrossRef] [Green Version]
  12. Musial, C.; Kuban-Jankowska, A.; Gorska-Ponikowska, M. Beneficial properties of green tea catechins. Int. J. Mol. Sci. 2020, 21, 1744. [Google Scholar] [CrossRef] [Green Version]
  13. Tian, C.; Huang, Q.; Yang, L.; Légaré, S.; Angileri, F.; Yang, H.; Li, X.; Min, X.; Zhang, C.; Xu, C.; et al. Green tea consumption is associated with reduced incident CHD and improved CHD-related biomarkers in the Dongfeng-Tongji cohort. Sci. Rep. 2016, 6, 24353. [Google Scholar] [CrossRef] [PubMed]
  14. Derouiche, S. Oxidative stress associated with SARS-Cov-2 (COVID-19) increases the severity of the lung disease: A systematic review. J. Infect. Dis. Epidemiol. 2020, 6, 121. [Google Scholar]
  15. Zhu, Y.; Xie, D.-Y. Docking characterization and in vitro inhibitory activity of flavan-3-ols and dimeric proanthocyanidins against the main protease activity of SARS-Cov-2. Front. Plant Sci. 2020, 11, 601316. [Google Scholar] [CrossRef] [PubMed]
  16. Lee, L.-S.; Kim, S.-H.; Kim, Y.-B.; Kim, Y.-C. Quantitative analysis of major constituents in green tea with different plucking periods and their antioxidant activity. Molecules 2014, 19, 9173–9186. [Google Scholar] [CrossRef] [Green Version]
  17. Yang, C.S.; Maliakal, P.; Meng, X. Inhibition of carcinogenesis by tea. Annu. Rev. Pharmacol. Toxicol. 2002, 42, 25–54. [Google Scholar] [CrossRef] [PubMed]
  18. Yang, C.S.; Wang, X.; Lu, G.; Picinich, S.C. Cancer prevention by tea: Animal studies, molecular mechanisms and human relevance. Nat. Rev. Cancer 2009, 9, 429–439. [Google Scholar] [CrossRef] [Green Version]
  19. Singh, B.N.; Shankar, S.; Srivastava, R.K. Green tea catechin, epigallocatechin-3-gallate (EGCG): Mechanisms, perspectives and clinical applications. Biochem. Pharmacol. 2011, 82, 1807–1821. [Google Scholar] [CrossRef] [PubMed] [Green Version]
  20. Baptista, J.A.B.; Tavares, J.F.P.; Carvalho, R.C.B. Comparison of catechins and aromas among different green teas, using HPLC/SPME-GC. Food Res. Int. 1999, 31, 729–736. [Google Scholar] [CrossRef]
  21. Baptista, J.; Lima, E.; Paiva, L.; Castro, A.R. Value of off-season fresh Camellia sinensis leaves. Antiradical activity, total phenolics content and catechin profiles. LWT Food Sci. Technol. 2014, 59, 1152–1158. [Google Scholar] [CrossRef]
  22. Molyneux, P. The use of the stable free radical diphenylpicrylhydrazyl (DPPH) for estimating antioxidant activity. Songklanakarin J. Sci. Technol. 2004, 26, 211–219. [Google Scholar]
  23. Paiva, L.; Lima, E.; Motta, M.; Marcone, M.; Baptista, J. Variability of antioxidant properties, catechins, caffeine, L-theanine and other amino acids in different plant parts of Azorean Camellia sinensis. Curr. Res. Food Sci. 2020, 3, 227–334. [Google Scholar] [CrossRef] [PubMed]
  24. Oyaizu, M. Studies on products of browning reactions: Antioxidative activities of products of browning reaction prepared from glucosamine. Jpn. J. Nutr. Diet. 1986, 44, 307–315. [Google Scholar] [CrossRef] [Green Version]
  25. Wang, T.; Jónsdóttir, R.; Ólafsdóttir, G. Total phenolic compounds, radical scavenging and metal chelation of extracts from Icelandic seaweeds. Food Chem. 2009, 116, 240–248. [Google Scholar] [CrossRef]
  26. Waterhouse, A.L. Determination of total phenolics. In Current Protocols in Food Analytical Chemistry; Units I.1.1.1–I1.1.8; Wrolstad, R.E., Ed.; John Wiley & Sons: New York, NY, USA, 2001. [Google Scholar]
  27. Chang, C.-C.; Yang, M.-H.; Wen, H.-M.; Chern, J.-C. Estimation of total flavonoid content in propolis by two complementary colorimetric methods. J. Food Drug Anal. 2002, 10, 178–182. [Google Scholar]
  28. de Oliveira, C.C.; Calado, V.M.; Ares, G.; Granato, D. Statistical approaches to assess the association between phenolic compounds and the in vitro antioxidant activity of Camellia sinensis and Ilex paraguariensis teas. Crit. Rev. Food Sci. Nutr. 2015, 55, 1456–1473. [Google Scholar] [CrossRef]
  29. Nor Qhairul Izzreen, M.N.; Mohd Fadzelly, A.B. Phytochemicals and antioxidant properties of different parts of Camellia sinensis leaves from Sabah Tea Plantation in Sabah, Malaysia. Int. Food Res. J. 2013, 20, 307–312. [Google Scholar]
  30. Tong, T.; Liu, Y.-J.; Kang, J.; Zhang, C.-M.; Kang, S.-G. Antioxidant activity and main chemical components of a novel fermented tea. Molecules 2019, 24, 2917. [Google Scholar] [CrossRef] [Green Version]
  31. Lee, J.; Koo, N.; Min, D.B. Reactive oxygen species, aging, and antioxidative nutraceuticals. Compr. Rev. Food Sci. Food Saf. 2004, 3, 21–33. [Google Scholar] [CrossRef]
  32. Rohadi, R.; Lelita, D.I.; Putri, A.S. Antioxidant capacity of white tea (Camelia sinensis) extract: Compared to green, oolong and black tea. IOP Conf. Ser. Earth Environ. Sci. 2019, 292, 012018. [Google Scholar] [CrossRef]
  33. Erturk, Y.; Ercisli, S.; Sengul, M.; Eser, Z.; Haznedar, A.; Turan, M. Seasonal variation of total phenolic, antioxidant activity and minerals in fresh tea shoots (Camellia sinensis var. sinensis). Pak. J. Pharm. Sci. 2010, 23, 69–74. [Google Scholar] [PubMed]
  34. Mahanta, P.K.; Baruah, H.K. Theaflavin pigment formation and polyphenol oxidase activity as criteria of fermentation in orthodox and CTC teas. J. Agric. Food Chem. 1992, 40, 860–863. [Google Scholar] [CrossRef]
  35. Harbowy, M.E.; Balentine, D.A. Tea chemistry. Crit. Rev. Plant Sci. 1997, 16, 415–480. [Google Scholar] [CrossRef]
  36. Nibir, Y.M.; Sumit, A.F.; Akhand, A.A.; Ahsan, N.; Hossain, M.S. Comparative assessment of total polyphenols, antioxidant and antimicrobial activity of different tea varieties of Bangladesh. Asian Pac. J. Trop. Biomed. 2017, 7, 352–357. [Google Scholar] [CrossRef]
  37. Zhao, C.; Li, C.; Liu, S.; Yang, L. The galloyl contributing to main antioxidant capacity of tea made from Camellia sinensis in China. Sci. World J. 2014, 863984. [Google Scholar]
  38. Zheng, X.Q.; Jin, J.; Chen, H.; Du, Y.Y.; Ye, J.H.; Lu, J.L.; Lin, C.; Dong, J.J.; Sun, Q.L.; Wu, L.Y.; et al. Effect of ultraviolet B irradiation on accumulation of catechins in tea (Camellia sinensis (L.) O. Kuntze). Afr. J. Biotechnol. 2008, 7, 3283–3287. [Google Scholar]
  39. Sharma, V.; Joshi, R.; Gulati, A. Seasonal clonal variations and effects of stresses on quality chemicals and prephenate dehydratase enzyme activity in tea (Camellia sinensis). Eur. Food Res. Technol. 2011, 232, 307–317. [Google Scholar] [CrossRef]
Table 1. DPPH radical scavenging activity (RSADPPH) and ferric reducing antioxidant power (FRAP) in dry extracts of Azorean Camellia sinensis (L.) Kuntze green tea samples from Gorreana Tea Plantation that were obtained during the collection seasons of two different years 1.
Months of Sample
Collection and Control
RSADPPH (EC50 2, µg/mL)FRAP (EC50 3, µg/mL)
2019202020192020
April6.37 ± 0.06 c5.09 ± 0.07 c7.76 ± 0.15 d6.61 ± 0.06 b
May6.67 ± 0.21 c5.76 ± 0.04 d7.02 ± 0.04 bc7.05 ± 0.04 b
June5.37 ± 0.03 b4.80 ± 0.11 bc7.48 ± 0.08 cd6.58 ± 0.12 b
July4.10 ± 0.10 a3.94 ± 0.04 a6.64 ± 0.13 ab5.85 ± 0.18 a
August4.13 ± 0.06 a4.38 ± 0.05 ab6.40 ± 0.11 a5.46 ± 0.11 a
BHT 425.84 ± 0.588.51 ± 0.31
1 Values are mean ± SD (n = 3). Different superscript letters are significantly different (p < 0.05) within the same column. 2 Half-maximal effective concentration. 3 Effective concentration at which the absorbance is 0.5. 4 Reference sample at the same concentration of the extracts. BHT—butylated hydroxytoluene.
Table 2. Total phenolic (TP) and total flavonoid (TF) contents in dry extracts (DE) of Azorean Camellia sinensis (L.) Kuntze green tea samples from Gorreana Tea Plantation that were obtained during the collection seasons of two different years 1.
Months of Sample CollectionTP (mg GAE/g DE)TF (mg RE/g DE)
2019202020192020
April291.14 ± 0.76 c300.25 ± 0.75 c67.93 ± 1.09 a69.57 ± 0.86 a
May306.19 ± 0.09 b302.47 ± 1.76 bc67.01 ± 0.63 a60.26 ± 1.34 b
June312.80 ± 1.45 b307.25 ± 1.89 b53.60 ± 1.38 b59.29 ± 2.32 b
July326.92 ± 1.07 a320.58 ± 0.59 a53.26 ± 1.13 b50.27 ± 1.27 c
August325.14 ± 0.88 a315.86 ± 2.24 a51.85 ± 0.88 b68.88 ± 0.72 a
1 Values are mean ± SD (n = 3). Different superscript letters are significantly different (p < 0.05) within the same column. GAE—gallic acid equivalents; RE—rutin equivalents.
Table 3. Catechins and caffeine content (mg/g of the sample on a dry weight extract) of Azorean Camellia sinensis (L.) Kuntze green tea samples from Gorreana Tea Plantation that were obtained during the collection seasons of two different years 1.
Catechins and CAF20192020
AprilMayJuneJulyAugustAprilMayJuneJulyAugust
GC0.75 ± 0.03 c6.80 ± 0.19 a2.91 ± 0.03 b1.27 ± 0.06 c2.16 ± 0.05 b2.27 ± 0.18 a1.60 ± 0.22 bc1.93 ± 0.21 ab1.50 ± 0.04 bc1.39 ± 0.09 c
EGC8.22 ± 1.33 b14.65 ± 0.24 a7.39 ± 0.44 b5.46 ± 0.48 c4.49 ± 0.13 c9.86 ± 0.39 a0.58 ± 0.09 d6.93 ± 0.33 b5.58 ±0.18 b3.77 ± 0.17 c
C6.05 ± 0.81 a7.16 ± 0.44 a2.72 ± 0.08 b3.10 ± 0.30 b2.87 ± 0.19 b5.12 ± 0.32 a5.06 ± 0.19 a3.54 ± 0.21 c4.93 ± 0.31 a4.24 ± 0.24 b
EC34.35 ± 1.11 b72.61 ± 0.33 a31.46 ± 0.71 b26.78 ± 0.03 c18.68 ± 0.11 d30.45 ± 1.19 a25.27 ± 1.02 b21.02 ± 0.38 c17.52 ± 0.78 d19.44 ± 0.49 cd
EGCG190.32 ± 0.54 b140.91 ± 1.26 c195.97 ± 4.08 b210.81 ± 1.12 a205.28 ± 5.12 a214.52 ± 3.01 c227.03 ± 2.19 b228.84 ± 1.48 b231.58 ± 1.08 b240.16 ± 1.17 a
GCG19.87 ± 0.98 d23.70 ± 1.34 c31.42 ± 0.43 b25.76 ± 0.22 c37.39 ± 1.44 a19.40 ± 1.24 cd17.74 ± 0.62 d23.52 ± 0.49 ab21.75 ± 0.22 bc26.03 ± 0.51 a
ECG116.12 ± 1.69 ab119.18 ± 0.25 a113.14 ± 2.37 bc112.46 ± 0.16 c112.62 ± 2.67 c106.34 ± 0.98 a98.30 ± 0.77 b99.25 ± 0.76 b102.10 ± 0.68 ab90.01 ± 0.86 c
CAF15.12 ± 0.18 c18.40 ± 0.51 b20.45 ± 0.71 a15.06 ± 1.20 c12.86 ± 0.25 d15.68 ± 0.78 c13.19 ± 0.86 c19.28 ± 0.42 b26.43 ± 0.33 a29.35 ± 0.66 a
Est. CAT326.31 ± 0.16 c283.78 ± 0.33 d340.52 ± 1.28 b349.02 ± 0.74 a355.29 ± 1.01 a340.26 ± 1.21 b343.07 ± 1.28 b351.61 ± 1.63 a355.43 ± 1.97 a356.20 ± 1.58 a
Non-est. CAT49.36 ± 2.22 b101.22 ± 0.32 a44.47 ± 1.26 b36.61 ± 0.86 c28.20 ± 0.38 d47.70 ± 1.05 a32.51 ± 0.96 b33.42 ± 1.18 b29.53 ± 0.93 c28.84 ± 0.81 c
ECDs349.01 ± 2.58 b347.35 ± 1.58 b347.95 ± 0.56 b355.51 ± 0.45 a341.07 ± 2.21 c361.17 ± 2.09 a351.18 ± 1.94 c356.04 ± 1.22 b356.78 ± 1.68 b353.38 ± 1.67 c
1 Values are mean ± SD (n = 3). Different superscript letters are significantly different (p < 0.05) within the same line and harvested year; GC—gallocatechin; EGC—epigallocatechin; C—catechin; EC—epicatechin; EGCG—epigallocatechin-3-gallate; GCG—gallocatechin-3-gallate; ECG—epicatechin-3-gallate; CAF—caffeine; Est. CAT (esterified catechins), sum of EGCG, ECG, and GCG; Non-est. CAT (non-esterified catechins), sum of C, EC, EGC, and GC; ECDs (epicatechin derivatives), sum of EC, EGC, EGCG, and ECG.
Table 4. Correlation matrix of the studied parameters in Azorean Camellia sinensis (L.) Kuntze green tea samples from 2019 (A) and 2020 (B) (Pearson correlation coefficients).
(A)
RSADPPHFIC ActivityTPTFEST CAT
RSADPPH1----
FIC activity0.7431---
TP0.8810.4521--
TF−0.922−0.440−0.8841-
EST CAT0.8710.6920.577−0.8191
(B)
RSADPPHFIC ActivityTPTFEST CAT
RSADPPH1----
FIC activity−0.7811---
TP0.951−0.5761--
TF−0.271−0.131−0.5001-
EST CAT0.911−0.5030.925−0.3831
RSADPPH—DPPH radical scavenging activity; FIC—ferrous ion-chelating; TP—total phenolics; TF—total flavonoids; EST CAT—esterified catechins (epigallocatechin-3-gallate, epicatechin-3-gallate, and gallocatechin-3-gallate).
Publisher’s Note: MDPI stays neutral with regard to jurisdictional claims in published maps and institutional affiliations.

