Abstract
The aim of the present study was to investigate whether base height of 3D-printed dental models has an impact on local thickness values from polyethylene terephthalate glycol (PET-G) aligners. A total of 20 aligners were thermoformed on dental models from the upper jaw exhibiting either a 5 mm high (H) or narrow (N), i.e., 0 mm, base height. The aligners were digitized using micro-CT, segmented, and local thickness values were computed utilizing a 3D-distance transform. The mean thickness values and standard deviations were assessed for both groups, and local thickness values at pre-defined reference points were also recorded. The statistical analysis was performed using R. Aligners in group H were significantly thinner and more homogenous compared to group N (p < 0.001). Significant differences in thickness values were observed among tooth types between both groups. Whereas thickness values were comparable at cusp tips and occlusal/incisal/cervical measurement locations, facial and palatal surfaces were significantly thicker in group N compared to group H (p < 0.01). Within the limits of the study, the base height of 3D-printed models impacts on local thickness values of thermoformed aligners. The clinician should consider potential implication on exerted forces at the different tooth types, and at facial as well as palatal surfaces.
1. Introduction
Aligners, thermoformed from elastic polymers, gained widespread application in recent years [1,2] due to ease of use, patient comfort, aesthetics, ease of oral hygiene and a reduced risk for white spot lesions [3,4,5].
Despite their broad application, predictability of aligner treatment outcomes is still controversially discussed [6,7,8]. Discrepancies between the initial setup and final outcomes may owe to patient related factors (patient adherence, metabolic factors), and may also relate to inaccurate prediction of the force systems exerted on teeth [9]. Even though initially neglected, side effects from orthodontic treatment occur not only with fixed appliances, but also in aligner therapy [10,11]. Especially forces of higher magnitude and uncontrolled tipping of teeth have to be avoided in order to limit root resorption [12,13]. Thus, improving biomechanical understanding of exerted forces and moments is of crucial importance to enhance safety and predictability of aligner treatments.
In-vitro studies demonstrated that initial forces and moments of aligners can exceed recommended force levels up to the factor six [14,15,16,17]. As reported earlier, force magnitudes can be decreased by utilizing thinner aligner raw materials [18,19]. However, the final thicknesses of aligners depend on the thermoforming process and might be associated with geometric properties of the 3D-printed dental cast employed for manufacturing. Furthermore, as 3D-printed aligners are still rarely used, and as thermoforming is frequently manually conducted by a trained technician, aligners may not be perfectly homogenous even if they are fabricated on the same cast [20].
Few techniques exist to assess homogeneity and microstructure of thermoplastic materials. Micro-computed tomography (micro-CT), whose laboratory usage has been introduced in the 1990s for structural analysis of calcified tissues, provides high resolution three-dimensional images from various specimen [21]. Its applicability to assess aligner material properties has been demonstrated recently [22,23,24,25].
Therefore, the present study aimed at assessing the impact of dental model height on PET-G aligner thickness values, and at investigating the within-group variability of thickness values potentially arising from the manual fabrication process.
2. Materials and Methods
2.1. Study Design
The present study reports on a sample of n = 20 polyethylene terephthalate glycol (PET-G) aligners. The aligners were thermoformed on a 3D-printed dental model of the upper jaw with either narrow (N) base height, or high (H) base height (achieved by placing a spacer of 5 mm height) (n = 10 aligners per group, respectively). The perpendicular distance between occlusal plane and model-tray were defined as model height and amounted to 11 mm (Figure 1). Consequently, model height in the N group was 11 mm, and 16 mm in the H group.
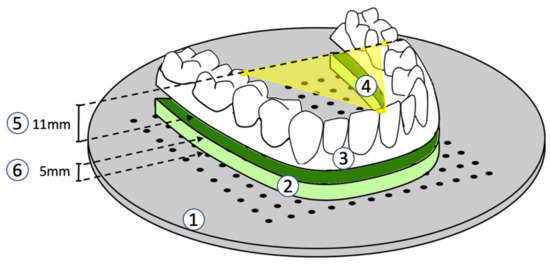
Figure 1.
Thermoforming-Setup (1: model tray; 2: spacer; 3: acrylic dental arch model; 4: occlusal plane parallel to the model tray; 5: model height = 11 mm; 6: spacer height = 5 mm).
The 3d-printed model was fabricated using a SLA printer (Form 2, Formlabs Inc., Somerville, MA, USA) at 100 micron resolution (100% infill) and using the Draft Resin (Formlabs Inc.). The model was oriented in a nearly vertical position to minimize warping. The model was manually cleaned and cured according to manufacturer’s recommendations. After curing, the model base was manually grinded to compensate any warping and ensure full flat contact to the thermoforming tray. It was then stored at ambient air at 20 °C and 50% humidity.
2.2. Thermoforming
Thermoforming was achieved using a Biostar thermoforming machine (Biostar VII, Scheu Dental, Iserlohn, Germany) and a PET-G raw material of 0.5 mm thickness (CA Clear Aligner, Scheu Dental, Iserlohn, Germany). The dental model was placed in the center of the thermoforming chamber such that the mid palatal suture was located in 12 o’clock position. The occlusal plane was oriented parallel to a perforated custom model-tray (Figure 1). The dental model was held in place by 3 positioning pins to ensure constant localization and orientation for each thermoforming process.
Settings for heating and pressure forming were the same for all aligners (21 °C ambient air, 50% humidity, 20 s, 220 °C). The edges of all aligners were trimmed to a line 1 mm cervically of the gingival margin after thermoforming.
2.3. Micro-Computed Tomography and Image Processing
All aligners were scanned with a micro-CT scanner (VivaCT 80, Scanco Medical AG, Wangen-Brüttisellen, Switzerland). The scans were performed at 45 kVp, 88 μA, and 254 ms integration time and reconstructed to a nominal isotropic voxel size of 31.2 μm.
Image processing was performed using an in-house programmed script implemented with the Image Processing Language (IPL) (Scanco Medical AG, Wangen-Brüttisellen, Switzerland) which performed the following steps:
First, a cylindric volume of interest (VOI) was placed at the outer margin of the field of view. Then, a threshold of 4.2% was used to segment the aligners within VOI. Aligner thickness was then calculated by means of the 3D-Chamfer-Distance transform approach [26]. In brief, this approach calculates the outer contours of a segmented material and it assigns the Euclidean distance to its closest contour point as grey value to every point within the segmented structure. Hence, zero values represent contour points, whereas higher values represent greater thickness values. For visualization purposes, the calculated aligner thickness values were eventually rendered using a 3D-rendering program (uct_3d, Scanco Medical AG, Wangen-Brüttisellen, Switzerland) (Figure 2).
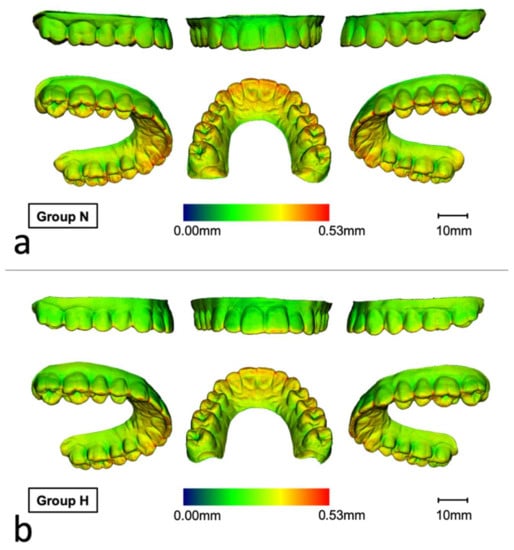
Figure 2.
Representative renderings visualizing the local material thickness of micro-CT scanned aligners thermoformed at (a) narrow (N) or (b) heigh (H) dental models (blue: 0.00 mm, red: 0.53 mm). Thickness values were higher in the N group compared to the H group, especially in the anterior palatal area, occlusally and on incisal edges.
2.4. Thickness Measurements
To assess local aligner thickness values, a total of n = 29 reference points were utilized (Table 1). At each reference point, the respective local thickness was recorded.

Table 1.
Reference points for assessment of local aligner material thickness values. The column “aggregated location” specifies which values were aggregated per group (high/narrow) or tooth type (molar/premolar/canine/front), respectively. The right column specifies the teeth at which the thickness measurements were recorded.
2.5. Statistical Analysis
The statistical analysis was performed using R 2021 [26]. To compare the mean thickness values and the respective standard deviations between N and H groups, the Mann-Whitney-U test was used.
For descriptive purposes, local thickness values at reference points were aggregated for the variables tooth type (molar/premolar/canine/front) and measurement location (Table 1) and presented as boxplots.
To assess the relationship between thickness values and the effects tooth type/measurement location, the lme4-package [27] was used to perform linear mixed effects models. As fixed effects, we entered tooth type and measurement location (with and without interaction term) into the model. As random effects, we had intercepts for aligners. Visual inspection of residual plots did not reveal any obvious deviations from homoscedasticity or normality. p-values were obtained by likelihood ratio tests of the full model with the effect in question against the model without the effect in question. Post-hoc tests were conducted using the emmeans-package [28], and the Tukey-method was utilized for p-value correction. The results were found significant at p < 0.05.
3. Results
The in-house developed script enabled successful automated segmentation of the aligners. Calculation of the distance transform enabled assessment of thickness values (Figure 2).
3.1. Comparison of Thickness Values
Mean thickness values were significantly lower in group H compared to N (median [quartile 1–3]: 0.30 [0.30–0.30] vs. 0.32 [0.31–0.32], p < 0.001). When comparing the standard deviations, which correspond to material homogeneity, values in group H were significantly lower compared to group N (median [1st–3rd quartile]: 0.064 [0.063–0.65] vs. 0.061 [0.060–0.062], p < 0.001) (Figure 3).
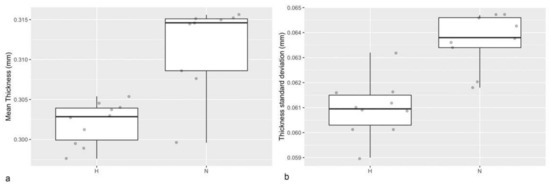
Figure 3.
(a) Boxplot showing the mean thickness values of aligners thermoformed at narrow (N) and high (H) dental models. (b) Boxplot showing the standard deviation of the respective thickness values representing the material homogeneity.
3.2. Comparison of Local Thickness Values at Selected Tooth Types
To assess whether the tooth type has an impact on the material thickness, a linear mixed effects model was used. A significant effect of the effects group and tooth type were found (p < 0.001, respectively), and also the interaction of group (high vs. narrow) and tooth type was found to be significant (p < 0.001). Thickness values were higher in N group, and differences between tooth types were also more pronounced in N group (Figure 4).
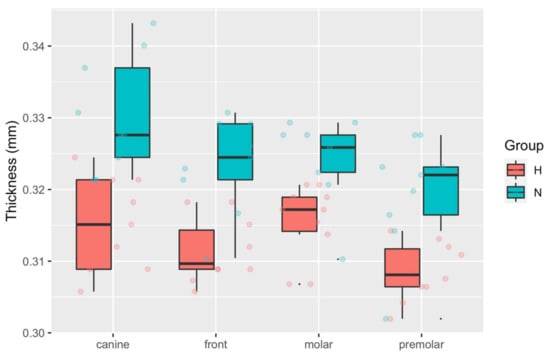
Figure 4.
Boxplot showing the local thickness values at reference points for group high (H) and narrow (N). The thickness values at the reference points were aggregated by tooth type. Thickness values were higher in the N compared to the H group (p < 0.001), and highest values were seen at canines in the N group.
The post hoc test revealed significant differences between groups for each tooth type, and the estimated difference was greatest at canines (Table 2). Within-group multiple comparison revealed significant differences between premolars and canines or premolars in the H-group, and canine versus front teeth or premolars in the N-group (Table 3).
Table 2.
Estimated mean [standard error (SE)] for the local thickness values (mm) from group high (H) and narrow (N) aggregated by tooth type. Comparison was achieved using multiple comparison post hoc test with Tukey-method for p-value adjustment (family of 8 estimates). ** p < 0.01, *** p < 0.001.
Table 3.
Within-group comparison of local thickness values (mm) for group high (H) and narrow (N) aggregated for tooth type. Comparison was achieved using multiple comparison post hoc test with Tukey-method for p-value adjustment (family of 4 estimates), respectively. * p < 0.05, ** p < 0.01, *** p < 0.001.
3.3. Comparison of Thickness Values at Measurement Locations
Linear mixed effects models revealed a significant effect of group and measurement location (p < 0.001, respectively), as well as for their interaction (p < 0.001). Thickness values were slightly higher in N group at most of the locations. With respect to the measurement location, thickness values were smallest at facial surfaces and highest at incisal faces. Thickness values were also higher at cusp tips compared to the fissures (occlusal surface), and within a medium range at palatal surfaces (Figure 5).
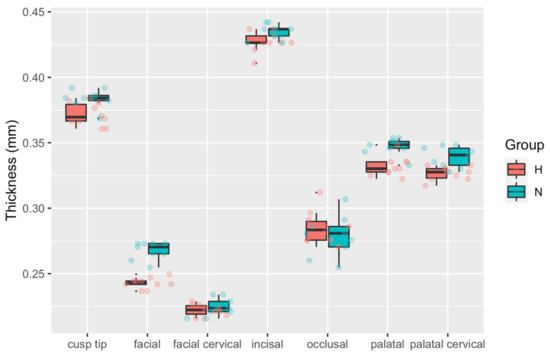
Figure 5.
Boxplot showing the local thickness values at reference points for group high (H) and narrow (N). The local thickness values were aggregated by tooth measurement location. Highest values were seen at cusp tips, and palatal as well as palatal cervical faces.
Post-hoc multiple comparison revealed significant differences at facial and palatal surfaces (Table 4). Within-group comparison revealed significant differences between all measurement locations except palatal and palatal-cervical, respectively (Table 5).
Table 4.
Between-group comparison of local thickness values (mm) from group high (H) and narrow (N) aggregated for measurement location. Comparison was achieved using a multiple comparison post hoc test with Tukey-method for p-value adjustment (family of 14 estimates), respectively. ** p < 0.01, *** p < 0.001.
Table 5.
Within-group comparison of local thickness values (mm) for group high (H) and narrow (N) aggregated for measurement location. Comparison was achieved using multiple comparison post hoc test with Tukey-method for p-value adjustment (family of 7 estimates), respectively. * p < 0.05, *** p < 0.001.
4. Discussion
Previous research revealed that predictability and accuracy of aligner treatments can be as low as 30–50% when compared with the initial setup [14,15,16,17,29]. Besides patient related factors, varying material thickness of aligners has been suspected to impact on predictability of aligner treatments [18]. Therefore, the present study aimed at evaluating homogeneity of thermoformed PET-G aligners, and whether base height of 3D-printed dental models also impacts on material thickness values at different measurement locations.
The present study identified that aligners formed on narrow (N) models exhibited higher thickness values compared to those produced on higher (H) dental models. Material homogeneity was greater in the H compared to the N group. Additionally, thickness values varied with respect to the tooth types, and the measurement locations. Highest values were found at incisal edges and cusp tips, followed by palatal surfaces, and lowest values were seen at the facial aspects. Comparison between N and H groups did not reach statistical significance at most measurement locations. At palatal and facial surfaces, however, aligners from group N were significantly thicker compared to group H.
According to literature, the area moment of inertia is calculated using the third power of material diameter in direction of the acting forces [30]. Therefore, a 10% reduction of aligner material thickness could in theory reduce exerted forces up to 30%. In the present study, facial surfaces showed the smallest thickness values (estimated mean thickness group H/N: 0.243 mm/0.268 mm), whereas palatal (0.332 mm/0.347 mm) and incisal surfaces (0.427 mm/0.434 mm) showed highest values. Therefore, thickness values were 38–43% higher at incisal and 20–25% higher at palatal compared to facial surfaces. Differences between the groups amounted to 9% at the facial and 4% at palatal faces. Thus, these differences appear to be in a clinically relevant range, potentially impacting on treatment predictability.
Nonetheless, it must be noted that force transmission patterns from aligners are complex and not yet fully understood [31,32]. This owes to the so called “half shell shapes” of aligners and differences in localization of contact areas to teeth and attachments. Additionally, material deformation when aligners are put on the teeth, and material swelling due to saliva exposure must be considered. Therefore, aligner thickness is not the only factor influencing resulting forces and moments.
Scientific disagreement persists concerning the capability of aligners to perform bodily tooth movement [29,31,33,34], which necessitates application of a counterbalancing moment for control of root position [35]. In the present study, aligner specimens were thinnest at the facial/facial-cervical aspects, which is in line with a recent study revealing a 50% reduction of layer thickness in buccal-gingival regions [36]. Previous research demonstrated that low thickness values can lead to aligner deformation at the gingival margin [15], eventually resulting in reduced root control. However, besides the rigidity of aligners, application of attachments and shape modification like power buttons or ridges are also relevant to control tooth movement [32,37]. Thus, the impact of the facial/facial-gingival thinning should be further explored in future investigations.
The impact of dental model height has not been addressed in previous studies, despite its potential association with aligner thickness values, and therefore, the resulting force systems. In the present investigation, aligners thermoformed on the higher model showed increased homogeneity of material thickness values, but also a decreased overall thickness. Therefore, it may be speculated that adopting raw material thickness and height of 3D-printed models may be advantageous to better control the material thickness properties of thermoformed aligners, and eventually the resulting force systems. Additionally, as crown height varies among patients [38], clinicians should also carefully consider that higher crowns may lead to reduced thickness values, and vice versa.
Posterior bite opening is one of the common adverse effects in aligner therapy. Also, perfect occlusal finishing is immanently complicated by the interposition of aligner material between occluding teeth [39,40,41]. The results of this study demonstrated that aligners were particularly thick at cusp tips, which constitutes the almost inevitable bite-lowering effect of aligners.
Manual fabrication of aligners inevitably leads to a certain degree of error: manual trimming of the aligner edges causes minor length discrepancies, and manual removal of the aligner from the thermoforming model may lead to shape deformations. Therefore, the thermoforming process was repeated 10-times for each group, and minor differences in thickness were seen at the various measurement locations. However, the quartile ranges were much smaller at the respective measurement points compared to the within-group variability among measurement locations, thus confirming the precise fabrication of aligners in the present investigation. To avoid deformation during micro-CT scanning, the aligners were held in place by polyurethane foam. Nonetheless, minor aligner deformations due to contact to the foam cannot be ruled out.
Despite these minor shortcomings, it could be demonstrated, that micro-CT-scanning is an effective method to assess aligner thickness three-dimensionally. In contrast to previous studies, thickness values were automatically computed upon successful segmentation by means of a 3D-distance transform [42]. This method has the advantage of being resistant against oblique measurements which may occur whenever the micro-CT slices are not orthogonal to aligner surfaces.
Limitations associated with the present analysis include that only upper models were utilized. Due to differences in arch- and tooth-shape, future studies should also investigate thickness homogeneity and the impact of model height for both dental arches. Additionally, only one raw material of the same thickness was utilized. Therefore, it remains unclear whether the results of the present study can be transferred to different aligner polymers and other material thicknesses. Eventually, no a-priori sample size calculation could be performed, as no eligible study could be identified at that time.
In the future, direct 3D-printing of aligners might overcome limitations associated with conventional thermoforming [43]. In 3D-printed aligners, material thickness values may be more homogenous, and unintentional thinning may not occur. Areas of high local stresses may even be specifically thickened to improve stiffness and optimize the resulting force systems.
5. Conclusions
- Micro-CT scanning of aligners followed by automated segmentation and computation material thickness is an eligible approach to analyze material homogeneity
- Manual thermoforming can produce aligners of high repetitious accuracy
- Aligners thermoformed over a higher model exhibited lower material thickness values, especially at facial and palatal surfaces
- Aligners thermoformed over a higher model showed greater homogeneity in material thickness
Author Contributions
B.A.I.: formal analysis, writing—original draft, writing—review & editing. R.K.: investigation, formal analysis, data curation, writing—original draft, writing—review & editing; N.R.: investigation. D.D.: writing—review & editing, supervision. K.B.: conceptualization, investigation, data curation, writing—original draft, writing—review & editing, supervision, project administration. All authors have read and agreed to the published version of the manuscript.
Funding
This research received no external funding.
Institutional Review Board Statement
Not applicable.
Data Availability Statement
Not applicable.
Acknowledgments
The authors express their gratitude to dental technicians Tina Mücke and Axel Dockhorn for their kind help by manufacturing the investigated aligners.
Conflicts of Interest
The authors declare no conflict of interest.
References
- Q4 and 2018 Corporate Fact Sheet. Available online: http://www.aligntech.com/documents/Align%20Technology%20Corp%20Fact%20Sheet%202018%20Q4.pdf (accessed on 3 March 2021).
- Ihssen, B.A.; Willmann, J.H.; Nimer, A.; Drescher, D. Effect of in vitro aging by water immersion and thermocycling on the mechanical properties of PETG aligner material. J. Orofac. Orthop. 2019, 80, 292–303. [Google Scholar] [CrossRef]
- Buschang, P.H.; Chastain, D.; Keylor, C.L.; Crosby, D.; Julien, K.C. Incidence of white spot lesions among patients treated with clear aligners and traditional braces. Angle Orthod. 2019, 89, 359–364. [Google Scholar] [CrossRef] [Green Version]
- Rossini, G.; Parrini, S.; Castroflorio, T.; Deregibus, A.; Debernardi, C.L. Periodontal health during clear aligners treatment: A systematic review. Eur. J. Orthod. 2015, 37, 539–543. [Google Scholar] [CrossRef]
- Zhang, B.; Huang, X.-Q.; Huo, S.; Zhang, C.; Zhao, S.; Cen, X.; Zhao, Z. Effect of clear aligners on oral health-related quality of life: A systematic review. Orthod. Craniofac. Res. 2020, 23, 363–370. [Google Scholar] [CrossRef] [PubMed]
- Ke, Y.; Zhu, Y.; Zhu, M. A comparison of treatment effectiveness between clear aligner and fixed appliance therapies. BMC Oral Health 2019, 19, 24. [Google Scholar] [CrossRef] [PubMed]
- Robertson, L.; Kaur, H.; Fagundes, N.C.F.; Romanyk, D.; Major, P.; Mir, C.F. Effectiveness of clear aligner therapy for orthodontic treatment: A systematic review. Orthod. Craniofac. Res. 2020, 23, 133–142. [Google Scholar] [CrossRef] [PubMed]
- Charalampakis, O.; Iliadi, A.; Ueno, H.; Oliver, D.R.; Kim, K.B. Accuracy of clear aligners: A retrospective study of patients who needed refinement. Am. J. Orthod. Dentofac. Orthop. 2018, 154, 47–54. [Google Scholar] [CrossRef] [PubMed]
- Jheon, A.H.; Oberoi, S.; Solem, R.C.; Kapila, S. Moving towards precision orthodontics: An evolving paradigm shift in the planning and delivery of customized orthodontic therapy. Orthod. Craniofac. Res. 2017, 20 (Suppl. 1), 106–113. [Google Scholar] [CrossRef] [PubMed]
- Fang, X.; Qi, R.; Liu, C. Root resorption in orthodontic treatment with clear aligners: A systematic review and meta-analysis. Orthod. Craniofac. Res. 2019, 22, 259–269. [Google Scholar] [CrossRef] [PubMed]
- Elhaddaoui, R.; Qoraich, H.S.; Bahije, L.; Zaoui, F. Orthodontic aligners and root resorption: A systematic review. Int. Orthod. 2017, 15, 1–12. [Google Scholar] [CrossRef]
- Gonzales, C.; Hotokezaka, H.; Yoshimatsu, M.; Yozgatian, J.H.; Darendeliler, M.A.; Yoshida, N. Force magnitude and dura-tion effects on amount of tooth movement and root resorption in the rat molar. Angle Orthod. 2008, 78, 502–509. [Google Scholar] [CrossRef] [PubMed] [Green Version]
- Roscoe, M.G.; Meira, J.; Cattaneo, P.M. Association of orthodontic force system and root resorption: A systematic review. Am. J. Orthod. Dentofac. Orthop. 2015, 147, 610–626. [Google Scholar] [CrossRef] [PubMed]
- Elkholy, F.; Panchaphongsaphak, T.; Kilic, F.; Schmidt, F.; Lapatki, B.G. Forces and moments delivered by PET-G aligners to an upper central incisor for labial and palatal translation. J. Orofac. Orthop. 2015, 76, 460–475. [Google Scholar] [CrossRef]
- Elkholy, F.; Schmidt, F.; Jäger, R.; Lapatki, B.G. Forces and moments delivered by novel, thinner PET-G aligners during labiopalatal bodily movement of a maxillary central incisor: An in vitro study. Angle Orthod. 2016, 86, 883–890. [Google Scholar] [CrossRef] [Green Version]
- Hahn, W.; Engelke, B.; Jung, K.; Dathe, H.; Fialka-Fricke, J.; Kubein-Meesenburg, D.; Sadat-Khonsari, R. Initial Forces and Moments Delivered by Removable Thermoplastic Appliances during Rotation of an Upper Central Incisor. Angle Orthod. 2010, 80, 239–246. [Google Scholar] [CrossRef] [Green Version]
- Kohda, N.; Iijima, M.; Muguruma, T.; Brantley, W.A.; Ahluwalia, K.S.; Mizoguchi, I. Effects of mechanical properties of thermoplastic materials on the initial force of thermoplastic appliances. Angle Orthod. 2013, 83, 476–483. [Google Scholar] [CrossRef] [PubMed]
- Hahn, W.; Dathe, H.; Fialka-Fricke, J.; Fricke-Zech, S.; Zapf, A.; Kubein-Meesenburg, D.; Sadat-Khonsari, R. Influence of thermoplastic appliance thickness on the magnitude of force delivered to a maxillary central incisor during tipping. Am. J. Orthod. Dentofac. Orthop. 2009, 136, 12.e1–12.e7. [Google Scholar] [CrossRef]
- Gao, L.; Wichelhaus, A. Forces and moments delivered by the PET-G aligner to a maxillary central incisor for palatal tipping and intrusion. Angle Orthod. 2017, 87, 534–541. [Google Scholar] [CrossRef] [PubMed] [Green Version]
- Jindal, P.; Juneja, M.; Siena, F.L.; Bajaj, D.; Breedon, P. Mechanical and geometric properties of thermoformed and 3D printed clear dental aligners. Am. J. Orthod. Dentofac. Orthop. 2019, 156, 694–701. [Google Scholar] [CrossRef] [Green Version]
- Rüegsegger, P.; Koller, B.; Müller, R. A microtomographic system for the nondestructive evaluation of bone architecture. Calcif. Tissue Int. 1996, 58, 24–29. [Google Scholar] [CrossRef]
- Mantovani, E.; Parrini, S.; Coda, E.; Cugliari, G.; Scotti, N.; Pasqualini, D.; Deregibus, A.; Castroflorio, T. Micro computed tomography evaluation of Invisalign aligner thickness homogeneity. Angle Orthod. 2021, 91, 343–348. [Google Scholar] [CrossRef]
- Lombardo, L.; Palone, M.; Longo, M.; Arveda, N.; Nacucchi, M.; De Pascalis, F.; Spedicato, G.A.; Siciliani, G. MicroCT X-ray comparison of aligner gap and thickness of six brands of aligners: An in-vitro study. Prog. Orthod. 2020, 21, 12. [Google Scholar] [CrossRef]
- Palone, M.; Longo, M.; Arveda, N.; Nacucchi, M.; De Pascalis, F.; Spedicato, G.A.; Siciliani, G.; Lombardo, L. Micro-computed tomography evaluation of general trends in aligner thickness and gap width after thermoforming procedures in-volving six commercial clear aligners: An in vitro study. Korean J. Orthod. 2021, 51, 135–141. [Google Scholar] [CrossRef]
- Hildebrand, T.; Rüegsegger, P. A new method for the model-independent assessment of thickness in three-dimensional images. J. Microsc. 1997, 185, 67–75. [Google Scholar] [CrossRef]
- R Core Team. R: A Language and Environment for Statistical Computing; R Foundation for Statistical Computing: Vienna, Austria, 2021. [Google Scholar]
- Bates, D.; Mächler, M.; Bolker, B.; Walker, S. Fitting linear mixed-effects models using lme4. J. Stat. Softw. 2015, 67, 1–48. [Google Scholar] [CrossRef]
- Lenth, R.V.; Buerkner, P.; Herve, M.; Love, J.; Riebl, H.; Singmann, H. Estimated Marginal Means, aka Least-Squares Means. Available online: https://cran.r-project.org/web/packages/emmeans/emmeans.pdf (accessed on 10 May 2021).
- Simon, M.; Keilig, L.; Schwarze, J.; Jung, B.A.; Bourauel, C. Treatment outcome and efficacy of an aligner technique—Regarding incisor torque, premolar derotation and molar distalization. BMC Oral Health 2014, 14, 68. [Google Scholar] [CrossRef] [PubMed] [Green Version]
- Richard, H.A.; Sander, M. Technische Mechanik. Festigkeitslehre: Lehrbuch mit Praxisbeispielen, Klausuraufgaben und Lösungen; Vieweg+Teubner: Wiesbaden, Germany, 2008. [Google Scholar]
- Jiang, T.; Wu, R.Y.; Wang, J.K.; Wang, H.H.; Tang, G.H. Clear aligners for maxillary anterior en masse retraction: A 3D finite element study. Sci. Rep. 2020, 10, 1–8. [Google Scholar] [CrossRef]
- Rossini, G.; Schiaffino, M.; Parrini, S.; Sedran, A.; Deregibus, A.; Castroflorio, T. Upper Second Molar Distalization with Clear Aligners: A Finite Element Study. Appl. Sci. 2020, 10, 7739. [Google Scholar] [CrossRef]
- Gomez, J.P.; Peña, F.M.; Martínez, V.; Giraldo, D.C.; Cardona, C.I. Initial force systems during bodily tooth movement with plastic aligners and composite attachments: A three-dimensional finite element analysis. Angle Orthod. 2015, 85, 454–460. [Google Scholar] [CrossRef] [PubMed]
- Dasy, H.; Dasy, A.; Asatrian, G.; Rózsa, N.; Lee, H.-F.; Kwak, J.H. Effects of variable attachment shapes and aligner material on aligner retention. Angle Orthod. 2015, 85, 934–940. [Google Scholar] [CrossRef] [PubMed] [Green Version]
- Burstone, C.J.; Choy, K. The Biomechanical Foundation of Clinical Orthodontics; Quintessence Publishing Company, Inc.: Chicago, IL, USA, 2015. [Google Scholar]
- Krey, K.; Behyar, M.; Hartmann, M.; Corteville, F.; Ratzmann, A. Behaviour of monolayer and multilayer foils in the aligner thermoforming process. J. Aligner Orthod. 2019, 3, 139–145. [Google Scholar]
- Sandhya, V.; Arun, A.; Reddy, V.P.; Mahendra, S.; Chandrashekar, B. Biomechanical Effects of Torquing on Upper Central Incisor with Thermoplastic Aligner: A Comparative Three-Dimensional Finite Element Study with and Without Auxillaries. J. Indian Orthod. Soc. 2021, 1–8. [Google Scholar] [CrossRef]
- Wang, J.; Rousso, C.; Christensen, B.I.; Li, P.; Kau, C.H.; MacDougall, M.; Lamani, E. Ethnic differences in the root to crown ratios of the permanent dentition. Orthod. Craniofac. Res. 2019, 22, 99–104. [Google Scholar] [CrossRef] [PubMed]
- Papadimitriou, A.; Mousoulea, S.; Gkantidis, N.; Kloukos, D. Clinical effectiveness of Invisalign® orthodontic treatment: A systematic review. Prog. Orthod. 2018, 19, 37. [Google Scholar] [CrossRef] [PubMed] [Green Version]
- Grünheid, T.; Gaalaas, S.; Hamdan, H.; Larson, B.E. Effect of clear aligner therapy on the buccolingual inclination of mandibular canines and the intercanine distance. Angle Orthod. 2016, 86, 10–16. [Google Scholar] [CrossRef] [PubMed]
- Djeu, G.; Shelton, C.; Maganzini, A. Outcome assessment of Invisalign and traditional orthodontic treatment compared with the American Board of Orthodontics objective grading system. Am. J. Orthod. Dentofac. Orthop. 2005, 128, 292–298. [Google Scholar] [CrossRef] [PubMed]
- Li, J.; Wang, X. A fast 3D euclidean distance transformation. In Proceedings of the 2013 6th International Congress on Image and Signal Processing (CISP), Hangzhou, China, 16–18 December 2013; pp. 875–879. [Google Scholar]
- Koenig, N.L. Accuracy of Fit of Direct Printed Aligners versus Thermoformed Aligners. Master’s Thesis, Saint Louis University, Saint Louis, MO, USA, 2020. [Google Scholar]
Publisher’s Note: MDPI stays neutral with regard to jurisdictional claims in published maps and institutional affiliations. |
© 2021 by the authors. Licensee MDPI, Basel, Switzerland. This article is an open access article distributed under the terms and conditions of the Creative Commons Attribution (CC BY) license (https://creativecommons.org/licenses/by/4.0/).