Abstract
Due to the high strength-to-weight ratio of fibre reinforced polymers (FRPs), human-induced vibration problematic remains as a subject to be fully comprehended in order to extend the use of composites in Bridge Engineering. Thus, this paper studies an ultra-lightweight FRP footbridge, which presents excessive vertical vibrations when the fourth harmonic of a walking pedestrian is synchronised with the structure’s fundamental frequency. Focusing on the vertical bending mode, at 7.66 Hz, the bridge dynamic behaviour was assessed under the action of a single pedestrian crossing the facility at a step frequency of 1.9 Hz. As an over prediction of the footbridge response was computed using a moving force (MF) model available in a design guideline, a mass-spring-damper-actuator (MSDA) system was adopted to depict a walker. Hence, Human-Structure Interaction (HSI) phenomenon was considered. Employing the experimental results, parameters of the MSDA system were identified, leading to a HSI model that considers the first fourth harmonics of a walking human. Additionally, a parametric analysis was carried out, determining that the damping ratio of the human body and the load factor associated to the fourth harmonic are the most relevant parameters on the estimation of the response. The identified HSI model may be used as a first approximation to accurately predict the dynamic response of ultra-lightweight composite structures and should be extended to account for crowd-induced loads.
1. Introduction
The use of fibre reinforced polymers (FRPs) in aerospace, automotive and shipbuilding industry is well-established, so applications in spaceships, planes, cars and boats are widely known and common. In contrast, composites are still considered novel materials in construction industry although their inclusion in Bridge Engineering offers several benefits, such as low maintenance cost, electrical transparency, dead load reduction, corrosion resistance, and fast installation [1]. These materials have proved to lead to sustainable and environmentally-friendly bridge projects [2,3], so they may also contribute to the ‘Sustainable Cities and Communities’ goal, set as a priority by current society [4]. As a result, different types of laboratory [5,6] and in-service [7,8,9,10] footbridges, in which most of the structural elements were manufactured with FRPs, have been constructed and analysed around the world.
High strength-to-weight ratio is another major advantage of FRPs. In composite footbridges, however, this feature may lead to a structural design governed by Vibration Serviceability Limit State (VSLS) given the low modal masses associated to vibration modes prone to be excited by human loads [11]. Traditional design guidelines, such as SETRA [12] or HIVOSS [13], consider that structures with natural frequencies that lie below 1 Hz and above 5 Hz are unlikely to be excited in resonance by pedestrians (Figure 1). By preventing natural frequencies of a structure within this range, excessive vertical human-induced vibrations are assumed to be avoided and dynamic response analysis is not mandatory. This may not be applied to FRP footbridges as researchers have demonstrated that the dynamic behaviour of composite footbridges may be affected by higher and less energetic harmonics of pedestrian actions [5,14].
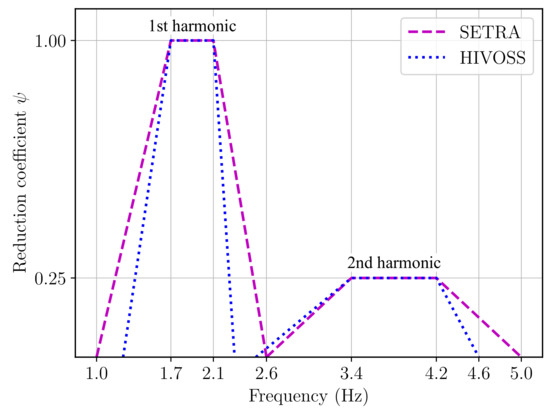
Figure 1.
Reduction coefficient for walking load models in the vertical direction.
Conventionally, moving force (MF) models have been employed in guidelines [12,13,15] to represent pedestrian activities and assess the vibration comfort on structures. Furthermore, harmonic moving load models have been incorporated for the first time into the new proposal for Eurocodes [16,17]. These non-interacting models are typically defined by a Fourier series, in which Dynamic Load Factors (DLFs) are used and the frequency of the acting force change depending on the human activity. MF models are based on the assumption that forces generated by humans are the same on a rigid surface and on a flexible surface. In contrast to pedestrian structures built with traditional materials, models derived from treadmills or force plates campaigns on stiff surfaces [18,19,20] may not be reliable when assessing the response of lightweight composite structures. For instance, the vibration response of a laboratory glass FRP (GFRP) facility was poorly estimated (overestimated) using MF models [21].
The previous models often lead to high unreal predictions of the response of lightweight pedestrian structures since human-structure interaction (HSI) is neglected [22]. Due to the lightness and low stiffness of composite materials, interaction phenomenon may be a key aspect on the dynamic behaviour of FRP footbridges since significant vibration amplitudes may be reached [23]. Moreover, accounting for HSI on composite pedestrian structures could be beneficial in the assessment of the structural performance at VSLS and the sizing of vibration control devices [24]. Therefore, an accurate estimation of human-induced vibrations is needed to avoid oversizing an FRP footbridge, which is directly related to the initial budget of a project. Since the first proposal from Archbold [25], several models [26,27] accounting for the dynamic parameters of the human body have been used to consider HSI on the dynamic response of footbridges. Under this approach, the mass, frequency, and damping ratio of the human body together with an external force are employed along with the properties of the structure, leading to a coupled human-structure vibrating system.
Among the different HSI models available in literature, a single degree of freedom (SDOF) mass-spring-damper-actuator (MSDA) system is the only one mentioned in a design guidance [28]. Besides the dynamic properties of the human body, this model, which has been used to represent bouncing action, considers an internal harmonic driving force that affects both the pedestrian and the structure. Hence, the ground reaction force transmitted to the structure is comprised by the actuator force and the stiffness and damping forces of the oscillator, depicted though the properties of the pedestrian. In contrast to MF models that use DLFs to describe a periodic action, the internal driving force employs Generated Load Factors (GLFs) [29].
This research presents an experimental and numerical study related to the dynamic behaviour of a laboratory FRP footbridge, whose linear mass is only 80 kg/m. The lightweight facility exhibits excessive vertical vibrations when the fourth harmonic of a walker is synchronised with the bridge’s fundamental frequency. As the first natural frequency of the structure lies above the limits stated in traditional guidelines, a MSDA system is employed herein to represent a pedestrian crossing the bridge and account for HSI. To the best of authors’ knowledge, the identified model is the first representation of a single pedestrian walking that considers four harmonics of the human action and interaction phenomenon. To this end, data recorded from experiments involving six test subjects crossing the footbridge is employed. Additionally, an optimization problem aiming to minimise the difference between experimental results and numerical outputs from a coupled human-structure system, based on a closed-loop transfer function (TF), is addressed.
After this introduction, the text is organised as follows. The simply supported FRP bridge is described in Section 2, whilst the performed experimental campaign is explained in Section 3. The calibration of a FE model of the structure together with the numerical bridge response under the action of a single pedestrian are presented in Section 4. The identified HSI model, based on a closed-loop TF, is also included in this section. Considering the presented model, a parametric analysis varying the dynamic properties of the human body and the GLFs of the internal driving force is carried out in Section 5. Finally, concluding remarks and future works are drawn in Section 6.
2. FRP Footbridge
In this section, the lightweight FRP footbridge, designed following a motion-based design approach [30], is briefly described. Following the design guidelines from Fiberline Composites A/S [31] and Ascione et al. [32], static requirements at Serviceability and Ultimate Limit State were fully met for the structure [33]. At VSLS, a significant response of the footbridge due to human dynamic loads is expected as the second part of the structural design, which corresponds to the design and installation of inertial controllers, is not discussed hereby.
Description
The laboratory facility is a simply supported structure, comprised of pultruded GFRP profiles and carbon FRP (CFRP) strips manufactured by Fiberline Composites A/S [31]. The footbridge is 10 m long and 1.5 m wide with a clear span (L) of 9.7 m. It is formed by a deck placed onto three stringers that are laterally restrained by crossbeams. The principal elements are three GFRP profiles, one I 300 × 150 × 15 and two U 300 × 90 × 15, separated 0.75 m transversally. To keep the lightweight nature of the footbridge and provide higher bending stiffness, CFRP strips (E 139/90/4.9 and E 139/150/4.9) are bonded to the top and bottom flanges of the three stringers along their entire length by means of a two-component epoxy adhesive. Figure 2 presents the cross-section of the structure.
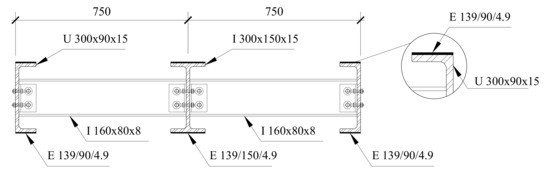
Figure 2.
Cross-section of the FRP footbridge (all dimensions in millimetres).
GFRP I 160 × 80 × 8 elements spaced 1.25 m from the pinned and roller supports and every 1.20 m along the rest of the bridge length act as lateral restraints. Plank HD panels, coated with anti-skid surface, comprise the bridge deck, and their pultrusion direction is aligned transversally to the traffic direction. Stainless steel cables crossing GFRP SHS 60 × 60 × 5 profiles compound the handrails. The square hollow sections are connected to the side of each U profile every intersection between the stringers and the crossbeams. Geometrical properties of the cross-sections of the aforementioned FRP elements are presented in Appendix A.
At the bridge ends, concrete blocks of 1.5 m × 0.3 m × 0.3 m are placed to prevent possible web crippling failure of the stringers [34] and ease the installation of the pinned and roller supports (see Figure 3a). To assemble the structure, GFRP L 75 × 75 × 8 profiles and stainless steel bolts class A2-50 are used. Panel-to-panel and deck-to-stringer connections are achieved using M10x30 bolts and 8 mm-diameter clamps, respectively. The cross-beams and stringers are joined together by M10x45 and M10x55 bolts. Finally, the handrail poles are connected to U profiles using M10x110 bolts. Figure 3a shows the constructed structure.
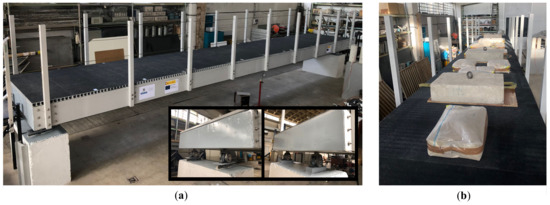
Figure 3.
FRP footbridge: (a) Simply supported structure. (b) Static test.
3. Experimental Campaign
This section presents the different experiments and analyses performed to characterize the structural behavior of the composite pedestrian structure.
3.1. Static Test
For a better calibration of the numerical model of the FRP footbridge (Section 4.3), the static response of the structure was initially assessed employing twenty sandbags, which total weight was 300 kg (15 kg each) and four concrete blocks, which total weight was 760 kg (190 kg each). These elements were uniformly distributed over the bridge deck, as shown in Figure 3b, to obtain a static load of 0.70 kN/m. The deflection measured at mid-span with a dial comparator was 12.8 mm.
3.2. Operational Modal Analysis
The vibration modes of the structure were identified by performing an operational modal analysis (OMA). Data recorded with 18 high sensitivity accelerometers placed vertically on the bridge deck was employed for the analysis. Figure 4a,b shows the location of the accelerometers (model PCB B12) and a picture of one of them. For the test, the sampling frequency was 5120 Hz, and the duration was 10 min. The first three vibration modes of the footbridge were identified using the data-driven Stochastic Subspace Identification (SSI-data) method, as programmed in MACEC [35] software. A low-pass filter with a cut-off frequency at 80 Hz was used, and a factor of 64 was applied to decimate the raw data.
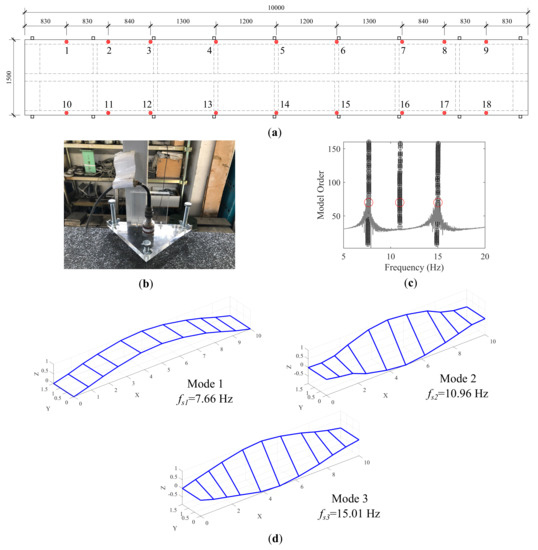
Figure 4.
OMA: (a) Location of eighteen accelerometers. (b) Picture of accelerometer No. 5. (c) Stabilization diagram. (d) First three vibration modes of the structure.
Figure 4c displays the stabilization diagram of the test with a maximum model order of 160 and the power spectral density of all the signals superimposed. An upper limit of was considered given no human-induced loads are prone to excite vibration modes above this value. The identified vibration modes of the structure are depicted in Figure 4d, and the corresponding natural frequencies () and damping ratios () are presented in Table 1. Mode 1 corresponds to the first vertical bending mode, whereas Modes 2 and 3 are lateral-torsional modes. The second and third modes seem to be similar since the accelerometers were vertically placed. However, the former is mainly controlled by the lateral movement of the stringers, whilst the latter involves an action of the stringer-deck system. This difference can be seen in the results obtained from the modal analysis using the FE model of the footbridge (see Section 4.1).

Table 1.
Experimental first three vibration modes of the FRP footbridge.
Also, a free response test was carried out to characterize accurately the damping ratio associated to the fundamental vibration mode of the structure (). A hammer was employed to excite impulsively the structure at mid-span. After conducting ten impacts, the logarithmic decrement of the recorded and filtered data was computed, and a mean value of 1.55% was obtained, which was quite similar to the one obtained through the OMA.
3.3. Tests with a Walking Pedestrian
The dynamic behaviour of the footbridge was assessed under the action of a single pedestrian walking at a step frequency of 1.9 Hz. Six test subjects, which mass is presented in Table 2, were asked to cross the bridge 3 times, walking along the center lane. Figure 5a shows the third trial of the Test Subject 2. An accelerometer attached to the bottom of the central stringer was employed to collect the footbridge response at midspan, as displayed in Figure 5b. The step frequency was controlled using a metronome and chosen aiming to synchronise the fourth harmonic of the human action with the fundamental frequency of the structure. Additionally, the human velocity in each trial was measured, obtaining a mean value of m/s.
Table 2.
Mass of the tests subjects.
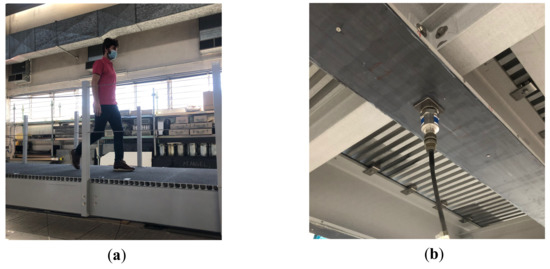
Figure 5.
Experiment setup: (a) Third trial of Test Subject 2 crossing the bridge. (b) Accelerometer attached at the midspan of the central stringer.
The eighteen recorded signals (three per person) were processed using a band pass filter with an upper and lower cut-off frequencies at 1 Hz and 10 Hz, respectively. Figure 6a,b shows the acceleration response in the time and frequency domain when the Test Subject 2 crossed the bridge once. Also, the 1s running root-mean square (RMS) acceleration is included in the graph together with the peak response and the maximum transient vibration value (MTVV). Both results exceeded 0.50 m/s, which is the acceleration limit for a maximum degree of comfort stated in HIVOSS guideline [13] and Eurocode 0 [16]. Clearly, the analysed footbridge shows a significant response due to the fourth harmonic of the dynamic pedestrian action.
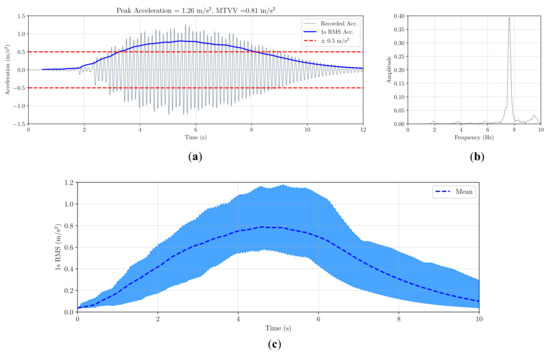
Figure 6.
Experimental results for a single pedestrian walking at 1.9 Hz: (a) Acceleration reponse at midspan when the Test Subject 2 crossed the bridge. (b) Response in the frequency domain. (c) Mean 1s RMS acceleration and its dispersion considering 18 records.
From the experiments carried out by the six pedestrians, the mean 1s RMS was computed using the sets of collected data. The outcome is displayed in Figure 6c, in which the colored band represents the dispersion of the results obtained from the eighteen records. The width of this band corresponds to the minimum and maximum values.
4. Numerical Study
In this section, the FE model of the structure and its numerical calibration are presented. Additionally, the dynamic response of the FRP structure is computed by using non-interacting and interacting load models that represent a single pedestrian walking.
4.1. Finite Element Model
A linear elastic FE model of the structure, displayed in Figure 7a, was developed in Abaqus [36] based on the information presented in Section 2. Stringers, cross-beams, handrail poles, and deck panels were modeled with node reduced integration shell elements (S4R). Whereas solid elements C3D8R were used to model the concrete blocks at both ends of the footbridge. Also, top and bottom flanges of the stringers were defined as shell composite layups composed of two plies. One layer corresponds to the GFRP laminate, and the other one refers to the CFRP strip.
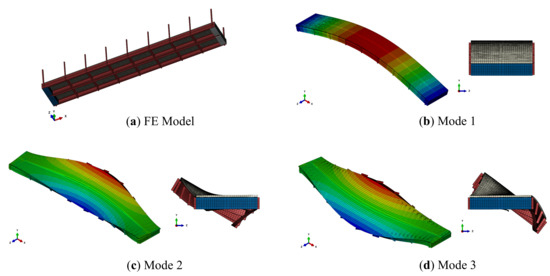
Figure 7.
Numerical model of the FRP footbridge: (a) Bottom view. (b) First vibration mode. (c) Second vibration mode. (d) Third vibration mode.
Stringers, cross-beams, and handrail poles were joined together using the tie constraint option. The connections between the stringers’ top flange and the bottom part of the deck were defined employing connector elements type CONN3D2, every 25 mm along the stringers’ length. Additionally, the stringers were connected to the concrete blocks by using the embedded element technique, so the solid elements were hosts for the shell elements. The size of the mesh for the different elements was 30 mm by 30 mm.
To represent a simply supported structure, displacements of two areas of 0.20 m by 0.15 m at the bottom of one concrete block were constrained in the longitudinal, vertical and transversal (x, y and z) direction. Whilst vertical (y) and transversal (z) displacements of two similar areas at the bottom of the other block were constrained. Finally, an additional uniformly distributed non-structural mass of 2.0 kg/m over the bridge deck was assumed to account for the L profiles, washers, nuts and bolts omitted in the model. Mechanical properties of the FRP profiles and the other materials employed to develop the numerical model are presented in Table 3.
Table 3.
Characterization of properties for the numerical model of the footbridge.
4.2. Modal Analysis
Employing the described model, the first three numerical vibration modes of the structure were obtained by carrying out a modal analysis. Figure 7b–d displays the obtained results. As described in Section 3.2, Mode 1 is the vertical bending vibration mode, Mode 2 corresponds to a low torsional-high lateral mode, and Mode 3 is a high torsional-low lateral mode. The values of are given in Table 4, where it is noticed that the relative difference between the experimental and numerical natural frequencies is quite high for the second vibration mode. To reduce the discrepancies between the results, the FE model was calibrated as explained in Section 4.3.
Table 4.
Results of the modal analysis before and after updating.
4.3. FE Model Updating
As results from a FE model depend on the material properties (e.g., elastic modulus, mass density, Poisson’s ratio, etc.), physical dimensions and boundary conditions, an adequate and careful selection of the required values is needed to obtain an accurate prediction of the real response of a structure. Thus, the following sections described the numerical calibration of the previously described FE model. The updating procedure was focused on the material properties of the elements that compound the structure.
4.3.1. Selection of Parameters
To select the parameters of the FE model to be updated, a global sensitivity analysis was carried out considering the statistical properties shown in Table 3. A two-parameter Weibull distribution was assumed to characterize the properties of composite elements, as suggested by Zureick et al. [37], whereas the statistical distributions for the remain parameters were based on Ref. [38]. All the distributions were assumed to be mutually independent. The analysis aimed to identify the most relevant material properties on the numerical response of the composite footbridge, particularly the natural frequencies, the values (defined later in Equation (4)) and the sag at midspan due to a static load.
A stochastic sampling strategy was used to perform the analysis, so the Latin Hypercube Method was employed to generate 1000 multivariate stochastic samples of the mechanical properties. Using the properties of the elements shown in Table 3, different samples for the GFRP mass density (), GFRP stringers (), GFRP crossbeams (), GFRP deck (), CFRP mass density (), CFRP strips (), concrete blocks (), steel connectors (), and non-structural mass () were generated. Figure 8 shows the results through the Spearman correlation coefficient matrix, in which values between are excluded for a better visualization. From this matrix, , , , , , , and were identified as influential properties on the structural behaviour of the FRP footbridge. Therefore, the seven parameters were selected as variables to be calibrated.
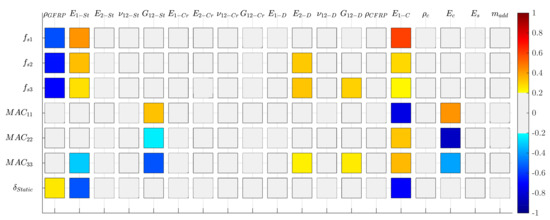
Figure 8.
Spearman correlation matrix between the parameters of the FE model and the responses of the FRP footbridge.
4.3.2. Calibration
Among the several approaches available to update a FE model [39], an iterative method was used hereby considering an objective function that quantifies the difference between the experimental and numerical results. The FE model updating procedure using a single-objective approach may be formulated as follows
being the parameters to be updated, and the corresponding lower and upper limits, and w the weights of the objective function , which is defined as follows
The residuals , and associated to natural frequencies, mode shapes and static displacements, respectively, are defined by the following expressions
where is the number of considered vibration modes of the structure and is the number of measured static displacements. Subscripts num and exp indicate numerical and experimental values, respectively. The parameter gives the orthogonality between two vibration modes and is defined as
To solve the optimization problem, the Genetic Algorithm (GA) was applied in this study involving the use of two software: Abaqus [36] and Matlab [40]. Considering the seven experimental results (Table 1 and the static sag) and the seven parameters selected previously, the following values were adopted for the updating process of the FE model of the FRP footbridge: , , , , and . In addition, the search domain for the parameters is presented in Table 3, and the following factors were considered for the GA: initial population of 20 individuals, fitness limit of 10, and maximum number of generations of 100.
Four updating runs (GA1–GA4) were carried out with different initial population, and values obtained from the updating run GA2 were adopted as solution for the posterior dynamic analyses of the composite structure. This result was selected considering that the updated values showed the least dispersion from the corresponding initial values. The calibrated natural frequencies are presented in Table 4. A clear reduction of the relative error is achieved while the MAC values remain in good agreement. Also, Table 5 reflects the good compromise between the numerical and experimental displacement at mid-span. In this case, the relative error is below 1%. Finally, Table 6 presents the material properties before and after the calibration procedure.
Table 5.
Results of the static analysis before and after updating.
Table 6.
Parameters of the FRP footbridge before and after updating.
4.4. Moving Force Models
Several non-interacting MF models have been proposed over the years to represent the vertical walking action of a single pedestrian [12,15,17]. This human load may be modelled as a periodical function defined by a Fourier series, which typical expression (disregarding the static load term) in the time domain is as follows
with , 2, …, where is the total number of harmonics considered, r is the harmonic number, is the static weight of a person usually taken as 700 N, DLF is the dynamic loading factor associated to the rth harmonic, is the frequency component of the repetitive loading, and is the phase or lag angle of the rth harmonic. From the second harmonic onwards, can be taken equal to as a conservative approach [15].
Even though traditional guidelines and codes imply that footbridges with fundamental vertical frequencies above to 5 Hz are unlikely to be excited by higher harmonics of a human activity (Figure 1), significant vertical vibrations were seen when the fourth harmonic of a single pedestrian walking was synchronised with the fundamental frequency of the lightweight FRP facility studied hereby (Figure 6c). The only guideline that accounts for MF models with four harmonics to describe a walker is ISO-10137 [15]. Thus, the numerical response of the FRP structure was calculated applying its recommendations even though ISO-10137 [15] sets design guidance against building floor vibrations. Table 7 presents the values of DLF for a step frequency () of 1.9 Hz accounting for four harmonics ().
Table 7.
Vertical MF model of a single pedestrian walking according to ISO-10137 [15].
Considering the updated FE model and the MF from ISO-10137 [15] travelling at 1.3 m/s, the numerical response of the footbridge was obtained through the FE Method using Abaqus [36]. Hence, the governing equations of the linear system with viscous damping is expressed as follows
where , and are the mass, damping and stiffness matrices of the structure, is the harmonic force vector, is the vector of generalized coordinates that contains all the degrees of freedom of the model, and and are the first and second time derivatives of the displacement vector, respectively. The force moving across the structure is proportionally applied on the nodes depending on the speed and the mesh size.
To solve the system of differential equations shown in Equation (6), a transient modal dynamic analysis was selected, considering only the vertical bending vibration mode. Also, a constant time step of 0.001 s and a damping ratio of 1.55% were adopted. In Figure 9, a comparison between the experimental and numerical 1s RMS acceleration of the footbridge at midspan is displayed. Similarly to results obtained in other lively pedestrian structures [21,41], an overestimation of the real response was achieved using the non-interacting MF model. The root-mean-square error (RMSE) between the results was 70.6%. Hence, the inclusion of the dynamic properties of the human body was essential to an accurate assessment of the dynamic behaviour of this lightweight structure. Next section tackles this issue accounting for the interaction phenomenon between the structure and the pedestrian.
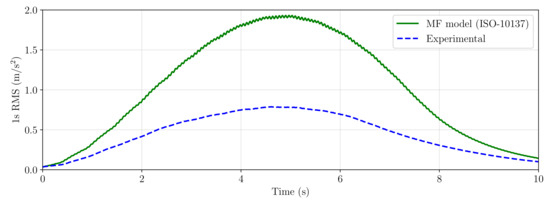
Figure 9.
Comparison of 1s RMS acceleration using a non-interacting MF model.
4.5. Human-Structure Interaction Model
Based on Dougill et al. [29], a SDOF MSDA system was adopted to address the interaction phenomenon when a person crosses the footbridge. Therefore, the HSI model was comprised of a simply supported beam and the human walking. A schematic representation of the model is shown in Figure 10a considering that the pedestrian is located at midspan. Additionally, Figure 10b displays the corresponding block diagram.
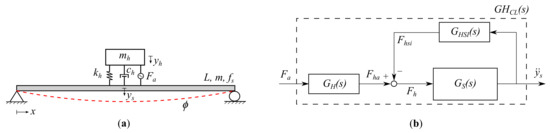
Figure 10.
HSI model: (a) Schematic representation. (b) Block diagram.
From the graph, the closed-loop TF of the coupled human-structure system in the Laplace domain can be derived as follows
where is the Laplace variable, is the circular frequency in rad/s, is the TF of the structural system, is the TF between the actuator force (human driving force) and the contact force of the human with the structure, and is the TF related to the interaction phenomenon.
Generally, the TF between the structure acceleration at midspan and a force applied at a point x, considering only the fundamental vibration mode, is defined as follows
being the circular natural frequency of the 1st vibration mode of the structure in rad/s, the Laplace transform of the applied force acting on the structure, and the Laplace transform of the structural acceleration at midspan, where denotes the Laplace transform of the structural vertical displacement. Additionally, is the mode shape of a simply supported beam that considers the variation of the pedestrian position x, so the following expression is employed
For the model of the person, mass , natural frequency and damping ratio of the human body are considered. Also, the human driving force () is accounted for via a pair of action-reaction forces acting simultaneously on both the footbridge and the pedestrian at a location x. Thus, the ground reaction force is equal to the sum of the actuator force and the forces caused by the spring and damper of the human system. The TF between , which is the force generated by the humans without including the force transmitted to them due to the structure movement, and the human driving force is presented below
where is the circular frequency of the body in rad/s, and is the associated damping ratio of the human. , which is the input force to the model, can be defined as follows
where the values of are not the standard as affects both, the human body and the structure. The TF between the human interacting force () applied at location x, which is the force transmitted due to the structure movement, and the structure acceleration at midspan is defined by the following expression
Further explanation about the presented TFs can be found in Díaz et al. [24].
4.6. Identification of the HSI Model
Based on the experimental 1s RMS acceleration, presented in Section 3.3, the dynamic parameters of the human body and the GLFs coefficients for the first four harmonics of a walking pedestrian are identified herein. Again, an optimization problem was formulated employing a single-objective approach, so the employed expression is as follows
being the RMSE between the experimental and numerical 1s running RMS, the parameters to be obtained, and and the lower and upper limits, respectively.
For the identification, the model of the structure was assumed to present an equivalent modal mass () of 405 kg and a natural frequency () of 7.63 Hz, based on the results from the calibrated FE model (Section 4.3). Also, 1.55% was considered as damping ratio of the structure (), considering the experimental result from Section 3.2. The velocity of the MSDA system, which represents the pedestrian, was set equal to (Section 3.3). The lower and upper limits for the properties of the human body were based on the mean mass value obtained among the test subjects shown in Table 2 (70.8 kg) and values reported in literature [26]. Thus, the search domain for the seven parameters to be determined were:
- Human body: kg, Hz, and .
- Load factors: , , and .
The GA, available in MATLAB [40], was used to solve the optimization problem. An initial population size of 20, a fitness limit of 10, and a maximum number of generations of 100 were considered. Taking advantage of the simple HSI model based on the closed-loop TF , one hundred runs were performed (GA1–GA100). From the results, 25 solutions were disregarded as valid outcomes given the achieved value of the objective function was greater than 5%. Figure 11 displays the RMSE obtained in each run. Accounting for the remaining 75 outcomes, a single solution was calculated by averaging the values of the obtained parameters. Hence, the SDOF MSDA system was defined using the following information: kg, Hz, %, , , , and .
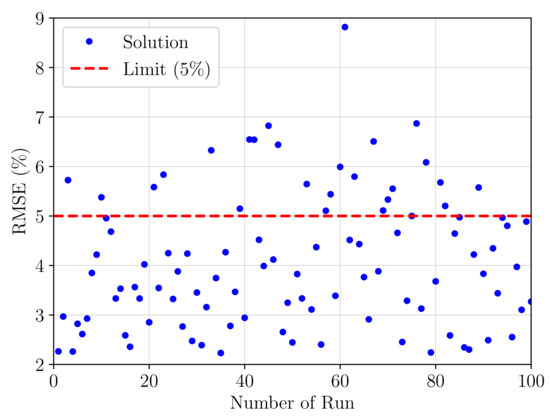
Figure 11.
Achieved RMSE.
Figure 12 displays the experimental outcomes and the numerical outputs obtained from the identified HSI model (). The RMSE between both curves was 3.4%. In comparison with the results calculated using the MF model (Figure 9), the prediction of the real response of the footbridge was clearly improved after adopting the SDOF MSDA system to represent a walking pedestrian.
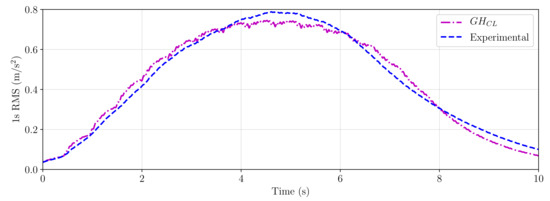
Figure 12.
Comparison of 1s RMS acceleration employing the identified HSI model.
5. Discussion
In this section, results from the identified HSI model, which employs a MSDA system, are compared with the outcomes from a HSI model that considers a mass-spring-damper (MSD) system together with an external harmonic force. Additionally, experimental and numerical MTVVs obtained with a pedestrian crossing the bridge at different step frequencies are presented, and a parametric analysis varying the parameters of the obtained MSDA system is carried out.
5.1. Comparison of HSI Models
Conventionally, interaction phenomenon between a walker and a structure has been considered by employing a moving MSD system plus an external harmonic force [22,27,42]. In this HSI model, the MSD system is described by the dynamic properties of the human body, and the periodic force is defined similarly to the actuator force (Equation (11)). However, different coefficients, which from now on will be called vertical dynamic load factors (VDLFs), are used to define the force that only acts on the structure. Knowing the values of GLFs for the different harmonics and the TF of the human body, (Equation (10)), VDLFs coefficients can be computed from the following expression
Considering the properties of the human body and the GLFs identified in Section 4.5, parameters of the model were derived. Thus, the MSD system and the harmonic force were described using the next information: kg, Hz, %, , , , and . Furthermore, the phase lag due to was considered to define the moving external force.
Employing a modified version of Caldintav [43] software, the dynamic analysis of the FRP footbridge considering this HSI model (MSD system + external force) was addressed. Figure 13 shows the results employing both approaches. The peak acceleration calculated at mid-span using the mentioned software was 1.33 m/s, whereas the maximum response using the closed-loop TF () was 1.30 m/s. As shown in the graph, similar results were obtained by employing the model that accounts for a MSDA system and the model that considers a MSD system with an external force.
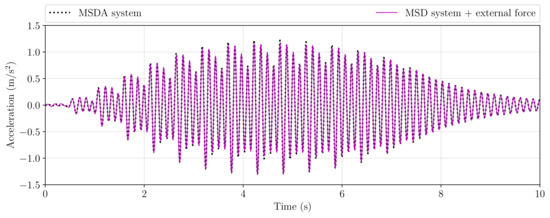
Figure 13.
Comparison of the numerical acceleration response at midspan of the FRP footbdige using two HSI models.
5.2. Variation of the Step Frequency
An assessment of the identified HSI model is presented hereby considering a single pedestrian crossing the footbridge at three different step frequencies: 1.8 Hz, 1.9 Hz, and 2.0 Hz. Test subject 1, whose mass is 71.8 kg (Table 2), walked over the structure at the mentioned step frequencies, and a new test subject (No. 7) with a mass of 73.4 kg was asked to cross the FRP bridge three times. For both pedestrians, the step frequency in each test was controlled with a metronome, and the measured mean speeds during the experiments were m/s, m/s, and m/s, respectively.
From the recorded acceleration response at midspan of the footbridge, experimental MTVVs were obtained. Whilst the numerical values were obtained using the the mass of each test subject and the parameters of the identified MSDA system. Results accounting for both pedestrians are displayed in Figure 14. When the fourth harmonic of the walking human ( Hz) was synchronized with the structure’s fundamental frequency, the highest structural response was obtained. For the tests with both humans, experimental and numerical results show a good agreement, obtaining a relative error between the MTVVs less than 5%.
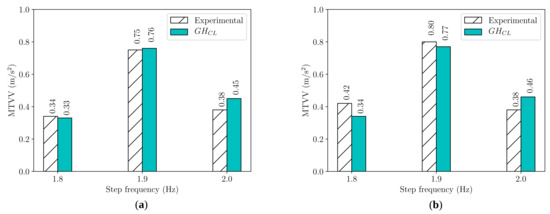
Figure 14.
Step frequency variation: (a) Test subject 1 ( kg). (b) Test subject 7 ( kg).
At step frequencies of 1.8 Hz and 2.0 Hz, results from the experiment with the person of 73.4 kg present more differences than the outcomes obtained with the test subject 1. However, these cases are not the worst in terms of the dynamic behaviour of the footbridge as the MTVVs were less than 0.5 m/s. For (near-) resonant structural response of the FRP footbridge, which is the worst case scenario, the identified HSI model led to an accurate estimation of the vertical vibrations due to the action a single pedestrian.
5.3. Parametric Analysis
Employing the closed-loop TF (Equation (7)) and the SDOF MSDA system obtained in Section 4.5, a parametric analysis varying the dynamic properties of the human body and the computed GLFs was carried. The influence of every parameter on the numerical dynamic response of the FRP footbridge was investigated by considering 1000 stochastic samples generated from the following normal and uniform distributions, respectively:
- : kg
- : Hz
- :
- :
- :
- :
- :
Figure 15 presents the results, in terms of 1s RMS, for the properties associated to the human body. The coloured band shown in the graphs represents the dispersion of the results obtained from the 1000 models generated for each parameters, and the width of this band corresponds to minimum and maximum values. It can be see that the most influential property on the numerical response is the damping ratio of the body, whereas the frequency was the property leading to the least impact.
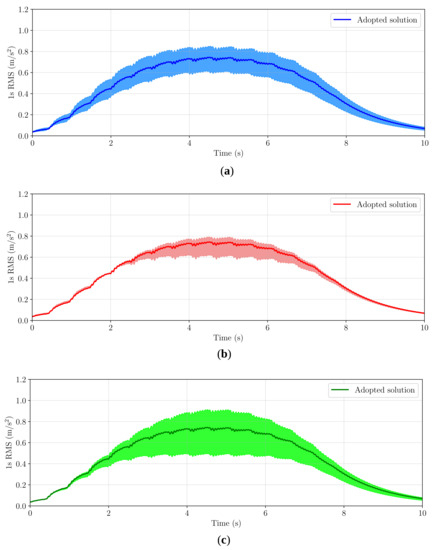
Figure 15.
Parametric analysis varying the properties of the human body: (a) Mass. (b) Frequency. (c) Damping ratio.
The variation of the dynamic response of the FRP footbridge due to the load factors of the human driving force () is displayed in Figure 16. The coloured band in the graphs corresponds to minimum and maximum values again, although it is negligible for the first three harmonic factors. This means that their variation does not affect significantly the human-structure coupled vibrating system. As expected, changes in the GLF led to appreciable variation of the results. The impact of this parameter affects greatly the system, even more than the properties of the human body.
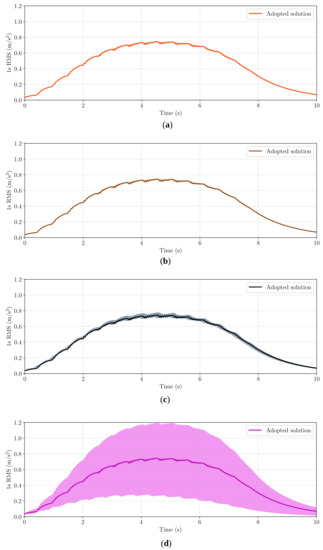
Figure 16.
Parametric analysis varying the GLFs: (a) First harmonic, (b) Second harmonic. (c) Third harmonic. (d) Fourth harmonic.
Silva et al. [42] recently discussed that regardless the adopted properties to describe the dynamic model of a pedestrian, HSI models usually lead to a good assessment of the dynamic behaviour of a lightweight footbridge. Therefore, the identified model that considers four harmonics of the human action and accounts for interaction phenomenon could be used to predict the response of other lightweight pedestrian structures affected by higher harmonics of a single human walking.
6. Conclusions
An ultra-lightweight FRP footbridge, whose linear mass is only 80 kg/m, has been been considered as benchmark structure to identify a HSI model, in which a walker is described via a MSDA system. Parameters of this model have been derived from an optimization problem which minimised the difference between experimental results and numerical outputs from a closed-loop TF of the coupled human-structure system.
As the simply supported structure exhibited significant vertical vibrations due to a single pedestrian, who walked over the bridge synchronising the fourth harmonic of the action with the bridge’s fundamental frequency, the proposed HSI model considers load factors of the first four harmonics of the human activity (walking). Furthermore, to determine the influence of the HSI model on the dynamic response of the FRP footbridge, a parametric analysis varying the parameters of the MSDA system has been performed. The results, which agree with previous observations, showed that the damping ratio of the body is a relevant parameter, as well as the load factor associated to the harmonic synchronised with the natural frequency of the structure.
The identified MSDA system may be used as a first approach to predict properly the dynamic response of other lightweight composite pedestrian structures affected by higher harmonics of human-induced loads. In the future, the proposed model will be extended to predict the structural response under crowd-induced loads. Also, its results will be used as a benchmark to develop simplified methods to account for interaction phenomenon avoiding the use of biodynamic models of the human body.
Author Contributions
Conceptualization, C.G.-C. and I.M.D.; methodology, C.G.-C., J.N.-P. and I.M.D.; software, C.G.-C. and J.N.-P.; validation, C.G.-C. and J.N.-P.; formal analysis, C.G.-C., I.M.D. and J.M.G.; investigation, C.G.-C. and J.N.-P.; resources, I.M.D. and J.M.G.; data curation, C.G.-C. and J.N.-P.; writing—Original draft preparation, C.G.-C. and J.N.-P.; writing—Review and editing, I.M.D. and J.M.G.; visualization, C.G.-C.; supervision, I.M.D. and J.M.G.; project administration, I.M.D. and J.M.G.; funding acquisition, I.M.D. and J.M.G. All authors have read and agreed to the published version of the manuscript.
Funding
This research was funded by the Ministry of Science, Innovation and Universities of Spain through the project “Structural efficiency enhancement for bridges subjected to dynamic loading: integrated smart dampers (SEED-SD)”, RTI2018-099639-B-I00.
Institutional Review Board Statement
The study was conducted according to the guidelines of the Declaration of Helsinki and following the normative of the Ethics Committee of Universidad Politécnica de Madrid.
Informed Consent Statement
Informed consent was obtained from all subjects involved in the study.
Data Availability Statement
The data presented in this study are available on request from the corresponding author.
Acknowledgments
Christian Gallegos-Calderón expresses his gratitude to the Secretariat of Higher Education, Science, Technology and Innovation of Ecuador (SENESCYT) for the PhD scholarship CZ02-000167-2018.
Conflicts of Interest
The authors declare no conflict of interest.
Appendix A
Based on Fiberline Composites A/S [31], the cross-section geometrical properties of the employed FRP elements are listed next:
- I 300 × 150 × 15: mm, mm, mm, mm, mm, mm, × mm, and × mm.
- U 300 × 90 × 15: mm, mm, mm, mm, mm, mm, × mm, and × mm.
- I 160 × 80 × 8: mm, mm, mm, mm, mm, mm, × mm, and × mm.
- SHS 60 × 60 × 5: mm, mm, mm, and × mm.
- Plank HD: mm, and kg/m.
- CFRP strips: mm. The widths of the strips are 150 mm and 90 mm, depending on the width of the flanges of the stringers.
where h is the depth of the profile, is the flange width, is the web thickness, is the flange thickness, A is the area of the cross-section, is the cross-section area for shear, and are the moments of inertia respect to the major and minor axis, w is the weight of a panel per square meter, and is the thickness of the strip.
References
- Ali, H.T.; Akrami, R.; Fotouhi, S.; Bodaghi, M.; Saeedifar, M.; Yusuf, M.; Fotouhi, M. Fiber reinforced polymer composites in bridge industry. Structures 2021, 30, 774–785. [Google Scholar] [CrossRef]
- Daniel, R.A. A Composite Bridge is Favoured by Quantifying Ecological Impact. Struct. Eng. Int. 2010, 20, 385–391. [Google Scholar] [CrossRef]
- Mara, V.; Haghani, R.; Harryson, P. Bridge decks of fibre reinforced polymer (FRP): A sustainable solution. Constr. Build. Mater. 2014, 50, 190–199. [Google Scholar] [CrossRef] [Green Version]
- General Assembly. Transforming Our World: The 2030 Agenda for Sustainbale Development; Technical Report; United Nations: New York, NY, USA, 2015. [Google Scholar]
- Ahmadi, E.; Caprani, C.; Živanović, S.; Heidarpour, A. Vertical ground reaction forces on rigid and vibrating surfaces for vibration serviceability assessment of structures. Eng. Struct. 2018, 172, 723–738. [Google Scholar] [CrossRef]
- Russell, J.M.; Mottram, J.T.; Zivanovic, S.; Wei, X. Design and performance of a bespoke lively ALL-FRP footbridge. In Dynamics of Civil Structures; Springer New York LLC: Orlando, FL, USA, 2019; pp. 125–128. [Google Scholar] [CrossRef]
- Sobrino, J.A.; Pulido, M.D.G. Towards advanced composite material footbridges. Struct. Eng. Int. 2002, 12, 84–86. [Google Scholar] [CrossRef]
- Potyrala, P.B. Use of Fibre Reinforced Polymer Composites in Bridge Construction. State of the Art in Hybrid and All-Composite Structures. Master’s Thesis, Technical University of Catalonia, Barcelona, Spain, 2011. [Google Scholar]
- Drygala, I.J.; Polak, M.A.; Dulinska, J.M. Vibration serviceability assessment of GFRP pedestrian bridges. Eng. Struct. 2019, 184, 176–185. [Google Scholar] [CrossRef]
- Wei, X.; Russell, J.; Živanović, S.; Toby Mottram, J. Measured dynamic properties for FRP footbridges and their critical comparison against structures made of conventional construction materials. Compos. Struct. 2019, 223, 110956. [Google Scholar] [CrossRef]
- Živanović, S.; Feltrin, G.; Mottram, J.T.; Brownjohn, J.M. Vibration performance of bridges made of fibre reinforced polymer. In Dynamics of Civil Structures; Springer: Cham, Switzerland, 2014; Volume 4, pp. 155–162. [Google Scholar] [CrossRef]
- Boniface, V.; Bui, V.; Bressolette, P.; Charles, P.; Cespedes, X. Footbridges: Assessment of Vibrational Behaviour of Footbridges under Pedestrian Loading; Service d’Études Techniques des Routes et Autoroutes: Paris, France, 2006; p. 127. [Google Scholar] [CrossRef]
- Butz, C.; Heinemeyer, C.; Keil, A.; Schlaich, M.; Goldack, A.; Trometer, S.; Lukić, M.; Chabrolin, B.; Lemaire, A.; Martin, P.O.; et al. HIVOSS: Design of Footbridges Guideline; Research Fund for Coal and Steel: 2008. Available online: https://ec.europa.eu/info/research-and-innovation_en (accessed on 20 July 2021).
- Russell, J.; Wei, X.; Živanović, S.; Kruger, C. Vibration serviceability of a GFRP railway crossing due to pedestrians and train excitation. Eng. Struct. 2020, 219, 110756. [Google Scholar] [CrossRef]
- ISO. ISO 10137-Bases for Design of Structures-Serviceability of Buildings and Walkways against Vibrations; International Organization for Standardization: Geneva, Switzerland, 2012; Volume 10137, p. 50. [Google Scholar]
- CEN. prEN 1990 Eurocode—Basis of Structural Design, Annex A2/Annex H Verifications Concerning Vibration of Footbridges due to Pedestrian Traffic; European Committee for Standardisation: Brussels, Belgium, 2021. [Google Scholar]
- CEN. prEN 1991-2 Eurocode 1—Actions on structures—Part 2: Traffic Loads on Bridges and Other Civil Engineering Works; Annex G Dynamic Load Models for Footbridges; Final draft for enquiry; European Committee for Standardisation: Brussels, Belgium, 2021. [Google Scholar]
- Brownjohn, J.M.; Pavic, A.; Omenzetter, P. A spectral density approach for modelling continuous vertical forces on pedestrian structures due to walking. Can. J. Civ. Eng. 2004, 31, 65–77. [Google Scholar] [CrossRef] [Green Version]
- Parkhouse, J.G.; Ewins, D.J. Crowd-induced rhythmic loading. In Proceedings of the Institution of Civil Engineers-Structures and Buildings; 2006; Volume 159, pp. 247–259. [Google Scholar]
- Pańtak, M. Ground Reaction Forces Generated by Runners—Harmonic Analyses and Modelling. Appl. Sci. 2020, 10, 1575. [Google Scholar] [CrossRef] [Green Version]
- Ahmadi, E.; Caprani, C.; Živanović, S.; Heidarpour, A. Assessment of human-structure interaction on a lively lightweight GFRP footbridge. Eng. Struct. 2019, 199, 109687. [Google Scholar] [CrossRef]
- Jiménez-Alonso, J.F.; Sáez, A. A direct pedestrian-structure interaction model to characterize the human induced vibrations on slender footbridges. Inf. Constr. 2014, 66, 1–9. [Google Scholar] [CrossRef] [Green Version]
- Renedo, C.M.; Díaz, I.M.; Russell, J.M.; Živanovic, S. Performance of inertial mass controllers for ultra-lightweight footbridges: A case study. In Proceedings of the XI International Conference on Structural Dynamic, Athens, Greece, 23–26 November 2020; Volume 1, pp. 1741–1746. [Google Scholar] [CrossRef]
- Díaz, I.M.; Gallegos, C.A.; Ramírez Senent, J.; Renedo, C.M.C. Interaction Phenomena to Be Accounted for Human-Induced Vibration Control of Lightweight Structures. Front. Built Environ. 2021, 7, 49. [Google Scholar] [CrossRef]
- Archbold, P. Interactive Load Models for Pedestrian Footbridges. Ph.D. Thesis, University College of Dublin, Dublin, Ireland, 2004. [Google Scholar]
- Shahabpoor, E.; Pavic, A.; Racic, V. Interaction between Walking Humans and Structures in Vertical Direction: A Literature Review. Shock Vib. 2016, 2016, 1–22. [Google Scholar] [CrossRef] [Green Version]
- Hawryszków, P.; Pimentel, R.; Silva, R.; Silva, F. Vertical Vibrations of Footbridges Due to Group Loading: Effect of Pedestrian—Structure Interaction. Appl. Sci. 2021, 11, 1355. [Google Scholar] [CrossRef]
- Institution of Structural Engineers. Dynamic Performance Requirements for Permanent Grandstands Subject to Crowd Action: Recommendations for Management, Design and Assessment; Institution of Structural Engineers: London, UK, 2008. [Google Scholar]
- Dougill, J.W.; Wright, J.R.; Parkhouse, J.G.; Harrison, R.E. Human structure interaction during rhythmic bobbing. Struct. Eng. 2006, 84, 32–39. [Google Scholar]
- Connor, J.; Klink, B. Introduction to Motion Based Design; Computational Mechanics Publications: Southampton, UK, 1996; p. 360. [Google Scholar]
- Fiberline Composites A/S. General Design Certification; Fiberline Composites A/S: Middelfart, Denmark, 2018. [Google Scholar]
- Ascione, L.; Caron, J.F.; Godonou, P.; van IJselmuijden, K.; Knippers, J.; Mottram, T.; Oppe, M.; Gantriis Sorensen, M.; Taby, J.; Tromp, L. Prospect for New Guidance in the Design of FRP; Publications Office of the European Union: Ispra, Italy, 2016; p. 172. [Google Scholar] [CrossRef]
- Gallegos-Calderón, C.; Naranjo-Pérez, J.; Pulido, M.D.G.; Díaz, I.M. Design, construction and structural response of a lightweight FRP footbridge. In Proceedings of the IABSE Congress 2021 Structural Engineering for Future Societal Needs, Ghent, Belgium, 22–24 September 2021. [Google Scholar]
- Correia, J.R.; Branco, F.A.; Ferreira, J. GFRP-concrete hybrid cross-sections for floors of buildings. Eng. Struct. 2009, 31, 1331–1343. [Google Scholar] [CrossRef]
- Reynders, E.; Schevenels, M.; De Roeck, G. MACEC 3.3: A MATLAB Toolbox for Experimetnal and Operational Modal Analysis; Structural Mechanics Section Kasteelpark Arenberg: Leuven, Belgium, 2014. [Google Scholar]
- SIMULIA. Abaqus 2020 Analysis User’s Guide; Dassault Syst{è}mes Simulia Corporation: Aachen, Germany, 2020. [Google Scholar]
- Zureick, A.H.; Bennett, R.M.; Ellingwood, B.R. Statistical characterization of fiber-reinforced polymer composite material properties for structural design. J. Struct. Eng. 2006, 132, 1320–1327. [Google Scholar] [CrossRef]
- JCSS. JCSS Probabilistic Model Code. 2001, pp. 1–21. Available online: https://www.jcss-lc.org/jcss-probabilistic-model-code/ (accessed on 20 July 2021).
- Friswell, M.I.; Mottershead, J.E. Finite Element Model Updating in Structural Dynamics; Springer: Dordrecht, The Netherlands, 1995. [Google Scholar]
- Mathworks. MATLAB-Getting Started Guide; Mathworks: Natick, MA, USA, 2019. [Google Scholar]
- Hawryszków, P.; Pimentel, R.; Silva, F. Vibration effects of loads due to groups crossing a lively footbridge. In Proceedings of the X International Conference on Structural Dynamic, Rome, Italy, 10–13 September 2017; Volume 199, pp. 2808–2813. [Google Scholar] [CrossRef]
- Silva, R.; Pimentel, R.L.; Pavic, A. Performance of biodynamic models to represent the action of a pedestrian in the vertical direction. In Proceedings of the XI International Conference on Structural Dynamic, Athens, Greece, 23–26 November 2020; Volume 40, pp. 1824–1834. [Google Scholar] [CrossRef]
- Goicolea, J.M.; Nguyen, K. CALDINTAV Version D1.0; Railway Bridges Design, Construction and Maintenance: Madrid, Spain, 2017. [Google Scholar]
Publisher’s Note: MDPI stays neutral with regard to jurisdictional claims in published maps and institutional affiliations. |
© 2021 by the authors. Licensee MDPI, Basel, Switzerland. This article is an open access article distributed under the terms and conditions of the Creative Commons Attribution (CC BY) license (https://creativecommons.org/licenses/by/4.0/).