Article

Integrated Design of Process-Tolerance for Remanufacturing Based on Failure Feature

1
Key Laboratory of Metallurgical Equipment and Control Technology, Ministry of Education, Wuhan University of Science and Technology, Wuhan 430081, China
2
Hubei Light Industry Technology Institute, School of Mechanical and Electronic Engineering, Wuhan 430081, China
3
Hubei Key Laboratory of Mechanical Transmission and Manufacturing Engineering, Wuhan University of Science and Technology, Wuhan 430081, China
4
Academy of Green Manufacturing Engineering, Wuhan University of Science and Technology, Wuhan 430081, China
*
Authors to whom correspondence should be addressed.
Appl. Sci. 2021, 11(14), 6377; https://doi.org/10.3390/app11146377
Submission received: 19 June 2021 / Revised: 3 July 2021 / Accepted: 7 July 2021 / Published: 9 July 2021
(This article belongs to the Special Issue Sustainable Manufacturing Systems Using Big Data)

Abstract

:
The uncertainty failure of the used part leads the complexity selection of remanufacturing processes. The different remanufacturing process combinations among used parts of used products also make the formulation of tolerance schemes more difficult. It is hard to guarantee the optimality of process-tolerance schemes by traditional serial production modes in general, in which tolerance design is followed by process formulation. In order to generate the optimal remanufacturing scheme of process and tolerance for used products, an optimization method to integrate designs of process-tolerance (IDP-T) based on fault features was presented. In this work, the failure description set of used parts was constructed by combining the attribute characteristics and failure characteristics. Case-based reasoning (CBR) was first utilized to generate the feasible remanufacturing process plans of used parts. Then, based on the feasible process plans, the factors of cost, quality loss, closed-loop accuracy and machining ability of remanufacturing were comprehensively considered to construct the optimization model of IDP-T. The Beetle Antennae Search algorithm (BAS) was used for the optimal alternative selection. Finally, a used gearbox was taken as an example to illustrate the validity and practicality of the proposed method. The results showed that the proposed method was effective in the optimization of IDP-T for remanufacturing.

1. Introduction

With the development of the scale of global industrialization and the shortening of the technological iteration cycle, the elimination quantity and speed of mechanical products increases. This causes countries to pay more attention to the circular economy. Remanufacturing as a technology to restore the performance, and finally reach the “as new” state of used products, can fully release the residual value of waste products [1]. It has become an important part of the circular economy [2,3]. Compared to new product manufacturing, remanufacturing can reduce 60% of energy, 70% of materials, 50% of cost and 80% of air pollution while achieving the same product quality [4]. It is considered to be a technology with both environmental and commercial value [5,6]. For the great advantage to be gained from remanufacturing, to a large degree this depends on the remanufacturing process and tolerance scheme.
The process and tolerance scheme formulated for used parts was a critical step in remanufacturing of the remanufactured products, which established a key connection between used parts and remanufactured products. As a kind of mechanical processing, an optimal process and tolerance scheme of remanufacturing created more benefits in reducing production cost and quality loss [7,8]. In process, ref. [9] used the ontology method to organize the remanufacturing information of the used part to formulate the optimal remanufacturing process scheme. Reference [10] presented an RS–CBR system matching method for selecting the optimal process planning from case databases to increase the efficiency of remanufacturing process formulation. In tolerance, ref. [11] studied the classified control method of remanufacturing dimension chains under different costs of tolerance levels, to realize the hierarchical assembly of remanufacturing dimension chains. The authors of [12] ensured the assembly precision of a remanufactured car engine by state space model. Undoubtedly, these above researchers gave a valuable establishment for remanufacturing process and tolerance scheme e.g., matching system and hierarchical method, whereas few studies have been done on remanufacturing process and tolerance scheme formulation based on uncertainty return status of the used parts.
Compared to manufacturing, the process design of remanufacturing presents a high degree of uncertainty due to the different return status of the used parts [13]. As reflected by the different failure types and failure degrees of the surface of used parts, these series of failures have led to the diversity of feasible remanufacturing process plans of used parts, and process combinations of used products, which causes the tolerance design to be more difficult and complex. In order to reduce the effect of uncertainty failure on the remanufacturing process and tolerance formulation, many scholars have carried out research. Reference [14] proposed the remanufacturing process of the used machine tools based on the analysis of failure characteristics; Ref. [15], oriented to remanufacturing process design, proposed a hierarchical failure mode information transfer chain for remanufacturing products based on polychromatic model. Meanwhile, ref. [16], through the analysis of the failure characteristics of remanufacturing, optimized the remanufacturing process plan of used parts. Reference [17] established the mathematical sub-model with different dimensional precision remanufactured parts, and reassembled the remanufacturing dimension chain under the constraint. The authors of [18] redistributed the tolerance of the remanufactured assembly dimensional chain based on the uncertainty of used parts. These studies analyzed the influence of process and tolerance by uncertainty failure of the returned products from different aspects respectively, but ignored the connection between the process and tolerance under the uncertainty failure.
At the present stage, the formulation of process and tolerance schemes of remanufacturing was in serial. Through pre-screening of used parts, the size and performance was first restored by surface treatment technology, and then the dimensions of compensator components was adjusted to meet the requirements of assembly precision [19]. This mode of remanufacturing from individual used parts to the whole dimension chain needed trial assembly and secondary processing in the assembly stage due to the lack of tolerance planning in the design stage, resulting in extra costs and quality loss of the remanufacturing product. It also reduced the rationality of optimal scheme decisions when multiple feasible process plans exist for used parts.
In light of the previous work, one of the main reasons that hindered the further reduction of cost and the improvement of quality stability was lacking an effective method to formulate process and tolerance scheme integrated in the design stage of remanufacturing. Based on this, an IDP-T method for remanufacturing based on failure feature was proposed in this paper. Through the failure feature description of the used parts, the feasible process plans were first generated. Then, the optimization model of IDP-T in the design stage was established by cost and quality loss. Finally, the optimal process-tolerance scheme was obtained by meeting the machining capacity and assembly precision through BAS.
The rest of the paper was structured as follows. In Section 2, the method of extracting and quantifying the failure feature of the used parts was presented. The feasible process plans were then formulated based on the failure characteristics set. An IDP-T optimization model based on feasible process plans was constructed. In Section 3, the effectiveness and feasibility of the proposed method was verified through the case study of a used gearbox. Finally, Section 4 summarized the main conclusions and future research points.

2. Materials and Methods

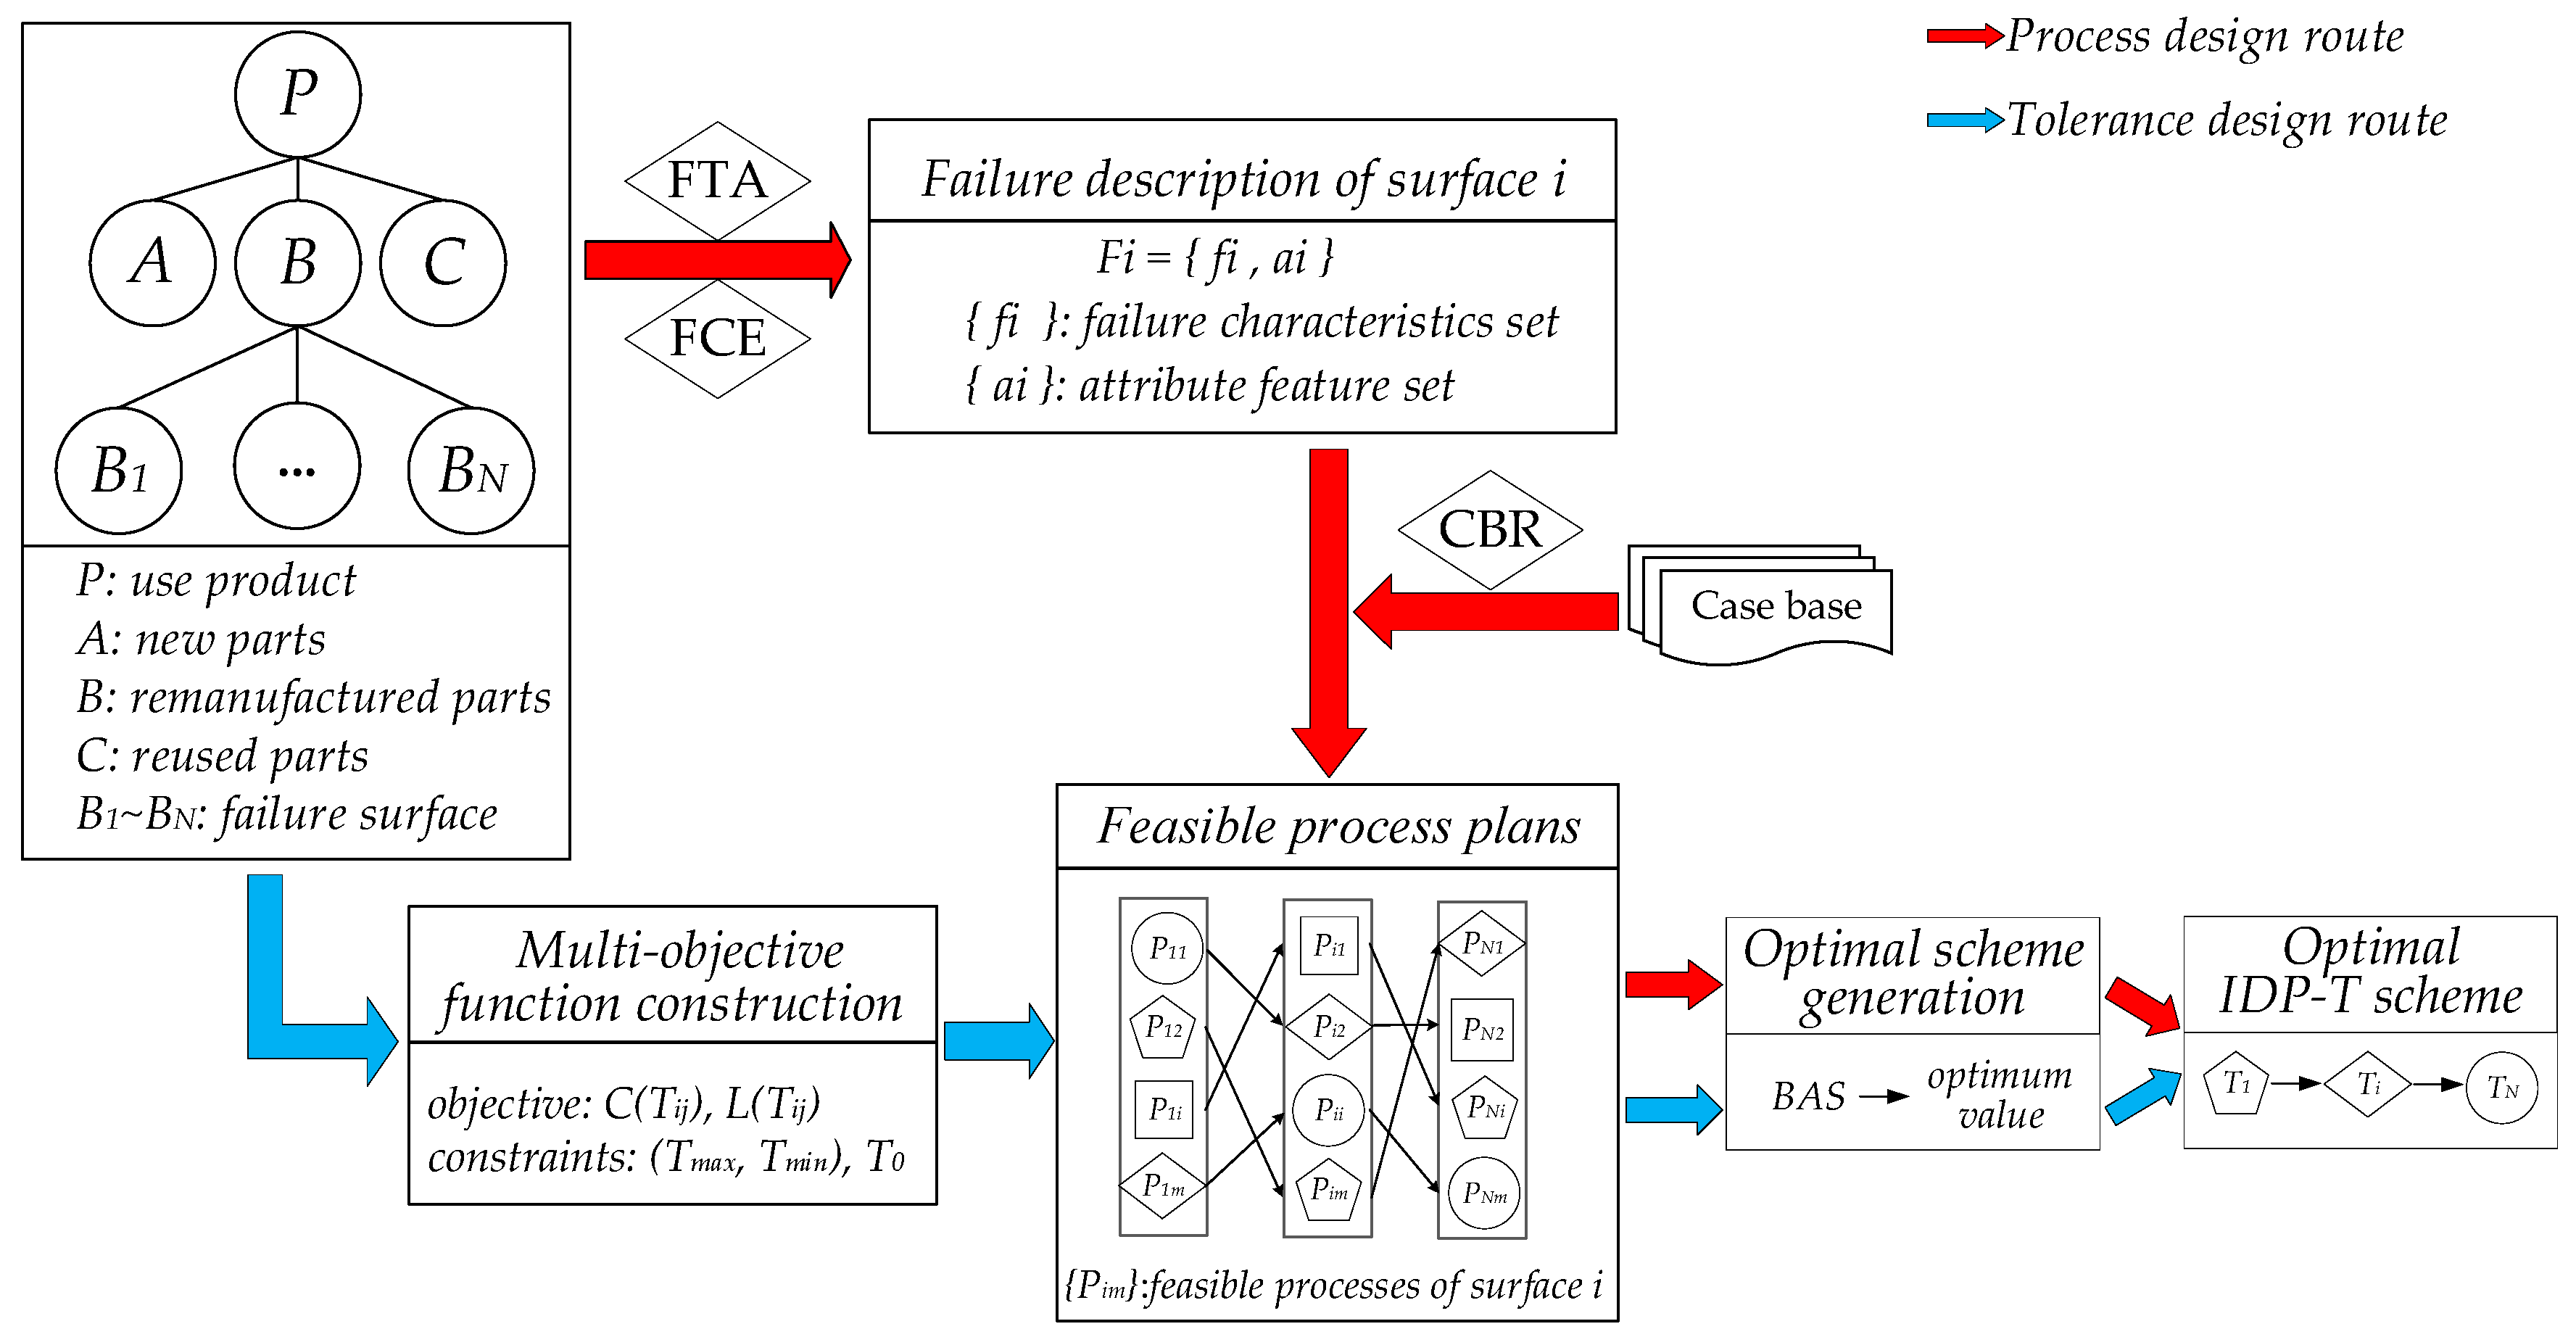
2.1. The Framework of IDP-T for Remanufacturing

IDP-T aims to generate the process and tolerance schemes simultaneously in the design stage. The optimization is considered as the pathways to obtain the optimum scheme. The process is shown in Figure 1.
This optimization framework consists of three steps.
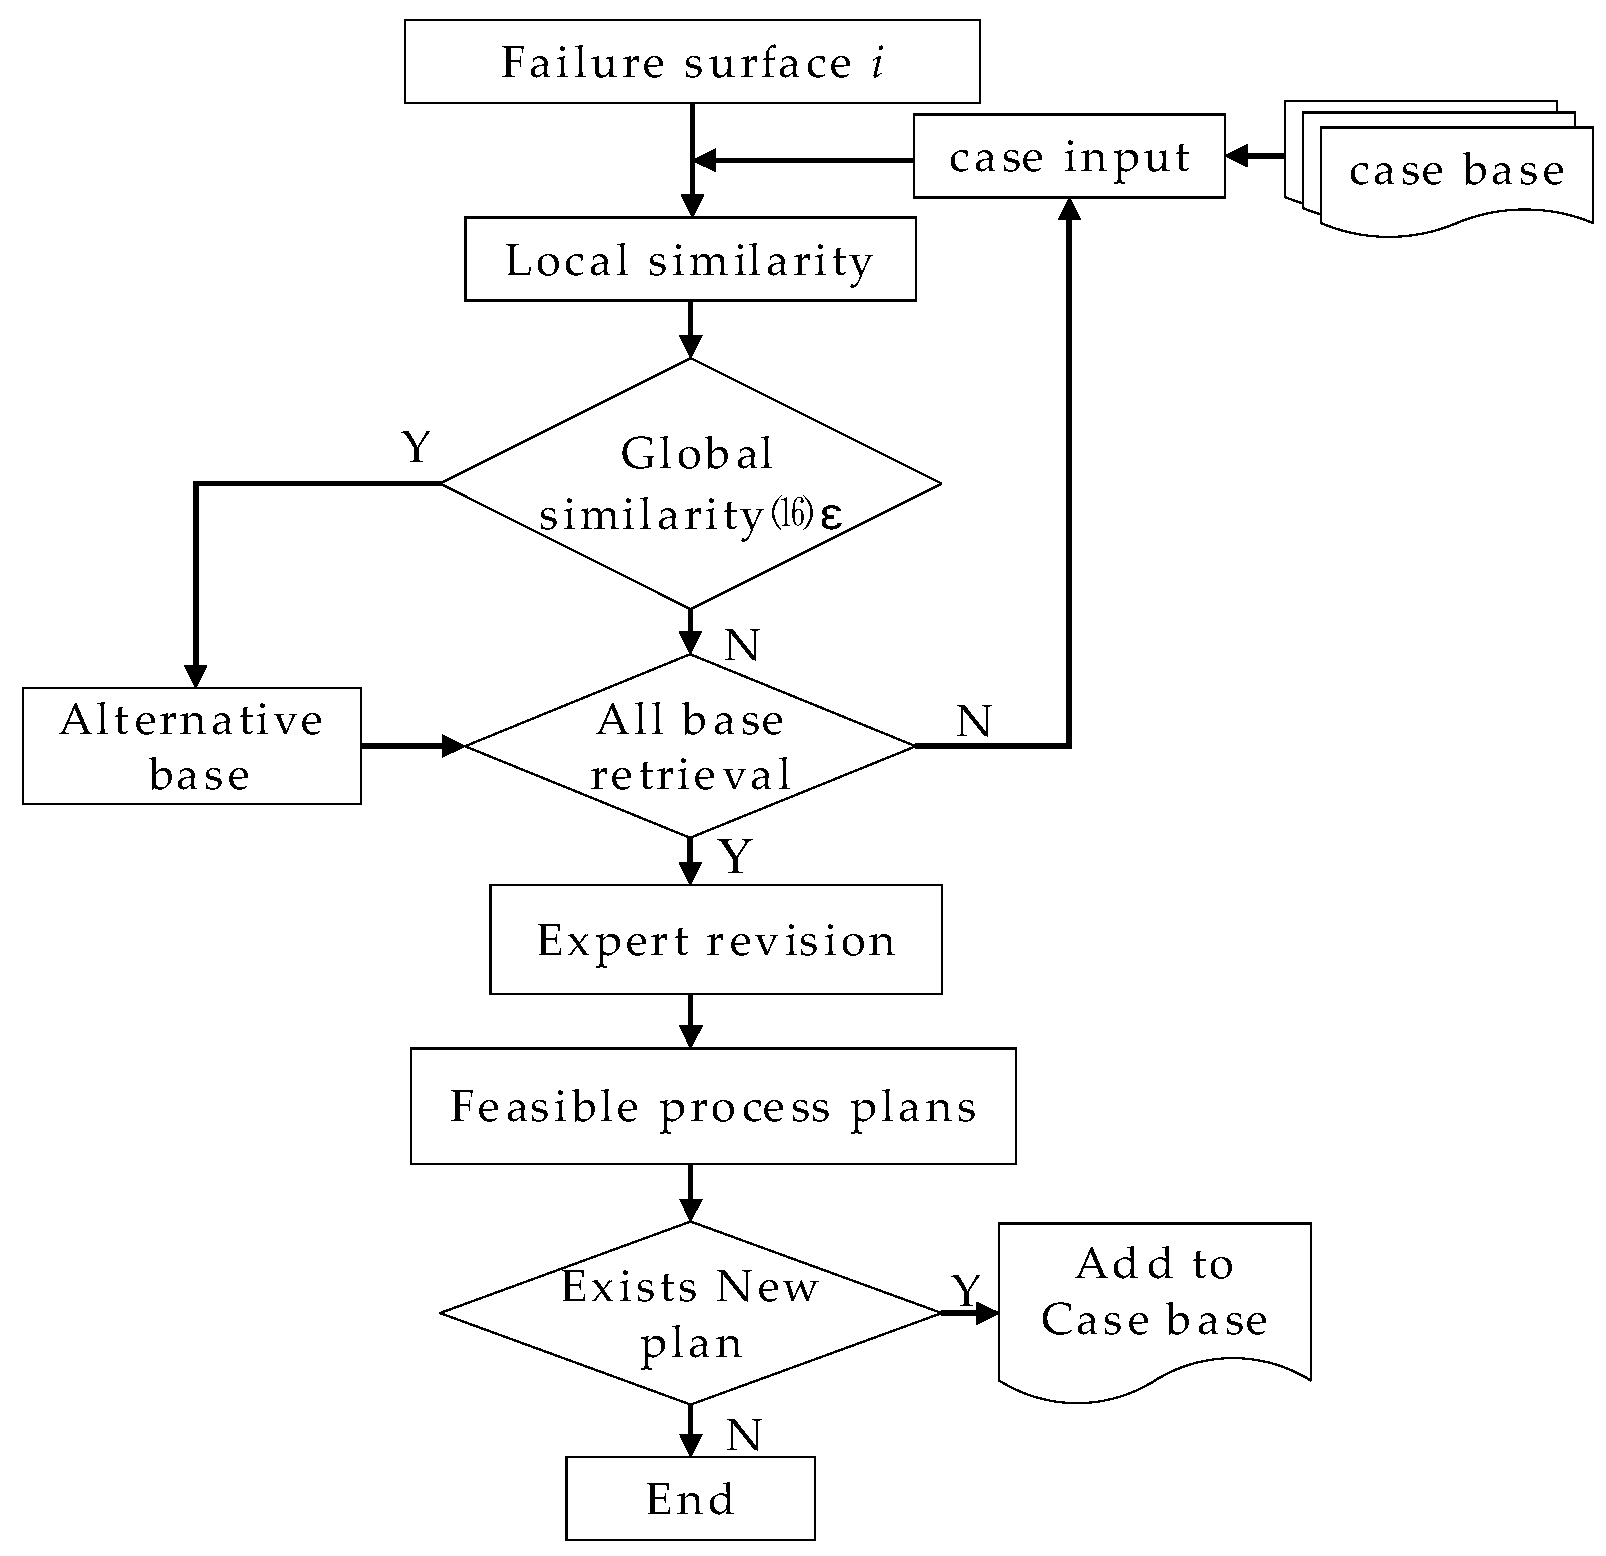
  • Feasible process plan generation. In order to obtain the feasible remanufacturing process plans of the failure surface, FTA (fault tree analysis) and FCE (fuzzy comprehensive evaluation) are used to extract and quantify the failure features of the failure surface, and combine the attributes of the failure surface to construct the failure surface feature description set. Then, CBR (Case-based reasoning) is utilized to match the case base to generate the feasible process plans of the failure surface.
  • Multi-objective function construction. IDP-T is a multi-objective optimization problem. In this step, the minimization of the remanufacturing cost and quality loss of used products are regarded as optimization objectives, and the processing capacity and assembly precision requirements as constraints to construct the optimization model.
  • Optimal scheme generation utilizing BAS. BAS is used to solve the problem of multi-objective optimization. At last, the optimum value is obtained, and the optimal plan of IDP-T is selected.

2.2. Feasible Process Plans Generation

With the continuous accumulation of remanufacturing production experience, enterprises have accumulated amounts of similar cases in historical production activities, and there are usually multiple feasible process plans for the same failure surface. Therefore, how to reasonably describe the failure surface features and efficiently retrieve similar cases from the case base is the key step of IDP-T.
The characteristics set of the failure surface i was constructed as a kind of data structure F i = { f i ,   a i } , which is comprised of failure characteristics set { f i } and attribute feature set { a i } of failure surface i. In this data structure f i = { t i , q i } represents failure type t i and failure quantification qi of surface i; a i = { m i , s i , d i } represents material mi, shape si and dimension di of surface i. Once the characteristics set of the failure surface is obtained, the feasible process plans can be generation by CBR. The specific construction process is shown in Figure 2.

2.2.1. Failure Characteristics Set Construction
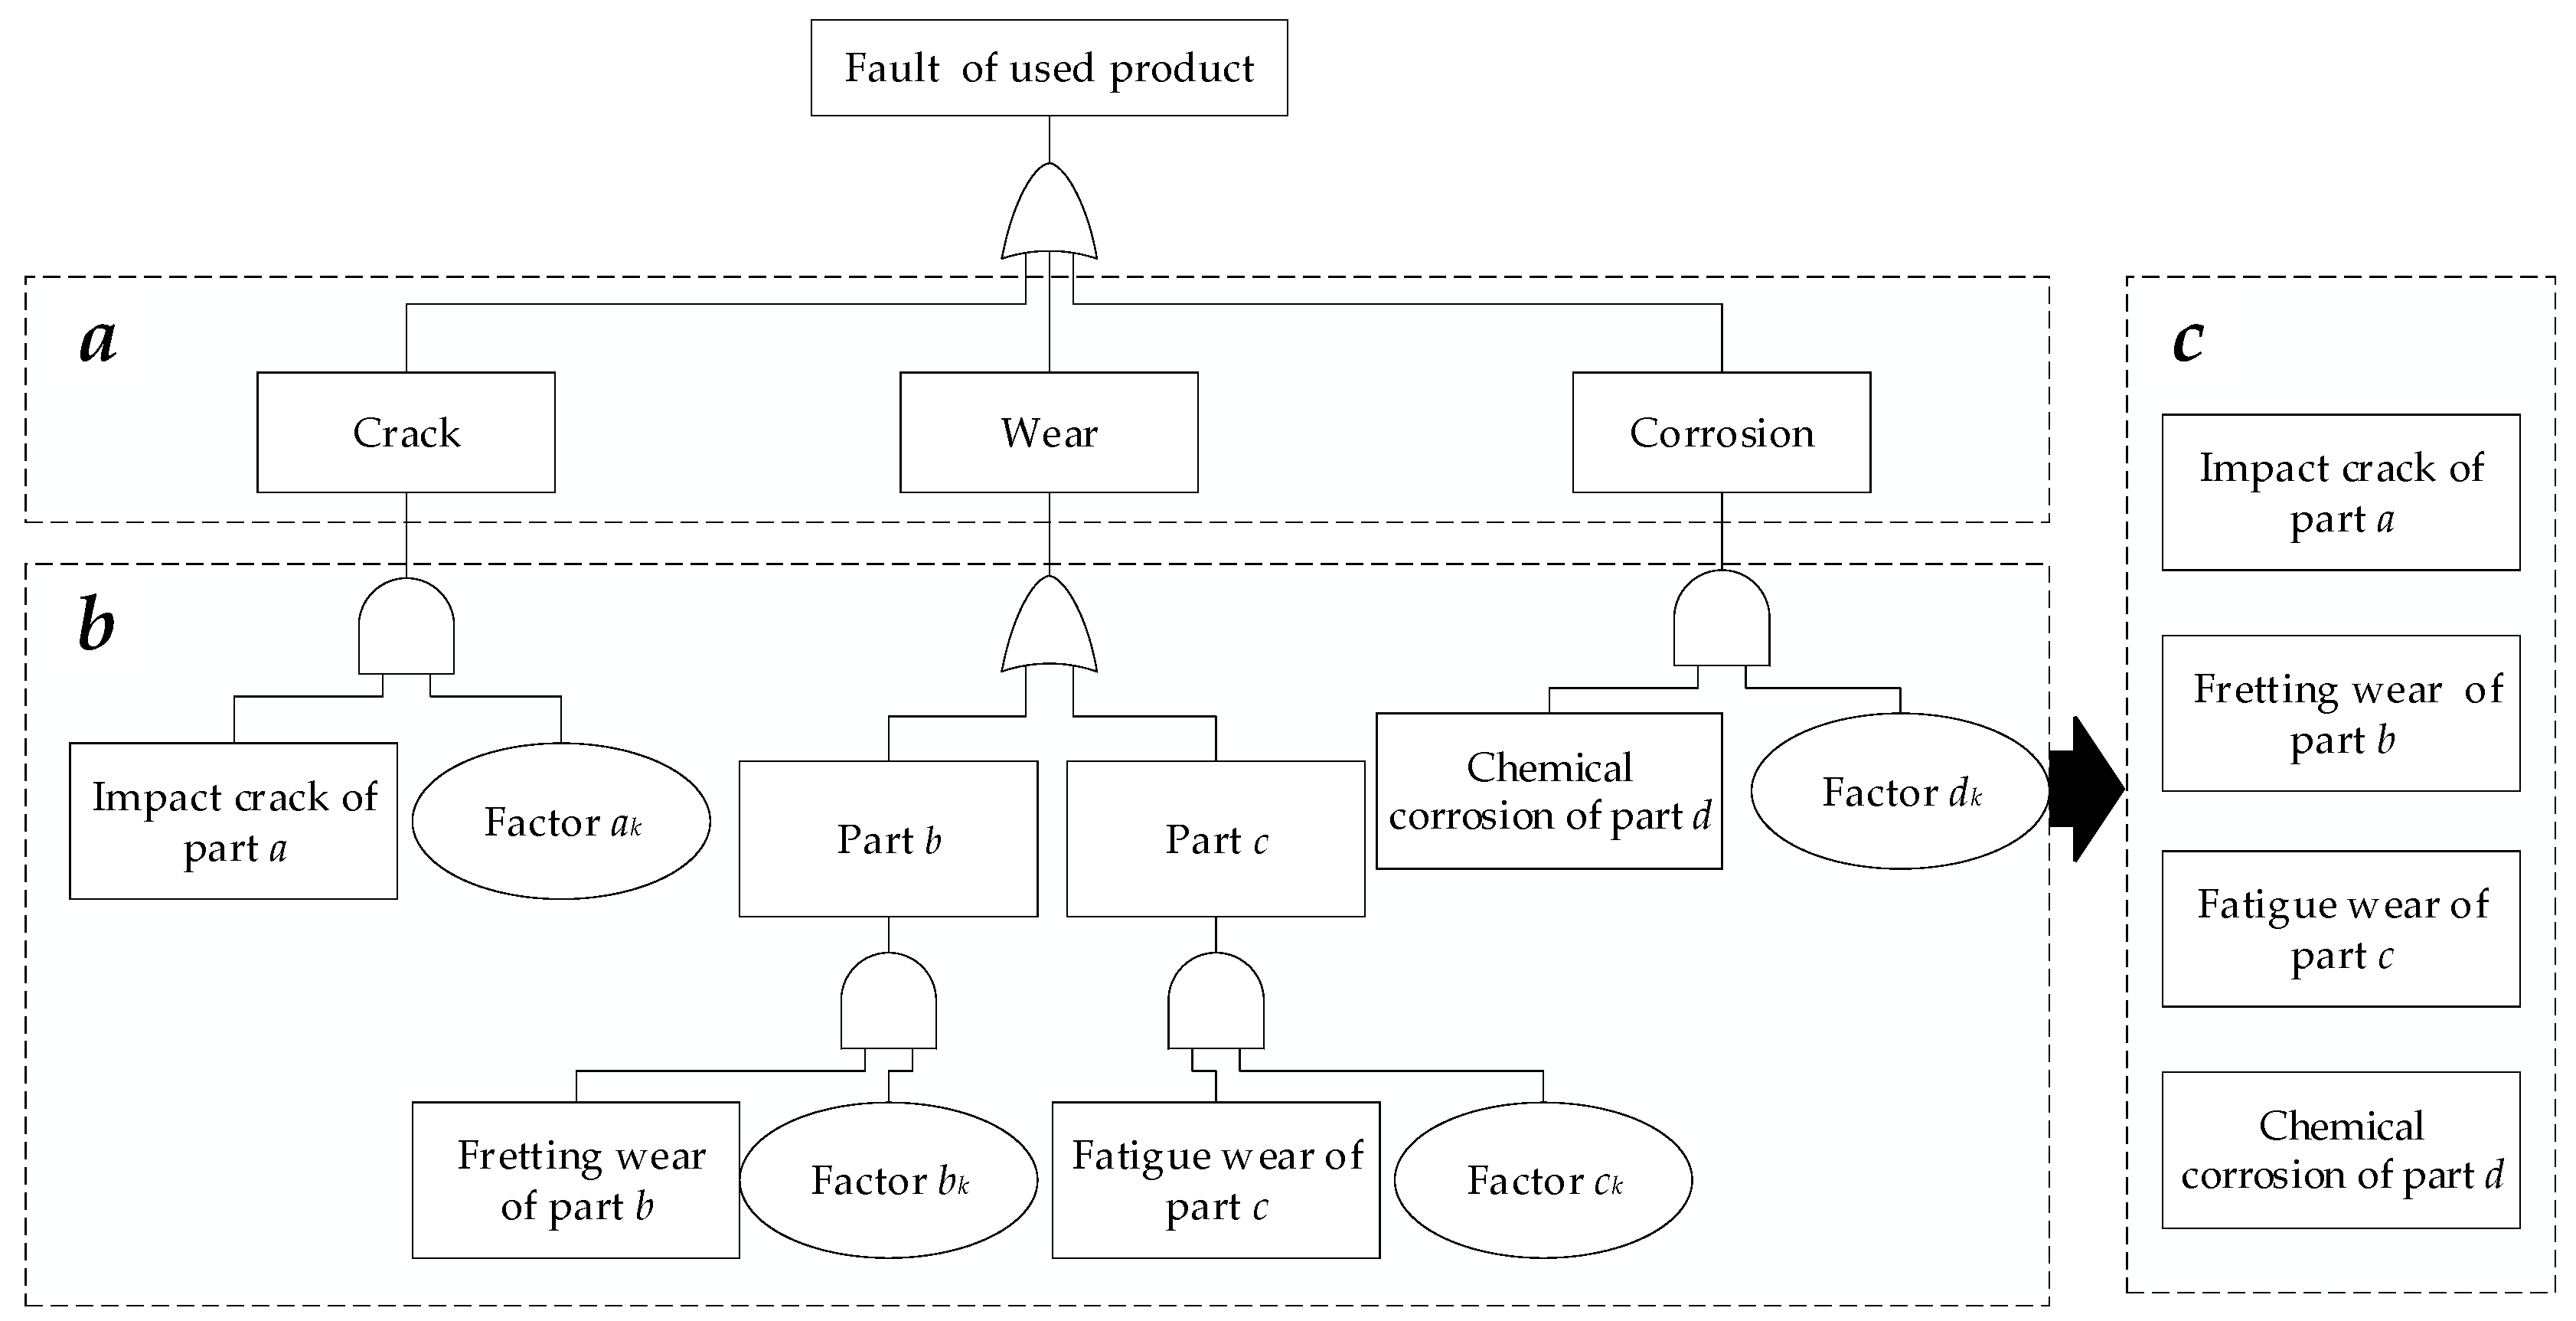
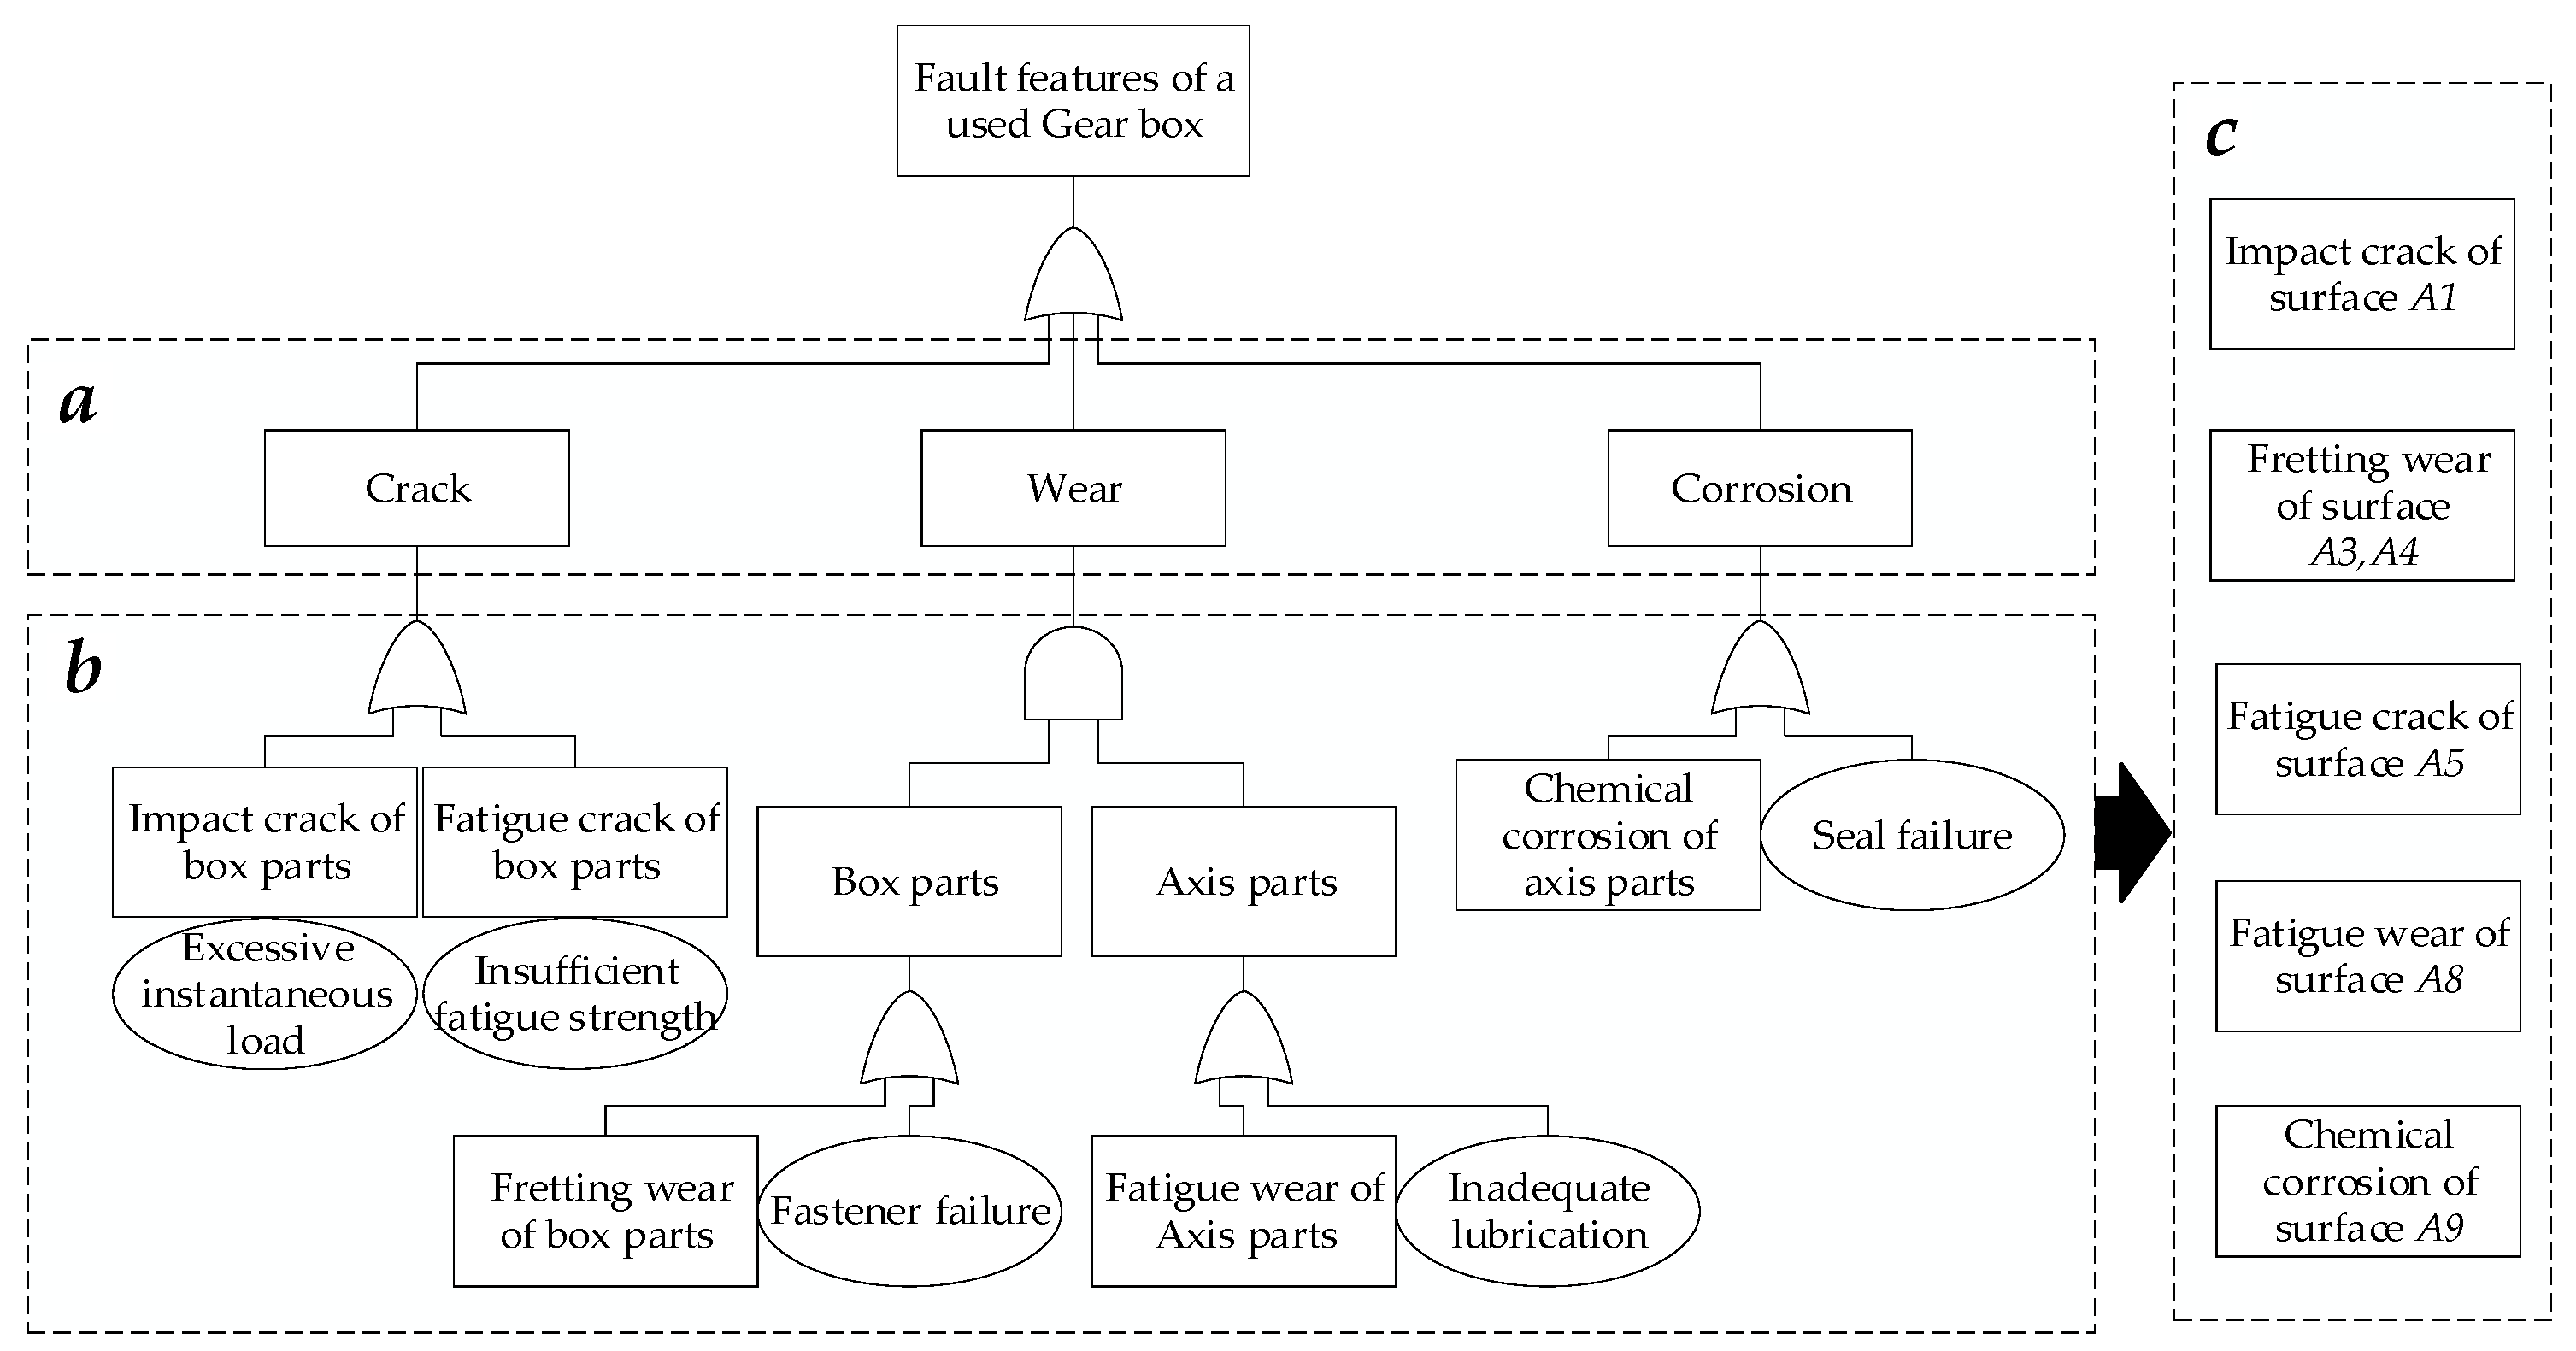
 { f i }

Failure Type Extraction ( t i )

The different working conditions of products cause the uncertainty of parts failure types, which affects the processes and parameters formulation. In addition, various fault types also exist on different surfaces of a used part. Therefore, failure types extracted from surfaces should be carried out first. The FTA is used in this procedure.
FTA is a deductive failure analysis method from top to bottom, which uses Boolean Logic to combine low-order events to analyze failure scenarios in the system [20]. In this paper, FTA was utilized to identify the failure type of surface i, as shown in Figure 2.
In Figure 2, “ Applsci 11 06377 i001” in (a) is the input events, representing the main failure performance of the used parts of this type of used product; “ Applsci 11 06377 i001” and “ Applsci 11 06377 i002” in (b) is the input events and condition events, representing the specific failure type of used parts and the cause of the failure type, respectively; “ Applsci 11 06377 i001” in (c) is the output events, representing the specific failure parts and failure types of the used product; “ Applsci 11 06377 i003” and “ Applsci 11 06377 i004” are AND gate events and OR gate events, respectively.

Failure Quantification ( q i )

When the failure type of surface i was obtained, the damage volume of the failure could be confirmed by the CAD model. Traditionally, the damage degree of failure was often evaluated by “high”, “medium” and “low” attributes, which was a fuzzy evaluation method based on a designers’ subjective interval. In order to overcome the shortcomings of this evaluation mode, the FCE was used to quantify the failure characteristics unifying the evaluation interval according to the specific situation of remanufactured products. A series of quantitative equations were then used to map the damage volume to the score interval of [0–10]. Once the type and damage volume of the failure was obtained, the failure could be quantified by the corresponding quantitative equation.
A failure quantification standard for a used gearbox was taken as an example, as shown in Table 1.

2.2.2. Attribute Feature Set Construction { a i }

The used parts were affected by attributive character such as material, shape and dimension of the failure surface when making the remanufacturing process plan. Therefore, in order to establish the feasible process plans more accurately, it was necessary to describe the attributes of the failure surface after its failure type, and quantification was obtained. The attribute feature set of failure surface i was established as a i = { m i , s i , d i } = { m a t e r i a l , s h a p e , d i m e n s i o n } .
Finally, the characteristics set of failure surface i could be described as
F i = { f i ,   a i } = { t i , q i , m i , s i , d i }

2.2.3. Feasible Process Plans Generation Based on CBR

CBR realizes retrieval by calculating the similarity between new cases and existing cases. The similarity can be divided into local similarity and global similarity, where the local similarity is the similarity between two attributes, and the global similarity is the similarity between two cases. The relationship between local similarity and global similarity is as Equation (1).
s i m ( N , E ) = i = 1 n ω i s i m ( c i N , c i E )
where N is the new case and E is the existing case; n is the number of influence factors; c i N and c i E are the i th factors of new case and existing case respectively; s i m ( c i N , c i E ) is the local similarity of i th factors between new case and existing case; ω i is the weight of i th factors, which obtained by experts through AHP, the specific process can be referred to [21].
For local similarity, different data types require different calculation methods. Therefore, data of matching set G i are divided into three types: numerical data, enumerated data, and character data, and their corresponding similarity calculation models are established.
  • Numerical data similarity calculation model.
Numerical data consist of a series of continuous values in an interval (such as failure quantification). The similarity calculation model of numerical data is given by Equation (2).
s i m ( c i N , c i E ) = 1 | c i N c i E | m a x ( c i ) m i n ( c i )
where m a x ( c i ) and m i n ( c i ) are the maximum and the minimum values that can be obtained in all cases of c i , respectively.
2.
Enumerated data similarity calculation model.
Enumerated data consist of a series of discrete values in an interval (such as surface dimension). The size of the failure surface (very small, small, medium, large, very large) can be represented by discrete data (0.1, 0.3, 0.5, 0.7, 0.9, respectively). The similarity calculation model of enumerated data is given by Equation (3).
s i m ( c i N , c i E ) = 1 | c i N c i E | H i
where H i is the maximum discrete values that can be obtained in all cases of c i .
3.
Character data similarity calculation model.
Character data calculate the local similarity through the complete matching of keywords (such as surface shape, material, etc.). When the keywords are matched, the local similarity is 1, otherwise the local similarity is 0. The similarity calculation model of enumerated data is given by Equation (4).
s i m ( c i N , c i E ) = { 1 c i N = c i E 0 c i N c i E
After the global similarity is obtained through Equation (1), the similarity of case base instances is screened and matched by a preset similarity threshold, and the remanufacturing process corresponding to the case with the global similarity that meets the threshold is output. Then, the expert determines whether the feasible plans need to be revised, and the new plans are imported to upgrade and expand the case base. If there is no case that meets the similarity threshold, the process plans will be formulated by the expert and then imported into the case base.
The framework of feasible process plans generation of failure surface based on CBR is shown in Figure 3.

2.3. Multi-Objective Function Construction

IDP-T for remanufacturing needs to comprehensively consider the information of design, manufacturing, and assembly stage. Therefore, after obtaining the feasible process plans of each feature surface, the information of manufacturing stage and assembly stage should be quantified to consider in-scheme formulation, and a multi-objective optimization model needs be used to select an optimum scheme.
Remanufacturing cost and quality loss in IDP-T are considered to be the variables in multi-objective functions. The combination of different process-tolerance schemes of each failure surface will lead to different remanufacturing costs, which determine the profit and investment willingness of the company; the variety of tolerance leads to different quality losses, which will affect the subsequent processing of remanufacturing. As a result, the optimization model of IDP-T for remanufacturing is established, in which minimizing cost and quality loss is the objective, and is constrained by the requirements of assembly precision and the processing ability of the company. Before introducing the optimization model, some assumptions are provided as follows:
  • The dimensional chain is in plane.
  • Tolerances of remove process are symmetrically distributed.
  • The failure surface needs to be processed as a whole. Partially repaired failure surface needs to coincide with the base plane after remanufacturing, so it can be regarded as a new part and the tolerances conform to the original dimensions.

2.3.1. Objective Functions

Cost Function

The cost of IDP-T for remanufacturing includes the cost of machine tools, cutting tools and additional materials; remanufacturing process of failure surface can be divided into removal processes and additive processes. When there are n processes in the remanufacturing of failure surface i, the total cost is shown in Equation (5).
C i = j = 1 a C i j + j + = 1 b C i j + ( a + b = n )
where C i j and C i j + are the cost of removal process and additive process of surface i using process j , respectively; a and b are the numbers of removal process and additive process of surface i , respectively. The cost of removal process C i j will increase with the improvement of the machining accuracy. The negative square model is used to construct the tolerance-cost function of the removal process, as in Equation (6).
C i j = a 0 i j + a 1 i j ( T i j ) 2
where a 0 i j and a 1 i j are the fixed cost coefficient and tolerance cost coefficient of surface i using removal process j , respectively; T i j is the tolerance of surface i using removal process j . The values of a 0 i j and a 1 i j can be obtained by fitting the enterprise cost-tolerance statistical samples by the least square method.
For additive processes, different equipment and parameters will lead to greater difference in precision. According to literature [22,23], for the same equipment, when the main parameters remain stable, the tolerance is relatively fixed in unit thickness and meets the normal distribution. Therefore, when economic parameters are adopted, the additive process cost can be regarded as a fixed value related to the thickness of the additive, as shown in Equation (7).
C i j + = a 0 i j + = f ( h i j + )
where a 0 i j + and f ( h i j + ) are fixed cost, and cost functions are related to the thickness of the additive when dimensions are restored under economic processing parameters, respectively.
When the used product, having N failure surface needs remanufacturing tolerance design, the total cost is shown in Equation (8).
C = i = 1 N ( j = 1 a C i j + j + = 1 b C i j + )

Quality Loss Function

Quality loss is an economic loss due to a less than expected performance of the product. According to Taguchi theory, size deviation of the parts will cause quality loss and ultimately affect the subsequent processing. Exponential equations are used to construct the quality loss function of remanufacturing processes, shown as Equations (9) and (10).
L = K i j ( A 0 i j A i j ) 2
K i j = B i j Δ i j 2
where K i j is the quality loss coefficient of surface i using process j; A 0 i j and A i j are the original design dimension and remanufacturing actual machining dimension of surface i using process j, respectively; B i j and Δ i j are the lost cost by out of tolerance and allowance tolerance of surface i using process j, respectively. In process level, the physical meaning of quality loss is the economic loss of subsequent process and service caused by the tolerance of the surface i using process j.
When the tolerance of removal process T i j is symmetrically distributed, the quality loss of surface i using process j is shown as Equation (11).
L i j = K i j ( T i j 2 4 )
For the additive process, quality loss varies greatly with different equipment; the tolerance is regarded as a fixed value related to the thickness of the additive. Therefore, the quality loss of additive processes is shown in Equations (12) and (13).
L i j + = K i j + · ( T i j + ) 2
T i j + = σ i j + · h i j +
where σ i j + is the one-way maximum dimensional deviation coefficient per unit thickness with economic machining parameters of surface i using additive process j .
Therefore, the total quality loss of the used product is shown as Equation (14).
L = i = 1 N ( j a L i j + j + b L i j + )

2.3.2. Constraints Functions

IDP-T should be conformed to the actual machining capacity of the remanufacturing companies and assembly precision requirements of the product. Based on this, the constraint function should be established.

Tolerance Constraint of Closed-Loop

The tolerance of a closed-loop reflects the precision of the manufacturing stage and the assembly stage of the dimension chain. For remanufacturing the dimension chain, the tolerance of the closed-loop should meet the requirements of the closed-loop tolerance of the original dimension chain. However, due to the uncertainty of the part reused mode of remanufacturing the dimension chain, the original tolerance recovery of a single part cannot meet the requirements. It is necessary to include this uncertainty in the integrated tolerance design of remanufacturing.
The reused mode of used parts can be divided into new parts, reused parts, and remanufactured parts. The tolerance of the new part meets the requirements of new product suppliers; the reused parts had absolute dimensions, and the tolerance is 0; the tolerance of remanufactured parts needs to be optimized.
Therefore, when considering different part reused modes of remanufacturing dimension chains, the tolerance constraint of a closed-loop is as in Equation (15).
ξ i T i + ξ n e w T n e w T 0
where T i and T n e w are the tolerance of the remanufacturing surface i and new parts, respectively; ξ i and ξ n e w are the transfer coefficient of surface i and new parts, respectively; T 0 is the closed-loop tolerance of the original dimension chain.

Constraint of Machining Capability

There are differences in machining capability among different remanufacturing companies, and the actual machining capability of companies needs to satisfy Equation (16).
T m i n i j T i j T m a x i j  
where T m i n i j and T m a x i j are the minimum and the maximum machining precisions of the removal process of the company in economic processing parameters.

2.3.3. Multi-Objective Function Transformation

The multi-objective function is utilized to select the best scheme. The IDP-T optimization problem hinges on two objective functions. The objective optimization of IDP-T is to minimize cost ( f 1 ) and minimize quality loss ( f 2 ), shown in Equation (17). Since the disparate units in objectives, a weighted mean method is proposed to simplify this process, shown in Equation (18). The constraint quantization is summarized in Equation (19).
{ f 1 = C C m i n C m a x C m i n f 2 = L L m i n L m a x L m i n
F m i n = ω 1 f 1 + ω 2 f 2
s . t . { ζ i T i + ζ n e w T n e w T 0 T m i n i j T i j T m a x i j T i j + = σ i j + · h i j + ω 1 + ω 2 = 1

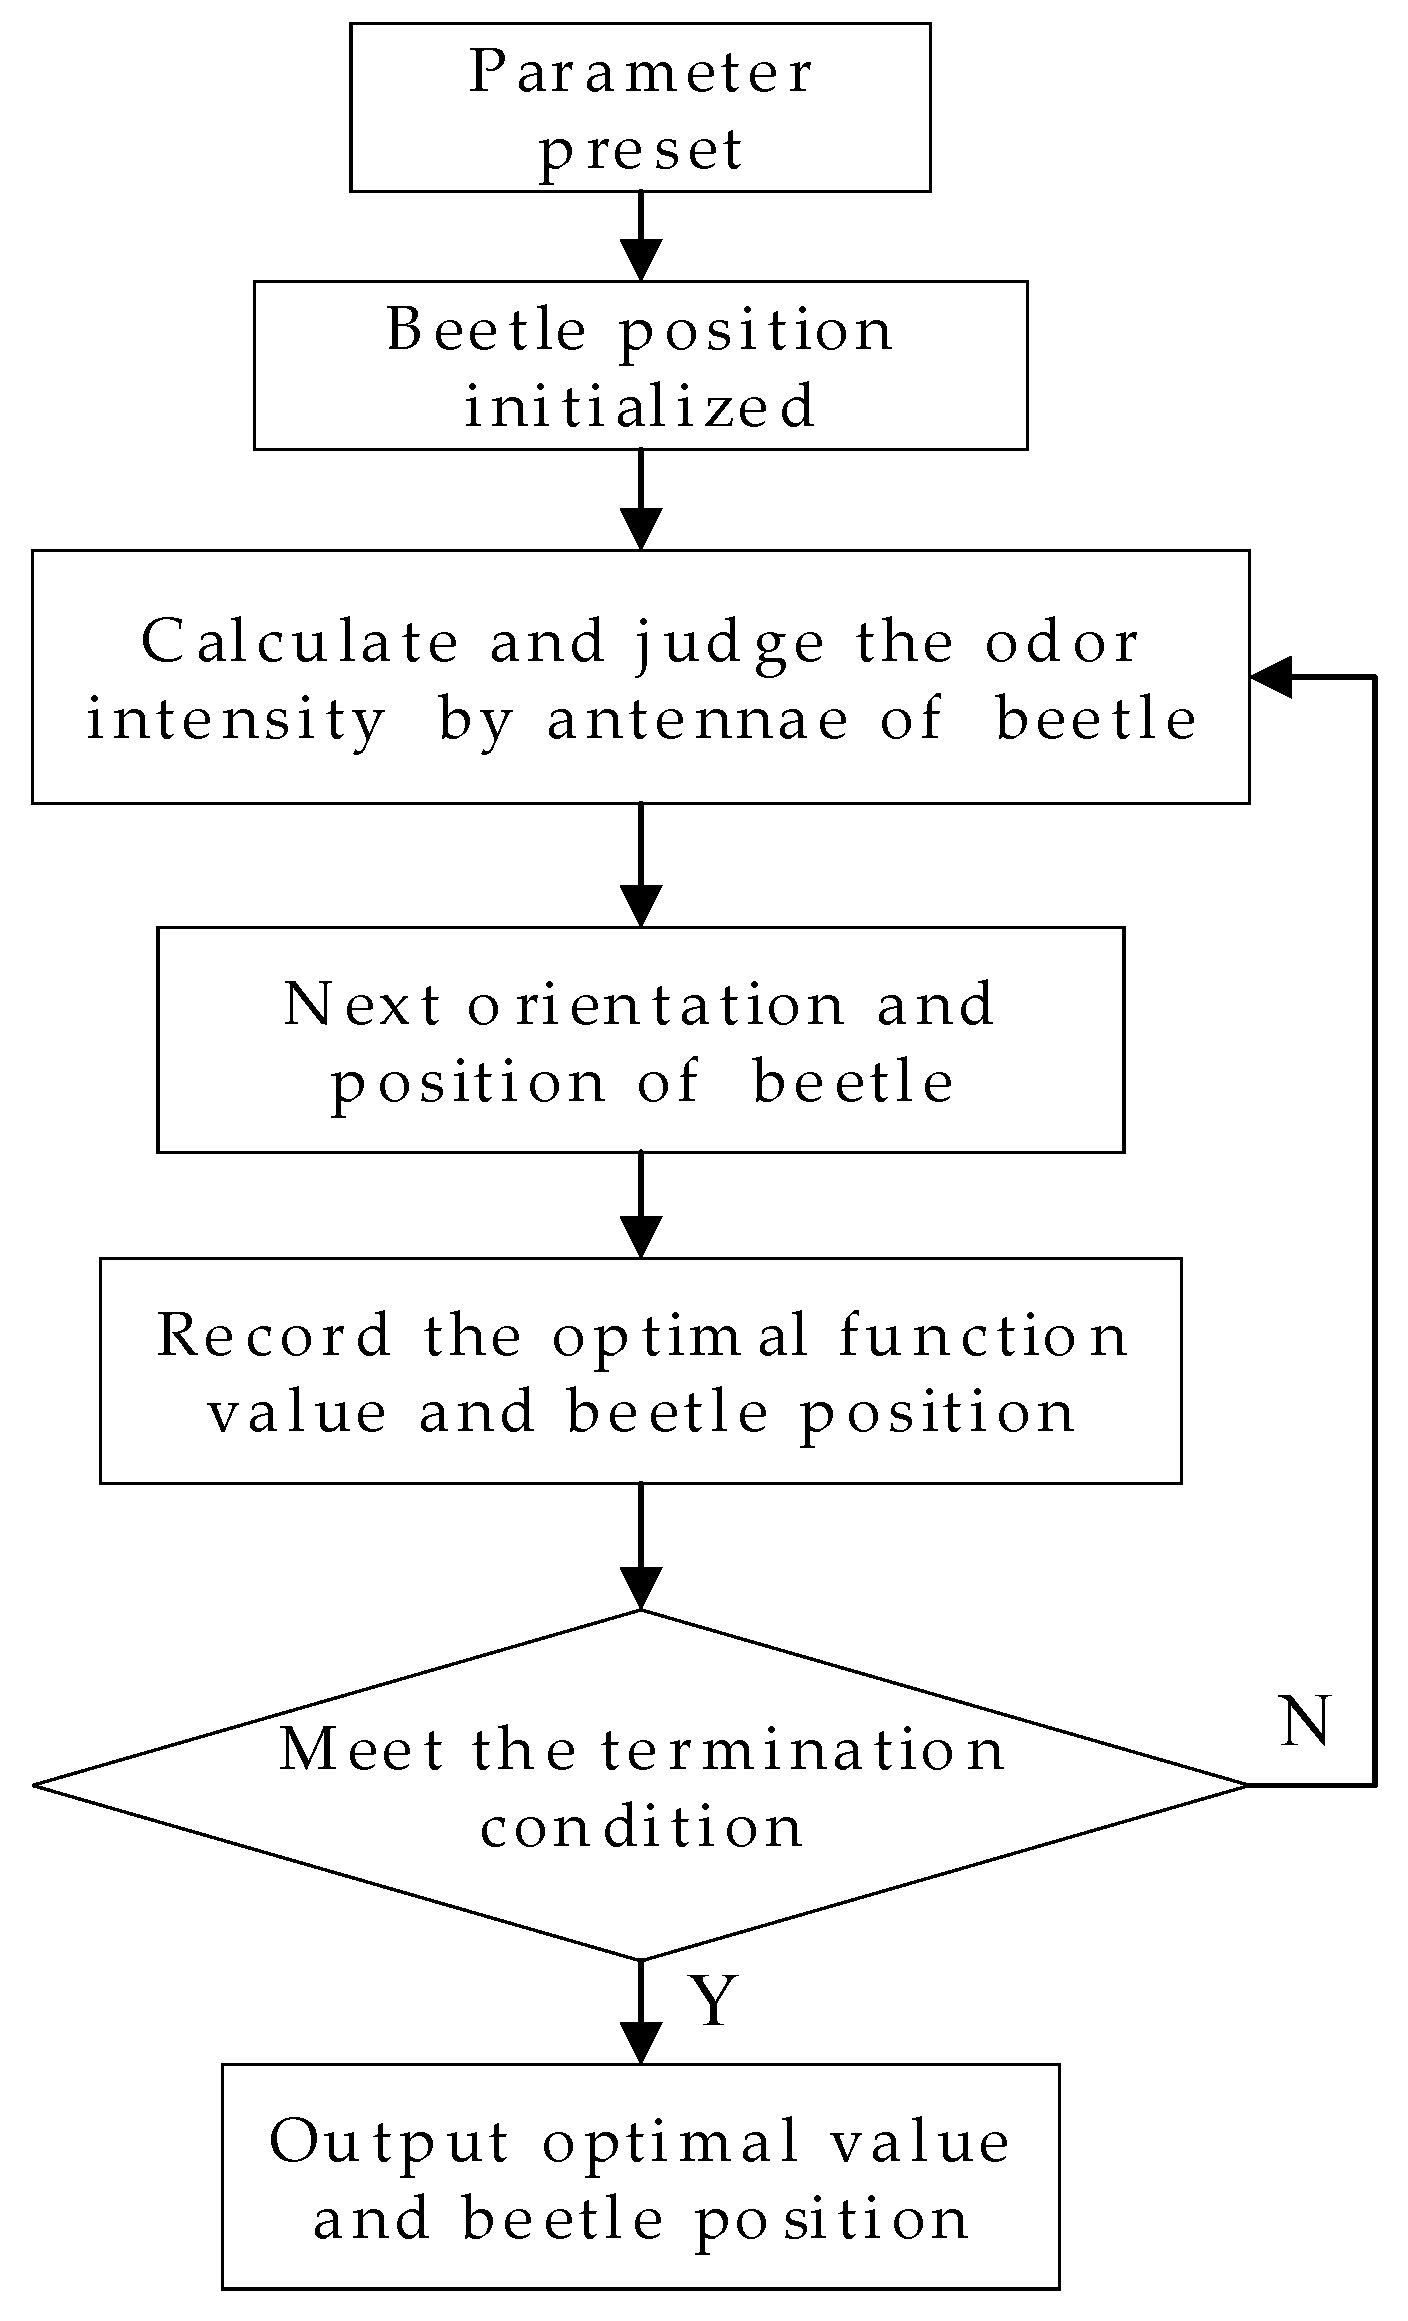
2.4. Optimization Implementation Process of BAS

IDP-T needs to comprehensively consider cost and quality loss in the design stage, while being constrained by closed-loop accuracy and machining capacity, which is a typical multi-objective and multi-constraint optimization problem. The general method to deal with this kind of problem is to transform it into a single-objective problem and find the optimal value of the model through multiple solutions; the convergence rate is slow and difficult to guarantee the optimality of the solution. Considering the shortcomings of traditional methods, we use the Beetle Antennae Search (BAS) to optimize the model.
Beetle Antennae Search (BAS) is an intelligent algorithm proposed in 2017 [24], which simulates the foraging behavior of beetles in nature. Beetles find food by following odor information received through left and right antennae. By adjusting its direction according to odor intensity difference between antennas, the beetle finally finds food after several iterations.
In order to increase the solving efficiency of BAS, some simplifications should be applied as follows:
  • The beetle is simplified as a particle, and the left and right antennae are located on both sides of the particle.
  • The ratio of the movement step size L s t e p to the distance between the antennas d 0 is constant, that is L s t e p = c × d 0 .
  • The head orientation of the beetle is random after one step.
After completing the above simplification, the optimization process framework of BAS for IDP-T includes four steps:
  • Beetle position initialized. Select a group of solution in the optimization model of IDP-T solution space as the initial position of beetle x .
  • Set left and right antennae and distance between two antennae. The fitness value F m i n is obtained by the left and right antennae of beetles, represented by x l and x r respectively, and the difference value between the two antennae is represented by d 0 . Since x , x l , x r are located in the same straight line, d 0 = n o r m ( x l x r ) . According to the simplified condition 3, the beetle faces in any direction, which means the direction vector that x l points to x r is arbitrary; thus, use the random vector d i r = ( x 1 , , x i , , x n ) to represent this direction vector, and normalize by d i r = d i r / n o r m ( d i r ) . Therefore, x l x r = d 0 × d i r , when using the particle in simplifications condition 1, x l and x r can be expressed as x l = x + d 0 × d i r / 2 and x r = x d 0 × d i r / 2 , respectively.
  • The orientation and step size of a beetle. The corresponding fitness values of left and right antennae are represented by f l e f t = f ( x l ) and   f r i g h t = f ( x r ) respectively. Then, the beetle moves with a step size of L s t e p . The forward direction of the beetle is shown as Equation (20).
    { x = x + s t e p × n o r m a l ( x l x r ) x = x s t e p × n o r m a l ( x l x r ) f l e f t < f r i g h f l e f t > f r i g h t
  • Output the optimal scheme and fitness. After comparing the fitness of the left and right tentacles for one step, the step size is updated in L s t e p = L s t e p × e t a , where e t a is the step size update factor [25]. When the precision requirement p or the specified number of steps n is reached, the beetle stops moving. When thee position of the beetle is the optimal solution of the model, then output position x with best scheme and corresponding fitness value F ( x ) .
The IDP-T optimization framework based on BAS is shown in Figure 4.

3. Case Study

As a widely used mechanical product, a gearbox has great remanufacturing value and potential. Taking the remanufacturing of a used gearbox as an example to verify the model, the structure and composition number of the used gearbox is shown in Figure 5, and the dimension chain is shown in Figure 6.
According to Figure 6, the closed-loop is formed by the surface A 9 , A 10 , and the precision range is 0.2–0.4 mm. After the remanufacturing reuse decision of each part, the reuse mode of the right bearing bush is “replaced by new”, and the size and tolerance of the new component is 6 0.050 + 0.050 mm, the left bearing bush is reused, the left box, right box and gear shaft need remanufacturing, and the failure surfaces which need integrated design are A 1 , A 3 , A 4 , A 5 , A 8 , A 9 .

3.1. Remanufacturing Process Plan Formulation of Failure Surface

According to Section 2.2.1, FTA is used to identify the failure type of the failure surface, as shown in Figure 7, in which a represents the failure performance of used gear box, b the failure type and cause of the used parts, and c the extracted failure type of the failure surface.
The volume damage of the failure surface is obtained with a CAD model. Then, the failure quantification is obtained according to the corresponding criteria in Table 1. Once the failure type and quantification of failure surface is obtained, the failure characteristics set, and attribute feature set of each failure surface, is shown in Table 2.
Taking the surface A 1 as an example to illustrate the formulation process of feasible process plans, through AHP the weight coefficients of each indicator are obtained as {material, shape, size, failure type, failure quantification} with ω = (0.12, 0.25, 0.15, 0.25, 0.23). The similarity threshold is set to 80%. After matching, three cases are obtained, as shown in Table 3.
After expert revision, A 1 is difficult to be grinded. The feasible process plans of A 1 is shown as Equation (21). Feasible processes of other failure surfaces of this used gearbox are shown as Table 4.
P A 1 = { r o u g h   t u r n i n g c o l d   w e l d i n g f i n e   t u r n i n g } o r { r o u g h   m i l l i n g l a s e r c l a d d i n g f i n e   m i l l i n g }

3.2. Multi-Objective Function Construction

According to the companies experiment, the cost and quality loss parameters of each feasible process plan for failure surfaces is shown in Table 5 (some of the cost parameters is dummy due to the sensitivities), the machining capability and kind of each process is shown in Table 6; the tolerance transfer coefficient is ξ i = ξ n e w = 1 , and the weight of the cost and quality loss is ω 1 = ω 2 = 0.5 . Therefore, the objective function of IDP-T is established according to Equations (8) and (14), and the constraint function is established according to Equations (15) and (16).

3.3. Optimization by BAS

According to Table 4, there are 16 ( 2 × 1 × 1 × 2 × 2 × 2 ) remanufacturing process combinations of this used gearbox that can be obtained. The process is coded as Pabc, in which a represents the serial number of failure surface, b represents the serial number of feasible process plan (shown in Table 4), c represents the serial number of process. The parameters of the BAS algorithm are set, as shown in Table 7.
Finally, the optimal IDP-T remanufacturing scheme for the used gearbox is shown in Table 8.

3.4. Comparison with Different Scheme

The original remanufacturing scheme of process and tolerance of this used gearbox is “highest matching process + original precision recovery”. With this scheme, the cost and quality loss is shown in Table 9. When optimal, the tolerance of the original scheme in the proposed method is achieved without changing process scheme. The cost and quality loss is shown in Table 10.
By comparison with Table 8, the scheme optimized in this paper has significantly reduced the cost and quality loss. The results indicate that the IDP-T optimization model is more effective in optimizing the process. Tolerance for remanufacturing is integrated.

4. Summary and Conclusions

An IDP-T method based on fault features is presented for remanufacturing, including failure description set establishment, feasible process plan generation, and process-tolerance scheme optimization. FTA and FCE are used to extract and quantify the failure types of the failure surfaces, and combines them with the attributes of the failure surfaces to construct the failure description set. Then, CBR is applied to generate feasible process plans for each of the failure surfaces; finally, IDP-T optimization model is established, and BAS is employed to select the optimal scheme. A used gear box is taken as an example, which proves the validity of the proposed methods.
In general, it may be concluded that the multi-objective optimization model with IDP-T, based on fault features for remanufacturing products, is more feasible and more effective than the traditional serial design in minimizing cost and quality loss. Without failure feature description and its integration with IDP-T, as well as optimization of this process, an optimization plan of process and tolerance for remanufacturing products may not sufficiently minimize cost and quality loss. To be specific, the same types of used product should be restored by different process-tolerance schemes due to the different failure features and damage degrees etc., by which the cost and quality loss of remanufacturing for used product will be decreased greatly. Moreover, other factors can influence the optimization plan of process-tolerance too, such as remaining life and environmental factors. Future research of IDP-T should take these factors into consideration.

Author Contributions

Conceptualization, Y.C. and Z.J.; methodology, Y.C. and W.Y.; software, Y.C.; validation, Y.C., H.Z. and W.Y.; formal analysis, Y.C. and W.Y.; investigation, Y.C.; resources, H.Z. and Z.J.; data curation, Y.C.; original draft preparation, Y.C.; review and editing, Y.C., Z.J. and H.Z.; supervision, Z.J. and H.Z.; project administration, Y.C. and Z.J.; funding acquisition, Y.C. All authors have read and agreed to the published version of the manuscript.

Funding

This research was funded by the National Natural Science Foundation of China (Nos. 51975432, 51905392, 52075396).

Institutional Review Board Statement

Not applicable.

Informed Consent Statement

Not applicable.

Data Availability Statement

Not applicable.

Conflicts of Interest

The authors declare no conflict of interest.

References

  1. Guide, V.D.R., Jr. Production planning and control for remanufacturing: Industry practice and research needs. J. Oper. Manag. 2000, 18, 467–483. [Google Scholar] [CrossRef]
  2. Zhang, X.G.; Zhang, M.Y.; Zhang, H.; Jiang, Z.G.; Liu, C.H.; Cai, W. A review on energy, environment and economic assessment in remanufacturing based on life cycle assessment method. J. Clean. Prod. 2020, 255, 120160. [Google Scholar] [CrossRef]
  3. Cai, W.; Li, L.; Jia, S.; Liu, C.; Xie, J.; Hu, L. Task-oriented energy benchmark of machining systems for energy-efficient production. Int. J. Precis. Eng. 2019, 7, 205–218. [Google Scholar] [CrossRef]
  4. Ijomah, W.L.; Mcmahon, C.A.; Hammond, G.P.; Newman, S.T. Development of design for remanufacturing guidelines to support sustainable manufacturing. Robot. Comput. Integr. Manuf. 2007, 23, 712–719. [Google Scholar] [CrossRef]
  5. Zhang, X.; Ao, X.; Jiang, Z.; Zhang, H.; Cai, W. A remanufacturing cost prediction model of used parts considering failure characteristics. Robot. Comput. Integr. Manuf. 2019, 59, 291–296. [Google Scholar] [CrossRef]
  6. Jiang, Z.G.; Wang, H.; Zhang, H.; Mendis, G.; Sutherland, J.W. Value recovery options portfolio optimization for remanufacturing end of life product. J. Clean. Prod. 2019, 210, 419–431. [Google Scholar] [CrossRef]
  7. Saravanan, A.; Jerald, J.; Rani, A.D.C. An explicit methodology for manufacturing cost–tolerance modeling and optimization using the neural network integrated with the genetic algorithm. AI EDAM 2020, 34, 430–443. [Google Scholar]
  8. Liu, S.G.; Jin, Q.; Dong, Y.H.; Wang, Y. A closed-form method for statistical tolerance allocation considering quality loss and different kinds of manufacturing cost functions. Int. J. Adv. Manuf. Tech. 2017, 93, 2801–2811. [Google Scholar] [CrossRef]
  9. He, Y.; Hao, C.P.; Wang, Y.L.; Li, Y.F. An ontology-based method of knowledge modelling for remanufacturing process planning. J. Clean. Prod. 2020, 258, 120952. [Google Scholar] [CrossRef]
  10. Jiang, Z.G.; Jiang, Y.; Wang, Y.; Zhang, H.; Cao, H.J.; Tian, G.D. A hybrid approach of rough set and case-based reasoning to remanufacturing process planning. J. Intell. Manuf. 2019, 30, 19–32. [Google Scholar] [CrossRef]
  11. Liu, M.Z.; Liu, C.H.; Xing, L.L.; Mei, F.D.; Zhang, X. Study on a tolerance grading allocation method under uncertainty and quality oriented for remanufactured parts. Int. J. Adv. Manuf. Tech. 2016, 87, 1265–1272. [Google Scholar] [CrossRef]
  12. Hu, J.; Zhang, Y.; Ge, M.G.; Liu, M.Z. Optimal control method on assembly precision for a remanufactured car engine based on state space model. Assem. Autom. 2016, 36, 460–472. [Google Scholar] [CrossRef]
  13. Mohamad, I.M.; Udisubakti, C.; Nani, K. A novel multi-criteria sorting model based on ahp-entropy grey clustering for dealing with uncertain incoming core quality in remanufacturing systems. Appl. Sci. 2020, 11, 2731. [Google Scholar]
  14. Du, Y.B.; Cao, H.J.; Liu, F.; Li, C.B.; Chen, X. An integrated method for evaluating the remanufacturability of used machine tool. J. Clean. Prod. 2012, 20, 82–91. [Google Scholar] [CrossRef]
  15. Zhang, X.F.; Gang, Y.; LIU, X. Product failure mode information transfer polychromatic model for design for remanufacture. J. Mech. Eng. 2017, 53, 201–208. [Google Scholar] [CrossRef]
  16. Wang, H.; Jiang, Z.G.; Zhang, X.G.; Wang, Y.N.; Wang, Y. A fault feature characterization based method for remanufacturing process planning optimization. J. Clean. Prod. 2017, 161, 708–719. [Google Scholar] [CrossRef]
  17. Liu, M.Z.; Liu, C.H.; Zhu, Q.H. Optional classification for reassembly methods with different precision remanufactured parts. Assem. Autom. 2014, 34, 315–322. [Google Scholar] [CrossRef]
  18. Liu, C.H. Tolerance redistributing of the reassembly dimensional chain on measure of uncertainty. Entropy 2016, 18, 348. [Google Scholar] [CrossRef] [Green Version]
  19. Liu, C.H.; Zhu, Q.H.; Wei, F.F.; Rao, W.Z.; Liu, J.J.; Hu, J.; Cai, W. A review on remanufacturing assembly management and technology. Int. J. Adv. Manuf. Technol. 2019, 105, 4797–4808. [Google Scholar] [CrossRef]
  20. Purba, J.H. Fuzzy probability on reliability study of nuclear power plant probabilistic safety assessment: A review. Prog. Nucl. Energ. 2014, 76, 73–80. [Google Scholar] [CrossRef]
  21. Ding, Z.Y.; Jiang, Z.G.; Zhang, H.; Cai, W.; Liu, Y. An integrated decision-making method for selecting machine tool guideways considering remanufacturability. Int. J. Comput. Integ. M. 2018, 33, 686–700. [Google Scholar] [CrossRef]
  22. Ding, D.H.; Pan, Z.X.; Cuiuri, D.; Li, H.J. A multi-bead overlapping model for robotic wire and arc additive manufacturing (WAAM). Robot. Comput. Integr. Manuf. 2015, 31, 101–110. [Google Scholar] [CrossRef] [Green Version]
  23. Jhavar, S.; Paul, C.P.; Jain, N.K. Micro-plasma transferred arc additive manufacturing for die and mold surface remanufacturing. JOM 2016, 68, 1801–1809. [Google Scholar] [CrossRef]
  24. Jiang, X.Y.; Li, S. BAS: Beetle antennae search algorithm for optimization problems. IJRC 2018, 1, 1–5. [Google Scholar] [CrossRef]
  25. Cheng, Y.Z.; Li, C.X.; Li, S.; Li, Z. Motion planning of redundant manipulator with variable joint velocity limit based on beetle antennae search algorithm. IEEE Access 2020, 8, 138788–138799. [Google Scholar] [CrossRef]
Figure 1. Framework of IDP-T for remanufacturing.
Applsci 11 06377 g001
Figure 2. Fault feature extract of failure surface by FTA.
Applsci 11 06377 g002
Figure 3. The framework of feasible process plans generation based on CBR.
Applsci 11 06377 g003
Figure 4. IDP-T optimization framework based on BAS.
Applsci 11 06377 g004
Figure 5. The structure and composition number of a used gearbox.
Applsci 11 06377 g005
Figure 6. The dimension chain of a used gearbox.
Applsci 11 06377 g006
Figure 7. Failure feature type of a used gearbox identified by FTA.
Applsci 11 06377 g007
Table 1. The failure quantification standard of used gearbox.
Failure FeatureVolumetric Damage Amount IntervalQuantified Score
Equation
Quantified Score
Interval [0, 10]
Wear0----0
0 x 1.5   mm q = x 0 1.5 0 × 5 ( 0 , 5 )
1.5   mm x 3.0   mm q = x   1.5 3.0 1.5 × 5 + 5 [ 5 , 10 )
x 3.0   mm 1010
Corrosion0----0
0 x 1.3   mm q = x 0 1.3 0 × 5 ( 0 , 5 )
1.3   mm x 2.6   mm q = x 1.3 2.6 1.3 × 5 + 5 [ 5 , 10 )
x 2.6   mm 1010
Crack0----0
0 x 1.5   mm q = x 0 1.5 0 × 5 ( 0 , 5 )
1.5   mm x 3.0   mm q = x 1.5 3.0 1.5 × 5 + 5 [ 5 , 10 )
x 3.0   mm 1010
Table 2. Characteristics set of each failure surface of a used gearbox for CBR.
Surface No. { a i }   { f i }
m i   s i   d i   t i   q i  
A 1 HT250Torus plane0.4Impact crack2.07
A 3 HT250Square ring plane0.8Fretting wear3.20
A 4 HT250Square ring plane0.8Fretting wear3.88
A 5 HT250Torus plane0.4Fatigue crack1.43
A 8 45#Torus plane0.2Fatigue wear1.07
A 9 45#Torus plane0.2Chemical corrosion1.65
Table 3. The feasible process plans of surface A1.
Case No. { a i } { f i } Sim(N,E)Process Plan
m i s i d i t i q i
1#Gray ironTorus plane0.6Impact crack2.4694.5%rough turning-cold welding-fine turning
2#Gray ironTorus plane0.8Impact crack3.2387.2%rough milling-laser cladding-fine milling
3#Gray ironTorus plane0.5Impact crack4.1584.7%rough grinding
-cold welding-fine grinding
Table 4. Feasible process plans of each failure surfaces of a used gearbox.
Surfaces No.Feasible Process Plans
A 1 1 :   r o u g h   t u r n i n g c o l d   w e l d i n g f i n e   t u r n i n g
2 : r o u g h   m i l l i n g   l a s e r c l a d d i n g   f i n e   m i l l i n g
A 3 1 : r o u g h   m i l l i n g b e a d   w e l d i n g f i n e   m i l l i n g
A 4 1 : r o u g h   m i l l i n g b e a d   w e l d i n g f i n e   m i l l i n g
A 5 1 : r o u g h   t u r n i n g c o l d   w e l d i n g f i n e   t u r n i n g
2 : r o u g h   m i l l i n g   l a s e r c l a d d i n g   f i n e   m i l l i n g
A 8 1 : r o u g h   g r i n d i n g   c h r o m i u m   p l a t i n g f i n e   g r i n d i n g
2 : r o u g h   t u r n i n g e l e c t r i c a r c s p r a y i n g   f i n e   t u r n i n g
A 9 1 : r o u g h   g r i n d i n g   t h e r m a l   s p r a y i n g f i n e   g r i n d i n g
2 : r o u g h   t u r n i n g e l e c t r i c a r c s p r a y i n g   f i n e   t u r n i n g
Table 5. The parameter of each feasible process plans of a used gearbox.
Surfaces No.Process No. a 0
r m b
a 1
r m b
K
r m b · m m 2
Surfaces No.Process No. a 0
r m b
a 1
r m b
K
r m b · m m 2
A 1 r o u g h   t u r n i n g
P111
9.720.0401510 A 1 r o u g h   m i l l i n g
P121
10.020.0381630
c o l d   w e l d i n g
P112
14.64 2310 l a s e r c l a d d i n g
P122
16.75 2550
f i n e   t u r n i n g
P113
15.340.0122560 f i n e   m i l l i n g
P123
11.360.01052750
A 3 r o u g h   m i l l i n g
P311
12.610.0471780 A 4 r o u g h   m i l l i n g
P411
14.530.0513300
b e a d   w e l d i n g
P312
28.25 1980 b e a d   w e l d i n g
P412
20.32 3240
f i n e   m i l l i n g
P313
19.650.01032320 f i n e   m i l l i n g
P413
20.720.01053730
A 5 r o u g h   t u r n i n g
P511
9.720.03703950 A 5 r o u g h   m i l l i n g
P521
10.020.0363160
c o l d   w e l d i n g
P512
17.45 3460 l a s e r c l a d d i n g
P522
18.84 3180
f i n e   t u r n i n g
P513
15.340.01203800 f i n e   m i l l i n g
P523
12.460.01182980
A 8 r o u g h   g r i n d i n g
P812
11.910.0445000 A 8 r o u g h   t u r n i n g
P821
10.380.0425330
c h r o m i u m   p l a t i n g
P812
25.00 6420 e l e c t r i c a r c s p r a y i n g
P822
22.96 5960
f i n e   g r i n d i n g
P813
18.310.01085200 f i n e   t u r n i n g
P823
15.610.01024960
A 9 r o u g h   g r i n d i n g
P911
9.720.0401510 A 9 r o u g h   t u r n i n g
P921
10.020.0381630
t h e r m a l   s p r a y i n g
P912
14.64 2310 e l e c t r i c a r c s p r a y i n g
P922
16.75 2550
f i n e   g r i n d i n g
P913
15.340.0122560 f i n e   t u r n i n g
P923
11.360.01052750
Table 6. Machining capability of each process.
Removal Process (j−)Rough MachiningFinish MachiningAdditive Process (j+)Deviation Coefficient
turning0.072–0.1200.020–0.069cold welding7.3%
bead welding5.5%
milling0.050–0.1000.018–0.050laser cladding4.5%
chromium plating3.8%
grinding0.054–0.0720.016–0.052thermal spraying4.2%
electric arc spraying4.9%
Table 7. Related parameter values in the operation of BAS.
L s t e p d 0 e t a n p
110.951000.0001
Table 8. Optimal IDP-T scheme of a used gearbox by BAS.
Surfaces No.Process (Tolerance)CostQuality Loss
A 1 P111(0.078)→P112(0.045)→P113(0.047)393.8177.94
A 3 P311(0.075)→P312(0.053)→P313(0.044)
A 4 P411(0.080)→P412(0.064)→P413(0.041)
A 5 P521(0.086)→P522(0.019)→P523(0.050)
A 8 P821(0.063)→P822(0.016)→P823(0.030)
A 9 P911(0.067)→P912(0.021)→P913(0.029)
Table 9. Original scheme of a used gearbox.
Surfaces No.Process (Tolerance)CostQuality Loss
A 1 P111(0.120)→P112(0.045)→P113(0.040)418.7265.1
A 3 P311(0.100)→P312(0.053)→P313(0.040)
A 4 P411(0.100)→P412(0.064)→P413(0.040)
A 5 P511(0.120)→P512(0.031)→P513(0.040)
A 8 P811(0.072)→P812(0.012)→P813(0.020)
A 9 P911(0.072)→P912(0.021)→P913(0.020)
Table 10. Tolerance optimal scheme of a used gearbox.
Surfaces No.Process (Tolerance)CostQuality Loss
A 1 P111(0.116)→P112(0.045)→P113(0.055)415.6200.8
A 3 P311(0.079)→P312(0.053)→P313(0.048)
A 4 P411(0.076)→P412(0.064)→P413(0.043)
A 5 P511(0.085)→P512(0.031)→P513(0.051)
A 8 P811(0.071)→P812(0.012)→P813(0.032)
A 9 P911(0.070)→P912(0.021)→P913(0.031)
Publisher’s Note: MDPI stays neutral with regard to jurisdictional claims in published maps and institutional affiliations.

