Abstract
This paper presents a case study of three-phase ferroresonance in a low-voltage power factor correction system and investigates the influence of harmonic distortion on the occurrence of ferroresonance. Ferroresonance is an extremely dangerous and rare phenomenon that causes overvoltages and overcurrents in the system and degrades the power quality. The study is carried out on real field measurements in an industrial plant where ferroresonance occurs in the power factor correction (PFC) system at the detuned reactor. The three-phase ferroresonance analysed in this paper is an extremely rare phenomenon that has never been reported in this type of configuration. The measurement results have shown that in this type of configuration the high harmonic distortion is a necessary condition for ferroresonance to occur. In such conditions, switching on the capacitor stage triggers the ferroresonance with quasi-periodic oscillations supported by the medium voltage grid. The main contribution is the analysis of the three-phase ferroresonance in the detuned PFC system and the influence of the harmonics on the occurrence of the ferroresonance in such a case. The possible solutions to this problem and recommendations to avoid this phenomenon are discussed.
1. Introduction
Due to the increasing number of nonlinear loads, current and voltage harmonics are becoming more common in power systems [1,2]. Nonlinear loads inject current harmonics into the power system, resulting in voltage harmonics at the system impedances [2,3]. The distorted voltage affects all linear and nonlinear loads connected to the power system. In general, current and voltage harmonics cause various problems ranging from minor to severe. For power systems to function properly, voltage and current harmonics must be limited. Limits are defined by standards, grid codes, and regulations in each country [4,5]. The limits define the maximum voltage and/or current harmonics for public distribution systems, but each industrial facility is responsible for the limits within the facility [6]. Numerous examples from industry show that compliance with limits within the industrial facility does not guarantee elimination of problems associated with harmonics. Current and voltage harmonics cause numerous problems such as increased losses on busses, lines, and electrical machines [7], reduction in power factor, overheating and/or complete damage to conventional PFC devices, reduced efficiency, audible noise, undesirable operation of protective devices, difficulties with sensitive devices, parallel and series resonances [1,8,9,10], etc. Moreover, rare and dangerous phenomena due to harmonics may occur in practice, which are not reported in the literature. In this paper, an example of such a phenomenon, a three-phase ferroresonance of the detuned reactor triggered by switching on the capacitor stage of the automatic detuned PFC system in an industrial plant with high harmonic content, is analyzed.
Ferroresonance is a rare nonlinear phenomenon in which energy oscillates between a capacitive element and a nonlinear inductive element that alternately goes into saturation. During ferroresonance, high voltages and currents with abnormal waveforms and harmonic content occur [11,12]. Ferroresonance can be triggered by a variety of transient events that cause the system to jump from a stable steady state to the ferroresonant steady state. The phenomenon of ferroresonance is complex to analyze and predict due to its nonlinearity and sensitivity to small changes in the system parameters and initial conditions [13]. As a result, repeatability in simulations and experimental studies is rare [14]. Numerous examples of ferroresonance in practice have been reported [12,15,16,17], while the electrical system configurations in which ferroresonance may occur are identified as follows: [18,19]: (a) voltage transformer energized through the grading capacitance of open circuit breakers, (b) voltage transformer connected to an ungrounded neutral system, (c) capacitor voltage transformer, (d) power transformer supplied accidentally on one or two phases, (e) power transformer, fed through a long transmission cable with low short-circuit power, (f) power transformer connected to a compensated transmission line connected in series, (g) power transformer connected to a de-energized transmission line running in parallel with an energized line, and (h) inductive neutral networks. However, the ferroresonance triggered by the three-phase opening/closing of the circuit breaker is extremely rare [20,21]. Recent studies are concerned with modeling phenomena [22,23,24], protective measures to prevent the occurrence of ferroresonance [25,26,27], reporting of new cases [28,29] and types of ferroresonance [30].
This paper analyzes the three-phase ferroresonance of the detuned reactor of the PFC system in an industrial plant, which is triggered by the switching on of the capacitor stage and affected by harmonic distortions. To the best of the author’s knowledge, this phenomenon has not yet been reported in the literature. Automatic detuned PFC systems are used for reactive power compensation in systems with high harmonic content [31]. They consist of several capacitor stages, which are automatically switched in by the PFC controller to keep the displacement factor () at the set point. Detuned reactors are connected in series to the power factor correction capacitors to prevent resonance, protect the capacitors and partially filter the current harmonics. The inductance value of the detuned reactor is selected so that the resonant frequency of an LC circuit is far away from the harmonic frequencies present in the power system.
The measurement study presented in this paper was triggered by strange occurrences in the industrial plant after replacing two conventional drives with variable speed drives. The industrial plant operators noticed a loud audible noise in the detuned reactors of the PFC system and overheating of the detuned reactors, which visibly damaged the insulation of the reactors. This occurred under various operating conditions and could not be attributed to any particular configuration or operating condition. The main objective of the measurement study was to uncover the cause of the audible noise and overheating of the detuned reactors, show how replacing the conventional drives with variable speed drives affected this occurrence, and propose a solution to prevent it. Numerous real field tests were carried out in the transformer station with different operating conditions, and the results of the analysis are discussed in this paper.
The experimental results show that the audible noise and overheating of the detuned reactors are caused by ferroresonance. In addition, the level of voltage harmonic distortion on the low voltage busbar affects the occurrence of ferroresonance. The change from conventional drives to variable speed drives resulted in sufficiently high harmonic distortion on the low voltage busbar at some operating points to cause the occurrence of ferroresonance. When the harmonic content on the low voltage side is high, the switching on of the capacitor stage causes the ferroresonance at the detuned reactor supported by the medium voltage system. During the ferroresonance, the harmonic distortions of the voltages and currents on the low voltage and medium voltage busbars are high, and the detuned reactor and PFC capacitor exhibit overvoltages and overcurrents. In this paper, the voltage and current waveforms on the low-voltage and medium-voltage side before and during the ferroresonance are analyzed, and the possible solutions to avoid the ferroresonance are discussed.
The paper is organized as follows. Section 2 gives a theoretical overview of ferroresonance. Section 3 describes the system studied and the conditions under which ferroresonance occurs. Section 4 presents presents the case study results, gives the analysis of the currents and voltages in the industrial plant under ferroresonance, and analyzes the influence of harmonic distortion on ferroresonance. The conclusion is given in the Section 5.
2. Ferroresonance
Ferroresonance is a complex nonlinear phenomenon that occurs rarely and is difficult to predict [12,16,21,32]. Ferroresonance can occur in electrical networks where there is an inductive element that can go into saturation ( reactor, transformer), a capacitive element (capacitor, cables, long lines), an AC source, and low damping (light load or no load) [12,21,33]. In ferroresonance, energy oscillates back and forth between the capacitive element and the nonlinear inductive element, which alternately saturates. As a result, large overcurrents and overvoltages occur with abnormal waveforms and high harmonic content, which are dangerous and can damage equipment.
Since the core of the inductive element is made of ferromagnetic material, the inductance is nonlinear and decreases sharply in saturation, which increases the magnetizing current. The magnetizing current can include both even and odd harmonics and harmonics that are not multiples of the fundamental. When the core is driven into saturation, the nonlinear circuit can have multiple values of the inductances, so that ferroresonance can occur for a wide range of system parameters (large range of values C), which is shown in Figure 1 [14]. The voltage of the inductive element is described by:
where is the inductor voltage, I is the current in the series circuit, U is the supply voltage, is the frequency of the supply voltage, and C is the capacitance. The frequency of currents and voltages in ferroresonance may be different from the frequency of the source and need not be expressed in terms of the resonant frequency [12].
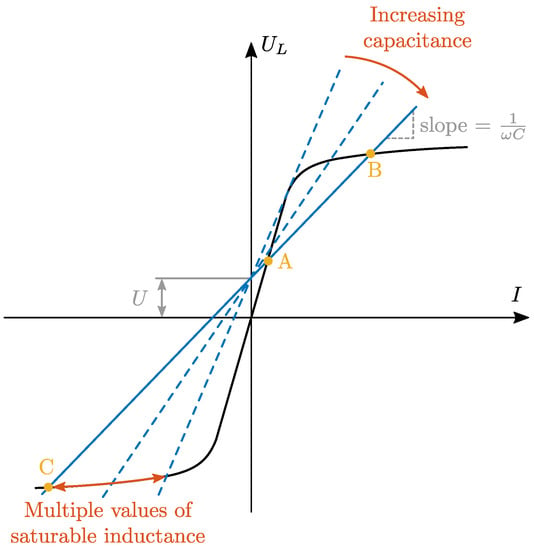
Figure 1.
Graphical view of ferroresonance circuit.
In ferroresonance, there are multiple stable states for the same configuration and set of system parameters, one of which is the allowed state (linear behavior), and other states involve ferroresonance [12,16,21]. For ferroresonance to occur, ferroresonance conditions must exist, and an event must occur that triggers a jump from an allowed steady-state to a ferroresonance state. Various network events such as transients, switching on and off transformers and loads, switching of compensation stages, faults, etc., can trigger the ferroresonance. The ferroresonance is very sensitive to initial conditions (switching time, residual flux in the core, harmonics in the network, the initial voltage at the capacitor, etc.) and system parameter values that determine in which of the possible steady states the system will end [12,14].
In the steady states of ferroresonance, the energy oscillations between the capacitance and the nonlinear inductance can take four different types, and the resonant frequency need not be specified [21,34]. Possible modes of oscillation of the ferroresonance, i.e., possible steady states of the ferroresonance, are [12]
- fundamental oscillation,
- subharmonic oscillation,
- quasi-periodic oscillation,
- chaotic oscillation.
The characteristics of the fundamental oscillation are shown in Figure 2. Voltages and currents are periodic signals with the same period as the fundamental components. The spectrum is discontinuous and consists of the fundamental and its multiples.

Figure 2.
Ferroresonance characteristics for fundamental oscillations.
The characteristics of the subharmonic mode are shown in Figure 3. Voltages and currents are periodic signals with a period that is a multiple of the period of the fundamental component. The spectrum is discontinuous and consists of submultiples of the fundamental, with the fundamental also being part of the spectrum.

Figure 3.
Ferroresonance characteristics for subharmonic oscillations.
The characteristics of the quasi-periodic mode are shown in Figure 4. Voltages and currents are not periodic signals. The spectrum is discontinuous with frequencies that are not multiples.

Figure 4.
Ferroresonance characteristics for quasi-periodic oscillations.
The characteristics of the chaotic mode are shown in Figure 5. Voltages and currents are not periodic signals. The spectrum is continuous.

Figure 5.
Ferroresonance characteristics for chaotic oscillations.
The losses of modern power systems (transformers, contactors, loads, etc.) are reduced, and as a result there is not enough load to attenuate the ferroresonance. This makes the occurrence of ferroresonance more likely today than in the past [11,15,32]. In general, nonlinear systems theory and chaos are used to analyze ferroresonance, as well as bifurcation diagrams and Poincare mappings [21,32].
3. System Description
The case study presented in this paper is conducted on the low voltage and medium voltage side of the transformer station in an industrial plant. The transformer station, the operating conditions in which ferroresonance occurs, and the measurement setup are described below.
3.1. Transformer Station
The low voltage side of the transformer station can be supplied by up to three identical transformers (T1, T2, T3) which are always connected in parallel. The nominal values of the transformers are given in Table A1 in Appendix A. Depending on the load, the low voltage side is always supplied by two or three transformers. An automatic detuned PFC system is connected to the low voltage side of each transformer. Linear and nonlinear loads are connected to the low voltage busbar. The majority of the linear and nonlinear loads are compressor drives. Fixed speed compressor drives are linear loads and variable speed compressor drives are nonlinear loads. All variable speed compressor drives have a frequency converter with a three-phase diode bridge rectifier as the front-end topology and input reactor. Therefore, all variable speed drives inject the allowable values of current harmonics into the power system. Fixed speed compressor drives connected to the low voltage busbar range from 200 kW to 650 kW, variable speed compressor drives range from 45 kW to 200 kW, and fixed speed compressor drives connected to the medium voltage busbar range from 600 kW to 700 kW. The total connected load to the low voltage busbar is 3.3 MW, of which 1.1 MW are nonlinear loads, 1.6 MW are linear loads and 0.6 MW are other small loads whose harmonic injection can be neglected. On the medium voltage side, only linear loads (medium voltage induction motors with individual compensation) are connected. The schematic diagram of the transformer station with measurement points marked in red is shown in Figure 6. Only measurement points are marked whose results are given in Section 4.
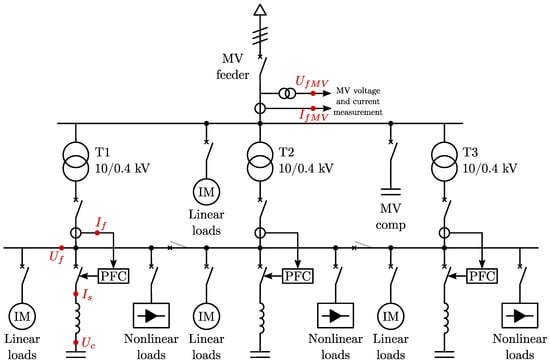
Figure 6.
Single-line diagram of the transformer station with marked measurement points.
Each of the automatic detuned PFC systems consists of seven capacitor stages and a PFC controller that switches the stages on or off depending on settings and measurements. The stages can also be switched on and off manually. Each capacitor stage consists of associated fuses, contactor, capacitor and detuned reactor with a detuning factor of 5.67% (210 Hz series resonant frequency). The rated reactive power of each of the first five stages is 49.2 kvar and each of the remaining two stages is 24.6 kvar. Therefore, the rated reactive power of each automatic detuned PFC system is 295.2 kvar. Each PFC controller measures the current and voltage of the associated transformer and has a displacement factor set point of . The single-line diagram of the of the automatic detuned PFC system is shown in Figure 7. The capacitor ratings are given in Table A2 and the reactor ratings are given in Table A3 and Table A4.
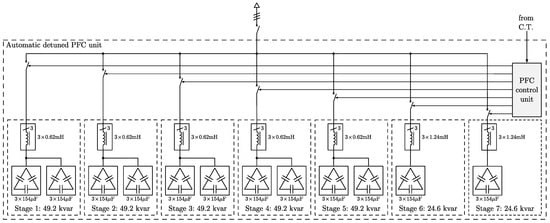
Figure 7.
Single-line diagram of the automatic detuned PFC system.
3.2. Operating Conditions
The transformer station operates at different operating points with different load requirements. Depending on the load requirement, the low voltage side is supplied by two or three transformers connected in parallel. At different operating points, the ratio of nonlinear and linear loads to the total power demand is different.
When the nonlinear loads constitute the majority of the loads, the harmonic distortion on the low voltage side is high, but still below the limits. However, the experimental results have confirmed that under such conditions, switching on the capacitor stage triggers the ferroresonance of the detuned reactor, which is supported by the power system. In contrast, the capacitor stages switched on before the transition from the low-distortion to the high-distortion operating point do not enter the ferroresonance, but exhibit high current harmonics in the steady state. Although the stage current is lower than the rated value, the fifth harmonic current is higher than the rated values of detuned reactors given in Table A3 and Table A4, which is not acceptable. This is due to the high value of the fifth voltage harmonic at the low-voltage busbar at these operating points, which is caused by the injection of the fifth harmonic current from variable-speed drives, and the resonant frequency of the detuned reactor and power correction capacitor (210 Hz), which is very close to the fifth harmonic. Therefore, the phenomenon of ferroresonance in the transformer station occurs under certain levels of harmonic distortion, and different ratios of linear and nonlinear loads can form the conditions under which ferroresonance can be triggered. To analyze this phenomenon in more detail, the measurement results under two different operating points are presented and analyzed: Case 1 (C1), where the conditions for ferroresonance are not met, and Case 2 (C2), where the conditions for ferroresonance are met and ferroresonance occurs when the stage is switched on.
Case C1 is analyzed as a reference point for normal operating conditions, where the harmonic distortion of the bus voltage is lower. In C1, the low voltage side of the transformer station is supplied by three transformers connected in parallel. The total nonlinear load demand is about 500 kW, which is less than 30% of the total power demand. In C1, the capacitor stages can be switched on and off and no ferroresonance occurs.
Ferroresonance occurs at operating conditions in C2 where the harmonic distortion of the bus voltage is high. In C2, the low voltage side of the transformer station is supplied by two transformers connected in parallel, and the third transformer is disconnected. The total demand of the nonlinear loads is about 700 kW, which is more than 50% of the total power demand. In C2, switching on the capacitor stages triggers the undamped ferroresonance supported by the grid. In this case, the ferroresonance can only be stopped by switching off the capacitor stage under ferroresonance. Capacitor stages which are switched on before operating state C2 is reached do not go into ferroresonance but exhibit fifth harmonic current overload.
3.3. Measurement Setup
Voltage and current waveforms were recorded using the two DEWESOFT SIRIUS synchronized acquisition systems, which comply with the IEC 61000-4-30 class A standard. Currents were measured with Rogowski coils and current clamps via the high-speed low voltage input (HS-ACC), while voltages were measured directly via the high-speed high voltage input (HS-HV). The sampling frequency was 20 kHz. The general data are as follows:
DEWESOFT SIRIUS: 4xHS-HV, 4xHS-ACC, ADC type: 16-bit SAR, sampling rate: up to 1 MS/s simultaneously
SIRIUS HS-HV: range: ±800 V, bandwidth: 2 MHz, accuracy up to 10 kHz: ±0.1% of reading ±0.05% of range
SIRIUS HS-ACC: range: ±1 V, bandwidth: 500 kHz, accuracy: ±0.05% of reading ±0.02% of range
Rogowski coils: range: ±30\±300\±3000 A, 100\10\1 mV/A, accuracy: ±1% of range, 10 Hz–50 kHz
DC/AC current clamps: range: ±140\±1400 A, 10\1 mV/A, accuracy: ±1.5% of reading, DC—10 kHz
AC current clamps: range: ±5 A, 0.2 V/A, accuracy: 5 mA–0.5 A ±2% of reading, 0.5 A–1 A ±1% of reading, 1–12 A ±0.5% of reading, 2 Hz–10 kHz
Related to Figure 6, the secondary voltage of transformer T1 and the capacitor voltage were measured directly at the inputs HS–HV. The reactor voltage for each phase was calculated in the data acquisition software DewesoftX as:
The medium voltage was measured at the inputs HS–HV from the second secondary of the voltage instrument transformers installed on the MV busbar. The ratings of the voltage instrument transformers are 10///0.1///0.1/3, Yynd, 0.5/3P, 25 VA, 6P, 25 VA. The first secondary is normally used for operation and protection measurement, while the second is in open delta connection.
The secondary current of transformer T1 was measured at the inputs HS–ACC with AC current clamps and installed current transformer 2000/1 A, 15 VA. The medium voltage feeder current was measured at the inputs HS–ACC with AC current clamps and installed double core current transformer 400/1/1 A, 5P10, 10 VA, 0.5Fs10, 10 VA. The stage current was measured at the inputs HS–ACC with Rogowski coils and DC/AC current clamps.
The reactor flux for each phase was calculated in DewesoftX data acquisition software as an integral of the reactor voltage. A low-pass filter was used instead of the pure integrator to eliminate drift problems and the need for initial values [35]. The gain of the low-pass filter was adjusted to achieve the same behavior in the high-frequency region as the integrator. The transfer function in the contoinus time domain is given as:
where is the cut-off frequency set at rad/s.
4. Experimental Results and Discussion
The detailed measurement study was carried out under different operating conditions, and the experimental results for two operating points (C1—where the conditions for ferroresonance are not present and C2—where the conditions for ferroresonance are met) are presented in this paper. Voltage and current waveforms and electrical quantities on the low voltage and medium voltage sides of the transformer station are given for both operating points. The capacitor and reactor voltages and the stage current are also given. Based on the calculated reactor voltage, the reactor flux is calculated and evaluated. The subsequent data processing and further calculations are carried out in MATLAB.
In the presented measurement study, the stage 3 of PFC system of transformer T1 was manually controlled (switched on and off) while the PFC controller automatically controlled the other PFC systems. The transformer current, transformer voltage, stage current and capacitor voltage were measured while the reactor voltage and flux were calculated. The currents of all significant loads connected to the low voltage side of the transformer station were also measured, but since they do not support ferroresonance, they are not presented in this paper.
4.1. Experimental Results for C1
Case C1 represents the normal operation, where current and voltage waveforms, electrical quantities and harmonic distortions of the studied system are analyzed under normal operating conditions. The experimental results for C1 are given as follows.
The steady-state data for the low-voltage side of the transformer station when the capacitor stage is switched on and off are given in Table 1. The voltage and current waveforms of transformer T1 are distorted as shown in Figure 8. In C1, transformers T1, T2, and T3 are on, and since they have the same ratings and operate in parallel, it can be assumed that the same conclusions apply to T2 and T3. Therefore, the secondary voltage of the transformers is distorted and the current waveform is typical of a system with three-phase diode bridge rectifiers. The value of is acceptable by industrial standards. After switching on the capacitor stage, the harmonic distortion of voltage and current has decreased because the capacitor stage partially filters the current harmonics.

Table 1.
C1: Electrical quantities on the low-voltage side of the transformer station.
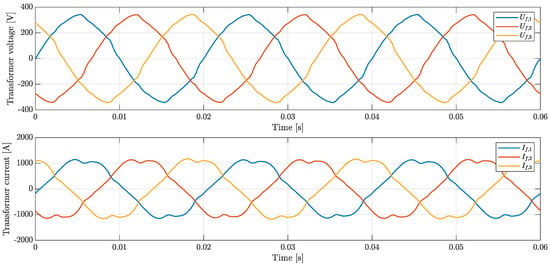
Figure 8.
C1—Secondary voltage and current of transformer T1 before switching on the capacitor stage.
The voltage and current waveforms of the transformer T1, the reactor and the capacitor of the switched-on stage during switch-on are shown in Figure 9. When the capacitor stage is switched on, the reactor goes into saturation and the maximum values of the stage current reach values up to 15 times the nominal value. The transient state lasts less than 50 ms, after which the reactor reaches the normal operating state.
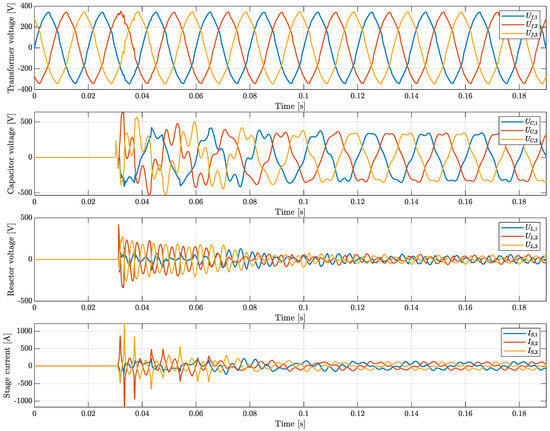
Figure 9.
C1—Transformer secondary voltage, capacitor voltage, reactor voltage and stage current when the stage is switched on.
The reactor voltage, capacitor voltage, and stage current in the steady state after the stage is switched on are shown in Figure 10. The stage current is , and . The stage current is distorted because the series LC circuit filters some of the current harmonics. The highest harmonic in the stage current is the 5th harmonic.
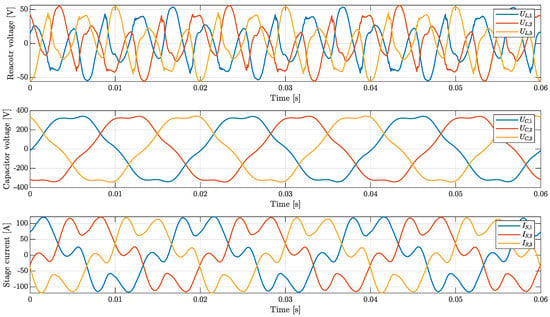
Figure 10.
C1—Capacitor voltage, reactor voltage and stage current after the stage is switched on.
The spectrum of reactor voltage, capacitor voltage and stage current is shown in Figure 11. The harmonic magnitudes are given as a percentage of the fundamental and the scale is logarithmic. It can be seen that the 5th and 7th harmonics of the stage current have significant values. The current of the 5th harmonic is .

Figure 11.
C1—Harmonic spectrum of reactor voltage, capacitor voltage and stage current in normal steady state.
The measurement study was also performed on the medium voltage side of the transformers. The waveforms of the voltage and current of the medium voltage feeder are also distorted, as shown in Figure 12. The total harmonic distortion (THD) of the current is % and the THD of the voltage is %. The harmonic distortion on the medium voltage side is lower than that on the low voltage side, which is expected since the current harmonic sources are connected to the low voltage side of the transformer station.
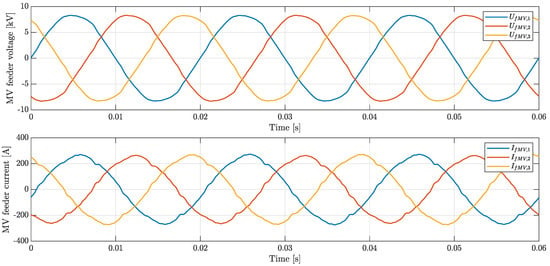
Figure 12.
C1—Medium voltage feeder voltage and current after switching on the capacitor stage.
4.2. Experimental Results for C2
Case C2 represents an operating point where the conditions for ferroresonance are satisfied, and ferroresonance occurs when the capacitor stage is switched on. The current and voltage waveforms, electrical quantities, and harmonic distortions of the studied system are analyzed with and without ferroresonance. The experimental results for C2 are given as follows.
The steady-state data when the capacitor stage is switched on and off are given in Table 2. Before the capacitor stage is switched on, the transformer voltage and current harmonic distortions are high, as shown in Figure 13. After the capacitor stage is switched on, the voltage and current harmonic distortions are increased due to ferroresonance, as shown in Figure 14. In the presence of ferroresonance, the voltage and current waveforms are highly distorted.

Table 2.
C2: Electrical quantities on the low-voltage side of the transformer station.
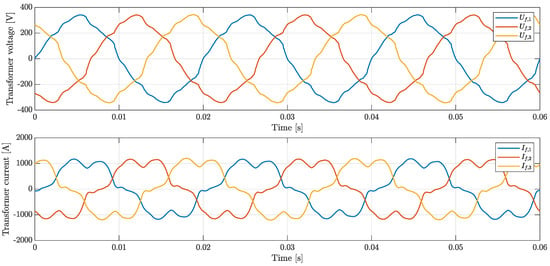
Figure 13.
C2—Secondary voltage and current of transformer T1 before switching on the capacitor stage.
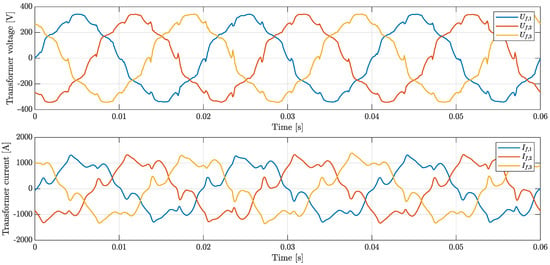
Figure 14.
C2—Secondary voltage and current of transformer T1 after switching on the capacitor stage.
Before the ferroresonance was triggered, the high harmonic content of the transformer current with significant values of the 5th, 7th, and 11th harmonics was present. In the presence of the ferroresonance, other even and odd harmonics occurred, and the current of the 5th harmonic changed direction. Figure 15 shows the vector diagram of the 5th harmonic of the secondary voltage and secondary current of transformer T1 before and after the capacitor stage was switched on. Before switching on the stage, the current of the 5th harmonic of the transformer was and flowed into the medium voltage grid. After switching on the stage, the current of the 5th harmonic of the transformer was and flowed from the medium voltage grid to the low voltage side of the transformer station.
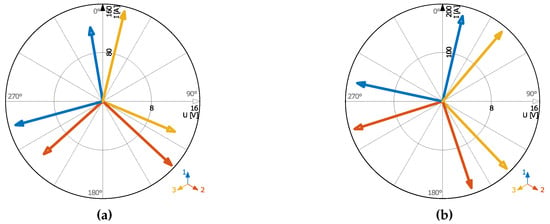
Figure 15.
C2—Vector diagram of 5th harmonic of the secondary voltage and current of transformer T1 (a) before and (b) after switching on the capacitor stage.
The voltage waveforms of transformer T1, reactor, and capacitor, and the current of the capacitor stage when the stage is switched on are shown in Figure 16. When the capacitor stage is switched on, the reactor goes into saturation, and the maximum values of the reactor current reach values that are about 15 times the nominal value. Unlike in C1, the reactor and capacitor remain in ferroresonance after the capacitor stage is switched on, supported by the grid. In this condition, the capacitor and detuned reactor are overloaded, resulting in high audible noise from the reactor and overheating of both components. Operation with ferroresonance is dangerous for the industrial equipment. RMS value of detuned reactor current is , the maximum peak value of reactor current is , and the current THD is 387.3%. The RMS value of the reactor voltage is , and the maximum peak value of the reactor voltage is .
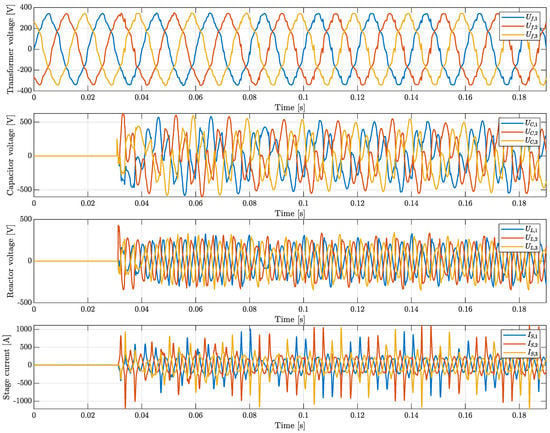
Figure 16.
C2—Transformer secondary voltage, capacitor voltage, reactor voltage and capacitor stage current when the stage is switched on.
The waveforms of the reactor voltage, the capacitor voltage, and the capacitor stage current in the steady state of the ferroresonance are shown in Figure 17. The stage current is highly distorted, which is a consequence of the deep saturation of the reactor. The maximum stage current reaches , and the maximum reactor voltage reaches . According to [12], the current waveform exhibits quasi-periodic oscillations.
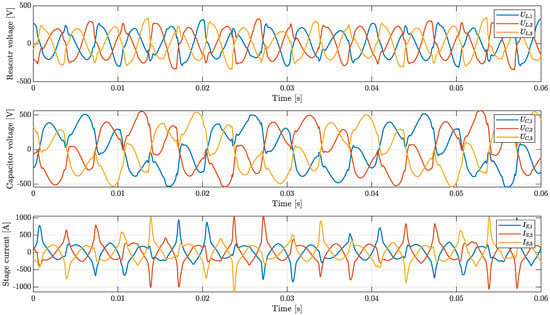
Figure 17.
C2—Capacitor voltage, reactor voltage and stage current after the stage is switched on.
The harmonic spectrum of reactor voltage, capacitor voltage and stage current is shown in Figure 18. Compared with the spectrum in Figure 11, which is given for the normal steady state, the harmonic content of the voltages and currents is much higher. It can be seen that the current harmonics of the stage current have enormous values. The 5th harmonic of the stage current is , while the 7th harmonic is . Since the ferroresonance can occur at different frequencies, the spectrum should be further analyzed in the continuous domain.

Figure 18.
C2—Harmonic spectrum of reactor voltage, capacitor voltage and stage current in ferroresonance steady state.
Figure 19 shows how the reactor magnetic flux depends on the reactor current at steady state in C2. The hysteresis shows that during the ferroresonance all three phases of the detuned reactor go into saturation.

Figure 19.
C2—Hysteresis loop of reactor.
The voltage and current waveforms of the medium voltage feeder are shown in Figure 20. The voltage and current waveforms are more distorted than those shown for C1. The distortion of the current is % and the distortion of the voltage is %. Figure 21 shows the vector diagram of the 5th harmonic voltage and current of the medium voltage feeder before and after the capacitor stage was switched on. Before the stage was switched on, the 5th harmonic current was and flowed into the medium voltage grid, and after the stage was switched on, the 5th harmonic current was 12.6 A and flowed from the medium voltage grid to the transformer station. The ferroresonance distorted the currents and voltages on the medium voltage side, which confirms that the power system supports the ferroresonance.
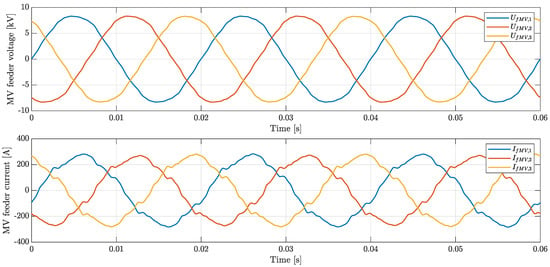
Figure 20.
C2—Medium voltage feeder voltage and current in ferroresonance steady state.
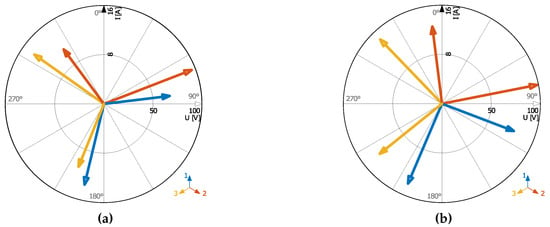
Figure 21.
C2—Vector diagram of 5th harmonic of the medium voltage feeder voltage and current (a) before and (b) after switching on the capacitor stage.
The ferroresonance in C2 was triggered by switching on the capacitor stage. The capacitor stages switched on before reaching C2 operate under normal conditions. Figure 22 shows the voltage and current of transformer T1 and the stage current in C2 when the ferroresonance is not triggered. The stage current waveform is typical, but the harmonic spectrum shows the high value of the 5th harmonic. The RMS value of the stage current is , and the 5th harmonic current is , which is higher than the allowable value given in Table A3. Therefore, the reactor may be overloaded with harmonic currents if the harmonic distortion is high.
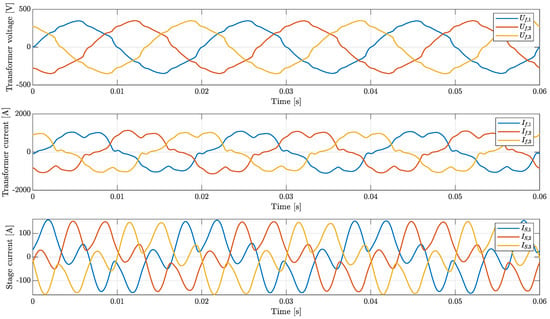
Figure 22.
C2—Secondary voltage and current of transformer T1 and stage current without ferroresonance.
4.3. Discussion
Experimental results have shown that ferroresonance can occur in a low voltage detuned power factor correction system when high voltage distortion is present on the low voltage busbar. The high voltage distortion results from nonlinear loads connected to the low-voltage busbar injecting current harmonics into the system, but the voltage distortion on the medium-voltage busbar can also affect the voltage distortion on the low-voltage busbar. Since most of the nonlinear loads in the industrial system under study are variable speed drives with diode bridge rectifiers, the fifth current harmonic has the highest magnitude. As shown, when the ferroresonance in C2 is not triggered, these current harmonics flow into the medium voltage grid and generate harmonic voltages, with the highest value of harmonic voltage on the low voltage busbar. When the ferroresonance occurs, the harmonic spectrum of the detuned reactor current and voltage becomes very rich, with the 5th harmonic having the highest value. With a detuning factor of 5.67%, the resonant frequency of the LC circuit is 210 Hz, which is very close to the 5th harmonic, and under normal operating conditions, the detuned reactor with the PFC capacitor filters significant values of the 5th harmonic. However, when the 5th voltage harmonic on the low-voltage busbar is high, the detuned reactor can be overloaded with high current harmonics, as shown by the experimental results. This indicates the well-known problem of dimensioning passive devices (power factor correction, filters) in the presence of harmonics. If passive compensation or filter is present in the industrial installation, any change in the load type (e.g. adding a nonlinear load) or in the system configuration must be verified by simulating its effect on the harmonic distortion in the system and on the installed passive devices. If this is not the case, various phenomena can occur, such as the one analyzed in this paper. Moreover, new installations are made up of highly efficient components, so the resistance required to damp resonances is insufficient, making them susceptible to this type of event.
Ferroresonance first appeared in the industrial plant studied after two conventional (fixed speed) compressor drives were replaced by variable speed drives. This resulted in increased voltage harmonic distortion on the low voltage busbar at some operating points where the nonlinear/linear load ratio is high. As a result, switching on the capacitor stage at these operating points triggered the ferroresonance, and for the stages that were already switched on, the high harmonic distortion caused the detuned reactors to be overloaded. This situation could have been avoided if the power factor correction had been implemented with active filters, reducing the higher harmonics but are the most expensive solution. The risk of ferroresonance would have been lower if the detuned reactors had been installed with the detuning factor of 7% (the resonant frequency of an LC circuit is 189 Hz). However, this solution would have reduced, but not eliminated, the risk of ferroresonance in the industrial plant under study. Finally, the total voltage harmonic distortion level of almost 7% in C2 is very high and should be reduced. Practical experience has shown that the total voltage harmonic distortion level of 5% is the practical limit above which various harmonic-related problems can occur.
5. Conclusions
In this paper, three-phase ferroresonance in a low-voltage detuned power factor correction system is analysed by means of an experimental study and a new configuration in which ferroresonance can occur is presented. The study is based on real field measurements carried out in an industrial plant where ferroresonance occurs at the detuned reactor of the PFC system. The three-phase ferroresonance analysed in this paper is triggered by the switching on of the capacitor stage of the detuned PFC system when a high harmonic distortion is present at the low voltage busbar. In this case, the ferroresonance is supported by the medium voltage system. This study has shown the importance of limiting the total harmonic distortion level of voltage in industrial plants. The experimental results have confirmed that high harmonic distortion of voltage was a necessary condition for the occurrence of ferroresonance in the studied industrial plant. In addition to the high harmonic distortion, the system configuration, the detuning factor of the detuned reactor and the available resistance in the system also affect the occurrence of ferroresonance. When the passive devices are present in the system, any change in the system configuration or load type must be verified by simulation test to avoid harmonic related problems and dangerous events like ferroresonance.
Three-phase ferroresonance is an extremely rare phenomenon that exposes system components to excessive stress due to overvoltage and overcurrent. This complex phenomenon should be further analysed and prevented if possible.
Author Contributions
Conceptualization, M.K.; methodology, M.K. and L.P.; software, L.P.; validation, M.K. and L.P.; formal analysis, M.K. and L.P.; investigation, M.K. and L.P.; resources, M.K.; data curation, L.P.; writing—original draft preparation, M.K.; writing—review and editing, M.K. and L.P.; visualization, L.P.; supervision, M.K.; project administration, M.K. Both authors have read and agreed to the published version of the manuscript.
Funding
This work was supported by the Department of Electric Machines, Drives and Automation, University of Zagreb, Zagreb, Croatia.
Institutional Review Board Statement
Not applicable.
Informed Consent Statement
Not applicable.
Data Availability Statement
The data presented in this study are available on request from the corresponding author.
Conflicts of Interest
The authors declare no conflict of interest.
Abbreviations
The following abbreviations are used in this manuscript:
| PFC | Power Factor Correction |
| C1 | Case 1 |
| C2 | Case 2 |
| THD | Total Harmonic Distortion |
Appendix A. Rated Data

Table A1.
Transformer rated data.
Table A1.
Transformer rated data.
| Name | Value |
|---|---|
| Rated power | 1350 kVA |
| Primary voltage | 10(20) kV 2.5% |
| Secondary voltage | 400 V |
| Connection | Dyn5 |
| Short-circuit voltage | 6% |

Table A2.
Capacitor rated data.
Table A2.
Capacitor rated data.
| 480 V | 33.4 kvar | 3 × 40.2 A |
| 400 V | 23.2 kvar | 3 × 33.5 A |
| 50 Hz | 3 phase | D |
| 3 × 154 F | +5...−10% | 0.25 W/kvar |
| : 1450 V | : 3 × 56 A | : 6050 A |
| Internal resistors: | 3 × 47 | |
| Max. dischar. time (to 50 V): | 58 s |

Table A3.
Reactor rated data, stages 1 to 5.
Table A3.
Reactor rated data, stages 1 to 5.
| 46.4 kvar/400 V/50 Hz/D/5.67% | |
| : 49.2 kvar | : 46.4 kvar |
| C: 3 × 308 F | |
| : 400 V | : 50 Hz |
| : 210 Hz | p: 5.67% |
| : 3 × 0.62 mH | % |
| : 2.2 | ≥ 0.95 |
| : 71 A | : 93.1 A |
| : 97.7 A | |
| : 78.1 A | : 2.1 A |
| : 48.1 A | : 13.2 A |
| : 238 W |

Table A4.
Reactor rated data, stages 6 and 7.
Table A4.
Reactor rated data, stages 6 and 7.
| 23.2 kvar/400 V/50 Hz/D/5.67% | |
| : 24.6 kvar | : 23.2 kvar |
| C: 3 × 154 F | |
| : 400 V | : 50 Hz |
| : 210 Hz | p: 5.67% |
| : 3 × 1.24 mH | % |
| : 2.2 | ≥ 0.95 |
| : 35.5 A | : 46.5 A |
| : 48.9 A | |
| : 39.1 A | : 1 A |
| : 24.1 A | : 6.6 A |
| : 130 W |
References
- Wang, X.; Blaabjerg, F.; Wu, W. Modeling and analysis of harmonic stability in an AC power-electronics-based power system. IEEE Trans. Power Electron. 2014, 29, 6421–6432. [Google Scholar] [CrossRef]
- Wang, X.; Blaabjerg, F. Harmonic stability in power electronic-based power systems: Concept, modeling, and analysis. IEEE Trans. Smart Grid 2018, 10, 2858–2870. [Google Scholar] [CrossRef]
- Singh, B.; Singh, B.N.; Chandra, A.; Al-Haddad, K.; Pandey, A.; Kothari, D.P. A review of three-phase improved power quality AC-DC converters. IEEE Trans. Ind. Electron. 2004, 51, 641–660. [Google Scholar] [CrossRef]
- EN 50160:2012—Voltage Characteristics of Electricity Supplied by Public Distribution Systems; Standard; CENELEC: Brussels, Belgium, 2012.
- IEC 61000-3-2:2018—Electromagnetic Compatibility (EMC)—Part 3-2: Limits—Limits for Harmonic Current Emissions; Standard; IEC: Geneva, Switzerland, 2018.
- IEC 61000-2-4:2002—Electromagnetic Compatibility (EMC)—Part 2-4: Environment—Compatibility Levels in Industrial Plants for Low-Frequency Conducted Disturbances; Standard; IEC: Geneva, Switzerland, 2002.
- Beleiu, H.G.; Maier, V.; Pavel, S.G.; Birou, I.; Pică, C.S.; Dărab, P.C. Harmonics consequences on drive systems with induction motor. Appl. Sci. 2020, 10, 1528. [Google Scholar] [CrossRef]
- Enslin, J.H.; Heskes, P.J. Harmonic interaction between a large number of distributed power inverters and the distribution network. IEEE Trans. Power Electron. 2004, 19, 1586–1593. [Google Scholar] [CrossRef]
- Liang, X. Emerging power quality challenges due to integration of renewable energy sources. IEEE Trans. Ind. Appl. 2016, 53, 855–866. [Google Scholar] [CrossRef]
- Yazdani-Asrami, M.; Sadati, S.M.B.; Samadaei, E. Harmonic study for MDF industries: A case study. In Proceedings of the 2011 IEEE Applied Power Electronics Colloquium (IAPEC), Johor Bharu, Malaysia, 18–19 April 2011; pp. 149–154. [Google Scholar]
- Horak, J. A review of ferroresonance. In Proceedings of the 57th Annual Conference for Protective Relay Engineers, College Station, TX, USA, 1 April 2004; pp. 1–29. [Google Scholar]
- Ferracci, P. Ferroresonance–Cahier technique Schneider No. 190; Groupe Schneider: Rueil-Malmaison, France, 1998. [Google Scholar]
- Moses, P.S.; Masoum, M.A. Sensitivity of ferroresonance simulations to model parameters and initial conditions. In Proceedings of the 2010 20th Australasian Universities Power Engineering Conference, Christchurch, New Zealand, 5–8 December 2010; pp. 1–6. [Google Scholar]
- Ang, S.P. Ferroresonance Simulation Studies of Transmission Systems. Ph.D. Thesis, The University of Manchester, Manchester, UK, 2010. [Google Scholar]
- Dugan, R.C. Examples of ferroresonance in distribution systems. In Proceedings of the IEEE Power Engineering Society General Meeting, Toronto, ON, Canada, 13–17 July 2003; Volume 2, pp. 1213–1215. [Google Scholar]
- Abu Bakar, A.H.; Khan, S.A.; Kwang, T.C.; Rahim, N.A. A review of ferroresonance in capacitive voltage transformer. IEEE Trans. Electr. Electron. Eng. 2015, 10, 28–35. [Google Scholar] [CrossRef]
- Sanaye-Pasand, M.; Rezaei-Zare, A.; Mohseni, H.; Farhangi, S.; Iravani, R. Comparison of performance of various ferroresonance suppressing methods in inductive and capacitive voltage transformers. In Proceedings of the 2006 IEEE Power India Conference, New Delhi, India, 10–12 April 2006; p. 8. [Google Scholar]
- Jacobson, D.A. Examples of ferroresonance in a high voltage power system. In Proceedings of the 2003 IEEE Power Engineering Society General Meeting (IEEE Cat. No. 03CH37491), Toronto, ON, Canada, 13–17 July 2003; Volume 2, pp. 1206–1212. [Google Scholar]
- Valverde, V.; Buigues, G.; Mazón, A.; Zamora, I.; Albizu, I. Ferroresonant configurations in power systems. In Proceedings of the International Conference on Renewable Energies and Power Quality (ICREPQ’12), Galicia, Spain, 28–30 March 2012; Volume 1. [Google Scholar]
- Hassan, S.; Vaziri, M.; Vadhva, S. Review of ferroresonance in power distribution grids. In Proceedings of the 2011 IEEE International Conference on Information Reuse & Integration, Las Vegas, NV, USA, 3–5 August 2011; pp. 444–448. [Google Scholar]
- Iravani, M.; Chaudhary, A.; Giesbrecht, W.; Hassan, I.; Keri, A.; Lee, K.; Martinez, J.; Morched, A.; Mork, B.; Parniani, M.; et al. Modeling and analysis guidelines for slow transients. III. The study of ferroresonance. IEEE Trans. Power Deliv. 2000, 15, 255–265. [Google Scholar] [CrossRef]
- Yazdani-Asrami, M.; Mirzaie, M.; Akmal, A.A.S. No-load loss calculation of distribution transformers supplied by nonsinusoidal voltage using three-dimensional finite element analysis. Energy 2013, 50, 205–219. [Google Scholar] [CrossRef]
- Sima, W.; Zou, M.; Yang, M.; Peng, D.; Liu, Y. Saturable reactor hysteresis model based on Jiles–Atherton formulation for ferroresonance studies. Int. J. Electr. Power Energy Syst. 2018, 101, 482–490. [Google Scholar] [CrossRef]
- Mikhak-Beyranvand, M.; Faiz, J.; Rezaei-Zare, A.; Rezaeealam, B. Electromagnetic and thermal behavior of a single-phase transformer during Ferroresonance considering hysteresis model of core. Int. J. Electr. Power Energy Syst. 2020, 121, 106078. [Google Scholar] [CrossRef]
- Yang, M.; Sima, W.; Chen, L.; Duan, P.; Sun, P.; Yuan, T. Suppressing ferroresonance in potential transformers using a model-free active-resistance controller. Int. J. Electr. Power Energy Syst. 2018, 95, 384–393. [Google Scholar] [CrossRef]
- Navaei, M.; Abdoos, A.A.; Shahabi, M. A new control unit for electronic ferroresonance suppression circuit in capacitor voltage transformers. Int. J. Electr. Power Energy Syst. 2018, 99, 281–289. [Google Scholar] [CrossRef]
- Heidary, A.; Rouzbehi, K.; Radmanesh, H.; Pou, J. Voltage transformer ferroresonance: An inhibitor device. IEEE Trans. Power Deliv. 2020, 35, 2731–2733. [Google Scholar] [CrossRef]
- Tajdinian, M.; Allahbakhshi, M.; Biswal, S.; Malik, O.P.; Behi, D. Study of the Impact of Switching Transient Overvoltages on Ferroresonance of CCVT in Series and Shunt Compensated Power Systems. IEEE Trans. Ind. Inf. 2019, 16, 5032–5041. [Google Scholar] [CrossRef]
- Wang, Y.; Liang, X.; Pordanjani, I.R.; Cui, R.; Jafari, A.; Clark, C. Investigation of Ferroresonance Causing Sustained High Voltage at a De-Energized 138 kV Bus: A Case Study. IEEE Trans. Ind. Appl. 2019, 55, 5675–5686. [Google Scholar] [CrossRef]
- Pallem, C.; Mueller, D.; McVey, M. Case Study of a New Type of Ferroresonance in Solar Power Plants. In Proceedings of the 2019 IEEE Power & Energy Society General Meeting (PESGM), Atlanta, GA, USA, 4–8 August 2019; pp. 1–5. [Google Scholar]
- Heger, C.A.; Sen, P.; Morroni, A. Power factor correction—A fresh look into today’s electrical systems. In Proceedings of the 2012 IEEE-IAS/PCA 54th Cement Industry Technical Conference, San Antonio, TX, USA, 14–17 May 2012; pp. 1–13. [Google Scholar]
- Cazacu, E.; Ioniţă, V.; Petrescu, L. An efficient method for investigating the ferroresonance of single-phase iron core devices. In Proceedings of the 2017 10th International Symposium on Advanced Topics in Electrical Engineering (ATEE), Bucharest, Romania, 23–25 March 2017; pp. 363–368. [Google Scholar]
- Kruger, S.; de Kock, J. Ferroresonance: A Review of the Phenomenon and Its Effects. In Proceedings of the 2021 Southern African Universities Power Engineering Conference/Robotics and Mechatronics/Pattern Recognition Association of South Africa (SAUPEC/RobMech/PRASA), Potchefstroom, South Africa, 27–29 January 2021; pp. 1–6. [Google Scholar]
- Moses, P.S.; Masoum, M.A.; Toliyat, H.A. Impacts of hysteresis and magnetic couplings on the stability domain of ferroresonance in asymmetric three-phase three-leg transformers. IEEE Trans. Energy Convers. 2010, 26, 581–592. [Google Scholar] [CrossRef]
- Pravica, L.; Jukić, F.; Bariša, T.; Stipetić, S. Interior permanent magnet wind generator torque estimation considering low-pass filter phase shift compensation. In Proceedings of the 2018 International Symposium on Industrial Electronics (INDEL), Banja Luka, Bosnia and Herzegovina, 1–3 November 2018; pp. 1–5. [Google Scholar]
Publisher’s Note: MDPI stays neutral with regard to jurisdictional claims in published maps and institutional affiliations. |
© 2021 by the authors. Licensee MDPI, Basel, Switzerland. This article is an open access article distributed under the terms and conditions of the Creative Commons Attribution (CC BY) license (https://creativecommons.org/licenses/by/4.0/).