Article

Identification and Quantification of Turmeric Adulteration in Egg-Pasta by Near Infrared Spectroscopy and Chemometrics

by
Alessandra Biancolillo
1,*,
Angela Santoro
2,
Patrizia Firmani
2 and
Federico Marini
2
1
Department of Physical and Chemical Sciences, University of L’Aquila, Via Vetoio, Coppito, 67100 L’Aquila, Italy
2
Department of Chemistry, University of Rome “La Sapienza”, P.le Aldo Moro 5, 00185 Rome, Italy
*
Author to whom correspondence should be addressed.
Appl. Sci. 2020, 10(8), 2647; https://doi.org/10.3390/app10082647
Submission received: 25 March 2020 / Revised: 5 April 2020 / Accepted: 9 April 2020 / Published: 11 April 2020
(This article belongs to the Special Issue Application of Spectroscopy in Food Analysis)

Abstract

:
“Egg pasta” is a kind of pasta prepared by adding eggs in the dough; the color of this product is often associated to its quality, as it is proportional to the quantity of egg present in the dough. A possible adulteration on this product is represented by the addition of turmeric (not reported in the label) in the dough. The inclusion of this ingredient (which is minimal, given the strong coloring power of this spice) fraudulently accentuates the yellow color of the product, making it more attractive to the consumer. Given this scenario, the aim of the present work is to develop an analytical approach suitable at detecting the presence of turmeric as an adulterant in egg pasta. One hundred samples of traditional and adulterated egg pasta were analyzed by NIR spectroscopy and PLS-DA (Partial Least Squares Discriminant Analysis) in order to discriminate adulterated and compliant pasta. The classification model provided a total correct classification rate of 97.5% in external validation (40 samples). Eventually, the adulterant was quantified by PLS. This strategy provided satisfying results, achieving a RMSEP (Root Mean Square Error in Prediction) of 0.112 (%-w/w) in external validation.

1. Introduction

Pasta is a staple food in several Mediterranean Countries and it is consumed and appreciated all over the world [1]. “Egg pasta” is pasta prepared by adding eggs to the dough. This aliment presents special physical, chemical and organoleptic characteristics, which differentiate it from common durum pasta [2,3,4]. From the physical point of view, one of the main differences between these two close products is represented by the bright yellow color provided by the presence of egg yolks. Since the presence of eggs positively influences taste, flavor and texture of egg pasta, a bright yellow color of the product is perceived by the consumers as an indication of the quality of the egg-pasta. Standing these considerations, it may happen that fraudulent pasta makers could add dyeing compounds (without declaring it on the label) to enhance the color of the product, in order to deceive colorimetric quality controls, and to make it more attractive to the eye of the consumers. In this context, a common adulterant is Curcuma longa, a zingiberaceæ spice better known as turmeric. This is due to the fact even a small amount of this spice provides a bright yellow color and it is non-toxic and relatively cheap. The active ingredient of this spice, curcumin, is a natural dye often used in different contexts such as fabrics, cosmetics, textiles but also in the food industry (E100) [5].
In the light of these considerations, the aim of the present work is to develop a non-destructive analytical methodology to detect fraudulent addition of turmeric in egg pasta. For this reason, law-conformant and adulterated samples of egg pasta were prepared in the lab (following a traditional accredited recipe) and analyzed by Near Infrared Spectroscopy (NIR). This instrument was considered a suitable tool because it is non-destructive, and, consequently, it avoids any loss of product. Spectra were handled by two different chemometric techniques; Partial Least Squares Discriminant Analysis (PLS-DA) with the aim of distinguishing adulterated and pure samples, and Partial Least Squares (PLS) in order to quantify turmeric in counterfeited samples. These strategies were chosen because both of them are very efficient, and they are often used for the analysis of food products [6,7,8,9], in particular in combination with NIR. Since this strategy is non-destructive, it is especially suitable for high-value-added food [10,11,12,13,14].

2. Materials and Methods

2.1. Preparation of Samples
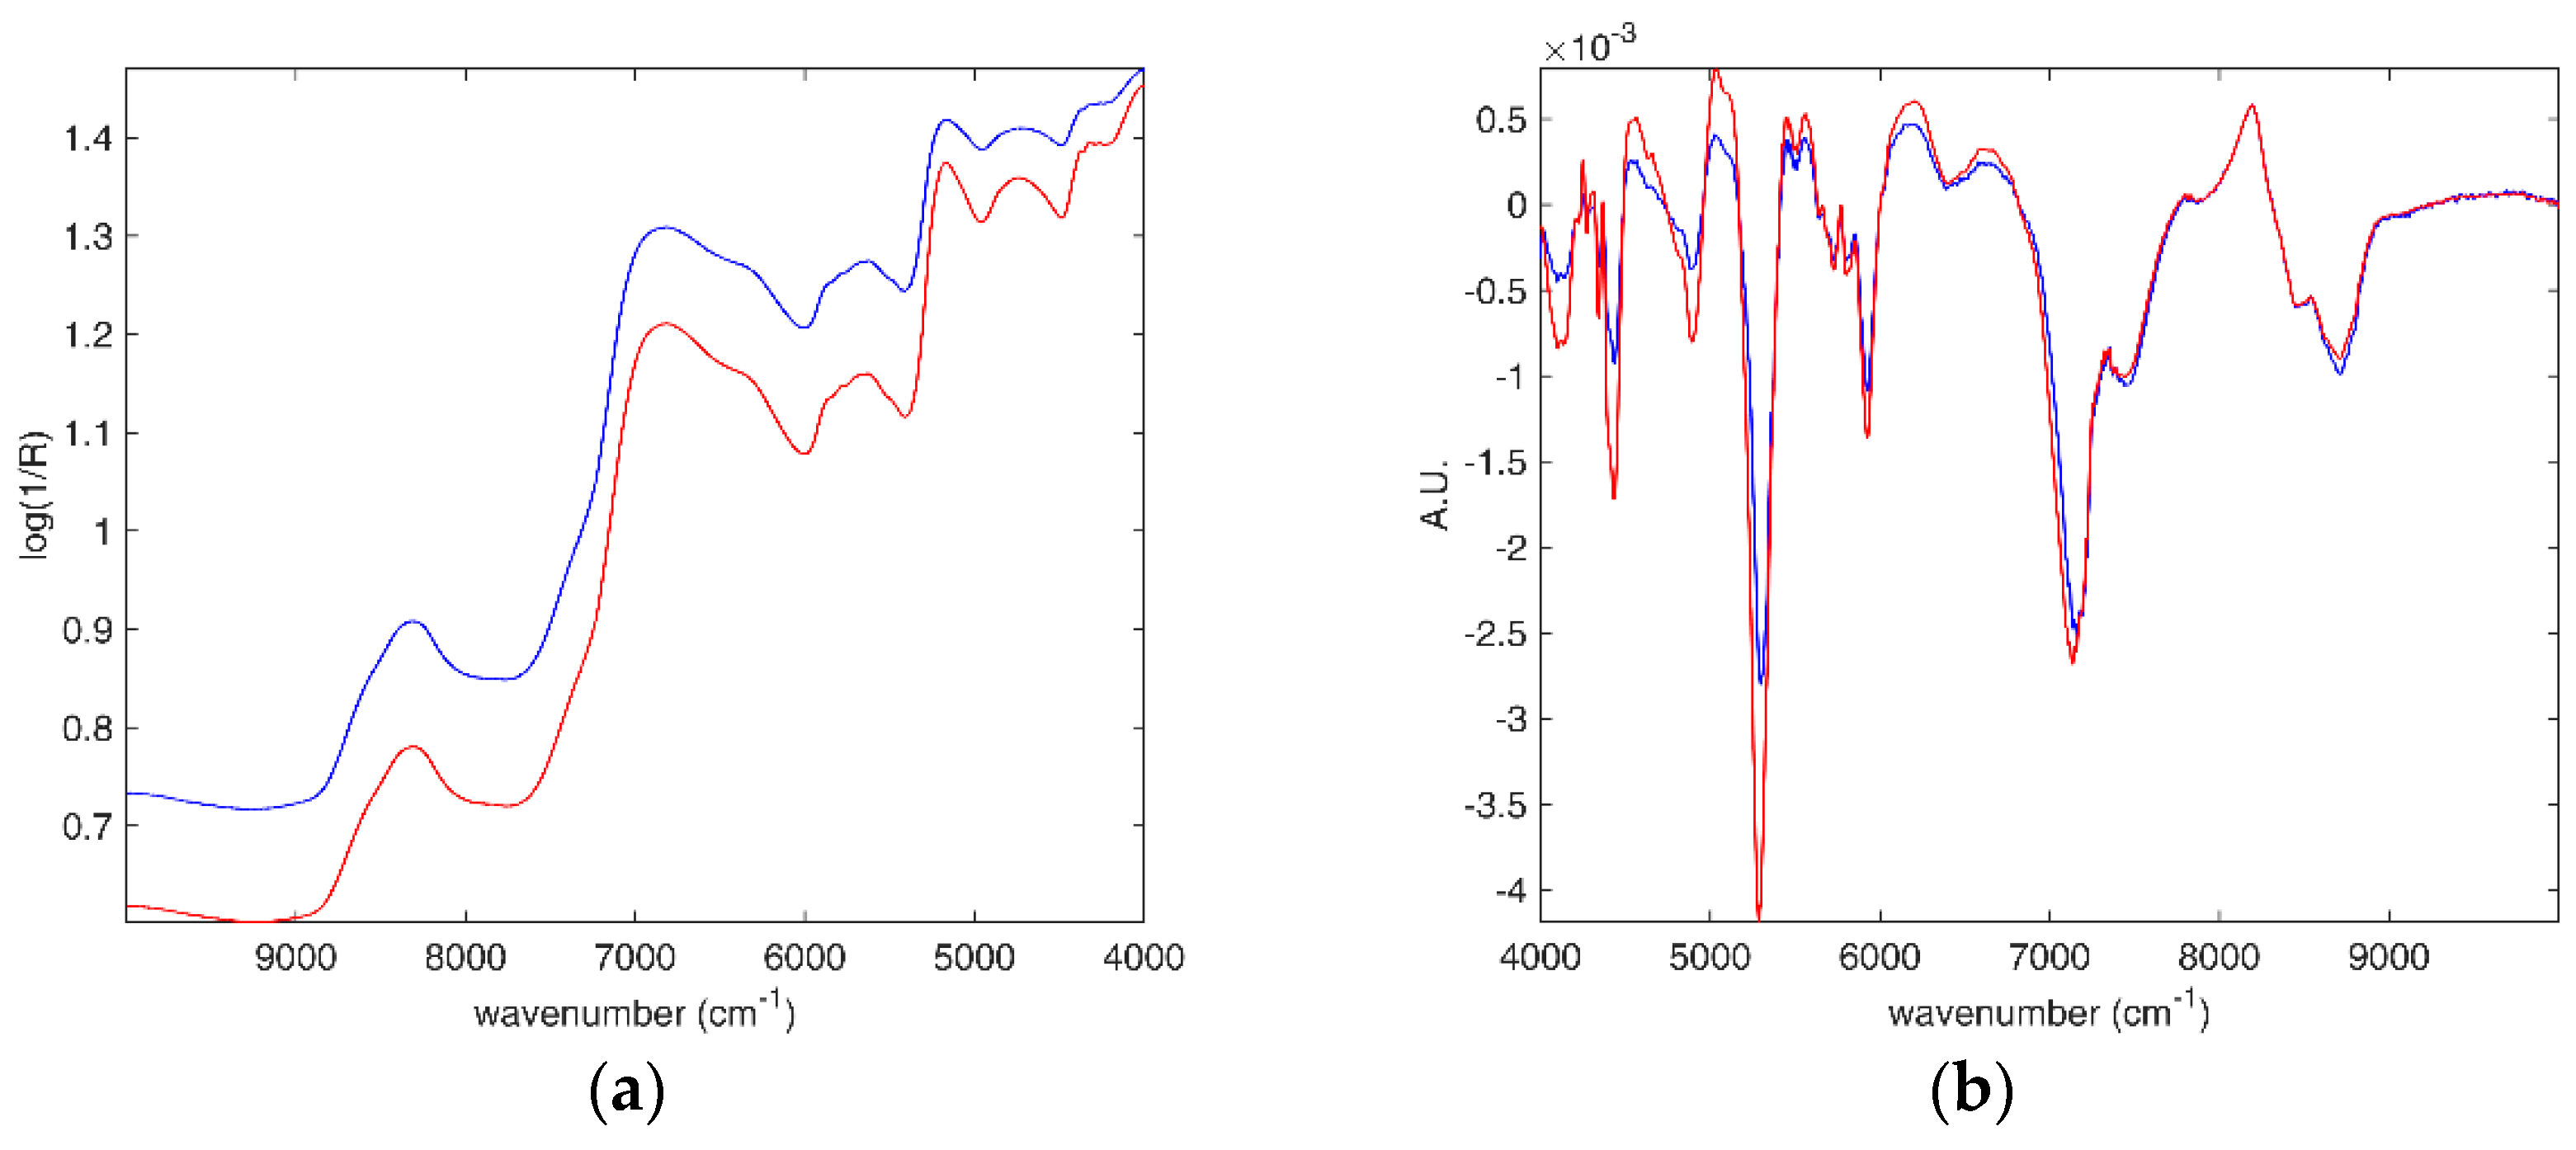
Law-conformant egg pasta doughs were prepared following the traditional procedure used by egg-pasta masters. Samples were prepared by mixing 100 g of durum semolina and 1 egg. Adulterated samples were obtained by addition of 19 different percentages of turmeric powder from 0.01% to 1% (weight turmeric powder/weight final dough sample); adulteration percentage are reported in Table 1. Four adulterated dough samples were prepared for each adulteration percentage (for a total of 19 × 4 = 76 adulterated doughs). In total, twenty-four law-conformant and seventy-six adulterated doughs were available for the analysis. Eventually, each sample was spread by means of a clean rolling pin into strips of the desired thickness (resembling the “pappardelle” shape).

2.2. NIR Analysis

NIR spectra were collected using a Nicolet 6700 FT-NIR (Thermo Scientific Inc., Madison, WI) connected to an integrating sphere (Thermo Scientific Inc., Madison, WI). The investigated spectral range was between 4000 and 10,000 cm−1 (nominal resolution: 4 cm−1). Each egg-pasta sample was analysed in 6 replicates (collecting a spectrum in three different position of the stripe on each side of it) for a total of 600 NIR signals. Spectra were recorded by the OMNIC software (Thermo Scientific Inc., Madison, WI) and exported in MATLAB 2015b (The Mathworks, Natick, MA). Once imported in Matlab, NIR signals (collected in reflection mode and registered as per cent reflectance, R) were transformed into pseudo-absorbance (log(1/R)); finally, replicates were averaged.

2.3. Chemometric Modeling

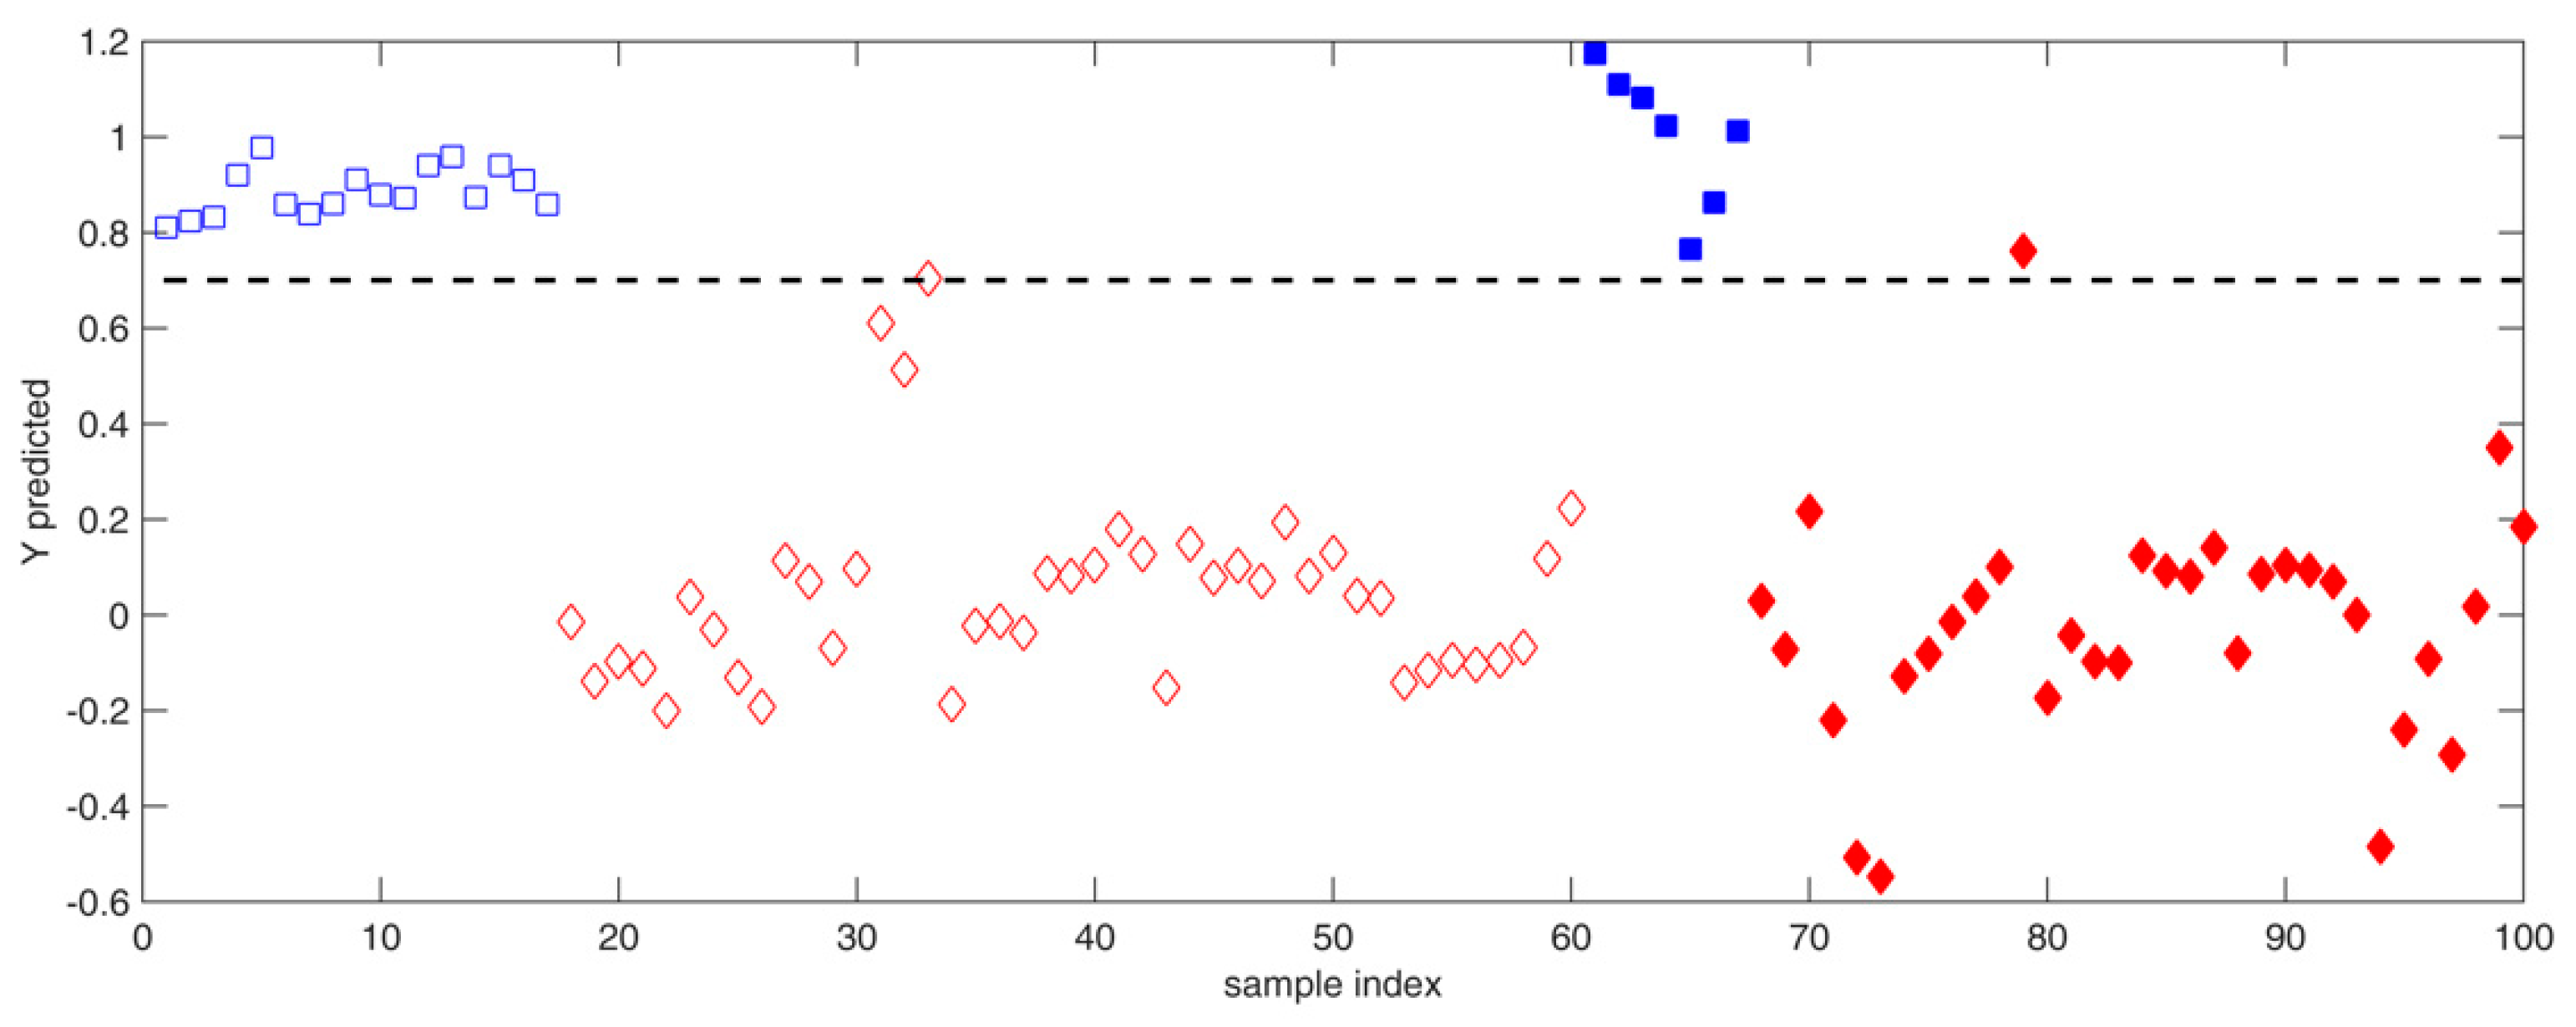
2.3.1. Classification Approach

Partial Least Squares-Discriminant Analysis (PLS-DA) is a discriminant classifier developed in order to overcome the issued encountered by Fishers Linear Discriminant Analysis when handling ill-conditioned data matrices [15]. This approach exploits PLS [16,17] and a so-called Dummy Y (a response matrix binary encoding the class-belonging) in order to convert a classification problem into a regression one (whose solution is achieved by PLS).
Very briefly, for a two-class problem (as the one discussed in the present study), given a data matrix X (e.g., constituted by the Ntr instrumental measures used as calibration set), the dummy y is a partitioned binary vector made of Ntr elements: each object belonging to Class 1 is represented by the value y1 = 1, while samples belonging to Class 2 are encoded by y2 = 0 [18].
Once the dummy response vector y is generated, the model is built by solving Equation (1) and estimating the regression coefficients b:
y = y ^ + e = X b + e
y ^ being the vector of predicted responses and e collecting the residuals.
After solving the regression problem in Equation (1) by PLS, a further step is needed to achieve classification, since the predicted response y ^ is not binary anymore but real-valued: accordingly, a suitable classification rule has to be built based on the values of y ^ . For a two-class problem, such as the one in the present study, this usually translates in setting a threshold y t h r to y ^ , so that if y ^ i > y t h r , the sample is assigned to class 1, and otherwise it is predicted to be class 2. In particular, in the present work the threshold was calculated based on the probabilistic approach proposed by Perez and coworkers [19].
When new, unknown, samples have be to classified, their predicted responses y ^ n e w are calculated based on the measurements X n e w and the regression coefficients b estimated on the training set, and the classification rule described above is then applied to assign each individual to one of the categories under study.

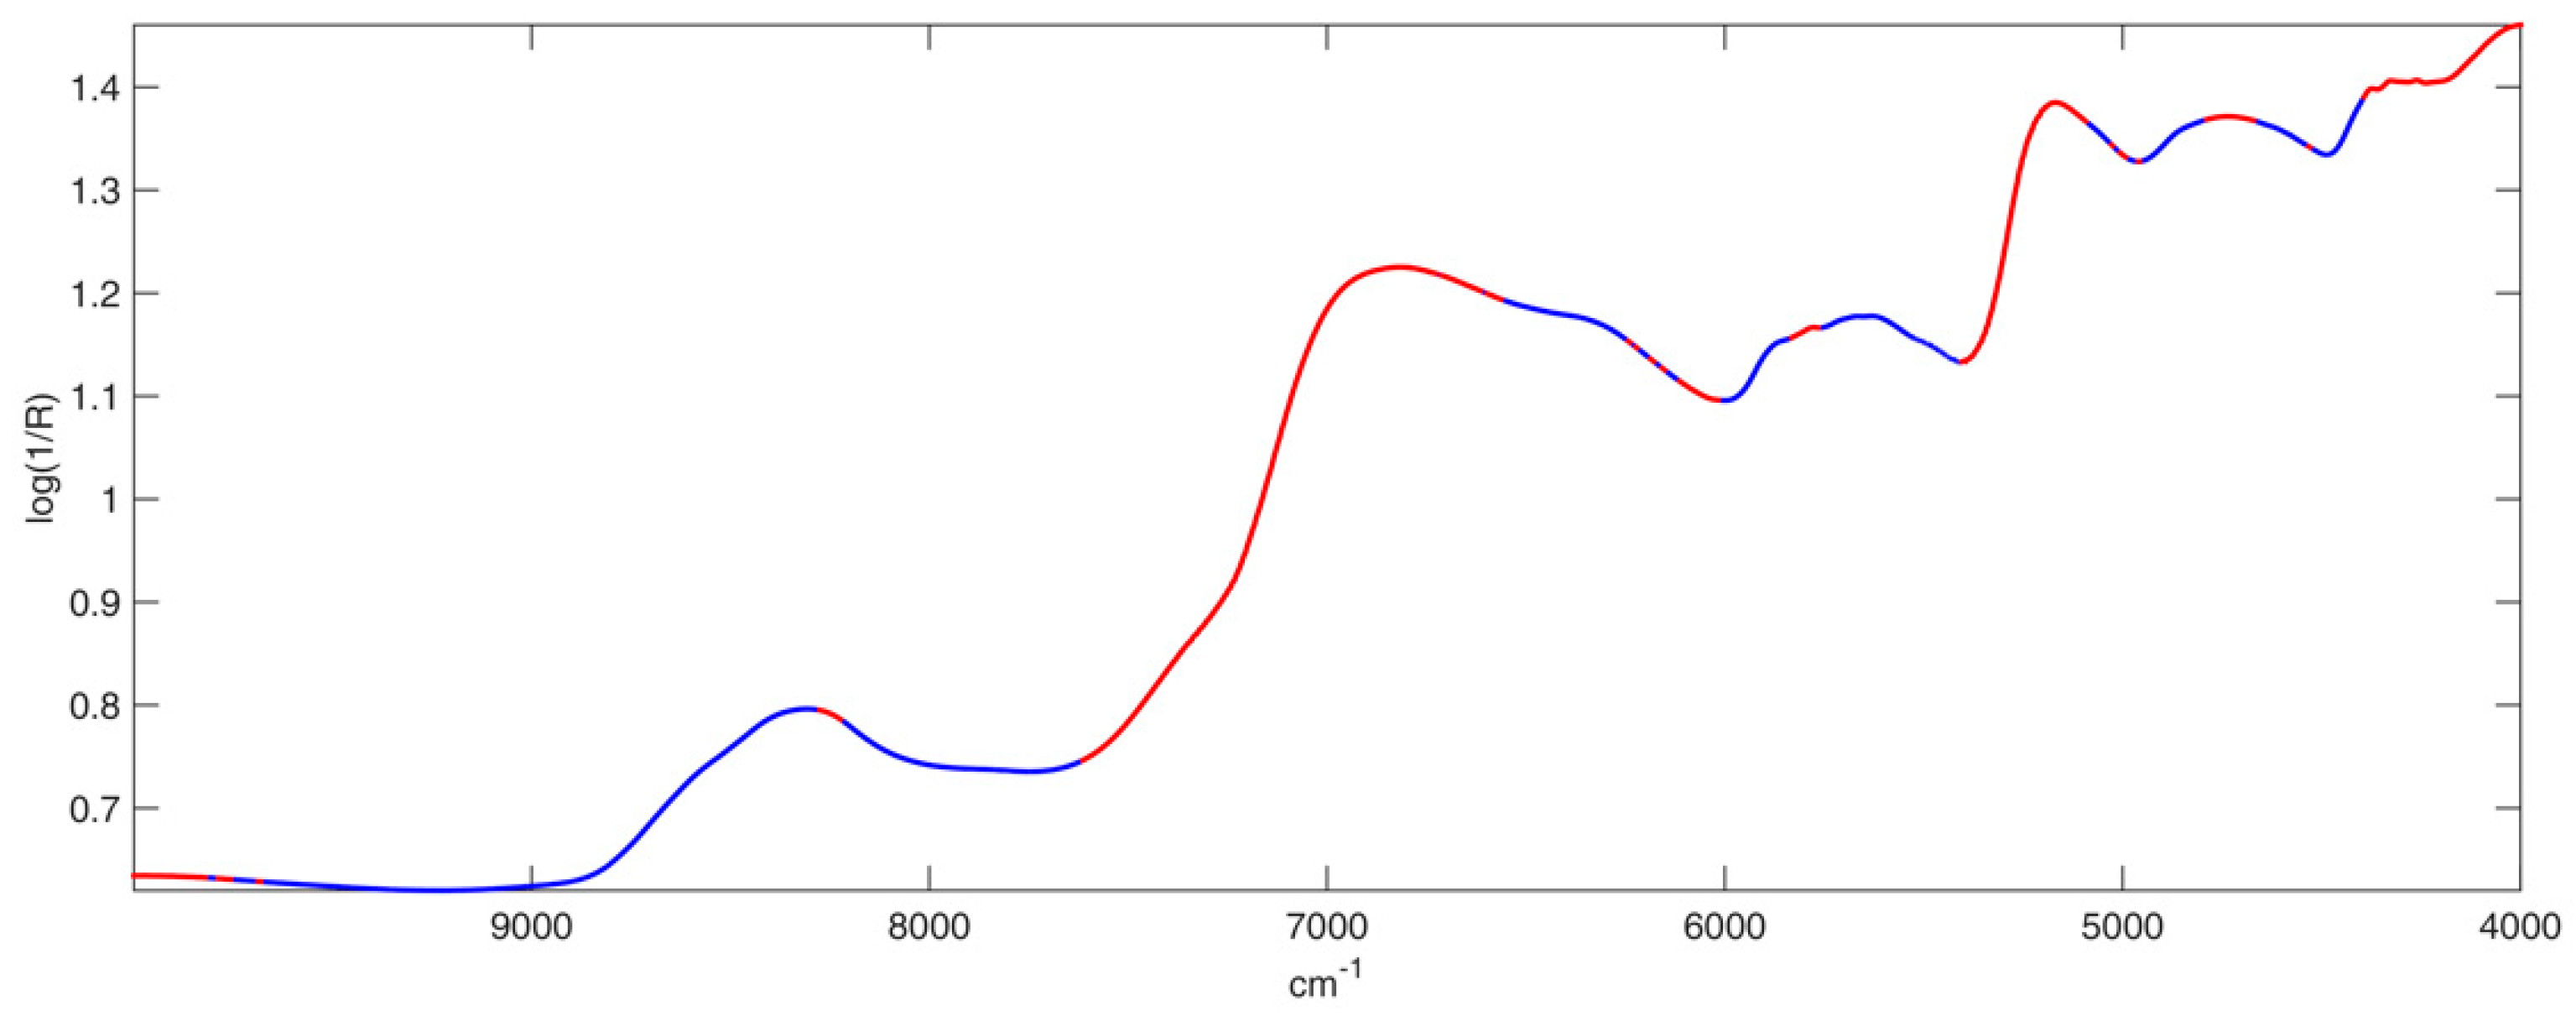
2.3.2. Regression Approaches: PLS

Partial Least Squares (PLS) is a well-known and widely applied regression method. It allows fitting response matrix (or vector) Y (or y) to a predictor matrix X. This approach is widely used with different aims in various contexts. In the present study, a PLS model was built on NIR data in order to quantify turmeric in the adulterated doughs. The reader is addressed to [16,17] for more details on the algorithm of PLS.

3. Results

3.1. Detection of Adulterated Egg Pasta Samples

NIR spectra were collected for all the available samples as described in Section 2.2; average spectra for “Class Conformant” (blue line) and “Class Adulterated” (red line) are shown in Figure 1. The mean raw spectra for the two categories look alike (Figure 1a); even after the 1st derivative (Figure 1b) no relevant differences could be observed.
In order to perform external validation of the classification model, samples were divided into calibration (training) and validation (test) set by the Duplex algorithm [20]; more details are reported in Table 2.
Training samples were used to define model parameters (number of latent variables (LVs) and the optimal data pretreatment) into a 7-fold cross-validation procedure; test objects were left out as external validation set and used to estimate the reliability of the calibration model.
Different preprocessing approaches (aimed at removing possible uninformative information) were tested; pretreated data were used to build PLS-DA models and then the most suitable solution was defined on the basis of the Correct Classification Rate in Cross-Validation (%CV). Tested pretreatments were: mean centering, 1st and 2nd derivative (following the Savitzky–Golay approach with a 19 points window and a third order interpolating polynomial [21]), Standard Normal Variate (SNV) [22], Multiplicative Scatter Correction (MSC) [23] and their combination (see Table 3).
From Table 3, it was evident that the PLS-DA model providing the highest correct classification rate in cross-validation was the one built on data preprocessed by MSC (Model VII), which provided a total classification rate of 97.65%. Consequently, this model was used to predict the test samples and it provided correct classification rates of 100% and 97% for “Class Conformant” “Class Adulterated”, respectively.
A graphical representation of these results is displayed in Figure 2, where the values of the predicted response for both the training and the test samples are shown. In the plot, the black dashed line is the delimiter between the two categories: a sample fallowing above it will be assigned by the model to “Class Conformant”, while the objects below the delimiter are predicted as belonging to “Class Adulterated”. In the plot, all the analyzed samples are displayed: both the calibration (empty symbols) and the validation (full symbols) objects. From this representation it is clear all the law-conformant objects (blue squares) have been properly classified, while only one adulterated test sample (full red diamonds) was assigned to the wrong category.
In order to deeply investigate the system under study, Variable Importance in Projection (VIP) [24] was used to define which spectral variables provide the greater contribution to the discrimination. Customarily, variables exhibiting VIP indices higher than 1 are considered relevant for the solution of the investigated problem [25]. A graphical representation of the outcome of the VIP analysis is reported in Figure 3.
In the plot, the blue line represents the average spectrum; variables having VIP > 1 are highlighted in red. From the figure, it appeared the variables contributing the most to the discrimination were those between 7610 and 6738 cm−1, ascribable to the 1st overtone of the O–H stretching; those between 5392 and 5097 cm−1 associable to the 2nd overtone of the C=O stretching and to the 1st overtone of the C-H stretching and spectral features between 4387 and 4000 cm−1, probably related to the C–H stretching and to the effects of C–H deformations [26,27].

3.2. Quantification of the Adulterant

Eventually, the possibility of quantifying the adulterant in the analyzed samples has been investigated. In this case, the study was restricted to the only adulterated samples; consequently, 76 samples were used for this part of the analysis. Additionally, in this case, spectra were divided into two sets, the calibration one, made of 43 objects, and the validation set, constituted by 33 samples. The same preprocessing approaches reported above were used for PLS analysis; results from the different (7-fold cross-validated) models are reported in Table 4.
On the basis of the RMSECV, Model IV was considered the optimal one and, consequently, it was applied to predict the adulterant percentages in test samples (pretreated by SNV). Taking into account the low percentages of turmeric powder present in each sample, the results were quite acceptable; in fact, Model IV led to a Root Mean Square Error in Prediction (on the test set) of 0.112 (%w/w).

4. Discussion

The present work highlighted NIR coupled with PLS-DA was a suitable tool for detecting egg pasta adulterated by turmeric. Additionally, the PLS analysis of spectra allowed a satisfying quantification of the adulterant even when present in very low quantity (<3% of the total weight). In conclusion, the proposed strategies demonstrated to be effective tools for fraud detection in traditional egg pasta. Due to the nature of the analytical technique involved (NIR), these approaches can find different applications; among the others, they could be used in factories in online systems for quality control.

5. Conclusions

The present work aimed at developing a NIR-based analytical methodology to detect fraudulent addition of turmeric in egg pasta. Law-conformant and adulterated egg pasta samples were prepared in the lab and analyzed by Near Infrared Spectroscopy (NIR). Eventually, spectra were handled by two different chemometric techniques: PLS-DA, in order to discriminate adulterated and pure samples, and PLS, to quantify turmeric in counterfeited samples. Both approaches performed well, demonstrating the investigated approaches are definitely suitable for the inspected goal. In fact, PLS-DA analysis provided correct classification rates of 100% and 97% for “Class Conformant” and “Class Adulterated”, respectively (corresponding to 1 misclassified object over 40 test samples), whereas PLS led to a Root Mean Square Error in Prediction (on the test set) of 0.112 (%w/w).

Author Contributions

Conceptualization, A.B. and F.M.; methodology, A.B. and F.M.; software, A.B., P.F. and F.M.; validation, A.B. and F.M.; formal analysis, A.S. and P.F.; investigation, A.B., P.F. and A.S.; resources, F.M.; data curation, A.S. and P.F.; writing—original draft preparation, A.B.; writing—review and editing, A.B. and F.M.; visualization, A.B.; supervision, F.M.; project administration, F.M.; funding acquisition F.M. All authors have read and agreed to the published version of the manuscript.

Funding

This research received no external funding.

Conflicts of Interest

The authors declare no conflict of interest.

References

  1. Akıllıoğlu, H.G.; Yalcin, E. Some quality characteristics and nutritional properties of traditional egg pasta (erişte). Food Sci. Biotechnol. 2010, 19, 417–424. [Google Scholar] [CrossRef]
  2. Alamprese, C. The Use of Egg and Egg Products in Pasta Production. In Egg Innovations and Strategies for Improvements; Elsevier: Amsterdam, The Netherlands, 2017; pp. 251–259. [Google Scholar]
  3. Fuad, T.; Prabhasankar, P. Role of Ingredients in Pasta Product Quality: A Review on Recent Developments. Crit. Rev. Food Sci. Nutr. 2010, 50, 787–798. [Google Scholar] [CrossRef] [PubMed]
  4. Alamprese, C.; Casiraghi, E.; Primavesi, L.; Rossi, M.; Hidalgo, A. Functional and rheological characteristics of fresh egg pasta. Ital. J. Food Sci. 2005, 17, 3–15. [Google Scholar]
  5. Kotha, R.R.; Luthria, D. Curcumin: Biological, Pharmaceutical, Nutraceutical, and Analytical Aspects. Molecules 2019, 24, 2930. [Google Scholar] [CrossRef] [PubMed] [Green Version]
  6. Huang, H.; Yu, H.; Xu, H.; Ying, Y. Near infrared spectroscopy for on/in-line monitoring of quality in foods and beverages: A review. J. Food Eng. 2008, 87, 303–313. [Google Scholar] [CrossRef]
  7. Karoui, R.; Debaerdemaeker, J. A review of the analytical methods coupled with chemometric tools for the determination of the quality and identity of dairy products. Food Chem. 2007, 102, 621–640. [Google Scholar] [CrossRef]
  8. De Luca, S.; Ciotoli, E.; Biancolillo, A.; Bucci, R.; Magrì, A.D.; Marini, F. Simultaneous quantification of caffeine and chlorogenic acid in coffee green beans and varietal classification of the samples by HPLC-DAD coupled with chemometrics. Environ. Sci. Pollut. Res. 2018, 25, 28748–28759. [Google Scholar] [CrossRef]
  9. Di Donato, F.; Di Cecco, V.; Torricelli, R.; D’Archivio, A.A.; Di Santo, M.; Albertini, E.; Veronesi, F.; Garramone, R.; Aversano, R.; Marcantonio, G.; et al. Discrimination of Potato (Solanum tuberosum L.) Accessions Collected in Majella National Park (Abruzzo, Italy) Using Mid-Infrared Spectroscopy and Chemometrics Combined with Morphological and Molecular Analysis. Appl. Sci. 2020, 10, 1630. [Google Scholar] [CrossRef] [Green Version]
  10. Firmani, P.; De Luca, S.; Bucci, R.; Marini, F.; Biancolillo, A. Near infrared (NIR) spectroscopy-based classification for the authentication of Darjeeling black tea. Food Control. 2019, 100, 292–299. [Google Scholar] [CrossRef]
  11. Lammertyn, J.; Nicolaï, B.; Ooms, K.; De Smedt, V.; De Baerdemaeker, J. non-destructive measurement of acidity, soluble Solids, and firmness of jonagold apples using nir-spectroscopy. Trans. ASAE 1998, 41, 1089–1094. [Google Scholar] [CrossRef]
  12. Casale, M.; Oliveri, P.; Casolino, C.; Sinelli, N.; Zunin, P.; Armanino, C.; Forina, M.; Lanteri, S. Characterisation of PDO olive oil Chianti Classico by non-selective (UV-visible, NIR and MIR spectroscopy) and selective (fatty acid composition) analytical techniques. Anal. Chim. Acta 2012, 712, 56–63. [Google Scholar] [CrossRef] [PubMed]
  13. Biancolillo, A.; De Luca, S.; Bassi, S.; Roudier, L.; Bucci, R.; Magrì, A.D.; Marini, F. Authentication of an Italian PDO hazelnut (“Nocciola Romana”) by NIR spectroscopy. Environ. Sci. Pollut. Res. 2018, 25, 28780–28786. [Google Scholar] [CrossRef] [PubMed]
  14. Ríos-Reina, R.; Callejón, R.M.; Savorani, F.; Amigo, J.M.; Cocchi, M. Data fusion approaches in spectroscopic characterization and classification of PDO wine vinegars. Talanta 2019, 198, 560–572. [Google Scholar] [CrossRef] [PubMed] [Green Version]
  15. Ståhle, L.; Wold, S. Partial least squares analysis with cross-validation for the two-class problem: A Monte Carlo study. J. Chemom. 1987, 1, 185–196. [Google Scholar] [CrossRef]
  16. Lwin, T.; Martens, H.; Naes, T. Multivariate Calibration; John Wiley & Sons: New York, NY, USA, 1991. [Google Scholar]
  17. Geladi, P.; Kowalski, B.R. Partial least-squares regression: a tutorial. Anal. Chim. Acta 1986, 185, 1–17. [Google Scholar] [CrossRef]
  18. Barker, M.; Rayens, W. Partial least squares for discrimination. J. Chemom. 2003, 17, 166–173. [Google Scholar] [CrossRef]
  19. Pérez, N.F.; Ferré, J.; Boqué, R.; Baldrich, J.F. Calculation of the reliability of classification in discriminant partial least-squares binary classification. Chemom. Intell. Lab. Syst. 2009, 95, 122–128. [Google Scholar] [CrossRef]
  20. Snee, R.D. Validation of regression models: Methods and examples. Technometrics 1977, 19, 415–428. [Google Scholar] [CrossRef]
  21. Savitzky, A.; Golay, M.J.E. Smoothing and Differentiation of Data by Simplified Least Squares Procedures. Anal. Chem. 1964, 36, 1627–1639. [Google Scholar] [CrossRef]
  22. Barnes, R.J.; Dhanoa, M.S.; Lister, S.J. Standard Normal Variate Transformation and De-Trending of Near-Infrared Diffuse Reflectance Spectra. Appl. Spectrosc. 1989, 43, 772–777. [Google Scholar] [CrossRef]
  23. Geladi, P.; MacDougall, D.; Martens, H. Linearization and Scatter-Correction for Near-Infrared Reflectance Spectra of Meat. Appl. Spectrosc. 1985, 39, 491–500. [Google Scholar] [CrossRef]
  24. Wold, S.; Johansson, E.; Cocchi, M. PLS: partial least squares projections to latent structures. In 3D QSAR in Drug Design: Theory, Methods and Applications; Kubinyi, H., Ed.; KLUWER ESCOM Science Publisher: Leiden, The Netherlands, 1993; pp. 523–550. [Google Scholar]
  25. Cocchi, M.; Biancolillo, A.; Marini, F. Chemometric Methods for Classification and Feature Selection. In Data 267 Analysis for Omic Sciences: Methods and Applications, Comprehensive Analytical Chemistry; Jaumot, J., Bedia, C., Tauler, R., Eds.; Elsevier: Amsterdam, The Netherlands, 2018; Volume 82, pp. 265–299. [Google Scholar] [CrossRef]
  26. Kim, Y.-J.; Lee, H.J.; Shin, H.-S.; Shin, Y. Near-infrared Reflectance Spectroscopy as a Rapid and Non-destructive Analysis Tool for Curcuminoids in Turmeric. Phytochem. Anal. 2014, 25, 445–452. [Google Scholar] [CrossRef] [PubMed]
  27. Kar, S.; Tudu, B.; Jana, A.; Bandyopadhyay, R. FT-NIR spectroscopy coupled with multivariate analysis for detection of starch adulteration in turmeric powder. Food Addit. Contam. Part A 2019, 36, 863–875. [Google Scholar] [CrossRef] [PubMed]
Figure 1. (a) Average raw spectra and (b) average spectra after the 1st derivative. Legend: “Class Conformant”: blue line and “Class Adulterated”: red line.
Applsci 10 02647 g001
Figure 2. PLS-DA analysis: predicted Y vs sample index. Legend: “Class Conformant: Blue Squares; “Class Adulterated”: Red diamonds. Empty and filled symbols represent training and test samples, respectively.
Applsci 10 02647 g002
Figure 3. Variable Importance in Projection (VIP) analysis. Averaged spectrum (blue line). Selected variables are bolded in red.
Applsci 10 02647 g003
Table 1. Percentage of turmeric powder added to the doughs.
Adulteration (%w/w)
0.01
0.025
0.05
0.075
0.085
0.090
0.10
0.15
0.20
0.25
0.30
0.35
0.40
0.45
0.50
0.60
0.75
0.85
1.00
Table 2. Division of samples into calibration and validation sets.
xCalibration SetValidation Set
Class
Law-Conformant
Class
Adulterated
Class
Law-Conformant
Class
Adulterated
No. of samples1743733
Total samples6040
Table 3. Partial Least Squares Discriminant Analysis (PLS-DA) results on the calibration set.
ModelPretreatmentLVsCorrect Classification Rate in Cross-validation (%)
Class Law-ConformantClass Adulterated
Model IMean Centering (MC)3100.083.7
Model II1st derivative (+MC)494.188.4
Model III2nd derivative (+MC)976.5100.0
Model IVSNV (+MC)8100.090.7
Model VSNV+1st derivative (+MC)494.193.0
Model VISNV+2nd derivative (+MC)970.6100.0
Model VIIMSC (+MC)9100.095.3
Table 4. PLS analysis. Cross-validated results on the calibration set.
ModelPretreatmentLVsRoot Mean Square Error in Cross-Validation (RMSECV, %w/w)
Model IMean Centering (MC)90.128
Model II1st derivative (+MC)90.123
Model III2nd derivative (+MC)80.130
Model IVSNV (+MC)80.112
Model VSNV+1st derivative (+MC)80.112
Model VISNV+2nd derivative (+MC)80.740
Model VIIMSC (+MC)60.123

