Article

Discrimination of Potato (Solanum tuberosum L.) Accessions Collected in Majella National Park (Abruzzo, Italy) Using Mid-Infrared Spectroscopy and Chemometrics Combined with Morphological and Molecular Analysis

by
Francesca Di Donato
1,
Valter Di Cecco
2,
Renzo Torricelli
3,
Angelo Antonio D’Archivio
1,*,
Marco Di Santo
2,
Emidio Albertini
3,
Fabio Veronesi
3,
Raffaele Garramone
4,
Riccardo Aversano
4,
Giuseppe Marcantonio
2 and
Luciano Di Martino
2
1
Dipartimento di Scienze Fisiche e Chimiche, Università degli Studi dell’Aquila, Via Vetoio, 67010 Coppito, Italy
2
Majella Seed Bank-Parco Nazionale della Majella, Via Badia, 28, 67039 Sulmona, Italy
3
Dipartimento di Scienze Agrarie, Alimentari ed Ambientali, Università degli Studi di Perugia, Borgo XX Giugno 74, 06121 Perugia, Italy
4
Dipartimento di Agraria, Università degli Studi di Napoli Federico II, Via Università 100, 80055 Portici, Italy
*
Author to whom correspondence should be addressed.
Appl. Sci. 2020, 10(5), 1630; https://doi.org/10.3390/app10051630
Submission received: 18 January 2020 / Revised: 12 February 2020 / Accepted: 25 February 2020 / Published: 29 February 2020
(This article belongs to the Special Issue Application of Spectroscopy in Food Analysis)

Abstract

:
Development of local plant genetic resources grown in specific territories requires approaches that are able to discriminate between local and alien germplasm. In this work, three potato (Solanum tuberosum L.) local accessions grown in the area of Majella National Park (Abruzzo, Italy) and five commercial varieties cultivated in the same area were characterized using 22 morphological descriptors and microsatellite (SSR) DNA markers. Analysis of the DNA and of the plant, leaf, flower, and tuber morpho-agronomic traits allowed for a reliable discrimination of the local potato accessions, and provided a clear picture of their genetic relationships with the commercial varieties. Moreover, infrared spectroscopy was used to acquire a fingerprint of the tuber flesh composition. A total of 279 spectra, 70% of which were used in calibration and the remaining 30% for prediction, were processed using partial least squares discriminant analysis. About 97% of the calibration samples and 80% of the prediction samples were correctly classified according to the potato origin. In summary, the combination of the three approaches were useful in the characterization and valorization of local germplasm. In particular, the molecular markers suggest that the potato accession named Montenerodomo, cultivated in Majella National Park, can be considered a local variety and can be registered into the Regional Voluntary GR Register and entered into the foreseen protection scheme, as reported by the Italian regional laws.

1. Introduction

Potato (Solanum tuberosum L.) is a major source of food for humans in many countries, as witnessed by the fact that its worldwide production is surpassed only by that of rice, wheat, maize, and sugar cane [1]. Potato tuber is regarded as a substantial fount of energy because of its high content of starch, representing 60–80% of the dry matter, but it is also rich in proteins with a well-balanced aminoacidic profile compared to other plant-derived foodstuffs, as well as minerals (calcium and potassium) and vitamin C. Moreover, a wide range of health benefits has been attributed to the phytochemicals of potato tubers, such phenolic acids, flavonoids, and carotenoids [2].
Potato landraces with specific peculiarities (purple or red flesh, for instance) or clear geographical identity are increasingly more attractive to consumers. Late or early potato varieties also occupy an important niche in the international market, but potatoes produced at lower costs may be illegally sold as high-quality, extra-seasonal varieties [3]. In the framework of European policy on the safeguard and valorization of the regional agronomical specialties, several potato landraces cultivated in specific territories of various countries, including Italy, Spain, UK, France, and Greece, have received PDO (Protected Designation of Origin) or PGI (Protected Geographical Indication) certification marks [4]. The first mark in particular can be considered the highest recognition of geographical unicity of cultivars and their strong link to specific pedo-climatic conditions of the growing site [5]. In this context, the possibility of determining the geographical origin of potato accessions is a powerful tool to guarantee the authenticity of the typical or certified products and protect the consumers from commercial fraud. The genetic resources of a specific territory are generally characterized by morphological descriptors that are useful marker types accepted by the International Union for Protection of New Varieties of Plants [6]. However, many morphological characters are influenced by environmental factors; for this reason, the genetic characterization of the local germplasm is assessed via a combination of morphological and molecular markers [7,8].
An increasing number of scientific studies are aimed at developing analytical/chemometric strategies for the geographical classification of potato landraces or the differentiation of tubers obtained using conventional and biological cultivation. Multi-elemental analysis of the mineral and trace metal content of potato tubers [3,9,10,11,12], which reflect the composition of the soil and the environment where they grow, is a powerful tool for establishing the geographical place of origin; however, it was observed that the influence of soil type on the chemical composition of the tubers is also dependent on the cultivar. The isotopic ratios of the stable bio-elements, which influenced by local agricultural practice regimes together with geoclimatic factors and soil type, are also promising markers of the cultivation region and cultivar [13,14,15]. In addition, metabolomic approaches by means of gas- or liquid-chromatography and nuclear magnetic resonance [2,12,16,17] can identify various primary and secondary metabolites, including carbohydrates, amino acids, organic acids, volatile compounds, sterol lipids, and cerebrosides, which are potentially useful for classifying potatoes on the basis of the geographical origin and/or botanical variety.
Near- and mid-infrared vibrational spectroscopies have been extensively applied to trace foodstuffs [18,19,20,21,22]. Compared with targeted analytical methods (such as those based on the gas- or liquid-chromatographic determination of specific marker molecules), infrared spectroscopy allows for the quick collection of a comprehensive fingerprint of the food composition by means of robust and relatively cheap instrumentation with no or simple pre-treatment of the sample. Regarding potato characterization, infrared spectroscopy is one of the most powerful and versatile techniques for the elucidation of various physico-chemical aspects, including the structure and conformation of the organic constituents, the determination of texture properties or the degree of order in polysaccharides, and for the monitoring of natural or process-induced changes in tuber composition [23,24,25,26,27,28]. Vibrational spectroscopy was also utilized to investigate the effect of irradiation [29], microwave baking [28], and adulteration of flour or puree [30,31], but this technique was rarely used before to classify potatoes on a varietal basis, and to this end, near-infrared spectroscopy was exclusively applied [32,33,34].
In the present work, attenuated total reflectance Fourier transform infrared (ATR-FTIR) spectroscopy in the mid-range (4000–400 cm−1) was utilized to attempt a discrimination of autochthone potato accessions cultivated in the mountain territory of Majella National Park (Abruzzo, Italy) and commercial varieties usually grown in the same area. Apart from the safeguard of natural biodiversity and the wilderness, many actions are currently being implemented in the Majella National Park to valorize the local germplasm [35,36] and promote the sustainable economic development of rural areas. In this context, the plant genetic resources of the Majella National Park, including potatoes, have been recently rediscovered. Valorization of these local agronomical specialties also requires approaches that can discriminate them from commercial products. This work focused on the discrimination of three potato landraces that have been historically cultivated within the territory of the park and five non-local varieties. The latter include four commercial varieties and one old ecotype coming from the nearby Gran Sasso-Laga National Park (Figure 1). All the accessions investigated in this work were grown in the same experimental field located within the territory of Majella National Park. Therefore, the possible variability related with the pedoclimatic features of the cultivation site was removed. Preliminarily, a characterization of potato accessions was performed using selected morpho-agronomic traits. In addition, we performed microsatellite (SSR) DNA analysis to properly identify these accessions in comparison to other commercial potato varieties that are locally grown. Varietal classification of the potatoes based on the ATR-FTIR spectra was conducted using partial least squares discriminant analysis, which is suitable for handling large spectroscopic data matrices in food traceability problems.

2. Materials and Methods
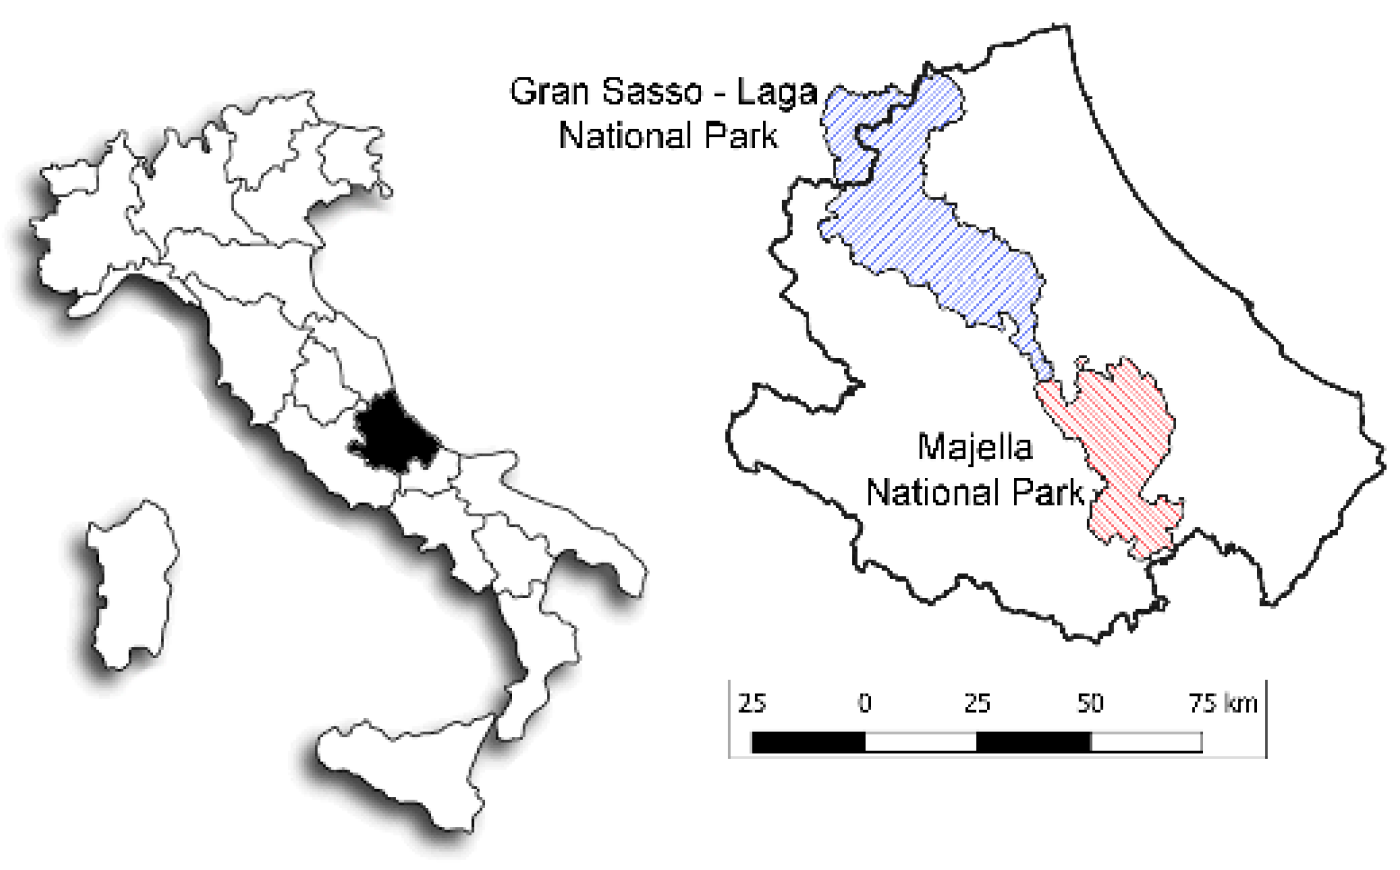
2.1. Potato Samples

Eight different potato accessions were investigated: Gamberale (GA), Turchesa (TU), Montenerodomo (MO), Pizzoferrato (PI), Désirée (DE), Agria (AG), Kennebec (KE), and Spunta (SP). GA, MO, and PI potato accessions are named according to the localities of the Majella National Park where they are traditionally cultivated, whereas TU is a local variety the comes from the nearby Gran Sasso-Laga National Park (Figure 1). DE, AG, KE, and SP are commercial varieties that are also usually grown by the farmers of the Majella National Park. Tubers of the eight potato varieties are displayed in Figure A1 (Appendix A).

2.2. Potato Cropping

Potatoes were grown in an experimental field located in Montenerodomo (CH), one of the 39 municipalities included in the Majella National Park territory, at an altitude of about 1000 m asl. The tubers of the commercial varieties were acquired in local markets, whereas tubers of the local accessions were kindly provided by farmers of the Majella National Park. A randomized block design with four replications was adopted. In each plot, ten tuber seeds were distributed in two rows, with inter- and intra-row distances of 0.70 and 0.40 m, respectively. The tubers were planted in April 2018 and the cultivation techniques commonly applied by the farmers of the National Park of Majella were adopted. The tubers of all accessions were harvested on 10 September 2018.

2.3. Morpho-Agronomic Characterization of Potato Cultivars

A total of 22 morpho-agronomic traits of plants, leaves, flowers, and tubers (listed in Table 1) were used to characterize the eight potato accessions. These descriptors were mainly based on those proposed by the International Union for the Protection of New Varieties of Plants (UPOV) [6].

2.4. Genotyping

Genomic DNA was isolated from fully developed young leaves of three different plants for each accession using the GenEluteTM Plant Genomic DNA Miniprep Kit (Sigma-Aldrich, St. Louis, MO, USA). Genotyping was carried out with five microsatellite (SSR) primer pairs chosen based on their previously assayed discrimination power in a larger collection of potato varieties [12,37,38]. All SSRs were recommended at CIP (International Potato Center, www.cipotato.org) based on quality criteria, genome coverage, and locus-specific information content (Table A1). SSR-PCR and capillary electrophoresis were performed, as reported by Bontempo et al. [39]. The alleles for SSR locus of each potato genotype were assigned with their molecular size and scored as present (1) or absent (0) using GeneScan Analysis software (version number 3.1, Applied Biosystems, Foster City, CA, USA). A similarity matrix was calculated using the Dice coefficient [40] with the program DendroUPGMA (http://genomes.urv.es/UPGMA/) [41]. Through the unweighted pair group method with arithmetic mean (UPGMA) algorithm, it was possible to construct a tree diagram (dendrogram) to illustrate the genetic clustering of the potato varieties under investigation. The R software version 3.2.1 (R Foundation for Statistical Computing, Vienna, Austria) was employed to build the diagram.

2.5. ATR-FTIR Measurements

The infrared spectra of the potato samples were recorded on a PerkinElmer Spectrum Two™ (PerkinElmer, Waltham, MA, USA) FTIR spectrometer consisting of a deuterated triglycine sulfate (DTGS) detector and a PerkinElmer Universal Attenuated Total Reflectance (uATR) accessory equipped with a single bounce diamond crystal. Each spectrum was registered from 4000 cm−1 to 400 cm−1 with a 4 cm−1 instrumental resolution and ten scans were averaged per spectral replicate. The background was collected with the crystal exposed to the air. Before each measurement, the ATR crystal was cleaned with methanol and air dried. ATR-FTIR spectra were collected on different sections of each potato tuber obtained by cutting the tubers in thick slices and by contacting the central part of the slice with the ATR crystal. A consistent force was applied using the pressure monitoring system integrated with the instrument to maximize the spectrum intensity. The spectra were collected from eight to nine tubers of each accession and three to five spectra were recorded from each tuber at different depths. The tubers analyzed using ATR-FTIR were randomly extracted from those with size >60 mm (descriptor N4 in Table A1, Appendix A) collected during morpho-agronomic analysis (ranging between about 30 and 180, depending on the accession) and stored in the dark in a dry and fresh room. Acquisition of the spectra of the various accessions was carried out in a random order and was completed in one week in December 2018 to avoid variations caused by differences in aging.

2.6. Multivariate Statistical Analysis

Principal component analysis (PCA) and hierarchical agglomerative cluster analysis (HCA) were applied to the morpho-agronomic data. PCA [42] allows for representing multivariate information in a low-dimensionality space defined by a relatively small number of uncorrelated principal components (PCs). PCs are obtained using an orthogonal transformation of the original data in such a way that the first is oriented along the direction of maximum variance and the successive PCs in turn explain the greatest fraction of residual variance under the constraint of mutual orthogonality between the components. Transformation of the original data matrix X is mathematically described by Equation (1):
X = TPT + E,
where the columns of matrix P (loadings matrix) define the PC directions, the columns of matrix T (scores matrix) are the coordinates of the samples in the PC space, and the error matrix E collects the residuals associated with the approximation of the original data when fewer PCs than the original number of variables are extracted. Usually, the scores are graphically projected onto the two- or three-dimensional space of the most significant components (score plots), which allows for a straightforward visualization of the trends within the data samples, such as clustering, retaining most of the original information. The loadings can be also plotted (loading plot) in the compressed PC subspace to visualize the relationships between the original variables and the relative weight of each variable in the selected PCs.
In HCA [43], single objects are gradually connected to each other in groups according to similarity, which is inversely related to the distance between objects. The final sequence of merges is graphically represented in a dendrogram, with the vertical axis showing the similarity measure at which each successive object joins a group. In this work, the usual Euclidean distance was selected to compute the similarity and the average linkage method was the clustering algorithm.
The classification of potato varieties was attempted using partial least squares discriminant analysis (PLS-DA). PLS-DA [44,45] takes its origin from partial least squares regression, which allows one to link a matrix X (i.e., raw experimental data) with a multi-response matrix Y (PLS-2 regression) and overcome limitations related with an ill-conditionate covariance matrix (as in the case of a greater number of X variables than the objects). The regression model is built by iteratively extracting latent variables from X factors and Y responses (also referred to as X-scores and Y-scores, respectively). The extracted X-scores are used to predict the Y-scores, and indirectly, the model responses. In classification problems, the model response is categorized via the generation of a dummy binary Y matrix in which 1 and 0 indicates the “in-group” and “out-group” samples, respectively. After the regression model has been built using a calibration data set, the calibration or even external samples are classified according to the computed or predicted outputs. However, the PLS-DA responses are continuous and not binary, and therefore a threshold must be defined to assign the objects; the value 0.5 was used in this work. The optimal number of latent variables in the PLS-DA model was determined using leave-one-out cross-validation. Multivariate statistical analyses were run in Matlab (version 2015b, The Mathworks, Natick, MA, USA) using in-house routines.

3. Results and Discussion

3.1. Morpho-Agronomic Characterization of Potato Accessions

The results of the morpho-agronomic characterization of potato accessions are graphically shown in Figure 2. The average of four replicates for each accession, collected in Table A1 (Appendix A), and the descriptors were simultaneously projected onto the space of the first three principal components (PCs), accounting for 58.8% of the variance. Plots (a) and (b) of Figure 2 display the biplots in the PC1–PC2 and PC1–PC3 planes, respectively.
Figure 2a reveals a neat separation of the TU potatoes and a clustering of the remaining samples into distinct groups separated along PC1: the first group collected the samples of three commercial varieties—AG, KE, and SP—while the latter was formed by the samples of the commercial potato DE together with those belonging to the three accessions grown in Majella National Park—MO, GA, and PI. Within each of these two groups, most of the samples belonging to different accessions overlapped, especially those of the first group. The descriptors with higher loadings on PC1, namely W, 23, N4, 30, 34, and 28 (defined in Table 1), were the morpho-agronomic traits that were more influential in the differentiation of the two clusters and the isolation of the TU accession. On the other hand, PC2 seemed to essentially describe the variability internal to the replicates of each potato accession, which was mainly associated with the N1, N2, and N3 descriptors. The samples of the three commercial potatoes—AG, KE, and SP—were still grouped together along PC3 (Figure 2b), while those belonging to the DE, MO, GA, PI, and TU accessions were instead well separated along this component. The morpho-agronomic traits 26, 14, 19, and 35 were mainly responsible for this differentiation. In summary, the samples of five potato varieties (MO, PI, GA, DE, and TU) clustered in distinct groups. Concerning the three commercial cultivars of AG, KE, and SP, variability within the replicates seemed, by contrast, to be greater than the differences among the varieties. Nevertheless, treatment of the morpho-agronomic data matrix by means of HCA revealed a clustering of potato samples, including AG, KE, and SP, into eight distinct groups (Figure 3), each corresponding to a given variety. Similarities among the various clusters roughly reflected the reciprocal position of the potato classes within the explored PC subspace.
The better separation of AG, KE, and SP varieties in the HCA analysis compared to PCA was not surprising considering that some information on the morpho-agronomic characters may not be retained by the first three components selected in PCA, which explained less than 60% of variance.

3.2. DNA Fingerprinting

Five SSR markers were used to evaluate the diversity of the samples at the genetic level. Due to their high mutation rate and extensive genome coverage, these markers have been successfully adopted in various applications, including plant DNA fingerprinting [46]. In addition, the SSR markers assayed in this study belong to the robust and highly informative microsatellite-based genetic identity kit set up by Ghislain et al. [47], and have been proposed as a reference for standardizing potato germplasm analyses across laboratories. In total, 21 alleles were identified, with an average of 4.2 alleles per locus. The number of alleles per marker varied from 2 (locus STP0AC58) to 7 (locus STI 001) (Table A2, Appendix A). To evaluate the strength of the relationship among the analyzed samples, an UPGMA dendrogram was built (Figure 4). The genetic distances between potatoes studied here varied from 0.52 (between AG and TU) to 1.00 (GA and DE, PI and TU), with an average value of 0.74 (Table A3, Appendix A). Overall, the dendrogram allowed for distinguishing several clusters. In particular, as DNA markers (such as SSR) are not environmentally influenced [48], genotypes were clustered according to their genetic makeup, regardless of the sampling area. The DE and GA local accessions were grouped together with the control DE. Similarly, PI and TU fell into the same group due to their high genetic similarity. By contrast, MO and AG were sorted into different clusters, displaying an independent genetic status compared to the other genotypes. Our findings demonstrate that SSR analysis was useful for providing a reliable discrimination of potato accessions collected in Majella National Park and providing a clear picture of their genetic relationships with other varieties included in the study.

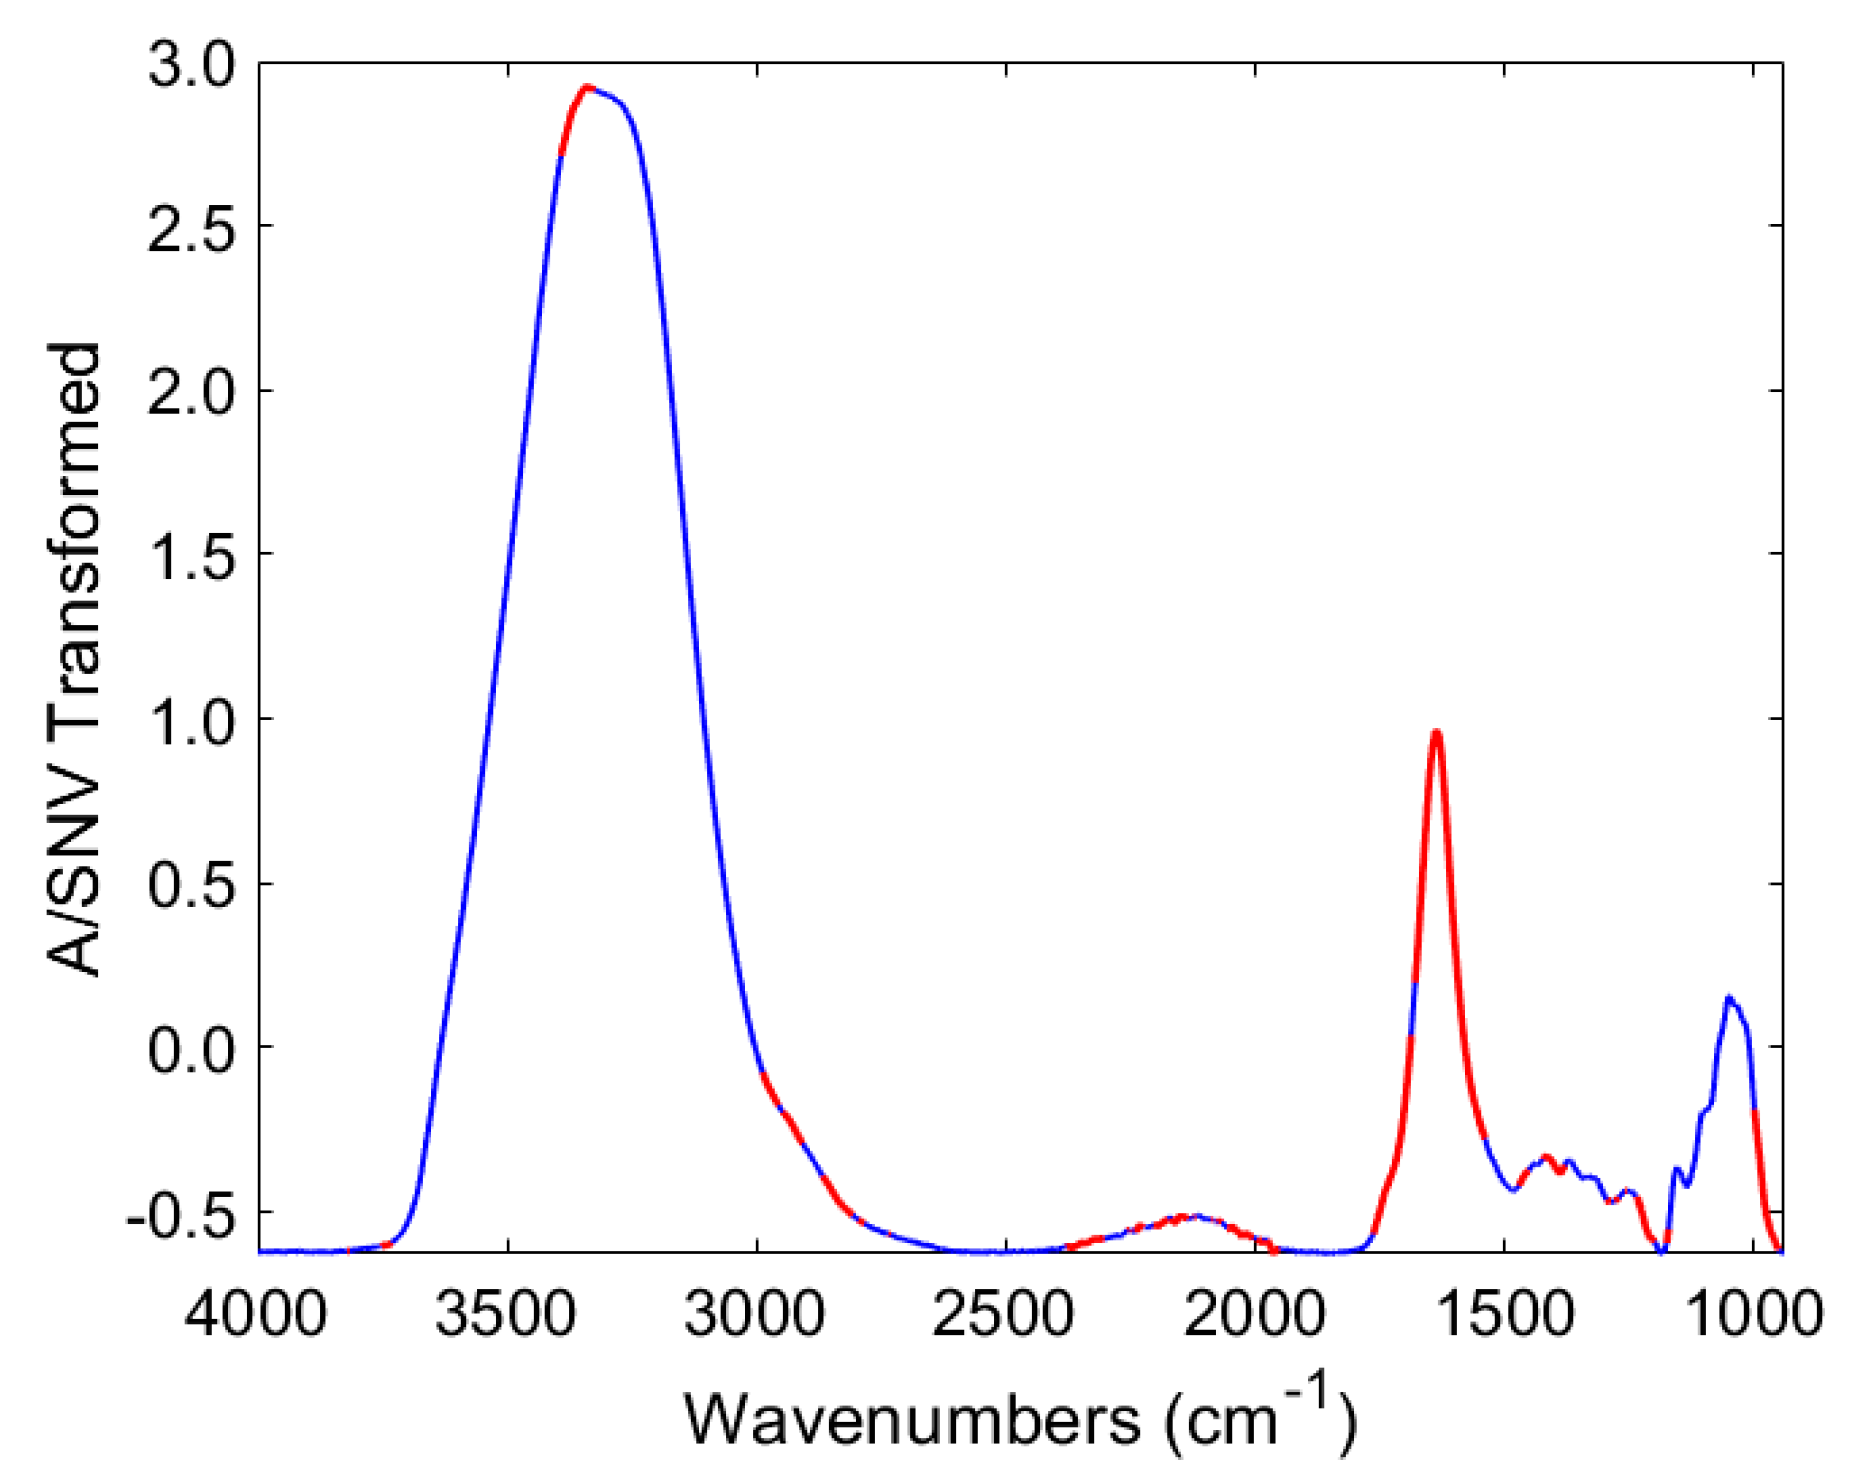
3.3. Characterization of Potatoes Using ATR-FTIR Spectroscopy

Figure 5a displays the ATR-FTIR spectra in the range 4000–940 cm−1 acquired from representative samples of the eight potato accessions, which reflected the typical tuber flesh composition [32,49], mainly consisting of water (77%–80%) and carbohydrates (9%–19%, predominantly starch), followed by minor components, such as proteins (≈2%), fibers (0.4%–0.8%), lipids (0.1%), and organic acids (0.4%−1%). Absorption bands in the 1800–940 cm−1 range are shown in Figure 5c. The spectral region below 940 cm−1, showing a continuous absorption band with no fine structure, was not used in the classification analysis. The broad absorption band at 3750–2800 cm−1 was associated with the O–H stretching vibrations of carbohydrates and water [50]. This band strongly overlapped with the signals ascribed to the symmetric and asymmetric stretching modes of the C–H bond that appeared as a single shoulder in the region near 2930 cm−1. The broad band centered at about 2100 cm−1 was ascribed to the rocking and scissoring vibrations of water molecules not directly bound to starch. The relatively sharp signal at 1800–1500 cm−1 was associated with the vibrations of water molecules adsorbed in the amorphous regions of starch [31]; however, the amide I and amide II peaks of proteins also fall in this spectral range [26]. The shoulder at about 1742 cm−1 was assigned to the C=O stretching of lipids and organic acids [51]. Previous studies revealed that the intensity of the absorption bands at 3750–2800, 2100, and 1800–1500 cm−1 is directly related to the hydration degree of the potato starch [31]. The weak and partially superimposed bands in the spectral range between 1500 and 1200 cm−1 were predominantly due to the deformational modes of the CH/CH2 groups [50]. The absorption bands between 1150 and 940 cm−1 arose from the coupling of C–O, C–C and C–O–H stretching, and the C–O–H bending of starch. Despite the poor resolution and overlapping of the related signals, which did not allow for an unequivocal attribution, changes in this region were ascribed to the differences in the relative amounts of amorphous and crystalline starch and hydration of the crystalline form [26].

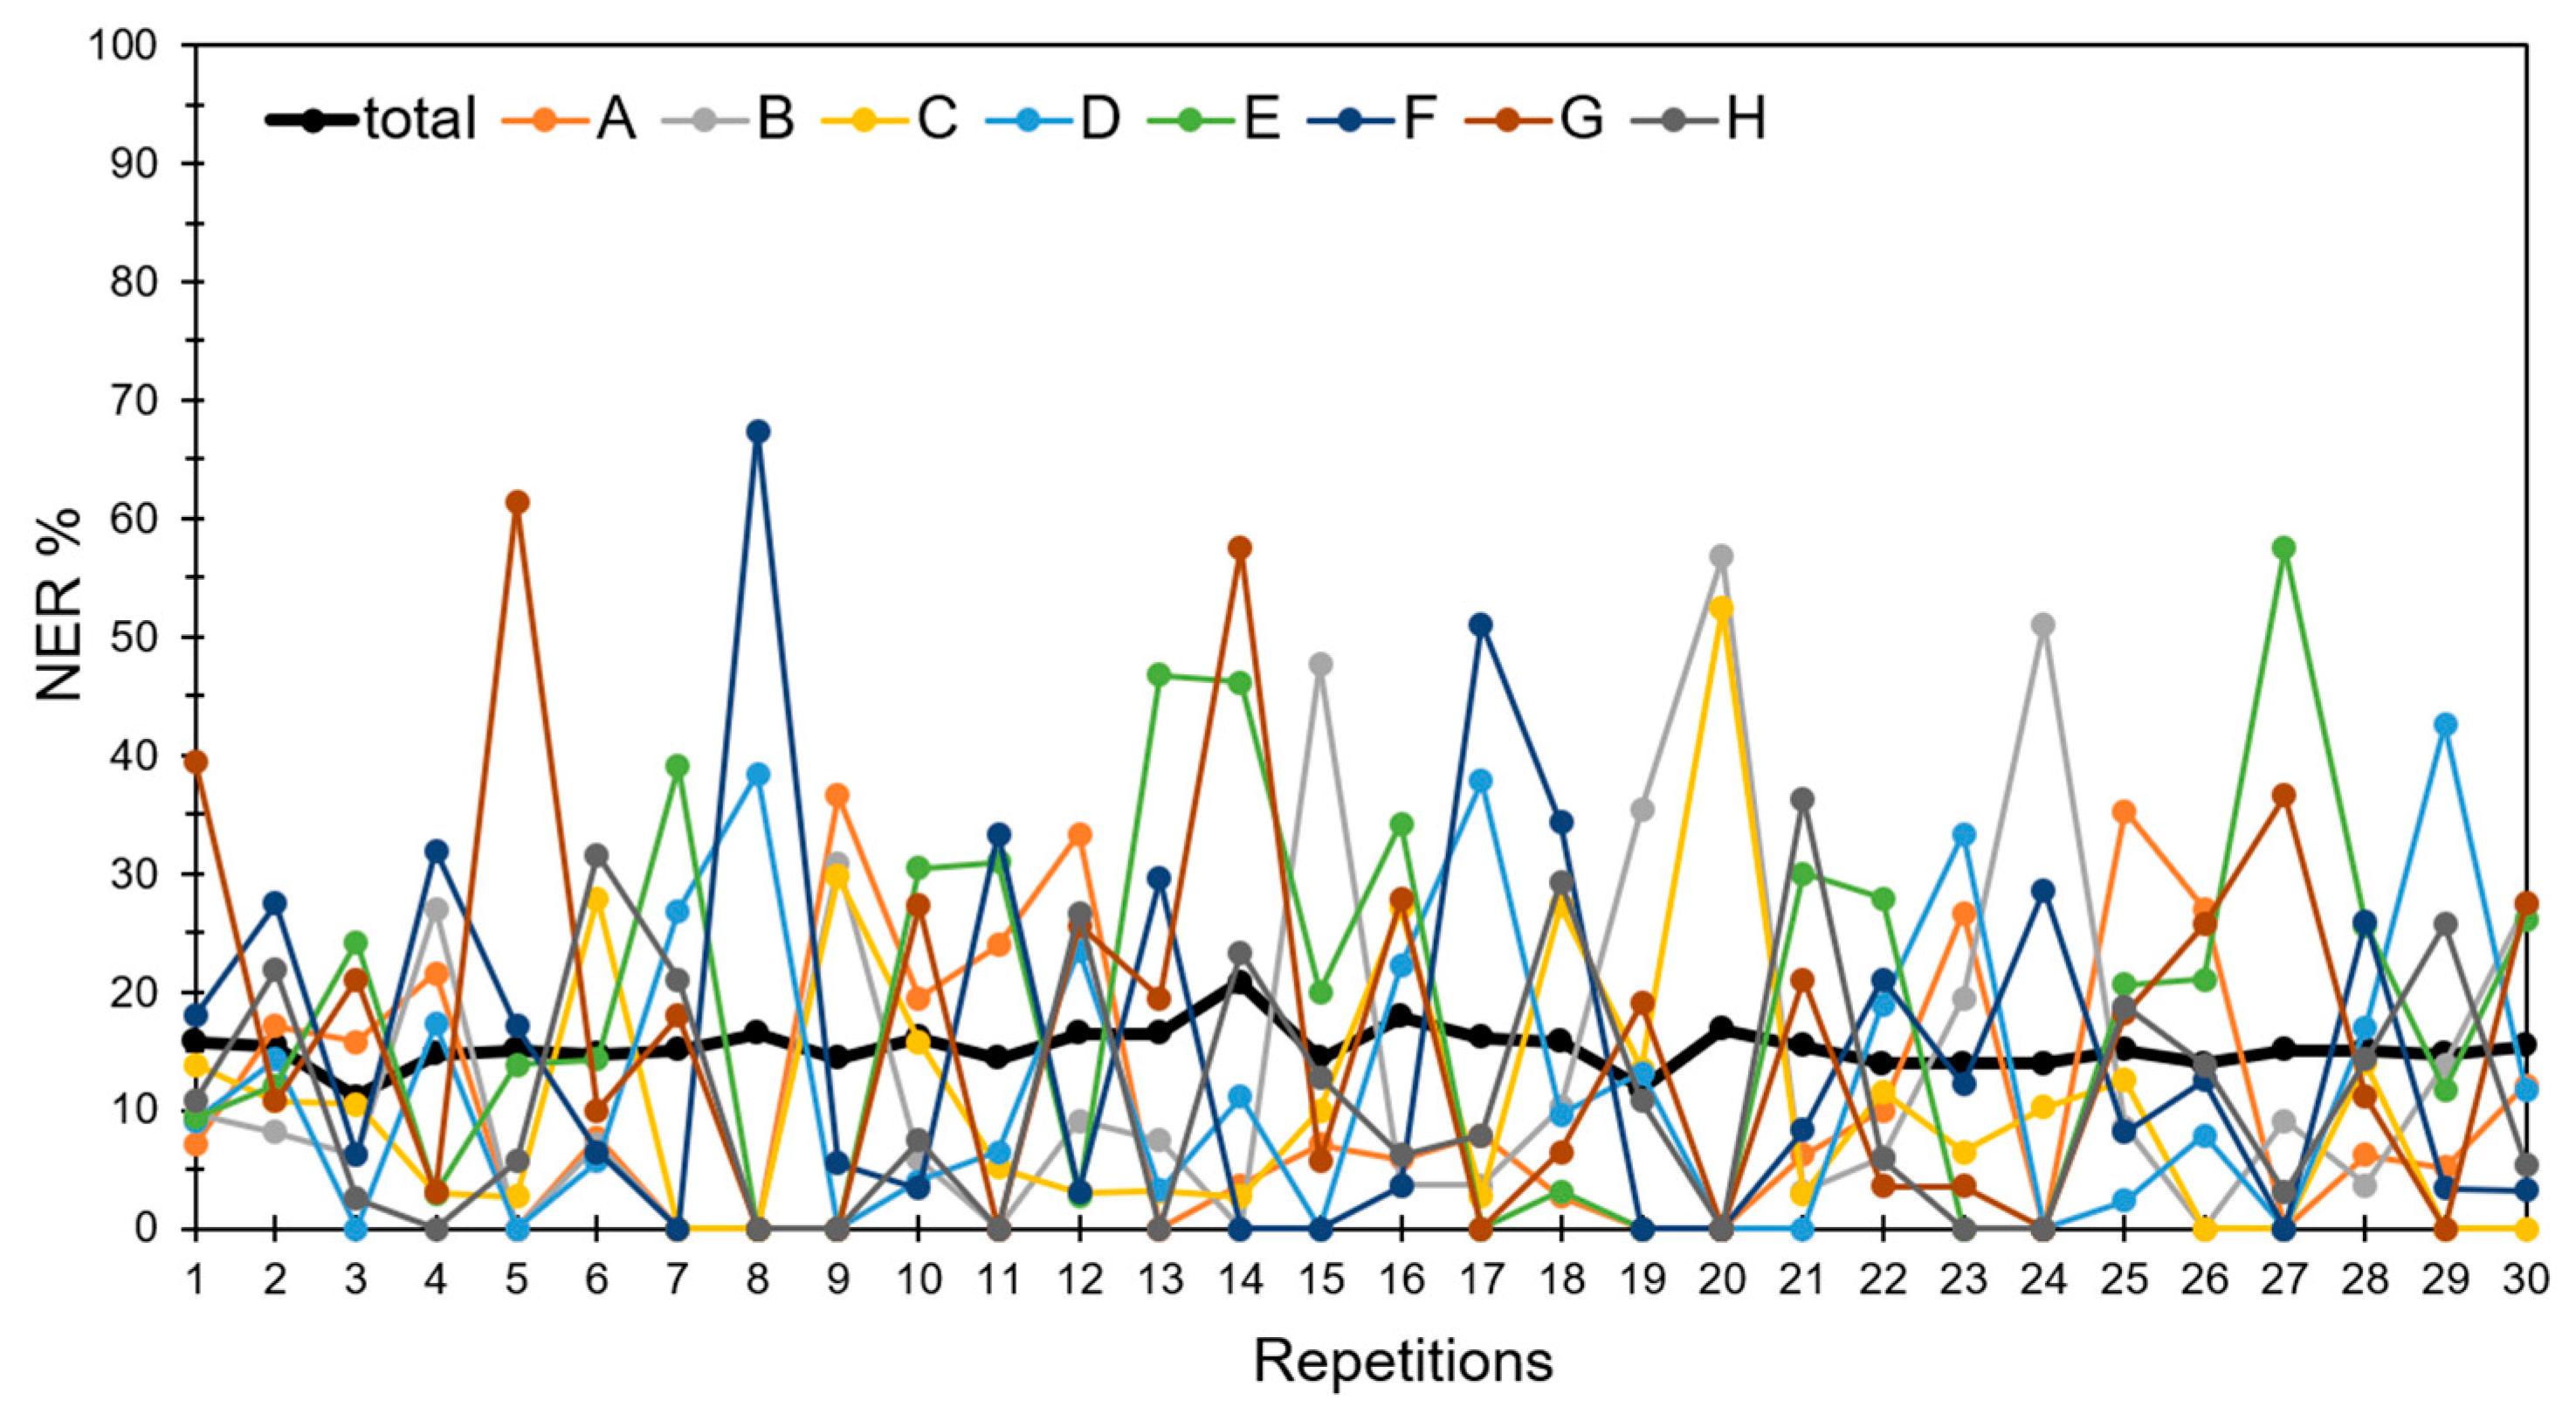
3.4. Discrimination of Potato Varieties Using the PLS-DA of ATR-FTIR Spectra

A total of 279 ATR-FTIR spectra were collected by analyzing different slices extracted from 7–9 tubers of each accession (Figure 5a). ATR distortion of the relative intensities of the bands and shifts occur at lower frequencies, which can crucially affect quantitative analyses or accurate band assignments; however, this was expected to have a negligible impact on the fingerprinting ability of the infrared spectra in the classification of the potato accessions. Therefore, ATR correction on the spectra was not performed. The data matrix was partitioned into calibration and prediction data sets consisting of 194 and 85 samples, respectively, via application of the duplex Kennard–Stone algorithm [52] to ensure a good representativeness of both groups. Finally, each potato category was represented using a variable number of calibration samples ranging from 19 (SP) to 29 (MO), whereas the external samples belonging to a given potato accession ranged from 8 (SP) to 13 (MO). The raw ATR-FTIR spectra were subjected to various pre-processing methods [53], namely standard normal variate (SNV), first- and second-derivative transformation, and their combinations, with the aim of removing spurious variability and/or enhancing the systematic differences within the spectra profiles. In particular, SNV consists of autoscaling on the rows such that every spectrum will have a mean of 0 and a standard deviation of 1 after scaling. The Savitzky–Golay approach with a 15-point window was applied in the first- and second-derivative transformation using second- and third-order polynomial fittings, respectively. Regardless of the pre-treatment mode applied to the ATR-FTIR spectra, PLS-DA was conducted on the autoscaled variables (autoscaling on columns). The influence of the spectra pre-treatment on the PLS-DA predictive performance was evaluated using leave-one-out cross-validation. The comparison of the proportion (%) of correctly classified samples for various pre-processing methods, reported in Table 2, revealed that SNV scaling (Figure 5b) provided the best results, with over 97% of classifications being correct. It is worth noting that discrimination based on the raw spectra was noticeably worse (87.1% of correct classifications in cross-validation), despite a relatively wide variability in their intensities. Such differences are probably related with variations in the extent of the contact of the potato flesh with the ATR crystal, which can only be partially controlled through the pressure monitoring system integrated with the instrument. SNV scaling seemed to remove this kind of random variability and to enhance the spectral differences due to the potato accession, especially at lower wavenumbers (Figure 5c).
The proportion of correctly assigned potato samples in the calibration and external prediction is reported in Table 3, whereas Figure 6 graphically displays the calculated and predicted PLS-DA responses for each class. In each insert of Figure 6, the data above or below the line represent the samples accepted or refused, respectively, by a given class.
Inspection of Figure 6 reveals that all the calibration samples belonging to the accessions GA, MO, AG, and KE were correctly classified, while one or two classification errors can be observed for the other potato samples with the associated proportions of correct classifications ranging between 90.9% and 96.0% (Table 3). Concerning the external potato samples, the number of classification errors ranged between one (AG) and three (GA and TU). Because of the lower number of prediction samples compared to the calibration data, the percentage of correctly predicted classes was slightly worse than that in calibration. The observed values, ranging between 72.7% (TU) and 90.9% (AG), do however indicate a good predictive performance of the PLS-DA model. To further confirm the reliability of the classification model, PLS-DA was used to discriminate between the potato samples after shuffling the classes. To this end, 30 different random assignments of the 194 calibration samples into eight categories were generated and PLS-DA classification was applied for every repetition. The model predictive performance was evaluated using cross-validation with five cancellation groups. The trend of prediction errors over the 30 repetitions is displayed in Figure A2 (Appendix A). It can be observed that the proportion of correctly assigned samples to individual groups only rarely surpassed 40% and the total error was less than 15%, much lower than that observed when PLS-DA was applied to the true potato classes. It follows that the ATR-FTIR spectra of tubers really contained information on the potato accession and the good prediction results provided by PLS-DA applied to the true classes is unlikely to have occurred by chance.
The influence of the various regions of the ATR-FTIR spectrum in the discrimination of the potato samples using PLS-DA was quantified using VIP (variable importance in the projection) scores [54]. The variables with VIP indices greater than one are usually assumed to be significant. The results of the VIP analysis are displayed in Figure 7.
The most influential regions of the ATR-FTIR spectrum (VIP > 1) in the potato discrimination that could be unequivocally assigned included the spectral regions around 3370 cm−1 and 2900 cm−1 associated with the O–H and C–H stretching signals, respectively, and the bands centered at 2100 and 1640 cm−1, which were attributed to the vibrational modes of free water molecules and those bound to starch, respectively. The intensity of the infrared spectrum in these regions has been related to the level of hydration of starch [31], which can be considered a character of potato flesh that is mainly influenced by the kind of accession. It is worth noting that, as described in Section 2.2, the eight potato accessions investigated in this study were grown in the same experimental field and the plants were not artificially irrigated. Therefore, the effect of possible differences in watering on the potato flesh composition can be neglected.

4. Conclusions

The ATR-FTIR spectrum of potato flesh, although dominated by the high content of moisture and starch in the tubers, which may hide the potential role of minor constituents, provides useful information on the origin of potato accessions. Chemometric treatment of the ATR-FTIR spectra allowed for discrimination of the potato cultivars with a good accuracy. These results confirmed the great potentiality of mid-infrared spectroscopy toward tracing foodstuffs. Because of the low cost, easy use, and minimal sample manipulation, ATR-FTIR can be preferred to more sophisticated instrumental techniques used for the varietal/geographical discrimination of cultivars.
The results obtained in this study are useful for the characterization and valorization of local germplasm. In particular, the molecular markers suggest that the potato accession named Montenerodomo, cultivated in Majella National Park, can be considered a local variety and can be registered into the Regional Voluntary GR Register and entered into the foreseen protection scheme, as reported by the Italian regional laws [48].

Author Contributions

Conceptualization, A.A.D. and L.D.M.; methodology and validation, R.A., E.A., F.V., and A.A.D.; software, R.G., R.T., and F.D.D.; formal analysis and data curation, R.G., R.T., and F.D.D.; investigation, R.G., R.T., V.D.C., and F.D.D.; resources, M.D.S., G.M., V.D.C., and L.D.M.; data curation, R.G.; writing—original draft preparation, review and editing, A.A.D.; project administration, M.D.S. and G.M.; funding acquisition, L.D.M. All authors have read and agreed to the published version of the manuscript.

Funding

This research was funded by Majella National Park, within the Project “Tipizzazione di specie vegetali endemiche, crop wild relatives e varietà agricole autoctone del Parco della Majella mediante metodi analitici ed approcci statistici multivariati” with the Dipartimento di Scienze Fisiche e Chimiche, Università degli Studi dell’Aquila, and within the Project “Coltiviamo la diversità-Caratterizzazione e conservazione del germoplasma agricolo autoctono del Parco Nazionale della Majella” with the Dipartimento di Scienze Agrarie, Alimentari ed Ambientali, Università degli Studi di Perugia.

Conflicts of Interest

The authors declare no conflict of interest.

Appendix A

Figure A1. Tubers of some of the investigated potato accessions.
Applsci 10 01630 g0a1
Figure A2. Proportion (%) of correctly classified potato samples using PLS-DA in cross-validation.
Applsci 10 01630 g0a2
Table A1. Values of the morpho-agronomic descriptors defined in Table 1 for the eight potato accessions.
Accession1213141617192021232426283032343536N1WN2N3N4
AG121351756771542248114.7142146
2512517567311422410515.8174642
2535.8537567711422414918.0594545
2632517567711422412218.6244949
DE16753.65513774743227612.2162931
1574.43.65513774.87532212918.0305841
26.27337553773.96.343228616.8123143
2573365337745332215216.4734039
GA25.274.4375.841553.76.443221039.4522526
25.85.43335.831554.67432210112.6343334
25.854.233.673.8157455322797.7293614
255435731553.9743228610.0333221
KE3512.231734371141216811.8122828
3512617143711333115518.7733646
34.211317143711422113318.7414745
24.211.6317143711422112016.9423642
MO14.45354.451257594322876.934467
1354.155532573.8743221429.5725515
13.85535512575743221016.547468
233557522575.7743121228.65724010
PI255333.6713958.39444116912.8896416
25333373.439599444117314.0727724
1333337537597444112312.3515616
23.8554556.237599544118315.1937317
SP24336.41715351153237612.2162931
12.211.8317153715512314120.2386241
2574.43.657153511522315219.5605933
2511517153511512313619.0604828
TU1734.53.5375175996441435.516207
24.634.23.4355175995441814.552254
2544.73373155995441545.9241911
253.745353155995441534.434811
Table A2. List of microsatellite loci used for genotyping the eight potato accessions. For each locus, the repeated pattern, the primer sequences, the annealing temperature (Ta), the chromosome position, and alleles found are reported.
LocusMotifPrimerTaMapTotal Found Alleles
STM5121(TGT)5FW: CACCGGAATAAGCGGATCT48XII301, 305, 308
RW: TCTTCCCTTCCATTTGTCA
STI0001(AAT)nFW: CAGCAAAATCAGAACCCGAT60IV196, 199, 202, 205, 207, 210
RW: GGATCATCAAATTCACCGCT
STM1064(TA)12..(TG)4 GT (TG)5FW: GTTCTTTTGGTGGTTTTCCT55II207, 210, 212
RW: TTATTTCTCTGTTGTTGCTG
STG0016(AGA)8FW: AGCTGCTCAGCATCAAGAGA55I142, 149, 152, 155, 173
RW: ACCACCTCAGGCACTTCATC
STPoAc58(TA)13FW: TTGATGAAAGGAATGCAGCTTGTG55V250, 264
RW: ACGTTAAAGAAGTGAGAGTACGAC
Table A3. Dice similarity matrix of the eight potato genotypes based on SSR markers. Two control varieties (AG and DE) are also included.
DE_1DE_2DE_3KE_1KE_2KE_3GA_1GA_2GA_3MO_1MO_2MO_3TU_1TU_2TU_3SP_1SP_2SP_3PI_1PI_2PI_3AG_1AG_2AG_3AG_controlDE_control
DE_111.0001.0000.8280.8280.8281.0001.0001.0000.6920.6920.6920.7200.7200.7200.7860.7860.7860.7200.7200.7200.6150.6150.6150.6401.000
DE_2 11.0000.8280.8280.8281.0001.0001.0000.6920.6920.6920.7200.7200.7200.7860.7860.7860.7200.7200.7200.6150.6150.6150.6401.000
DE_3 10.8280.8280.8281.0001.0001.0000.6920.6920.6920.7200.7200.7200.7860.7860.7860.7200.7200.7200.6150.6150.6150.6401.000
KE_1 11.0001.0000.8280.8280.8280.6670.6670.6670.7690.7690.7690.7590.7590.7590.7690.7690.7690.5930.5930.5930.6150.828
KE_2 11.0000.8280.8280.8280.6670.6670.6670.7690.7690.7690.7590.7590.7590.7690.7690.7690.5930.5930.5930.6150.828
KE_3 10.8280.8280.8280.6670.6670.6670.7690.7690.7690.7590.7590.7590.7690.7690.7690.5930.5930.5930.6150.828
GA_1 11.0001.0000.6920.6920.6920.7200.7200.7200.7860.7860.7860.7200.7200.7200.6150.6150.6150.6401.000
GA_2 11.0000.6920.6920.6920.7200.7200.7200.7860.7860.7860.7200.7200.7200.6150.6150.6150.6401.000
GA_3 10.6920.6920.6920.7200.7200.7200.7860.7860.7860.7200.7200.7200.6150.6150.6150.6401.000
MO_1 11.0001.0000.6960.6960.6960.6920.6920.6920.6960.6960.6960.5830.5830.5830.6090.692
MO_2 11.0000.6960.6960.6960.6920.6920.6920.6960.6960.6960.5830.5830.5830.6090.692
MO_3 10.6960.6960.6960.6920.6920.6920.6960.6960.6960.5830.5830.5830.6090.692
TU_1 11.0001.0000.6400.6400.6401.0001.0001.0000.5220.5220.5220.5450.720
TU_2 11.0000.6400.6400.6401.0001.0001.0000.5220.5220.5220.5450.720
TU_3 10.6400.6400.6401.0001.0001.0000.5220.5220.5220.5450.720
SP_1 11.0001.0000.6400.6400.6400.7690.7690.7690.8000.786
SP_2 11.0000.6400.6400.6400.7690.7690.7690.8000.786
SP_3 10.6400.6400.6400.7690.7690.7690.8000.786
PI_1 11.0001.0000.5220.5220.5220.5450.720
PI_2 11.0000.5220.5220.5220.5450.720
PI_3 10.5220.5220.5220.5450.720
AG_1 11.0001.0000.9570.615
AG_2 11.0000.9570.615
AG_3 10.9570.615
AG_control 10.640
DE_control 1

References

  1. FAOSTAT Database. Available online: http://www.fao.org/faostat/en (accessed on 29 November 2019).
  2. Pacifico, D.; Casciani, L.; Ritota, M.; Mandolino, G.; Onofri, C.; Moschella, A.; Parisi, B.; Cafiero, C.; Valentini, M. NMR-based metabolomics for organic farming traceability of early potatoes. J. Agric. Food Chem. 2013, 61, 11201–11211. [Google Scholar] [CrossRef]
  3. Manzelli, M.; Romagnoli, S.; Ghiselli, L.; Benedettelli, S.; Palchetti, E.; Andrenelli, L.; Vecchio, V. Typicity in potato: Characterization of geographic origin. Ital. J. Agron. 2010, 5, 61–67. [Google Scholar] [CrossRef]
  4. European Commission. Agricultural and Rural Development DOOR Database. Available online: https://ec.europa.eu/agriculture/quality/door/list.html (accessed on 29 November 2019).
  5. Negri, V. Landraces in central Italy: Where and why they are conserved and perspectives for their on-farm conservation. Genet. Resour. Crop Evol. 2003, 50, 871–885. [Google Scholar] [CrossRef]
  6. UPOV TG/23/06, Potato (Solanum tuberosum L.)- Guidelines for the Conduct of Tests for Distinctness, Uniformity and Stability, International Union for the Protection of New Varieties of Plants. Available online: https://www.upov.int (accessed on 29 November 2019).
  7. Ferradini, N.; Torricelli, R.; Terzaroli, N.; Albertini, E.; Russi, L. The genetic structure of the Field Pea Landrace “Roveja di Civita di Cascia”. Sustainability 2019, 11, 6493. [Google Scholar] [CrossRef] [Green Version]
  8. Torricelli, R.; Silveri, D.D.; Ferradini, N.; Venora, G.; Veronesi, F.; Russi, L. Characterization of the lentil landrace Santo Stefano di Sessanio from Abruzzo, Italy. Genet. Resour. Crop Evol. 2012, 59, 261–276. [Google Scholar] [CrossRef]
  9. Di Giacomo, F.; Del Signore, A.; Giaccio, M. Determining the geographic origin of potatoes using mineral and trace element content. J. Agric. Food Chem. 2007, 55, 860–866. [Google Scholar] [CrossRef] [PubMed]
  10. Rivero, R.C.; Hernández, P.S.; Rodríguez, E.M.R.; Martín, J.D.; Romero, C.D. Mineral concentrations in cultivars of potatoes. Food Chem. 2003, 83, 247–253. [Google Scholar] [CrossRef]
  11. Galdón, B.R.; Rodríguez, L.H.; Mesa, D.R.; León, H.L.; Pérez, N.L.; Rodríguez Rodríguez, E.M.; Romero, C.D. Differentiation of potato cultivars experimentally cultivated based on their chemical composition and by applying linear discriminant analysis. Food Chem. 2012, 133, 1241–1248. [Google Scholar] [CrossRef]
  12. Adamo, P.; Zampella, M.; Quétel, C.R.; Aversano, R.; Dal Piaz, F.; De Tommasi, N.; Frusciante, L.; Iorizzo, M.; Lepore, L.; Carputo, D. Biological and geochemical markers of the geographical origin and genetic identity of potatoes. J. Geochemical Explor. 2012, 121, 62–68. [Google Scholar] [CrossRef]
  13. Chung, I.M.; Kim, J.K.; Jin, Y.I.; Oh, Y.T.; Prabakaran, M.; Youn, K.J.; Kim, S.H. Discriminative study of a potato (Solanum tuberosum L.) cultivation region by measuring the stable isotope ratios of bio-elements. Food Chem. 2016, 212, 48–57. [Google Scholar] [CrossRef]
  14. Camin, F.; Moschella, A.; Miselli, F.; Parisi, B.; Versini, G.; Ranalli, P.; Bagnaresi, P. Evaluation of markers for the traceability of potato tubers grown in an organic versus conventional regime. J. Sci. Food Agric. 2007, 87, 1330–1336. [Google Scholar] [CrossRef]
  15. Mahne Opatić, A.; Nečemer, M.; Budič, B.; Lojen, S. Stable isotope analysis of major bioelements, multi-element profiling, and discriminant analysis for geographical origins of organically grown potato. J. Food Compos. Anal. 2018, 71, 17–24. [Google Scholar] [CrossRef]
  16. Claassen, C.; Kuballa, J.; Rohn, S. Metabolomics-Based Approach for the Discrimination of Potato Varieties (Solanum tuberosum) using UPLC-IMS-QToF. J. Agric. Food Chem. 2019, 67, 5700–5709. [Google Scholar] [CrossRef] [PubMed]
  17. Longobardi, F.; Casiello, G.; Sacco, D.; Tedone, L.; Sacco, A. Characterisation of the geographical origin of Italian potatoes, based on stable isotope and volatile compound analyses. Food Chem. 2011, 124, 1708–1713. [Google Scholar] [CrossRef]
  18. Firmani, P.; De Luca, S.; Bucci, R.; Marini, F.; Biancolillo, A. Near infrared (NIR) spectroscopy-based classification for the authentication of Darjeeling black tea. Food Control 2019, 100, 292–299. [Google Scholar] [CrossRef]
  19. Biancolillo, A.; Marini, F.; D’Archivio, A.A. Geographical discrimination of red garlic (Allium sativum L.) using fast and non-invasive Attenuated Total Reflectance-Fourier Transformed Infrared (ATR-FTIR) spectroscopy combined with chemometrics. J. Food Compos. Anal. 2020, 86, 103351. [Google Scholar] [CrossRef]
  20. Biancolillo, A.; De Luca, S.; Bassi, S.; Roudier, L.; Bucci, R.; Magrì, A.D.; Marini, F. Authentication of an Italian PDO hazelnut (“Nocciola Romana”) by NIR spectroscopy. Environ. Sci. Pollut. Res. 2018, 25, 28780–28786. [Google Scholar] [CrossRef]
  21. Kouvoutsakis, G.; Mitsi, C.; Tarantilis, P.A.; Polissiou, M.G.; Pappas, C.S. Geographical differentiation of dried lentil seed (Lens culinaris) samples using Diffuse Reflectance Fourier Transform Infrared Spectroscopy (DRIFTS) and discriminant analysis. Food Chem. 2014, 145, 1011–1014. [Google Scholar] [CrossRef]
  22. Dominguez-Vidal, A.; Pantoja-De La Rosa, J.; Cuadros-Rodríguez, L.; Ayora-Cañada, M.J. Authentication of canned fish packing oils by means of Fourier transform infrared spectroscopy. Food Chem. 2016, 190, 122–127. [Google Scholar] [CrossRef]
  23. Santha, N.; Sudha, K.G.; Vijayakumari, K.P.; Nayar, V.U.; Moorthy, S.N. Raman and infrared spectra of starch samples of sweet potato and cassava. J. Chem. Sci. 1990, 102, 705–712. [Google Scholar] [CrossRef] [Green Version]
  24. Xu, G.-Y.; Liao, A.-M.; Huang, J.-H.; Zhang, J.-G.; Thakur, K.; Wei, Z.-J. Evaluation of structural, functional, and anti-oxidant potential of differentially extracted polysaccharides from potatoes peels. Int. J. Biol. Macromol. 2019, 129, 778–785. [Google Scholar] [CrossRef] [PubMed]
  25. Wang, X.; Reddy, C.K.; Xu, B. A systematic comparative study on morphological, crystallinity, pasting, thermal and functional characteristics of starches resources utilized in China. Food Chem. 2018, 259, 81–88. [Google Scholar] [CrossRef] [PubMed]
  26. Warren, F.J.; Gidley, M.J.; Flanagan, B.M. Infrared spectroscopy as a tool to characterise starch ordered structure—A joint FTIR–ATR, NMR, XRD and DSC study. Carbohydr. Polym. 2016, 139, 35–42. [Google Scholar] [CrossRef] [Green Version]
  27. Shi, M.; Jing, Y.; Yang, L.; Huang, X.; Wang, H.; Yan, Y.; Liu, Y. Structure and Physicochemical Properties of Malate Starches from Corn, Potato, and Wrinkled Pea Starches. Polymers 2019, 11, 1523. [Google Scholar] [CrossRef] [Green Version]
  28. Su, W.-H.; Bakalis, S.; Sun, D.-W. Fourier transform mid-infrared-attenuated total reflectance (FTMIR-ATR) microspectroscopy for determining textural property of microwave baked tuber. J. Food Eng. 2018, 218, 1–13. [Google Scholar] [CrossRef] [Green Version]
  29. Kizil, R.; Irudayaraj, J.; Seetharaman, K. Characterization of irradiated starches by using FT-Raman and FTIR spectroscopy. J. Agric. Food Chem. 2002, 50, 3912–3918. [Google Scholar] [CrossRef]
  30. Ding, X.; Ni, Y.; Kokot, S. NIR spectroscopy and chemometrics for the discrimination of pure, powdered, purple sweet potatoes and their samples adulterated with the white sweet potato flour. Chemom. Intell. Lab. Syst. 2015, 144, 17–23. [Google Scholar] [CrossRef]
  31. Dankar, I.; Haddarah, A.; Omar, F.E.L.; Pujolà, M.; Sepulcre, F. Characterization of food additive-potato starch complexes by FTIR and X-ray diffraction. Food Chem. 2018, 260, 7–12. [Google Scholar] [CrossRef]
  32. López, A.; Arazuri, S.; García, I.; Mangado, J.; Jarén, C. A review of the application of near-infrared spectroscopy for the analysis of potatoes. J. Agric. Food Chem. 2013, 61, 5413–5424. [Google Scholar] [CrossRef] [Green Version]
  33. Su, W.H.; Bakalis, S.; Sun, D.W. Chemometrics in tandem with near infrared (NIR) hyperspectral imaging and Fourier transform mid infrared (FT-MIR) microspectroscopy for variety identification and cooking loss determination of sweet potato. Biosyst. Eng. 2019, 180, 70–86. [Google Scholar] [CrossRef]
  34. Tierno, R.; López, A.; Riga, P.; Arazuri, S.; Jarén, C.; Benedicto, L.; Ruiz de Galarreta, J.I. Phytochemicals determination and classification in purple and red fleshed potato tubers by analytical methods and near infrared spectroscopy. J. Sci. Food Agric. 2016, 96, 1888–1899. [Google Scholar] [CrossRef] [PubMed] [Green Version]
  35. Di Cecco, V.; Di Musciano, M.; D’Archivio, A.A.; Frattaroli, A.R.; Di Martino, L. Analysis of intraspecific seed diversity in Astragalus aquilanus (Fabaceae), an endemic species of Central Apennine. Plant Biol. 2019, 21, 507–514. [Google Scholar] [CrossRef] [PubMed]
  36. Di Martino, L.; Del Vecchio, S.; Di Cecco, V.; Di Santo, M.; Stanisci, A.; Frattaroli, A.R. The role of GA3 in the germination process of high-mountain endemic and threatened species: Leontopodium nivalePinguicula fiorii and Soldanella minima subsp. samnitica (central Apennines, Italy). Plant Biosyst. 2014, 148, 1231–1238. [Google Scholar] [CrossRef]
  37. Aversano, R.; Caruso, I.; Aronne, G.; De Micco, V.; Scognamiglio, N.; Carputo, D. Stochastic changes affect Solanum wild species following autopolyploidization. J. Exp. Bot. 2013, 64, 625–635. [Google Scholar] [CrossRef] [PubMed]
  38. Romano, A.; Masi, P.; Aversano, R.; Carucci, F.; Palomba, S.; Carputo, D. Microstructure and tuber properties of potato varieties with different genetic profiles. Food Chem. 2018, 239, 789–796. [Google Scholar] [CrossRef] [PubMed]
  39. Bontempo, P.; De Masi, L.; Carafa, V.; Rigano, D.; Scisciola, L.; Iside, C.; Grassi, R.; Molinari, A.M.; Aversano, R.; Nebbioso, A.; et al. Anticancer activities of anthocyanin extract from genotyped Solanum tuberosum L. “Vitelotte.”. J. Funct. Foods 2015, 19, 584–593. [Google Scholar] [CrossRef] [Green Version]
  40. Corliss, J.O.; Sneath, P.H.A.; Sokal, R.R. Numerical Taxonomy: The Principles and Practice of Numerical Classification. Trans. Am. Microsc. Soc. 1974, 93, 303. [Google Scholar] [CrossRef]
  41. Garcia-Vallvé, S.; Palau, J.; Romeu, A. Horizontal gene transfer in glycosyl hydrolases inferred from codon usage in Escherichia coli and Bacillus subtilis. Mol. Biol. Evol. 1999, 16, 1125–1134. [Google Scholar] [CrossRef] [Green Version]
  42. Wold, S. Principal component analysis. Chemom. Intell. Lab. Syst. 1987, 2, 37–52. [Google Scholar] [CrossRef]
  43. Brereton, R.G. Applied Chemometrics for Scientists; John Wiley & Sons Ltd.: Hoboken, NJ, USA, 2007; ISBN 0470016868. [Google Scholar]
  44. Ballabio, D.; Consonni, V. Classification tools in chemistry. Part 1: Linear models. PLS-DA. Anal. Methods 2013, 5, 3790–3798. [Google Scholar] [CrossRef]
  45. Brereton, R.G.; Lloyd, G.R. Partial least squares discriminant analysis: Taking the magic away. J. Chemom. 2014, 28, 213–225. [Google Scholar] [CrossRef]
  46. Vieira, M.L.C.; Santini, L.; Diniz, A.L.; Munhoz, C.D.F. Microsatellite markers: What they mean and why they are so useful. Genet. Mol. Biol. 2016, 39, 312–328. [Google Scholar] [CrossRef] [PubMed]
  47. Ghislain, M.; Núñez, J.; Del Rosario Herrera, M.; Pignataro, J.; Guzman, F.; Bonierbale, M.; Spooner, D.M. Robust and highly informative microsatellite-based genetic identity kit for potato. Mol. Breed. 2009, 23, 377–388. [Google Scholar] [CrossRef] [Green Version]
  48. Spooner, D.; van Treuren, R.C.; de Vicente, M.C. Molecular markers for genebank management. In IPGRI Tech. Bull. No. 10; IPGRI: Rome, Italy, 2005; ISBN 9789290436843. [Google Scholar]
  49. Leonel, M.; do Carmo, E.L.; Fernandes, A.M.; Soratto, R.P.; Ebúrneo, J.A.M.; Garcia, É.L.; dos Santos, T.P.R. Chemical composition of potato tubers: The effect of cultivars and growth conditions. J. Food Sci. Technol. 2017, 54, 2372–2378. [Google Scholar] [CrossRef] [Green Version]
  50. Wiercigroch, E.; Szafraniec, E.; Czamara, K.; Pacia, M.Z.; Majzner, K.; Kochan, K.; Kaczor, A.; Baranska, M.; Malek, K. Raman and infrared spectroscopy of carbohydrates: A review. Spectrochim. Acta Part A Mol. Biomol. Spectrosc. 2017, 185, 317–335. [Google Scholar] [CrossRef]
  51. Schulz, H.; Baranska, M. Identification and quantification of valuable plant substances by IR and Raman spectroscopy. Vib. Spectrosc. 2007, 43, 13–25. [Google Scholar] [CrossRef]
  52. Kennard, R.W.; Stone, L.A. Computer Aided Design of Experiments. Technometrics 1969, 11, 137–148. [Google Scholar] [CrossRef]
  53. Rinnan, Å.; Van Den Berg, F.; Engelsen, S.B. Review of the most common pre-processing techniques for near-infrared spectra. TrAC Trends Anal. Chem. 2009, 28, 1201–1222. [Google Scholar] [CrossRef]
  54. Wold, S.; Sjöström, M.; Eriksson, L. PLS-regression: A basic tool of chemometrics. Chemom. Intell. Lab. Syst. 2001, 58, 109–130. [Google Scholar] [CrossRef]
Figure 1. Geographical position of the Majella and Gran Sasso-Laga National Parks.
Applsci 10 01630 g001
Figure 2. Projection of the potato accessions and morpho-agronomic descriptors onto the (a) PC1–PC2 and (b) PC1–PC3 planes. Asterisks identify the accessions from the Majella National Park. Potato accessions are Gamberale (GA), Turchesa (TU), Montenerodomo (MO), Pizzoferrato (PI), Désirée (DE), Agria (AG), Kennebec (KE), and Spunta (SP). PC: Principal Component.
Applsci 10 01630 g002
Figure 3. Dendrogram showing the hierarchical clustering of potato samples based on the morpho-agronomic descriptors. Asterisks indicate the accessions from Majella National Park.
Applsci 10 01630 g003
Figure 4. Dendrogram of the eight potato genotypes created using unweighted pair group method with arithmetic mean (UPGMA) cluster analysis of microsatellite (SSR) marker data; the Dice coefficient was used to estimate the degree of similarity among genotypes. Asterisks identify the accessions from Majella National Park.
Applsci 10 01630 g004
Figure 5. (a) Raw and (b) standard normal variate (SNV)-scaled attenuated total reflectance Fourier transform infrared (ATR-FTIR) spectra of potato samples. (c) Mean SNV-scaled spectra in the 1800–940 cm−1 range for each accession. A: Absorbance.
Applsci 10 01630 g005
Figure 6. Calculated/predicted PLS-DA responses versus sample index. The open circles identify the external data samples and the red dotted line indicates the class threshold. Asterisks indicate the accessions from Majella National Park.
Applsci 10 01630 g006
Figure 7. Importance of variables in PLS-DA: variables with VIP > 1 (red) and VIP < 1 (blue).
Applsci 10 01630 g007
Table 1. List of the descriptors used in the morpho-agronomic characterization of the potato varieties.
Plant PartDescriptorsExpressionsAbbreviation
PlantHeight 1 = very short, 3 = short; 5 = medium; 7 = tall; 9 = very tall23 1
PlantGrowth habit3 = upright; 5 = semi-upright; 7 = spreading13
PlantAnthocyanin coloration of stem1 = absent or very weak; 3 = weak; 5 = medium; 7 = strong; 9 = very strong14
PlantFoliage structure1 = stem type; 2 = intermediate type; 3 = leaf type12
PlantFlower frequency1 = absent or very low; 3 = low; 5 = medium; 7 = high; 9 = very high24
LeafOpenness1 = closed; 3 = intermediate; 5 = open16
LeafPresence of secondary leaflets3 = weak; 5 = medium; 7 = strong17
LeafAnthocyanin coloration on midrib of upper side1 = absent or very weak; 3 = weak; 5 = medium; 7 = strong; 9 = very strong19
LeafWidth in relation to length of lateral leaflets3 = narrow; 5 = medium; 7 = broad20
LeafFrequency of coalescence of lateral leaflets1 = absent or very low; 3 = low; 5 = medium; 7 = high; 9 = very high21
FlowerAnthocyanin coloration on peduncle of inflorescence1 = absent or very weak; 3 = weak; 5 = medium; 7 = strong; 9 = very strong26
FlowerIntensity of anthocyanin coloration on inner side of corolla1 = absent or very weak; 3 = weak; 5 = medium; 7 = strong; 9 = very strong28
FlowerExtent of anthocyanin coloration on inner side of corolla1 = absent or very small; 3 = small; 5 = medium; 7 = large; 9 = very large30
TuberShape1 = round; 2 = short oval; 3 = oval; 4 = long-oval; 5 = long; 6 = very long 32
TuberColor of skin1 = light beige; 2 = yellow; 3 = red; 4 = red parti-colored; 5 = blue; 6 = blue parti-colored; 7 = reddish brown34
TuberColor of base of eye1 = white; 2 = yellow; 3 = red; 4 = blue35
TuberColor of flesh1 = white; 2 = cream; 3 = light yellow; 4 = medium yellow; 5 = dark yellow; 6 = red; 7 = red parti-colored; 8 = blue; 9 = blue parti-colored36
TuberAverage tuber numberNumberN1
TuberAverage tuber weightWeight (kg)W
TuberAverage tuber number (<40 mm)NumberN2
TuberAverage tuber number (40–60 mm)NumberN3
TuberAverage tuber number (>60 mm)NumberN4
1 Numbering adopted by GlBA (Gruppo di lavoro Biodiversità in Agricoltura, http://dspace.inea.it/handle/inea/745).
Table 2. Proportion of correctly classified potato samples (non-error-rate, NER%) in leave-one-out cross-validation for different pre-processing methods of the ATR-FTIR spectra.
Pre-Processing of ATR-FTIR SpectraNER% in Cross-Validation
None87.1
First derivative86.1
Second derivative81.4
SNV 197.4
SNV + first derivative88.7
SNV + second derivative79.9
1 Standard Normal Variate.
Table 3. Proportion (%) of correctly classified potato samples using PLS-DA in the calibration (computed classes) and external prediction (predicted classes).
ClassGATUMOPIDEAGKESP
Computed classes100.096.0100.090.996.2100.0100.094.7
Predicted classes75.072.784.680.081.890.977.875.0

