Article

FTIR-ATR Spectroscopy Combined with Multivariate Regression Modeling as a Preliminary Approach for Carotenoids Determination in Cucurbita spp.

by
Natalia Quijano-Ortega
1,
Carlos Alberto Fuenmayor
1,*,
Carlos Zuluaga-Dominguez
2,
Consuelo Diaz-Moreno
1,
Sanín Ortiz-Grisales
3,
Maribel García-Mahecha
1 and
Silvia Grassi
4,*
1
Institute of Food Science and Technology (ICTA), Universidad Nacional de Colombia, sede Bogotá, Avenida Carrera. 30 # 45–03, ed. 500C, Bogotá, DC 111321, Colombia
2
Departamento de Desarrollo Rural y Agroalimentario, Universidad Nacional de Colombia, sede Bogotá, Avenida Carrera. 30 # 45–03, ed. 500C, Bogotá, DC 111321, Colombia
3
Faculty of Agricultural Sciences, Universidad Nacional de Colombia, sede Palmira, Carrera. 32 # 12–00, Palmira 763533, Colombia
4
Department of Food, Environmental and Nutritional Sciences (DeFENS), Università degli Studi di Milano, via Celoria, 2, 20133 Milano, Italy
*
Authors to whom correspondence should be addressed.
Appl. Sci. 2020, 10(11), 3722; https://doi.org/10.3390/app10113722
Submission received: 6 May 2020 / Revised: 22 May 2020 / Accepted: 22 May 2020 / Published: 27 May 2020
(This article belongs to the Special Issue Application of Spectroscopy in Food Analysis)

Abstract

:
Quantitative analysis of carotenoids has been extensively reported using UV-Vis spectrophotometry and chromatography, instrumental techniques that require complex extraction protocols with organic solvents. Fourier transform infrared spectroscopy (FTIR) is a potential alternative for simplifying the analysis of food constituents. In this work, the application of FTIR with attenuated total reflectance (ATR) was evaluated for the determination of total carotenoid content (TCC) in Cucurbita spp. samples. Sixty-three samples, belonging to different cultivars of butternut squash (C. moschata) and pumpkin (C. maxima), were selected and analyzed with FTIR- ATR (attenuated total reflectance). Three different preparation protocols for samples were followed: homogenization (A), freeze-drying (B), and solvent extraction (C). The recorded spectra were used to develop regression models by Partial Least Squares (PLS), using data from TCC, determined by UV-Vis spectrophotometry. The PLS regression model obtained with the FTIR data from the freeze-dried samples, using the spectral range 920–3000 cm−1, had the best figures of merit (R2CAL of 0.95, R2PRED of 0.93 and RPD of 3.78), being reliable for future application in agriculture. This approach for carotenoid determination in pumpkin and squash avoids the use of organic solvents. Moreover, these results are a rationale for further exploring this technique for the assessment of specific carotenoids in food matrices.

Graphical Abstract

1. Introduction

Carotenoids, a complex family of isoprenoids, are relevant in plant foods and agriculture, as nutrients, antioxidants, pigments, and ripening indicators [1,2]. They are the main reason for orange- red-yellow colors of plant tissues, they act as antioxidants, and confer benefits for human health, including provitamin A activity in some cases [3].
Hundreds of carotenoids have been found in food matrices, but usually, a plant food has one to five predominant carotenoids, with a series of carotenoids in trace amounts [4] The most widely used techniques for the evaluation of carotenoids are UV-Vis spectrophotometry and HPLC coupled to diode array detectors (DAD) and mass spectrometers (MS) [3,5]. These techniques demand high solvent consumption and extensive sample preparation and extraction protocols. In this context, there is an emerging interest in vibrational spectroscopy, more specifically in Fourier transform infrared spectroscopy (FTIR), as a powerful tool for fast and simple analysis of compounds in food matrices, when coupled with multivariate statistical methods [6]. The mid-infrared region (MIR) of the electromagnetic radiation, located from 4000 cm−1 to 450 cm−1, contains information arising from molecular vibrations, which is sensitive to the chemical and physical states of the sample. Therefore, several FTIR-based methods have been developed to discriminate and determine various properties of food matrices [7,8,9,10], showcasing an important reduction of chemicals and time consumption, as the main advantage compared to conventional analytical techniques. Moreover, the use of attenuated total reflectance (ATR) devices simplifies the application of FTIR for qualitative and quantitative analysis of materials, including food matrices.
The capability of this technique for the determination of carotenoids in food matrices has been demonstrated in tomatoes, with good performance in lycopene quantification [11]. However, there are no previous studies of either FTIR-ATR or other MIR-based techniques for the evaluation of carotenoids in pumpkin or squash pulp, two of the richest sources of these compounds among fresh produce. Therefore, the aim of this work was to develop a methodology for the simple and fast quantification of total carotenoid content in Cucurbita spp. samples by FTIR-ATR spectroscopy combined with multivariate techniques.

2. Materials and Methods

2.1. Plant Material

For this study, 63 samples of Cucurbita spp. were obtained from different sources. Nearly half of the samples (n = 31), belonging to the cultivars Boloverde (n = 6), Dorado (n = 8), Abanico 75 (n = 9), from sp. Cucurbita moschata Duchesne, and Mandarino (n = 8), from sp. Cucurbita maxima, were harvested at the experimental center of the Universidad Nacional de Colombia in Palmira (Valle del Cauca) [3°32′05″N 76°17′44″O; 1001 m.a.s.l.]. The harvesting process of these samples took different times to be completed, according to the characteristic ripening periods of each cultivar. Namely, from planting to harvest, cv. Mandarino took 70–80 days, cv. Boloverde 120–150 days, and cv. Abanico 75 and cv. Dorado, 90–100 days. The samples were sent to the laboratory within 2–3 days after harvesting; they were disinfected in a 200 mg/L sodium hypochlorite solution, rinsed, and kept in a freezing room at −30 °C until processing, in a time no longer than two days after receipt. The genetic, morphological and physiological traits of these cultivars have been described elsewhere [12,13]. The other half of the samples (n = 32) was acquired directly from local suppliers from different regions of Colombia, at the wholesale collection center Corporación de Abastos de Bogotá S.A. (Corabastos), the same day of arrival in Bogotá. These samples were whole butternut squashes from sp. C. moschata, in their commercial ripening degree, harvested in the departments Huila (n = 8), Tolima (n = 8), Valle del Cauca (n = 8), and Meta (n = 8). There was no available information of the harvesting duration of the commercial samples; however, at the climatic and agricultural conditions of these regions, harvesting occurs usually nearly 90 days after floration, or between 90 to 150 days after planting [14]. The samples were disinfected in a 200 mg/L sodium hypochlorite solution, rinsed, and kept in a freezing room at −30 °C until processing, in a time no longer than two days after purchase. Three different preparation protocols (A, B, and C) were followed, corresponding to increasing analyte (carotenoids) isolation degrees in samples. First, the shell and seeds were manually separated from the pulp, which was subsequently portioned and processed with a knife blender (SharkNinja, Canada). The pulp after sole homogenization is referred to as fresh pulp and corresponds to the lowest analyte isolation degree (A). The remaining portion of the fresh pulp was freeze-dried (−50 °C in the condenser, 30 °C in the heating chamber, 1 mbar, 48 h), and it is referred to as freeze-dried pulp, which corresponds to the intermediate analyte isolation degree (B). Finally, freeze-dried samples were subjected to the extraction protocol described in Section 2.4 with hexane:acetone (1:1), and are referred to as extracts, corresponding to the highest analyte isolation degree (C).

2.2. Determination of Physicochemical Properties

Squash/pumpkin samples (from the homogenized fresh pulp) were characterized by the following methodologies: moisture content was determined gravimetrically by air drying, according to the standard method AOAC 925.09; total soluble solids was measured refractometrically, according to the standard method AOAC 932.12; pH was determined potentiometrically, according to the standard method AOAC 981.12, using a calibrated FP20 pHmeter (Mettler-Toledo, Switzerland); and titratable acidity was determined by titration with standardized NaOH (0.1 N), according to the method AOAC 942.15 [15].

2.3. Determination of Total Carotenoid Content (TCC) by UV-Vis Spectrophotometry

Freeze-dried pulp was ground and transferred (100 mg) to a 10 mL Falcon tube. An extractive solvent mixture (1 mL of hexane:acetone in a 1:1 ratio) (Merck, USA) was added. Then, the mixture was shaken in a vortex for 20 s and centrifuged at 14,000× g rpm for 5 min at 4 °C. This procedure was done several times until the disappearance of the color in the solvent mixture; then the extracts were filtered with Whatman 4 filter paper. Finally, the extractive solvent was added to complete 10 mL in volumetric flasks. The absorbance of the extracts was read in a spectrophotometer Genesys 10S (Thermo Scientific, USA) at 454 nm.
For the calibration curve, the following procedure was carried out: for the preparation of the stock solution, 0.005 g of the β-carotene standard (Sigma-Aldrich, 99%) was weighed, transferred to a 50 mL volumetric flask, and adjusted with the solvent mixture hexane:acetone (1:1 ratio). Standard solutions of concentration 0.5, 1.5, 2.5, 3.5, 4.5, 5.5, 6.5 and 7.5 µg/mL were prepared, and their absorbance was read at 454 nm. The calibration curve, from 13 replicates, was calculated by a least square regression: 0.0222 u.a. intercept; 0.1592 u.a./µg/mL slope; R2 > 0.99; TCC was expressed as µg/g (µg of β-carotene equivalents/g), calculated according to the following equation:
T o t a l   c a r o t e n o i d   c o n t e n t   ( T C C ) ( μ g   β c a r o t e n e e q g ) = ( A b s 454   n m b m ) ( V / W )   D F
where A b s 454   n m is the measured absorbance at 454 nm wavelength; b and m are the intercept and slope of the calibration curve, respectively; V is the extract volume (mL); W is the weight of the freeze-dried sample (g), and DF is the corresponding dilution factor. Total carotenoid content was corrected to a dry basis or wet basis, according to the moisture content of the sample (freeze-dried or fresh), determined as described in Section 2.3.

2.4. Fourier Transform Infrared Spectroscopy with Attenuated Total Reflectance (FTIR-ATR)

Portions of 20–30 mg of the fresh pulp (A) and the freeze-dried pulp (B), volumes of 50 µL of the extracts (C), and nearly 2 mg of the of β-carotene and lutein analytical standards (Sigma-Aldrich, 99%), were analyzed by FTIR-ATR. Spectral data were obtained with an FTIR equipment (FTIR-4100 spectrometer, Jasco, Japan) using a diamond single reflection attenuated total reflectance (ATR) device. A total of 24 spectra per sample were acquired with 24 scans per spectrum with a spectral resolution of 4 cm−1 in the spectral interval of 4000 to 450 cm−1. The measured spectra were recorded and pre-treated with the built-in procedures for water and CO2 elimination, with the software Spectra Manager (v. 2.7, Jasco, Japan).

2.5. Partial Least Squares Regression (PLS)

Regression models for total carotenoid were developed by partial least squares (PLS) combining spectral information (X) with the dependent information (Y), i.e., TCC determined by UV-Vis. The spectra were reduced in spectral range (1300–3000 cm−1 or 920–3000 cm−1), and divided into two datasets by the Kennard–Stone algorithm; one dataset, containing around 70% of the spectra, was used for model calibration, and the remaining 30% of the data was used for testing the model predictiveness.
The following spectral pre-processing techniques (besides water and CO2 elimination), alone or in combination, were tested: no spectral pre-processing, standard normal variation (SNV), smoothing (Savitzky–Golay with filter width 15), first derivative (Savitzky–Golay with filter width 15), second derivative (Savitzky–Golay with filter width 15), always followed by mean centering.
The model dimensionality, a.k.a. the number of latent variables was individuated by the venetian blind cross-validation strategy. Statistical parameters such as root mean error of calibration (RMSEC) and prediction (RMSEP) and coefficient of determination (R2) of both calibration (R2CAL) and prediction (R2PRED) were used to identify the most appropriate model. Furthermore, the prediction ability of the obtained models was evaluated by comparing the RMSEP with the Standard Error of Laboratory (RMSEL) according to the procedure proposed by Shenk and Westerhaus [16]. The models were developed with PLS Toolbox (v. 8.5, Eigenvector Research, Inc., Aeattle, WA, USA) working under MATLAB environment (v. 2016a, Mathworks, Inc., Natick, MA, USA).

3. Results and Discussion

3.1. Total Carotenoid Content and Physicochemical Quality Indexes of Cucurbita spp. Samples

The TCC of the 63 samples of Cucurbita pulp is presented in Table A1 (Appendix A), along with the physicochemical quality parameters (moisture content, pH, titratable acidity, and total soluble solids). From these results, it is possible to highlight that this vegetable harvested in Colombia is an important source of carotenoids, presenting a great variability in its total content (155.8–2137.3 μg/g in dry basis), according to the cultivar or geographical origin, as well as within each variety, thus guaranteeing a robust representation of total carotenoids for regression model development. C. moschata from Tolima presented the highest TCC, with values that exceed 1000 μg/g (dry basis), probably associated with a higher maturity index, as indicated by average higher pH, and lower acidity [1]. The Dorado cultivar presented the lowest TCC, with values between 155.8 and 291.8 μg/g (dry basis).
There are different reported ranges of TCC of both butternut squash (C. moschata) and pumpkin (C. maxima); in general, the carotenoid content of Colombian Cucurbita spp. samples, analyzed in this study, is in agreement with previous reports. In a study developed with C. moschata from Colombia (Valle del Cauca) [17], the author found that the content ranges from 490.1–1365.8 μg/g. In a study with Brazilian pumpkins (C. moschata), TCC varied between 234.21 and 404.98 μg/g [18]. Another investigation revealed values of 1.1–42.3 μg/g (wet basis) for six cultivars from C. moschata [19]. On the other hand, the investigation performed in Germany for seven cultivars from C. maxima revealed a TCC range from 17–683 mg/kg (dry basis) [20].

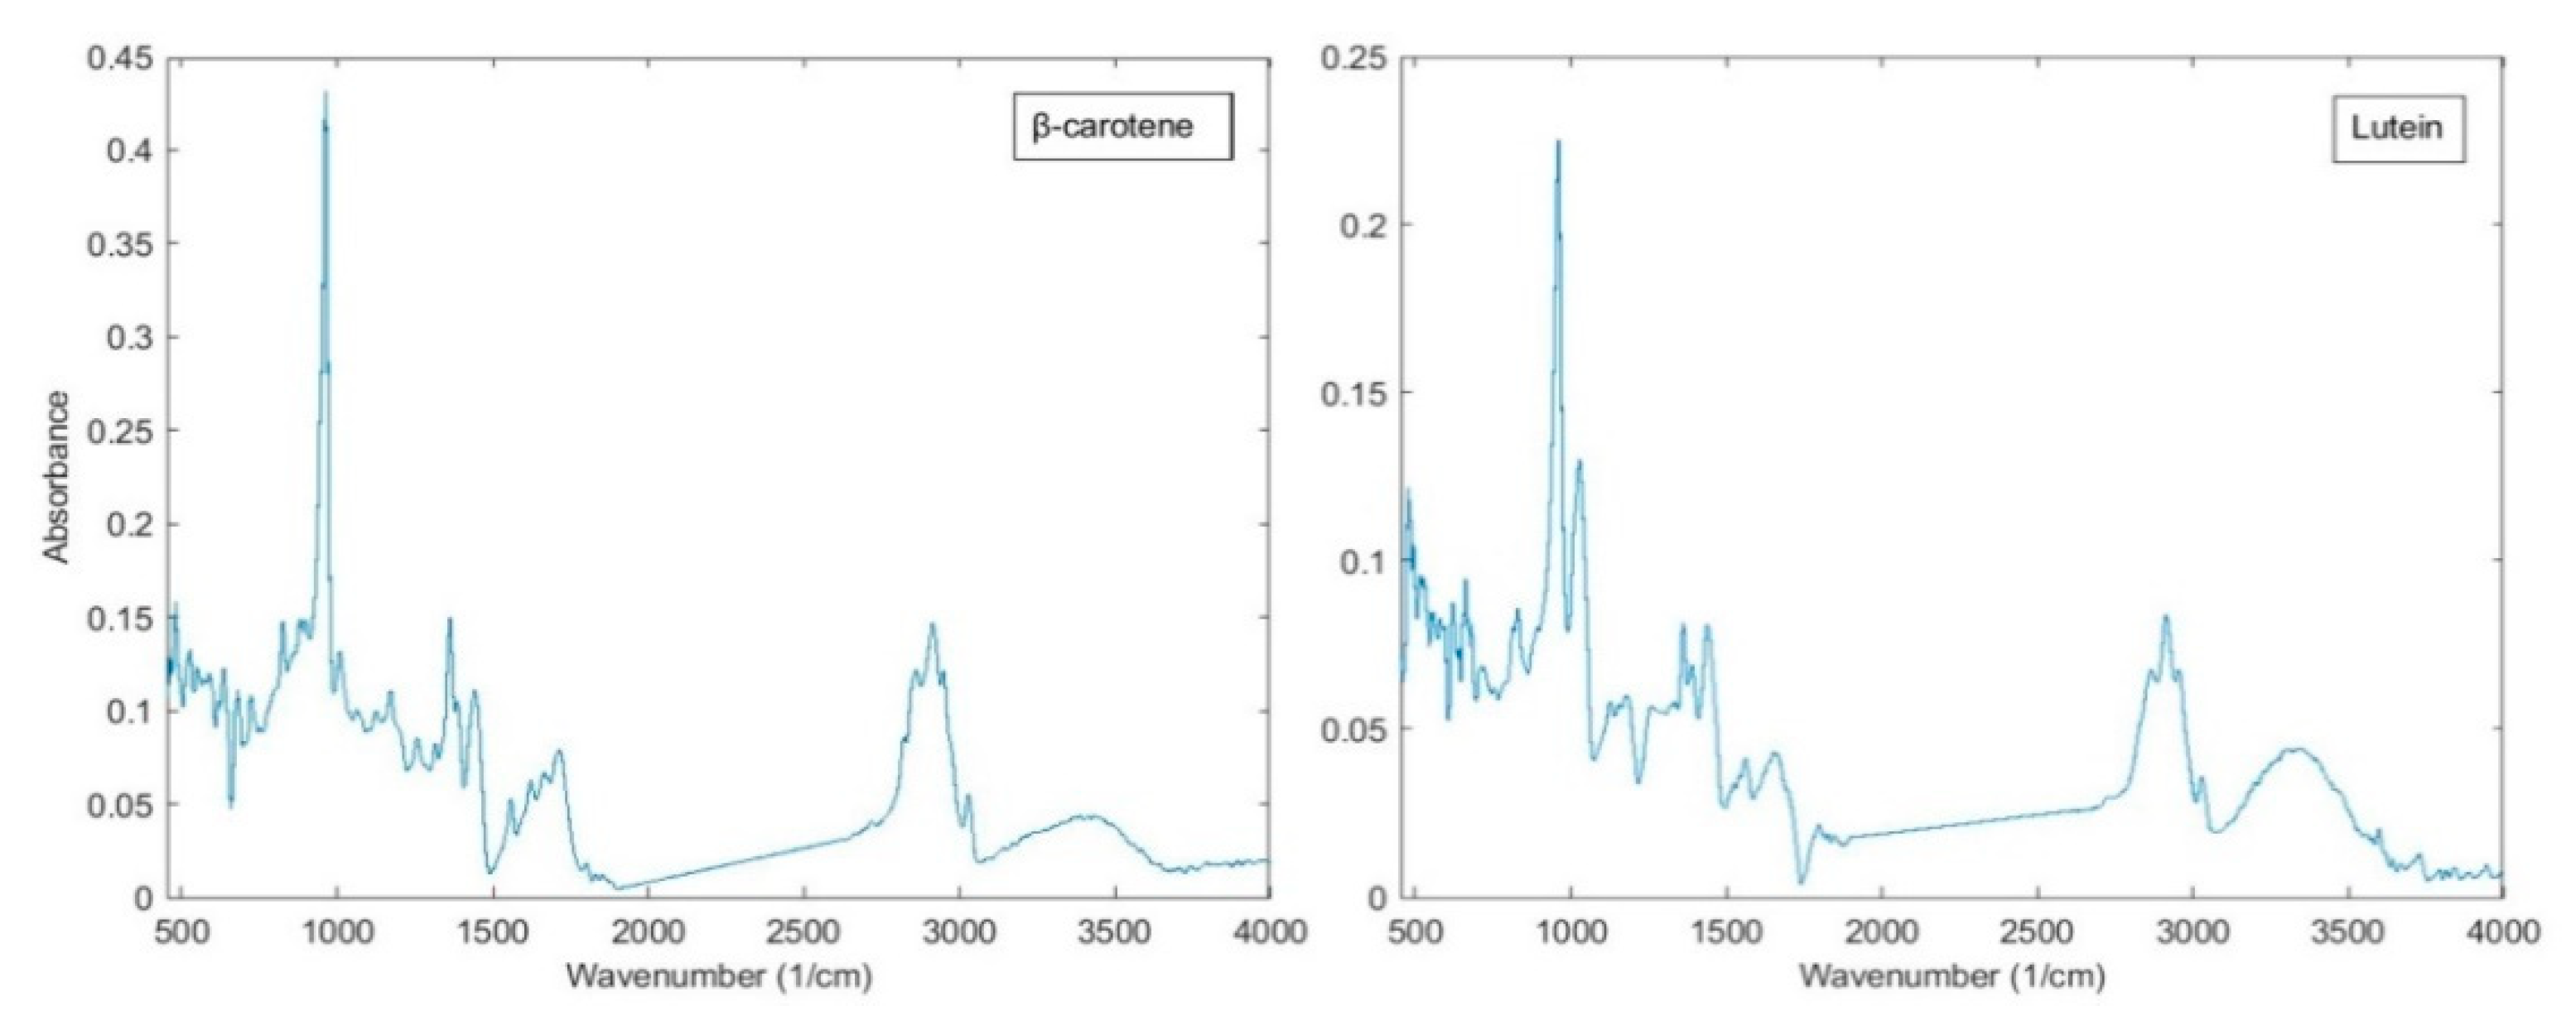
3.2. Spectral Analysis

Figure 1A shows the characteristic FTIR spectra of the fresh pulps. Overall, the spectra are similar regarding the position of the characteristic peaks. However, the intensity of various peaks, particularly those between 1200 and 500 cm−1, varies notably, which supports the feasibility of obtaining quantitative information on the chemical composition of Cucurbita species from these spectra.
In the spectra of fresh pulps, the β-carotene and lutein bands could be overlapped with the peaks of the functional groups of other molecules. However, it is possible to distinguish some characteristic peaks of these compounds, such as 960.1 cm−1 and 963.1 cm−1, as observed in the spectra of the pure compounds (Figure 2).
The peak around 1550–1600 cm−1 corresponds to C=C double bond stretching vibrations of β-carotene [20]. The region of approximately 1450 cm−1 is associated with vibrations of antisymmetric deformation of CH3 groups (change in HCH angles) and CH2 groups (scissor vibrations) [20,21]. Likewise, the bands located around 1360–1390 cm−1 are likely the result of the “umbrella” vibrations of the CH3 groups [21].
The most intense peak of the spectra, located in the range 950–980 cm−1, corresponds to the deformation vibrations of the C–H bonds in the polyene chain, whereas the band located at approximately 520–530 cm−1 is associated with the change in the angles and deformation of the polyene chain [21,22].
In these spectra, it is also possible to identify a characteristic band around 1100 cm−1; this absorbance peak corresponds to the C–O stretch vibrations of alcohols, which probably arises from xanthophylls, such as lutein. Indeed, this band is recognizable in the FTIR spectra of the pure compound (Figure 2). However, it might be also associated with the presence of other compounds with alcohol functional groups in the pulp of spp. Cucurbita [23,24,25].
There is a remarkable similarity of the spectra of Figure 1A with those reported for pectin-rich pumpkin extracts [26]. The same broad intense peak located between 3000 to 3600 cm−1 was observed, which is associated with the oscillations of the –OH groups of water. Furthermore, the bands of 2926 cm−1 (functional groups with C–H bonds), the spectral region 1500–2000 cm−1 (oscillations of C=O bonds), and regions such as 1730–1760 cm−1 (corresponding to COO–R bonds) and 1600–1630 cm−1 (corresponding to COO– bonds), were identified in pumpkin pectin-rich extracts [26]. All the above indicates that, besides carotenoid compounds, the characteristic FITR spectra of Cucurbita spp. pulp, shown in Figure 1A, are determined also by the presence of pectin, and possibly other polysaccharides.
In the freeze-dried pulp spectra, shown in Figure 1B, the relative absorbance of the broad and intense peak, with a maximum between 3200 and 3600 cm−1, which corresponds to oscillations of the –OH groups of the water molecule, is reduced due to the freeze-drying process.
In these spectra, it is possible to appreciate the same characteristic bands of the spectra of the fresh pulps: 2926 cm−1 that corresponds to the oscillation of groups with C–H bonds, 1550 cm−1, associated with double bonds of β-carotene. One of the typical bands of β-carotene and lutein can also be observed around 968 cm−1 [27].
Figure 1C shows the spectra of the extracts in hexane/acetone. As in the spectra of the pure compounds (Figure 2), it is possible to identify in the extracts the characteristic band of β-carotene at 3000 cm−1. However, this band overlaps with the typical hexane band that is also around 3000 cm−1, associated with C–H bonds. Likewise, in these spectra the characteristic bands of acetone are observed, which include the intense band at approximately 1720 cm−1, associated with C=O bonds, and the band around 1220 cm−1 that corresponds to C–C–C bending [28]. As previously stated, β-carotene produces a characteristic band around 968 cm−1, nevertheless, the absorbance of the solvent mixture is predominant, therefore “hiding” the corresponding bands of the carotenoids.

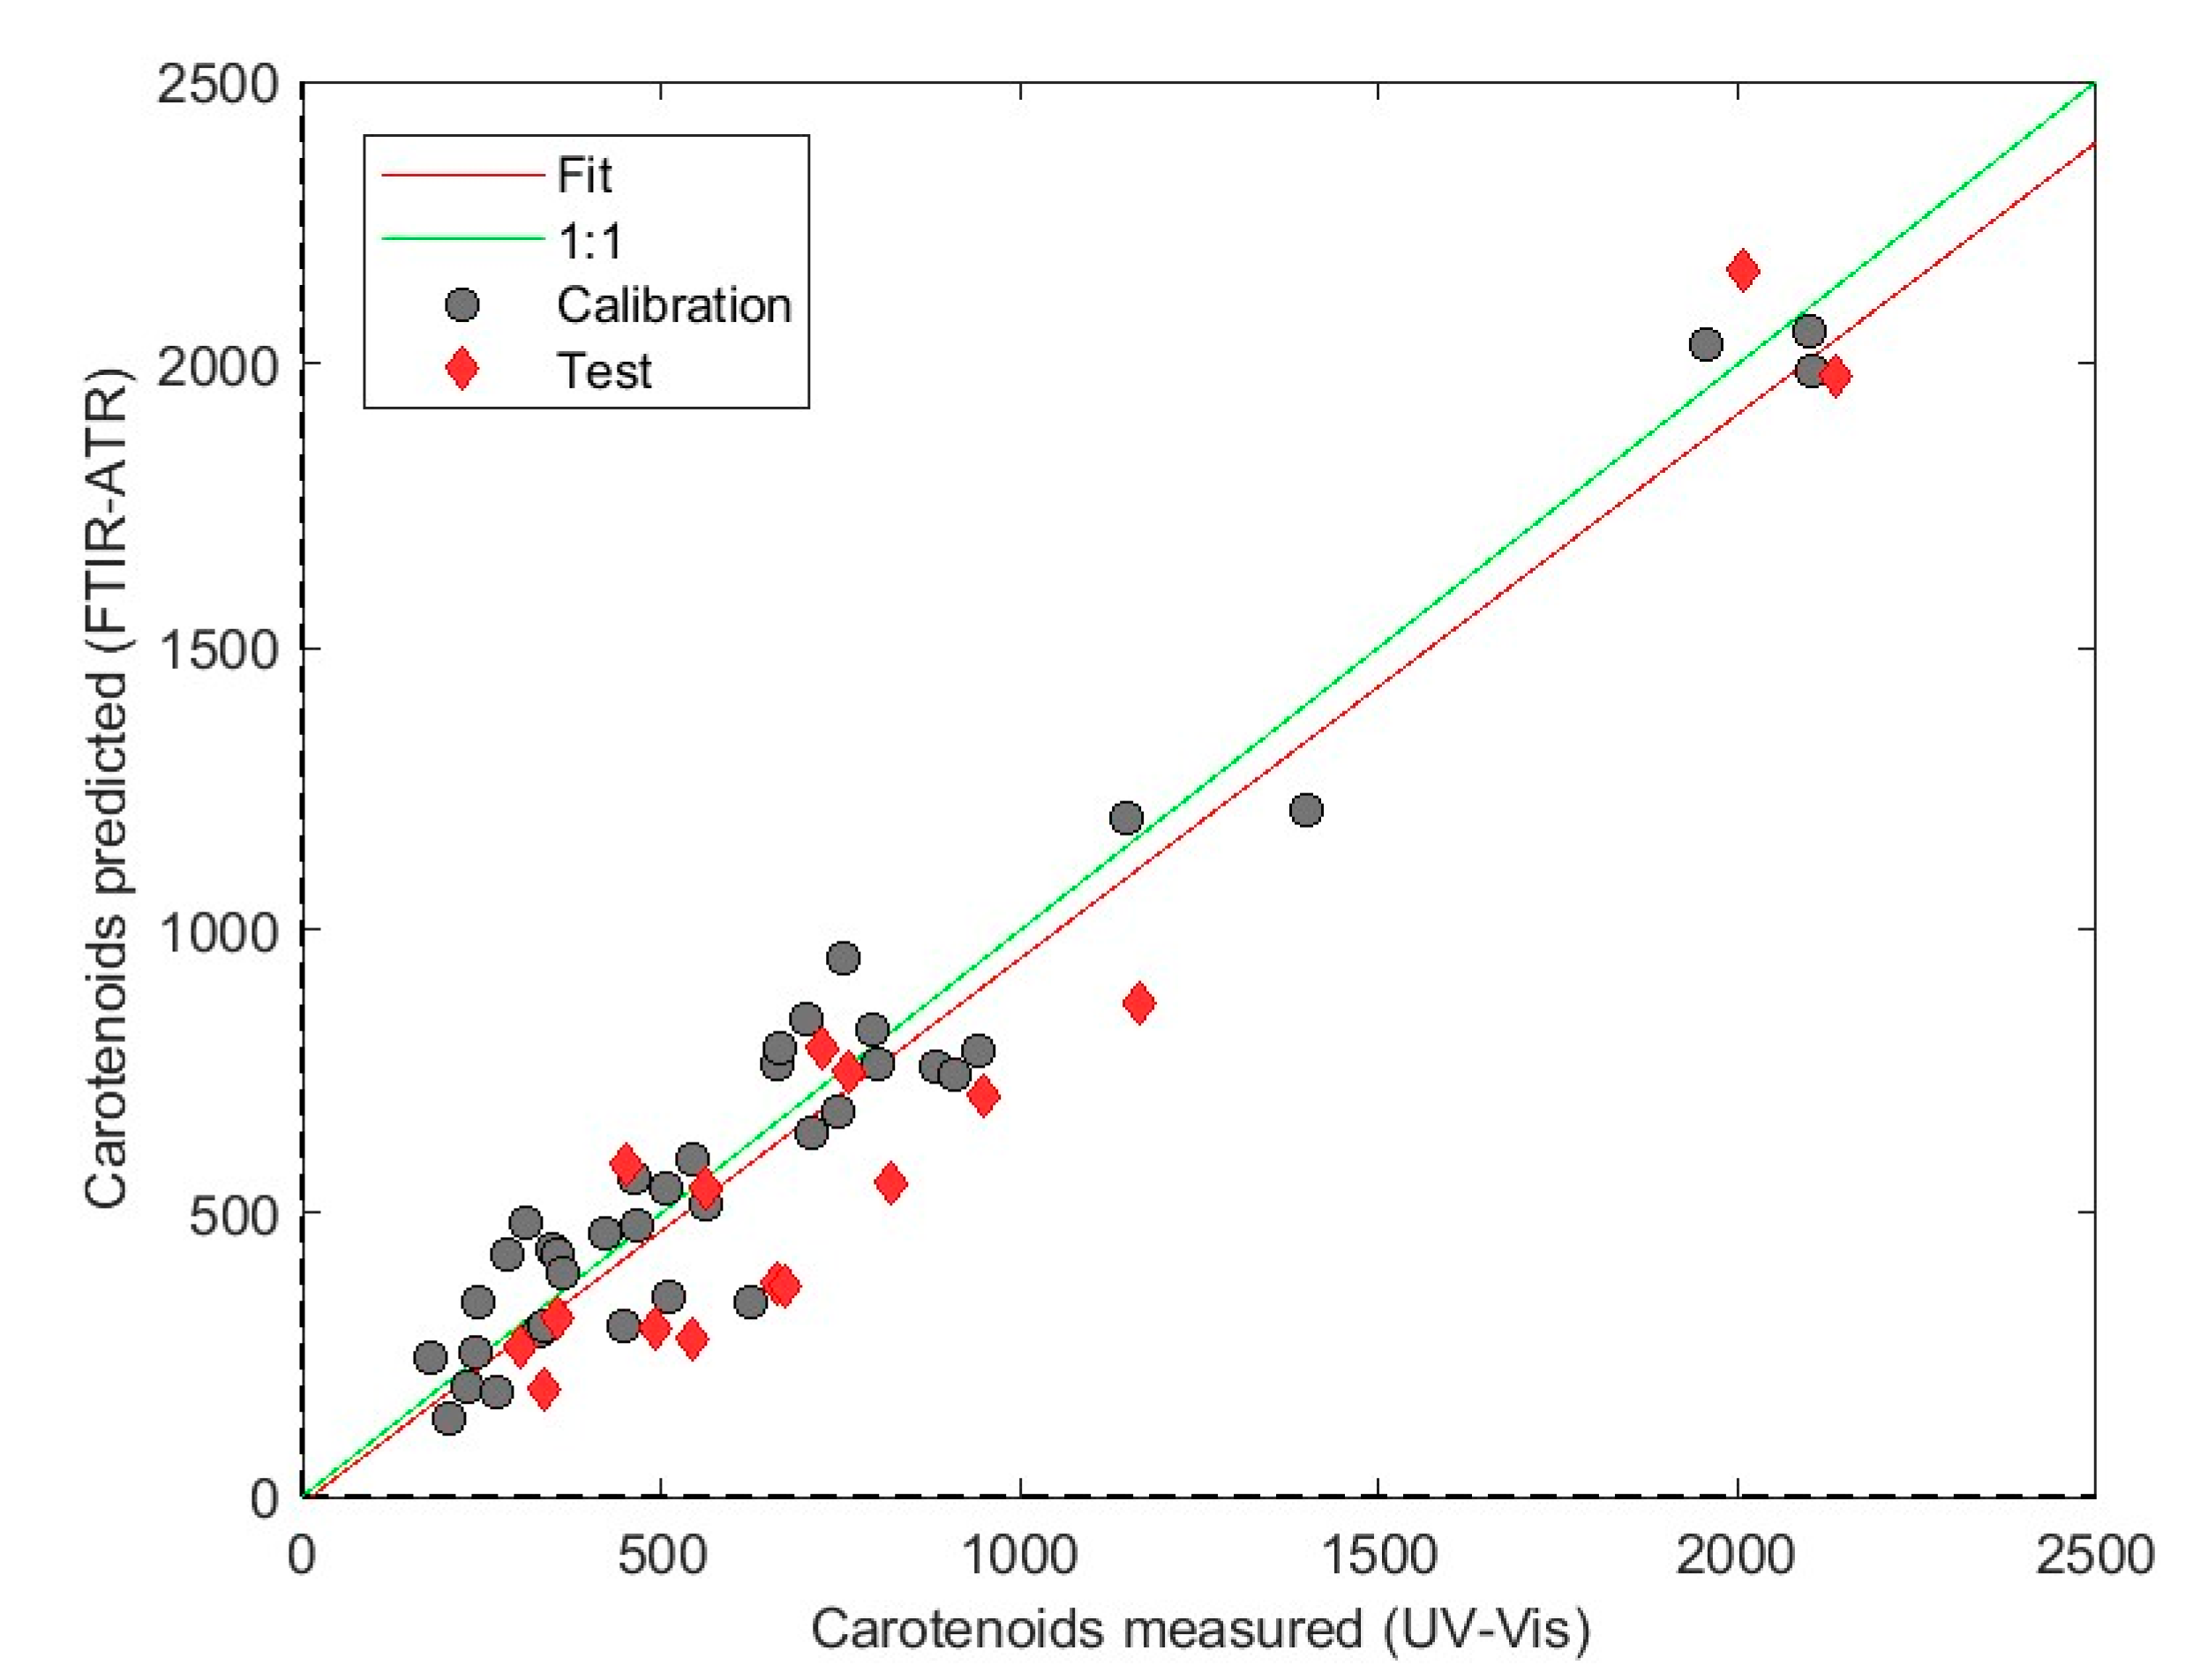
3.3. PLS Regression: Carotenoid Content Prediction by IR Spectral Data

Different spectral ranges and spectral pre-treatment were investigated to develop PLS models and predict TCC in Cucurbita spp. samples. Models were developed for all the preparation protocols investigated (blender homogenization (A), freeze-drying (B), and hexane/acetone extraction (C)). Cross-validation was performed for each model, to confirm the calibration robustness, and to select the number of latent variables that minimized the calibration and cross-validation error (RMSEC and RMESECV). The details of the best models developed are reported in Table 1. For each sample preparation, the best model in the prediction stage was selected taking into account the lowest error (RMSEP) and the higher coefficient of determination (R2).
The model obtained with fresh pulp presented low predictability (R2PRED of 0.66) compared to the R2CAL (0.72), demonstrating that the model is not stable when moving to the prediction dataset. Indeed, the RPD (residual predictive deviation) reached 1.72, marking an intermediate model performance, which will need some improvement to be further applied [29] This was probably due to the high water content, which entails a lower nutrient concentration, a lower absorbance of carotenoids in the spectra, and a higher effect of the absorbance linked to water content. The RMSEP obtained was 25.66 µg/g on a wet basis, which is three times the mean standard deviation (S.D.) of the reference data on wet bases (6.6 µg/g), and greater than twice the Standard Error of Laboratory (RMSEL), which was 8.47 µg/g. According to Shenk and Westerhaus [16], a prediction model can be considered for real implementation when RMSEP < 2 RMSEL, thus the obtained model is not reliable if not for screening purposes.
On the other hand, the regression model obtained from the spectra of the freeze-dried samples improved considerably (R2PRED of 0.93, RMSEP of 193 µg/g on dry basis), attributed to the increase of characteristic absorption bands from spectra not covered by water absorption bands. In this case, the RMSEL was of 91.07 µg/g on a dry basis, half of the RMSEP, thus the model is within the limit of reliability for implementation of FTIR-ATR spectroscopy, coupled with PLS regression, for the determination of carotenoids in freeze-dried pumpkin samples. Moreover, the RPD was greater than three (Table 1), suggesting the model reliability for agriculture application [29].
It was considered that by increasing the degree of isolation of the analyte, that is, by carrying out the extraction of total carotenoids in hexane/acetone, it would be possible to improve the predictability of the model. However, the acetone and hexane functional groups overlapped, and attenuate the carotenoids bands, as discussed above, ultimately causing very poor predictability of the corresponding regression models. Therefore, the results of the models obtained with the fresh and freeze-dried samples are presented in Table 1.
The performance of PLS models developed in different studies for the determination of carotenoid content in fresh or minimally processed food products, using MIR and NIR (Near Infrared) spectral data, are shown in Table 2. In comparison, the PLS model developed for freeze-dried samples had good statistical performance, with figures of merit comparable to those previously reported.
In summary, the PLS model obtained with FTIR-ATR spectral data from freeze-dried samples was the most appropriate. This model allowed us to obtain TCC values comparable to those reported by the conventionally spectrophotometric UV-Vis technique, with lower time consumption and avoiding the need for extraction protocols and solvents. The comparison between both techniques is presented in Figure 3.

4. Conclusions

PLS regression models based on FTIR-ATR spectra of freeze-dried samples were successfully developed for the assessment of total carotenoid content of Cucurbita spp., with R2 values of 0.95 and 0.93 for calibration and prediction, respectively. A wide IR region between 900 cm−1 and 3000 cm−1 was appropriate for the PLS regression models, with absorption bands in the region 950–980 cm−1 providing useful quantitative information, probably associated to trans C=C groups from isoprenoids, such as β-carotene and lutein, which are known to be abundant in Cucurbita. Although extracts collected from the mixture of solvents had a greater isolation degree of the analyte, the regression models presented poor predictability, which can be attributed to the overlapping of carotenoid bands with the solvent bands. By the application of PLS regression models in spectra between 920–3000 cm−1, TCC could be determined in pumpkin and butternut squash through a fast methodology that does not entail the use of solvents nor extraction protocols and requires minimal training, thus representing an advantage in terms of simplicity, cost, and environmental impact.

Author Contributions

Conceptualization: C.A.F., C.Z.-D., C.D.-M., and S.G.; methodology: N.Q.-O., and M.G.-M.; software: N.Q.-O.; validation: N.Q.-O., and S.G.; formal analysis: N.Q.-O., and S.G.; investigation: N.Q.-O.; resources: C.A.F., C.D.-M., and S.O.-G.; data curation: N.Q.-O.; writing—original draft preparation: N.Q.-O. and C.A.F.; writing—review and editing: C.Z.-D., S.G., S.O.-G., and M.G.-M.; visualization: N.Q.-O. and C.A.F.; supervision: C.A.F.; project administration: C.A.F.; funding acquisition: C.A.F., C.D.-M., and S.G. All authors have read and agreed to the published version of the manuscript.

Funding

This research was funded by Minciencias and Patrimonio Autónomo Fondo Nacional de Financiamiento para la Ciencia, la Tecnología y la Innovación Francisco José de Caldas (grant number FP44842-271-2018). The article processing charge was partially covered by the University of Milan.

Acknowledgments

The authors thank Minciencias for the financial support; the Institute of Food Science and Technology, in particular L.F. Gutiérrez, for the acquisition of the FTIR instrument and his kind guidance on the use of the freeze-dryer instrument, and also Cristina Lizarazo and Jorge Sandoval, for their kind technical support in the data acquisition and sample processing.

Conflicts of Interest

The authors declare no conflict of interest.

Appendix A

Table A1. Total carotenoid content and physicochemical quality parameters of Cucurbita spp. Samples.
Sample DescriptionNumber of SamplesTotal Carotenoid Content (Dry Basis) (µg/g)
(X ± σ [min.–max.])
pH
(X ± σ [min.–max.])
Titratable Acidity
(g malic acideq/100 g)
(X ± σ [min.–max.])
Total Soluble Solids (Brix)
(X ± σ [min.–max.])
Cultivar/
Geographical
Origin
Species
cv. Abanico 75C. moschata9517.7 ± 173.3 BC
[292.1–749.0]
6.070 ± 0.199 CD
[5.830–6.500]
0.295 ± 0.064 A
[0.194–0.403]
10.561 ± 1.521 A
[8.100–13.400]
MetaC. moschata81065.4 ± 616.1 AB
[614.2–2081.3]
6.349 ± 0.368 AB
[5.990–7.030]
0.136 ± 0.017 BCD
[0.127–0.200]
5.475 ± 1.705 D
[3.700–8.000]
cv. MandarinoC. maxima8388.2 ± 127.0 BC
[263.5–597.7]
6.026 ± 0.138 D
[5.800–6.270]
0.107 ± 0.027 CDE
[0.066–0.142]
5.094 ± 0.812 DE
[3.900–6.400]
cv. BoloverdeC. moschata6399.1 ± 192.3 BC
[205.7–729.6]
6.259 ± 0.264 BCD
[5.910–6.650]
0.149 ± 0.032 BC
[0.115–0.214]
7.775 ± 0.990 C
[6.500–9.500]
cv. DoradoC. moschata8207.0 ± 55.0 C
[155.8–291.8]
6.301 ± 0.184 ABC
[6.050–6.630]
0.178 ± 0.064 B
[0.111–0.280]
9.313 ± 1.063 B
[7.400–11.300]
Valle del CaucaC. moschata8744.3 ± 394.2 ABC
[247.1–1299.7]
5.740 ± 0.166 E
[5.560–6.020]
0.101 ± 0.035 DE
[0.062–0.135]
5.688 ± 1.148 D
[3.700–7.200]
HuilaC. moschata8754.2 ± 266.2 ABC
[453.600–1096.9]
6.424 ± 0.291 AB
[5.900–6.700]
0.065 ± 0.003 E
[0.057–0.059]
4.100 ± 0.825 E
[2.700–5.200]
TolimaC. moschata81203.1 ± 880.3 A
[229.8–2137.3]
6.554 ± 0.225 A
[6.250–6.960]
0.067 ± 0.001 E
[0.063–0.068]
5.206 ± 0.713 DE
[4.200–6.500]
Global63659.9 ± 345.0
[155.8–2137.3]
6.215 ± 0.259
[5.560–7.030]
0.295 ± 0.064
[0.057–0.403]
6.652 ± 2.298
[3.700–13.400]
* X = mean, and σ = standard deviation, for the number of samples indicated in the third column. Means in the same column followed by the different letter are statistically significant (p < 0.05) according to Duncan’s multiple range test (DMRT).

References

  1. Sharma, S.; Rao, T.V.R. Nutritional quality characteristics of pumpkin fruit as revealed by its biochemical analysis. Int. Food Res. J. 2013, 20, 2309–2316. [Google Scholar]
  2. Fiedor, J.; Burda, K. Potential role of carotenoids as antioxidants in human health and disease. Nutrients 2014, 6, 466–488. [Google Scholar] [CrossRef] [PubMed] [Green Version]
  3. Rodriguez-Amaya, D.B. Status of carotenoid analytical methods and in vitro assays for the assessment of food quality and health effects. Curr. Opin. Food Sci. 2015, 1, 56–63. [Google Scholar] [CrossRef]
  4. Saini, R.K.; Nile, S.H.; Park, S.W. Carotenoids from fruits and vegetables: Chemistry, analysis, occurrence, bioavailability and biological activities. Food Res. Int. 2015, 76, 735–750. [Google Scholar] [CrossRef] [PubMed]
  5. Rodriguez-Amaya, D.B. Quantitative analysis, in vitro assessment of bioavailability and antioxidant activity of food carotenoids—A review. J. Food Compos. Anal. 2010, 23, 726–740. [Google Scholar] [CrossRef]
  6. Karoui, R.; Downey, G.; Blecker, C. Mid-infrared spectroscopy coupled with chemometrics: A tool for the analysis of intact food systems and the exploration of their molecular structure—Quality relationships—A review. Chem. Rev. 2010, 110, 6144–6168. [Google Scholar] [CrossRef]
  7. Bassbasi, M.; De Luca, M.; Ioele, G.; Oussama, A.; Ragno, G. Prediction of the geographical origin of butters by partial least square discriminant analysis (PLS-DA) applied to infrared spectroscopy (FTIR) data. J. Food Compos. Anal. 2014, 33, 210–215. [Google Scholar] [CrossRef]
  8. Anjos, O.; Campos, M.G.; Ruiz, P.C.; Antunes, P. Application of FTIR-ATR spectroscopy to the quantification of sugar in honey. Food Chem. 2015, 169, 218–223. [Google Scholar] [CrossRef]
  9. Mellado-Mojica, E.; Seeram, N.P.; López, M.G. Comparative analysis of maple syrups and natural sweeteners: Carbohydrates composition and classification (differentiation) by HPAEC-PAD and FTIR spectroscopy-chemometrics. J. Food Compos. Anal. 2016, 52, 1–8. [Google Scholar] [CrossRef]
  10. Biancolillo, A.; Marini, F.; D’Archivio, A.A. Geographical discrimination of red garlic (Allium sativum L.) using fast and non-invasive Attenuated Total Reflectance-Fourier Transformed Infrared (ATR-FTIR) spectroscopy combined with chemometrics. J. Food Compos. Anal. 2020, 86, 103351. [Google Scholar] [CrossRef]
  11. De Nardo, T.; Shiroma-Kian, C.; Halim, Y.; Francis, D.; Rodriguez-Saona, L.E. Rapid and simultaneous determination of lycopene and β-carotene contents in tomato juice by infrared spectroscopy. J. Agric. Food Chem. 2009, 57, 1105–1112. [Google Scholar] [CrossRef] [PubMed]
  12. Baena García, D.; Ortiz Grisales, S.; Valdés Restrepo, M.P.; Estrada Salazar, E.I.; Vallejo Cabrera, F.A. Unapal–abanico 75: Nuevo cultivar de zapallo con alto contenido de materia seca en el fruto para fines agroindustriales. Acta Agronómica 2010, 59, 285–292. [Google Scholar]
  13. Vallejo, F.A.; Baena, D.; Ortiz, S.; Estrada, E.I.; Tobar, D.E. Unapal-Dorado, nuevo cultivar de zapallo con alto contenido de materia seca para consumo en fresco. Acta Agronómica 2010, 59, 127–134. [Google Scholar]
  14. Suarez, E.A.; Paz Peña, S.P.; Echeverria Restrepo, D.C.; Ruiz, K.; Mosquera Sanchez, S.A. Effect of the production system in the physiological maturity of Cucurbita moschata var. Green Bolo. Biotecnología Sector Agropecuario Agroindustrial 2016, 14, 29–37. [Google Scholar] [CrossRef] [Green Version]
  15. AOAC. Official Methods of Analysis, 19th ed.; AOAC: Arlington, VA, USA, 2012. [Google Scholar]
  16. Shenk, J.S.; Westerhaus, M.O. Calibration the ISI way. In Near Infrared Spectroscroscopy: The Future Waves, Proceedings of the 7th International Conference on Near Infrared Spectroscopy, Montreal, Canada, 6–11 August 1996; Davies, A.M.C., Williams, P., Eds.; NIR Publications: Chichester, UK, 1996; pp. 198–202. [Google Scholar]
  17. Ortiz, S. Estudios Genéticos en Caracteres Relacionados con el Rendimiento y Calidad del Fruto de Zapallo Cucurbita Moschata Duch para Fines Agroindustriales. Ph.D. Thesis, Universidad Nacional de Colombia Sede Palmira, Palmira, Colombia, 2009. [Google Scholar]
  18. Carvalho, L.M.J.D.; Smiderle, L.D.A.S.M.; Carvalho, J.L.V.D.; Cardoso, F.D.S.N.; Koblitz, M.G.B. Assessment of carotenoids in pumpkins after different home cooking conditions. Food Sci. Technol. 2014, 34, 365–370. [Google Scholar] [CrossRef] [Green Version]
  19. Itle, R.A.; Kabelka, E.A. Correlation between L* a* b* color space values and carotenoid content in pumpkins and squash (Cucurbita spp.). HortScience 2009, 44, 633–637. [Google Scholar] [CrossRef] [Green Version]
  20. Kreck, M.; Kuerbel, P.; Ludwig, M.; Paschold, P.J.; Dietrich, H. Identification and quantification of carotenoids in pumpkin cultivars (Cucurbita maxima L.) and their juices by liquid chromatography with ultraviolet-diode array detection. J. Appl. Bot. Food Qual. 2006, 80, 93–99. [Google Scholar]
  21. Berezin, K.V.; Nechaev, V.V. Calculation of the IR Spectrum and the Molecular Structure of β-Carotene. J. Appl. Spectrosc. 2005, 72, 164–171. [Google Scholar] [CrossRef]
  22. Schlücker, S.; Szeghalmi, A.; Schmitt, M.; Popp, J.; Kiefer, W. Density functional and vibrational spectroscopic analysis of β-carotene. J. Raman Spectrosc. 2003, 34, 413–419. [Google Scholar] [CrossRef]
  23. Prabhu, A.; Abdul, K.S.; Rekha, P.-D. Isolation and Purification of Lutein from Indian Spinach Basella alba. Res. J. Pharm. Technol. 2015, 8, 1379–1382. [Google Scholar] [CrossRef]
  24. Kulczyński, B.; Gramza-Michałowska, A. The profile of secondary metabolites and other bioactive compounds in Cucurbita pepo L. and Cucurbita moschata pumpkin cultivars. Molecules 2019, 24, 2945. [Google Scholar] [CrossRef] [PubMed] [Green Version]
  25. Kulczyński, B.; Gramza-Michałowska, A. The Profile of Carotenoids and Other Bioactive Molecules in Various Pumpkin Fruits (Cucurbita maxima Duchesne) Cultivars. Molecules 2019, 24, 3212. [Google Scholar] [CrossRef] [PubMed] [Green Version]
  26. Torkova, A.; Lisitskaya, K.; Filimonov, I.; Glazunova, O.; Kachalova, G.; Golubev, V.N.; Fedorova, T.V. Physicochemical and Functional Properties of Cucurbita Maxima Pumpkin Pectin and Commercial Citrus and Apple Pectins: A Comparative Evaluation. PLoS ONE 2018, 13, e0204261. [Google Scholar] [CrossRef] [PubMed]
  27. Rubio-Diaz, D.E.; De Nardo, T.; Santos, A.; de Jesus, S.; Francis, D.; Rodriguez-Saona, L.E. Profiling of nutritionally important carotenoids from genetically-diverse tomatoes by infrared spectroscopy. Food Chem. 2010, 120, 282–289. [Google Scholar] [CrossRef]
  28. Walton, H.F.; Reyes, J. Análisis Químico e Instrumental Moderno, 1st ed.; Reverté: Barcelona, Spain, 1983; p. 229. [Google Scholar]
  29. Williams, P. Implementation of Near Infrared Technology. In Near-Infrared Technology in the Agricultural and Food Industries, 2nd ed.; Williams, P.C., Norris, K.H., Eds.; American Association of Cereal Chemists Inc.: St. Paul, MN, USA, 2001; pp. 145–169. [Google Scholar]
  30. Martínez-Valdivieso, D.; Font, R.; Blanco-Díaz, M.T.; Moreno-Rojas, J.M.; Gómez, P.; Alonso-Moraga, Á.; Del Río-Celestino, M. Application of near-infrared reflectance spectroscopy for predicting carotenoid content in summer squash fruit. Comput. Electron. Agric. 2014, 108, 71–79. [Google Scholar] [CrossRef]
  31. Baranska, M.; Schütze, W.; Schulz, H. Determination of lycopene and β-carotene content in tomato fruits and related products: Comparison of FT-Raman, ATR-IR, and NIR spectroscopy. Anal. Chem. 2006, 78, 8456–8461. [Google Scholar] [CrossRef]
Figure 1. Characteristic FTIR-ATR spectra of the samples of Cucurbita sp. (n = 63) with different sample processing protocols: (A) fresh pulp (blender-homogenized); (B) freeze-dried pulp; (C) hexane:acetone (1:1) extracts.
Applsci 10 03722 g001
Figure 2. FTIR-ATR spectra of pure β-carotene and lutein.
Applsci 10 03722 g002
Figure 3. Regression line of the PLS model for total carotenoid content (in µg/g, dry basis) obtained from freeze-dried samples. In grey circles (●), the training set; in red rhombuses (), the prediction set.
Applsci 10 03722 g003
Table 1. Partial Least Squares (PLS) regression models for total carotenoid content prediction in pumpkin pulp from FTIR-ATR spectra.
Sample TreatmentSpectral Range (cm−1)LVTCC Range of Variation (µg/g)CalibrationPrediction
minmaxS.D.R2CALRMSECbiasR2PREDRMSEPbiasRPD
Fresh pulp1300–3000421.0230.157.10.7223.260.050.6625.660.811.72
Freeze-dried pulp920–30008182.82137.3522.60.95109.80−5.730.93193.10−18.953.78
LV, latent variables; TCC, total carotenoids content; min, minimum value of the prediction set; max, maximum value of the prediction set; S.D., standard deviation of the prediction set; R2, coefficient of determination; RMSEC, root mean square error of calibration; RMSEP, root mean square error of prediction; RPD, the residual predictive deviation. The error for fresh pulp is expressed as µg/g on wet basis, whereas the error for freeze-dried samples is expressed as µg/g on dry basis.
Table 2. Comparative performance of reported methods based on MIR and NIR techniques for carotenoid determination in food samples.
TechniqueMatrixRange of Variation (µg/g)
(max–min)
AnalyteR2RMSESource
MIRTomato juice92.5–15.22Lycopene0.970.4[11]
MIRTomato juice1.8–6.6β-carotene0.910.054[11]
NIRPumpkin67.1–451.2Total carotenoids0.9531.7[30]
NIRPumpkin50.3–434.3Lutein0.9626.8[30]
NIRPumpkin0–24β-carotene0.812.27[30]
NIRTomato26.2–6290Lycopene0.8591.19[31]
NIRTomato2.3–28.3β-carotene0.800.41[31]
R2, reported coefficient of determination of the models; RMSE, reported root mean square error.

