1. Introduction
Contemporary dental Computer Aided Design/Computer Aided Manufacturing (CAD/CAM) technology is used to manufacture dental prostheses. According to recent studies reports [
1,
2,
3], the global market for Dental CAD/CAM is booming and expected to achieve prominence by 2024–2027, with an expected growth rate of about 5.6% to 8.1% per year.
However, the dental CAD/CAM process requires several steps to produce a prosthesis, with the last step the milling process performed with a Numerical Controlled (NC) milling machine. This NC milling step plays a crucial role as it generates a characteristic “signature” on the prosthesis shape called surface integrity (SI), not sufficiently understood at present in restorative dentistry [
4]. These SI properties (roughness, hardness, marginal chipping, porosity, internal stress, etc.) of the milled prosthesis are mainly affected by the milling process [
5]. In addition, several requirements of the prosthesis surface such as aesthetics, biological response (dental plaque retaining) and mechanical behavior (micromechanical retention of the cement or/and adhesion on the intaglio surface) and restoration lifetime are highly dependent on residual roughness after CAD/CAM milling [
6,
7,
8,
9,
10,
11,
12,
13].
Prosthetic surface roughness is a crucial parameter and a specific roughness can be manufactured for each clinical requirement. For example, restoration lifetime, aesthetics and biological response require a minimal surface roughness currently ensured by polishing after CAD/CAM [
14]. Such surface roughness should be obtained directly after milling by optimizing milling parameters. On the contrary, the surface to be bonded must be sufficiently rough to ensure good bonding [
15].
To fulfill these clinical requirements, several classes of biomaterials are available on the marketplace, such as ceramics, composite resins and PICN (Polymer-Infiltrated Ceramic-Network) [
16,
17,
18,
19]. These biomaterial classes differ considerably in their mechanical, chemical and machinability properties. However, few data on their properties after milling are provided in the literature [
20,
21]. This article focuses on the properties of biomaterial SI after milling. In addition, biomaterial SI properties also depend on the tool-biomaterial couple used [
22]. The tool-biomaterial couple is composed of the tool (diamond rotary cutting instrument) used, the milled biomaterial, and the milling parameters (such as feed rate) programmed [
23,
24]. To the best of our knowledge the interactions between the tool-biomaterial couple and SI, in dentistry, have not yet been studied. The aim of this study is to assess these interactions in the end milling mode (use of the tool tip for milling). The SI properties are mainly described through roughness parameters [
25,
26,
27,
28].
The first null hypothesis of this study is that roughness does not vary depending on the tool-biomaterial couple while the second null hypothesis is that roughness does not vary as a function of the feed rate.
2. Materials and Methods
Four typical machinable biomaterials and two marketed tools are studied. The milling conditions are as close as possible to those used in a daily practice. After milling, surface topology and six roughness amplitude parameters are measured and analysed for each sample.
2.1. Tool-Biomaterial Couples
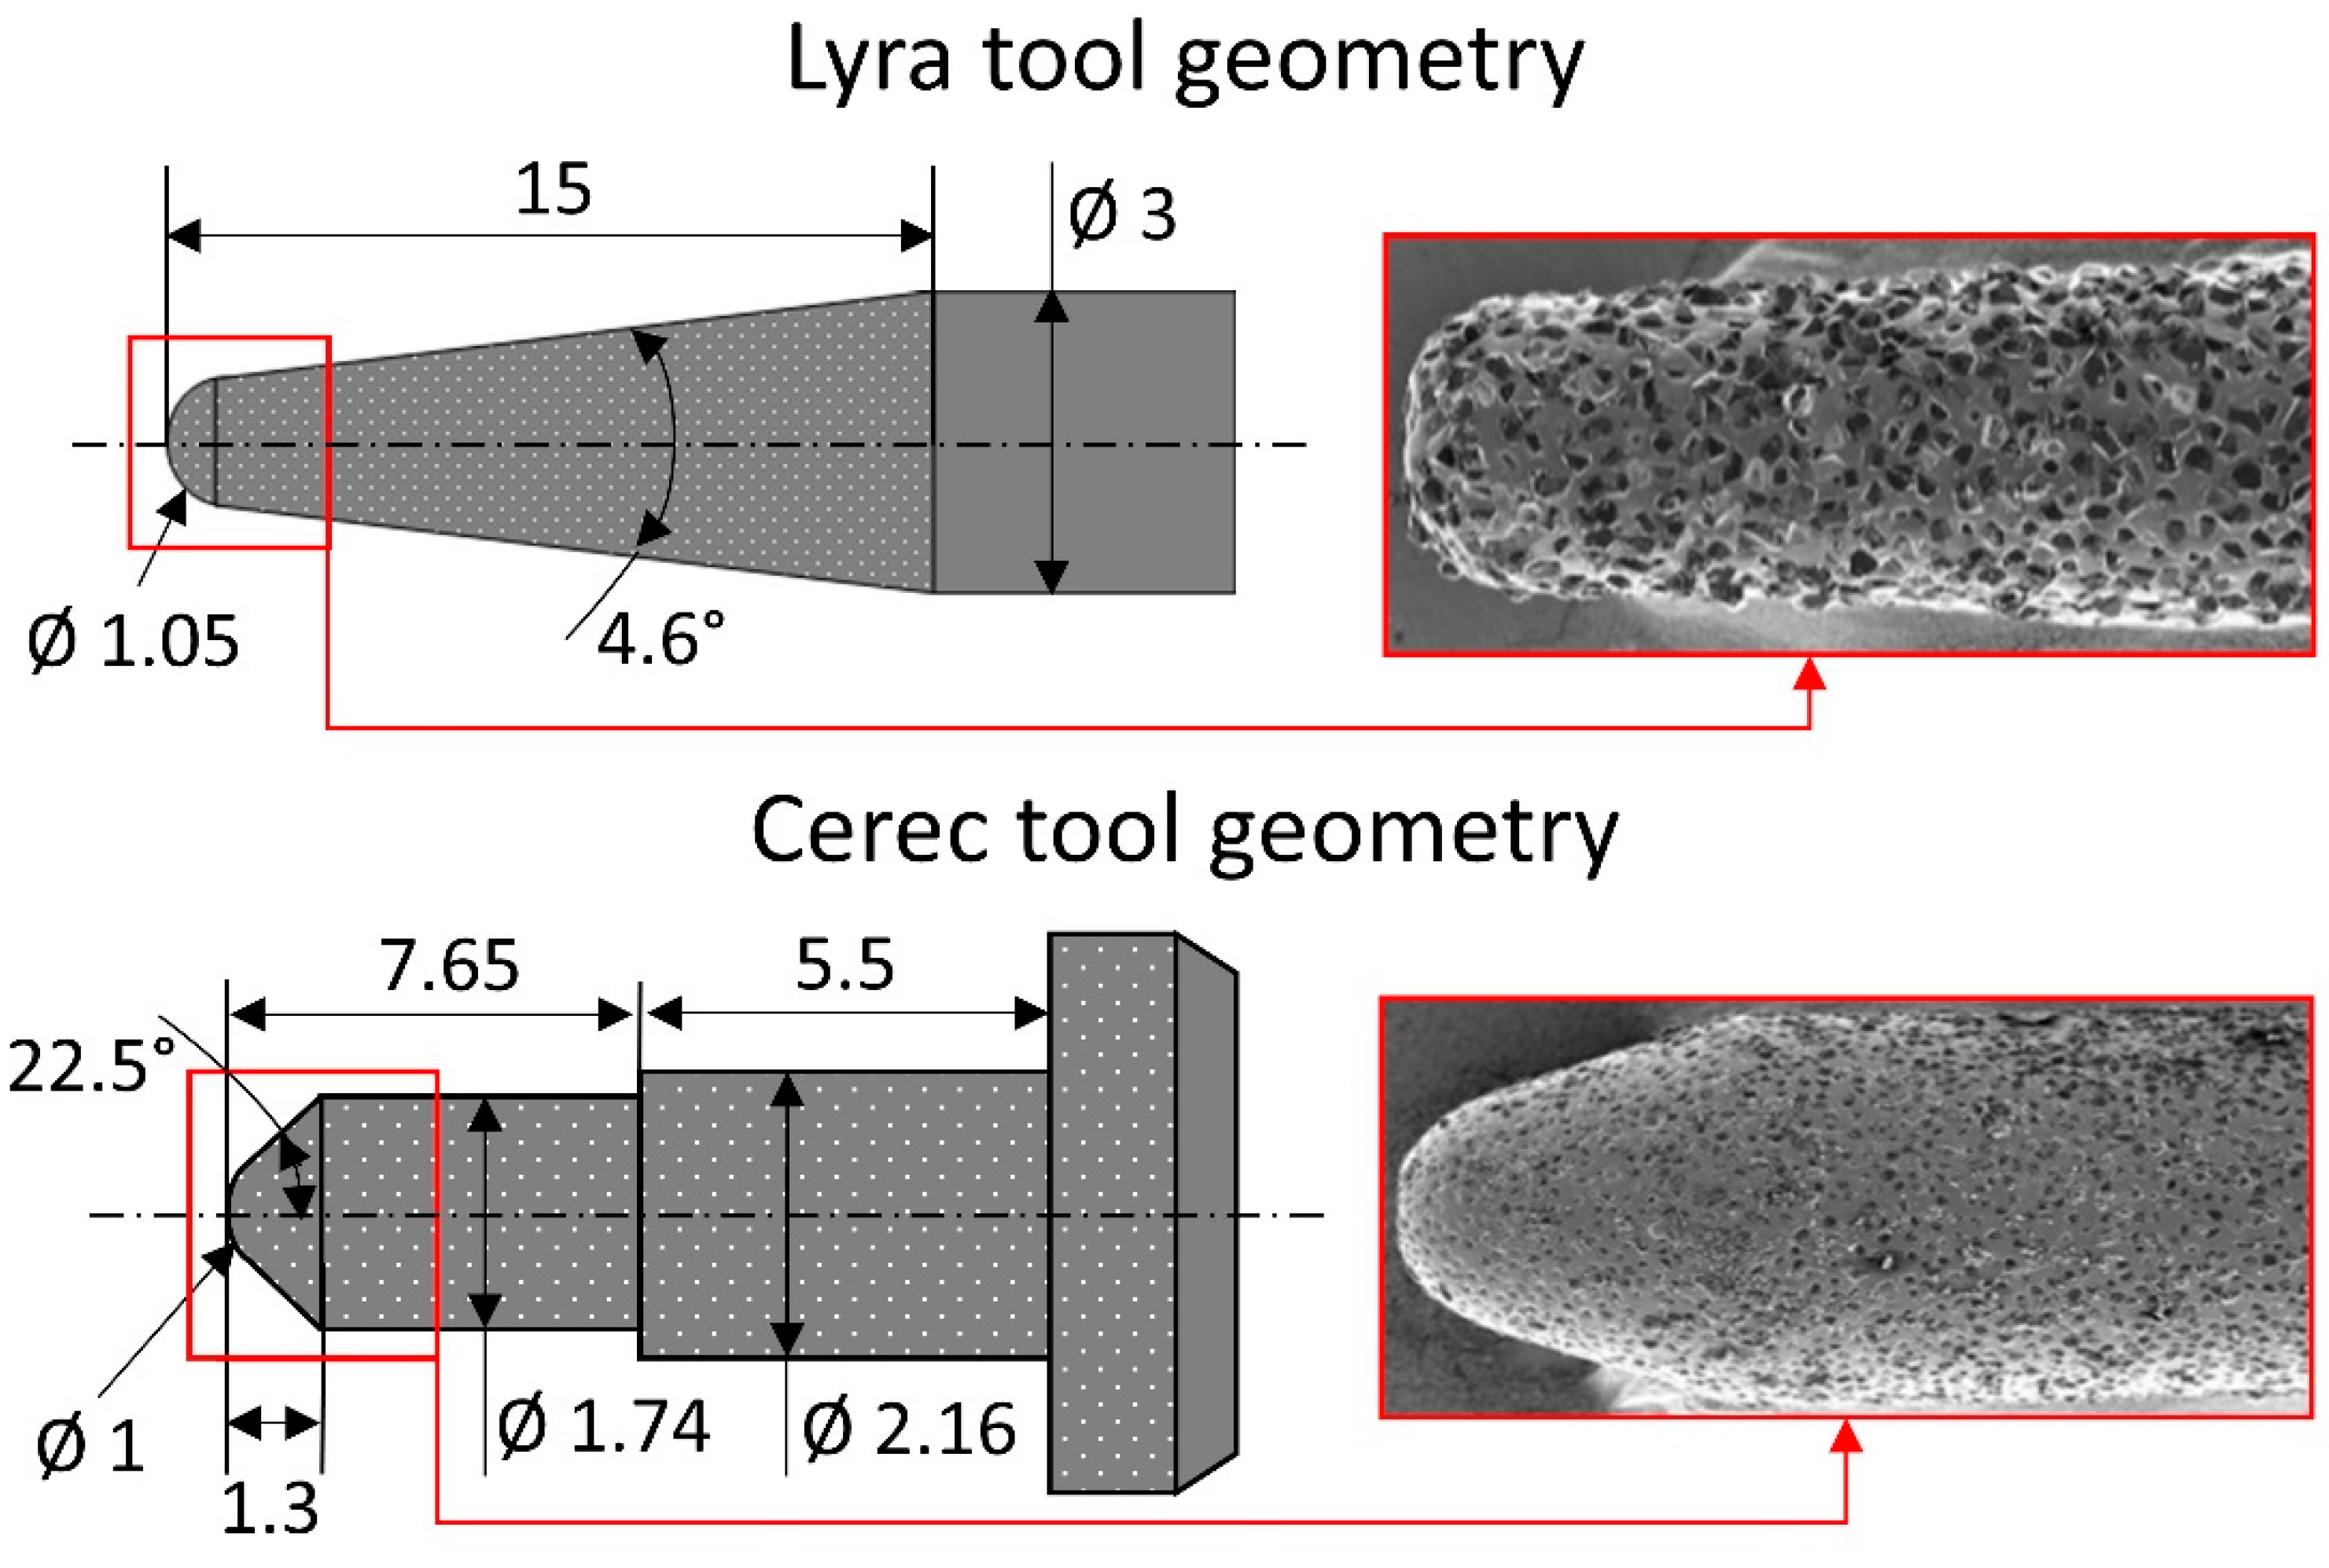
To be as representative as possible of the dental marketplace, four machinable biomaterials (two ceramic, one composite and one PICN) and two commercial CAD/CAM tools are used in this study (
Table 1 and
Table 2). The two tool geometries are described in
Figure 1. The eight practicable tool-biomaterial couples investigated are presented in
Table 3.
2.2. Milling Conditions
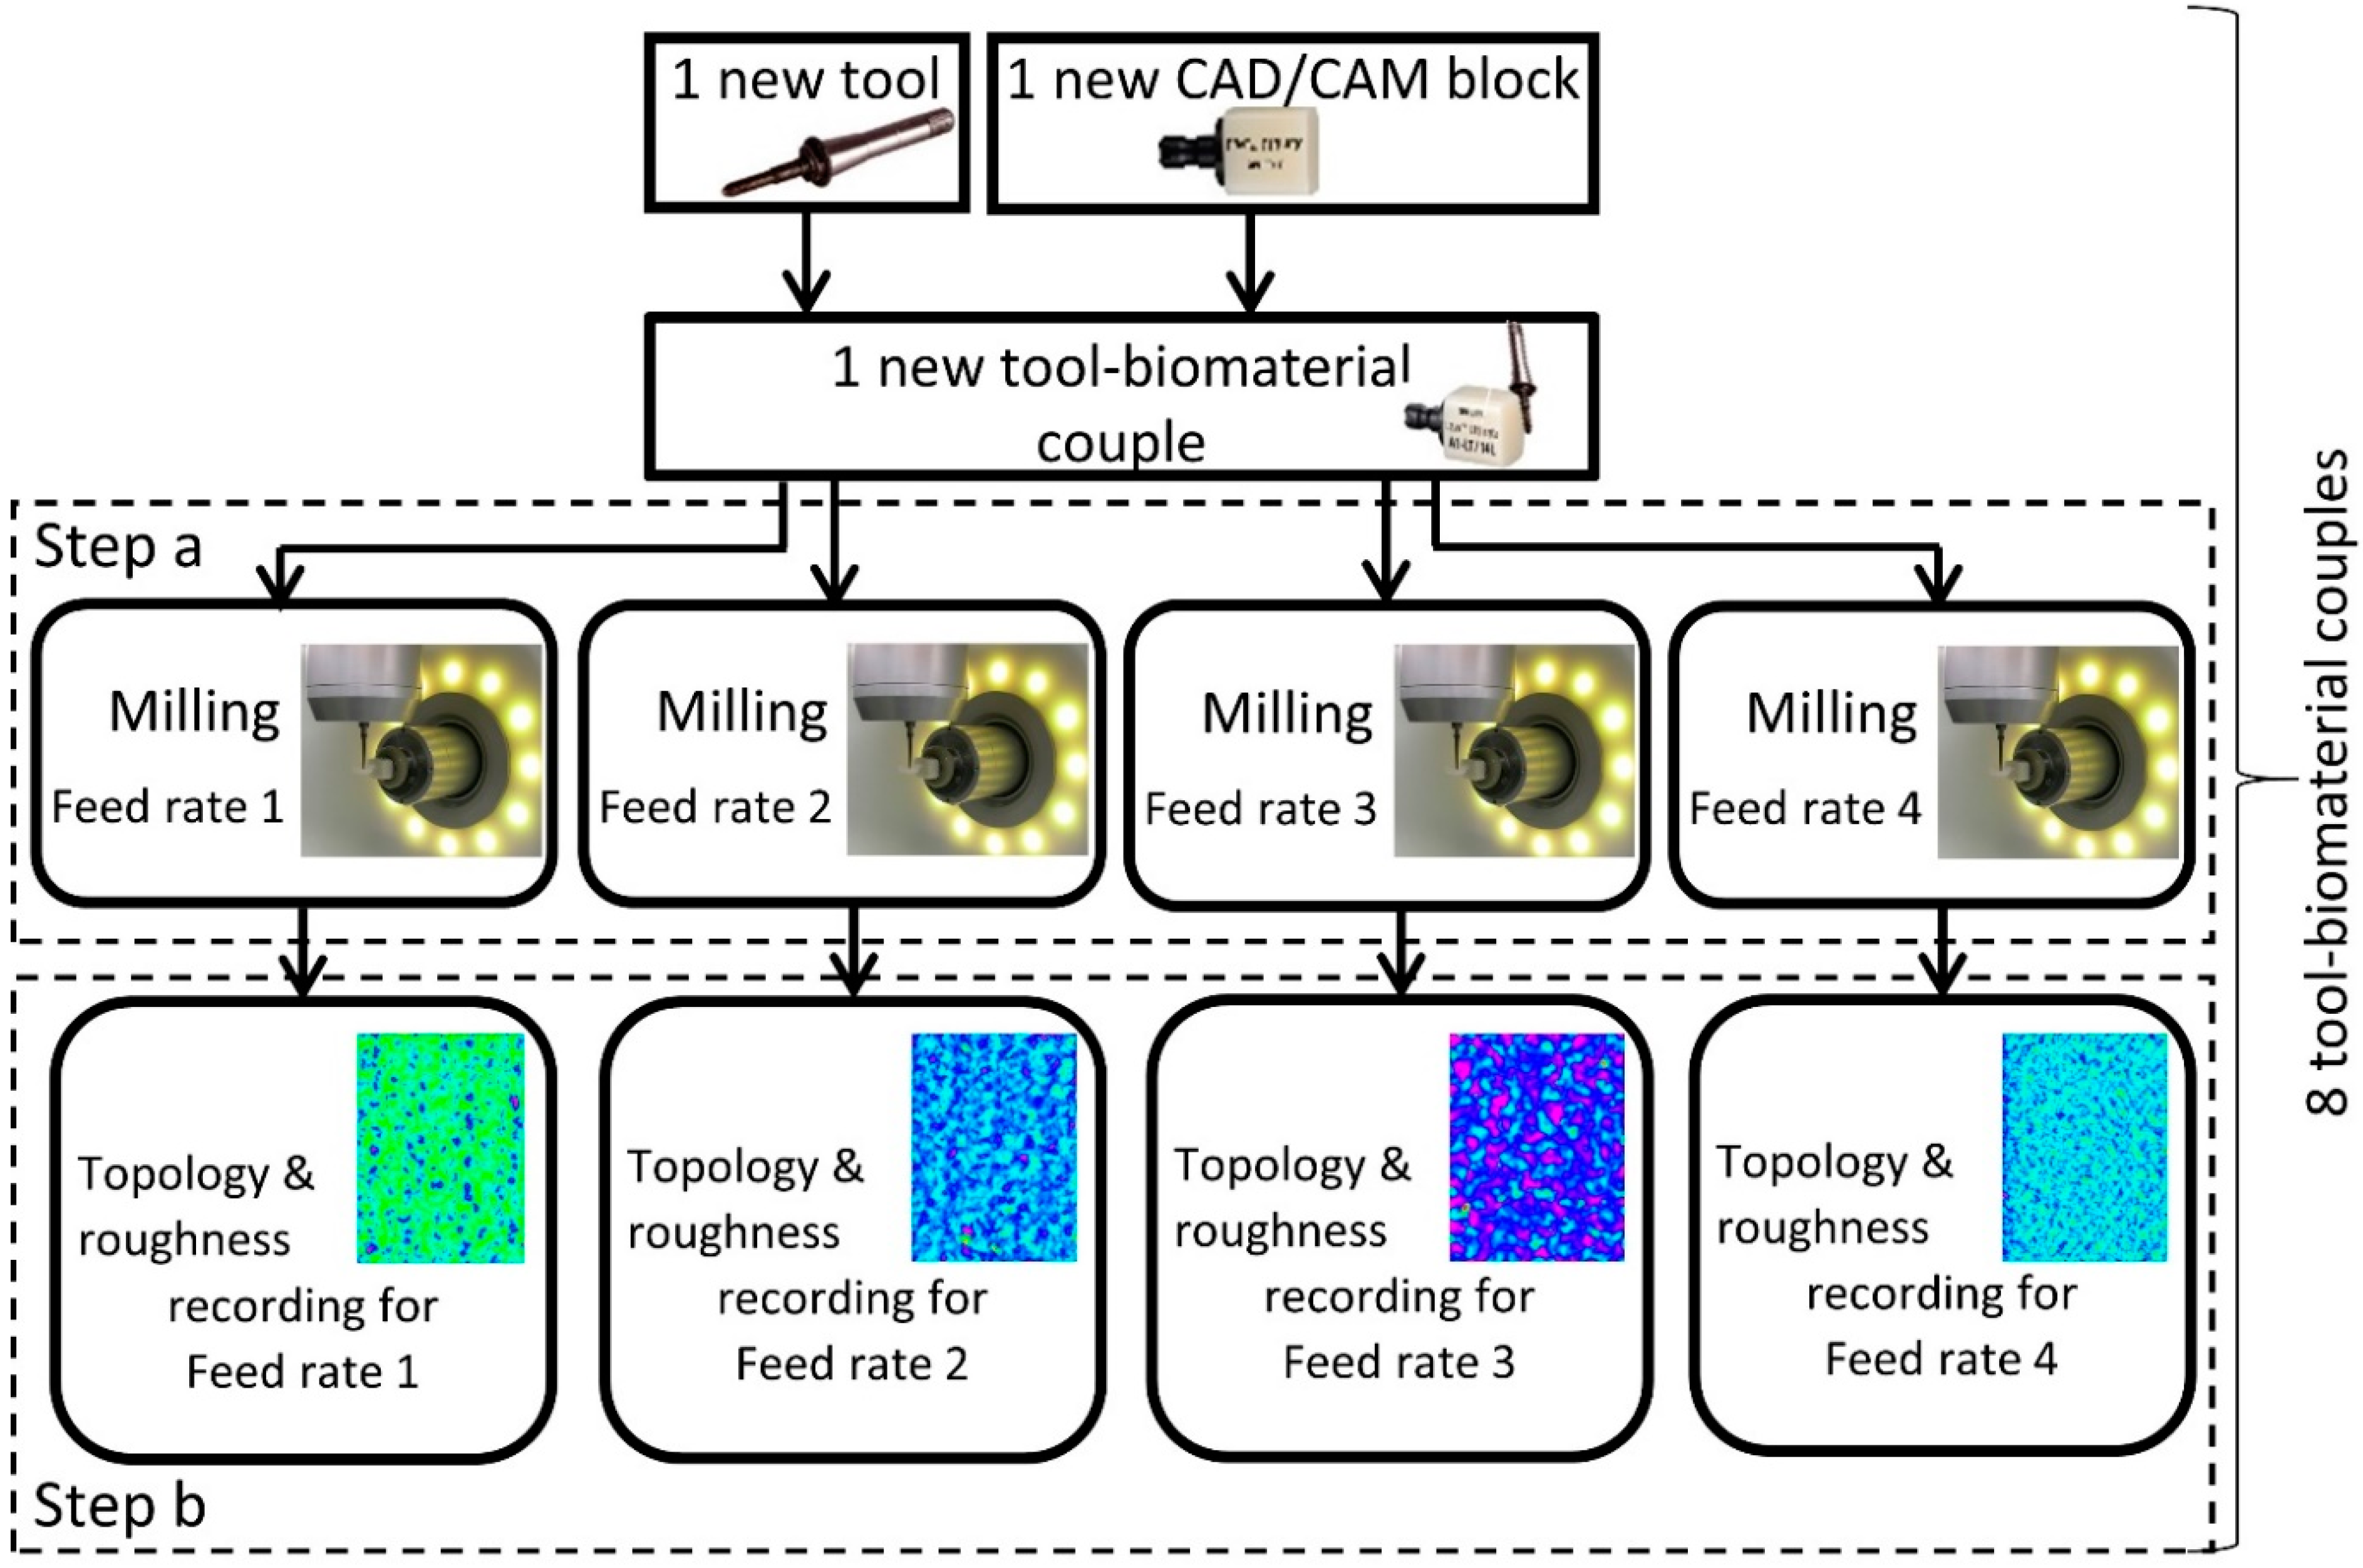
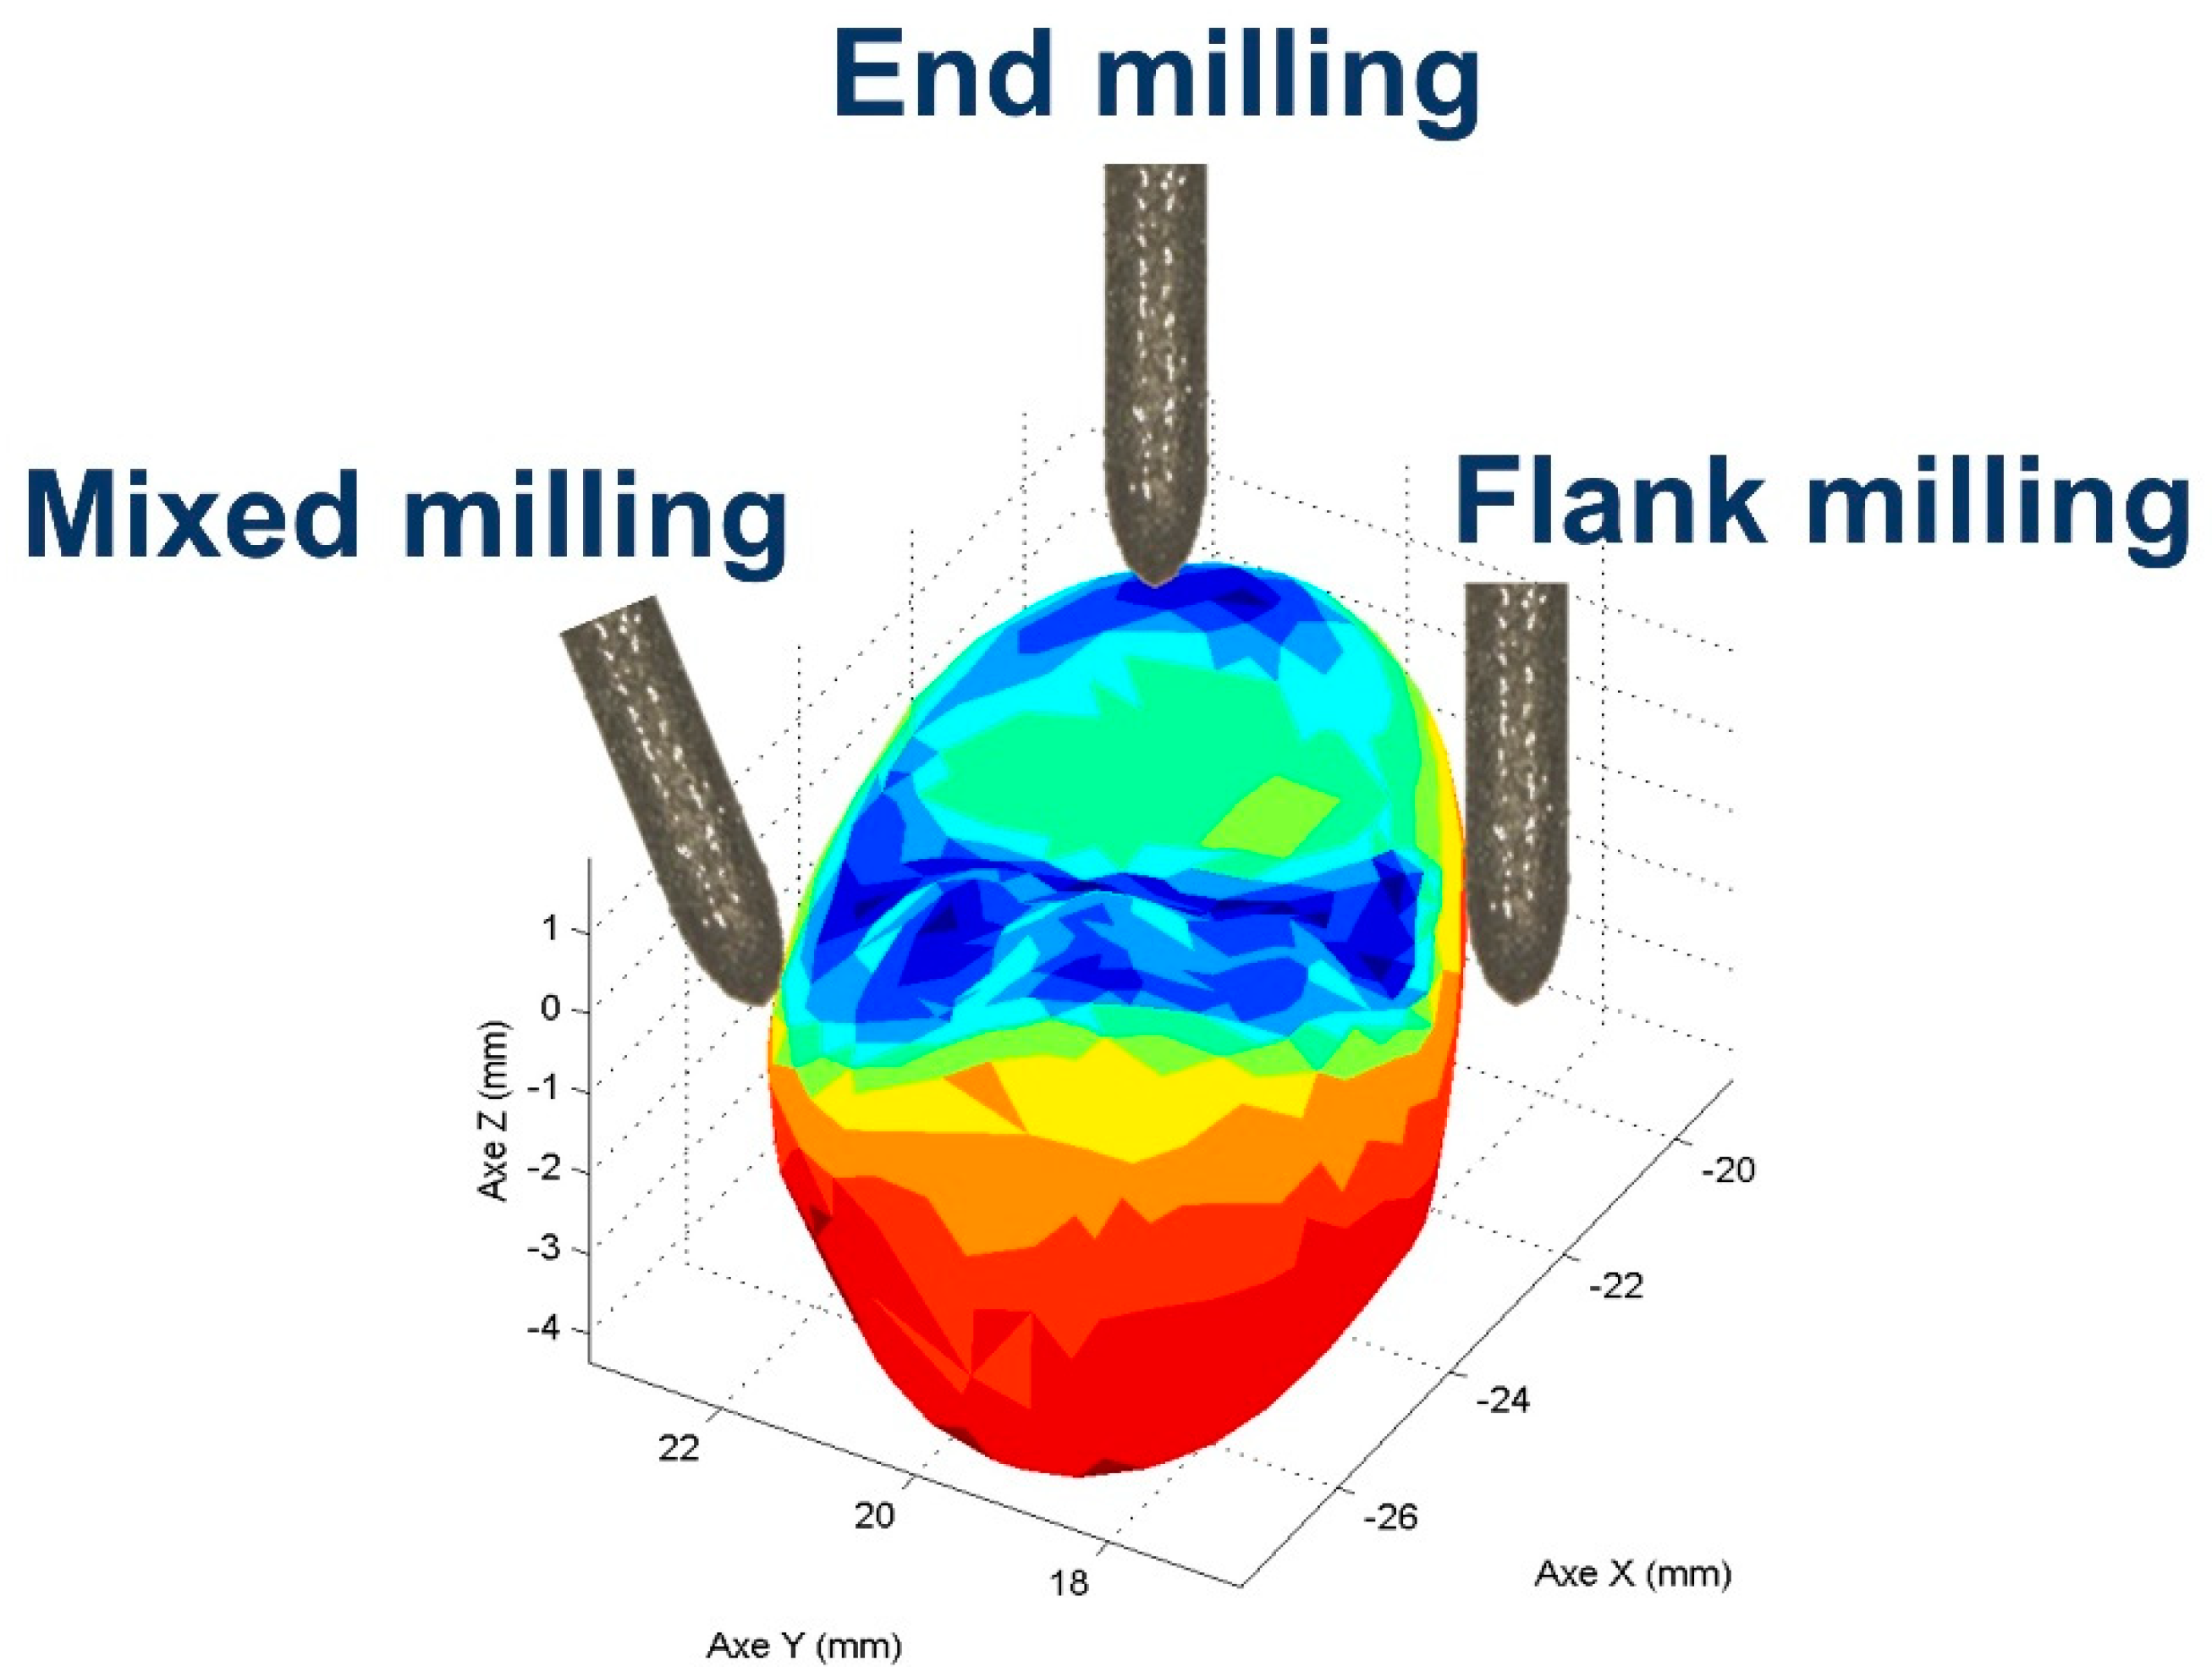
A four axis (X, Y, Z, A) milling center (Lyra-GACD prototype) is used to mill all the samples. The experiments are performed in end milling mode at a constant spindle speed of 60,000 RPM. End milling mode is when the end tip (not the flank) of the tool is used to mill the surface (
Figure 2). The milling center is warmed up before milling, if necessary (axis and spindle thermal stabilization). During milling, a coolant is sprayed on to the tool-biomaterial contact area at a constant coolant flow rate.
The influence of the feed rate on the surface roughness with the eight practicable couples is investigated at four different feed rates (1000-2000-3000-4800 mm/min). The feed rate is the relative displacement speed between the tool and the workpiece. Therefore, thirty-two experiments are necessary (
Figure 3). These four feed rates are tested on the same biomaterial CAD/CAM raw block (one feed rate per side). A new tool is used for each new biomaterial raw block. For each experiment, a planar area (5 × 15 mm²) is milled on each side of the CAD/CAM block (
Figure 3, Step A). The size of the planar machined surface is suitable with the raw dimensions of the CAD/CAM block and allows the topology and 3D roughness to be measured correctly, freeing it from unusable areas (CNC acceleration/deceleration areas). The axial (ap) and radial (ar) depths are 0.5 mm and 0.1 mm respectively. To sweep 5 × 15 mm² with a radial depth of 0.1 mm each tool moves back and forth fifty times. The total path length is 750 mm (=50 × 15 mm) per feed rate. The total milled volume (chip volume) per tool is 150 mm
3 (=15 mm × 5 mm × 0.5 mm × 4). All the dimensions are reported in
Figure 2.
2.3. Surface Topography Recording
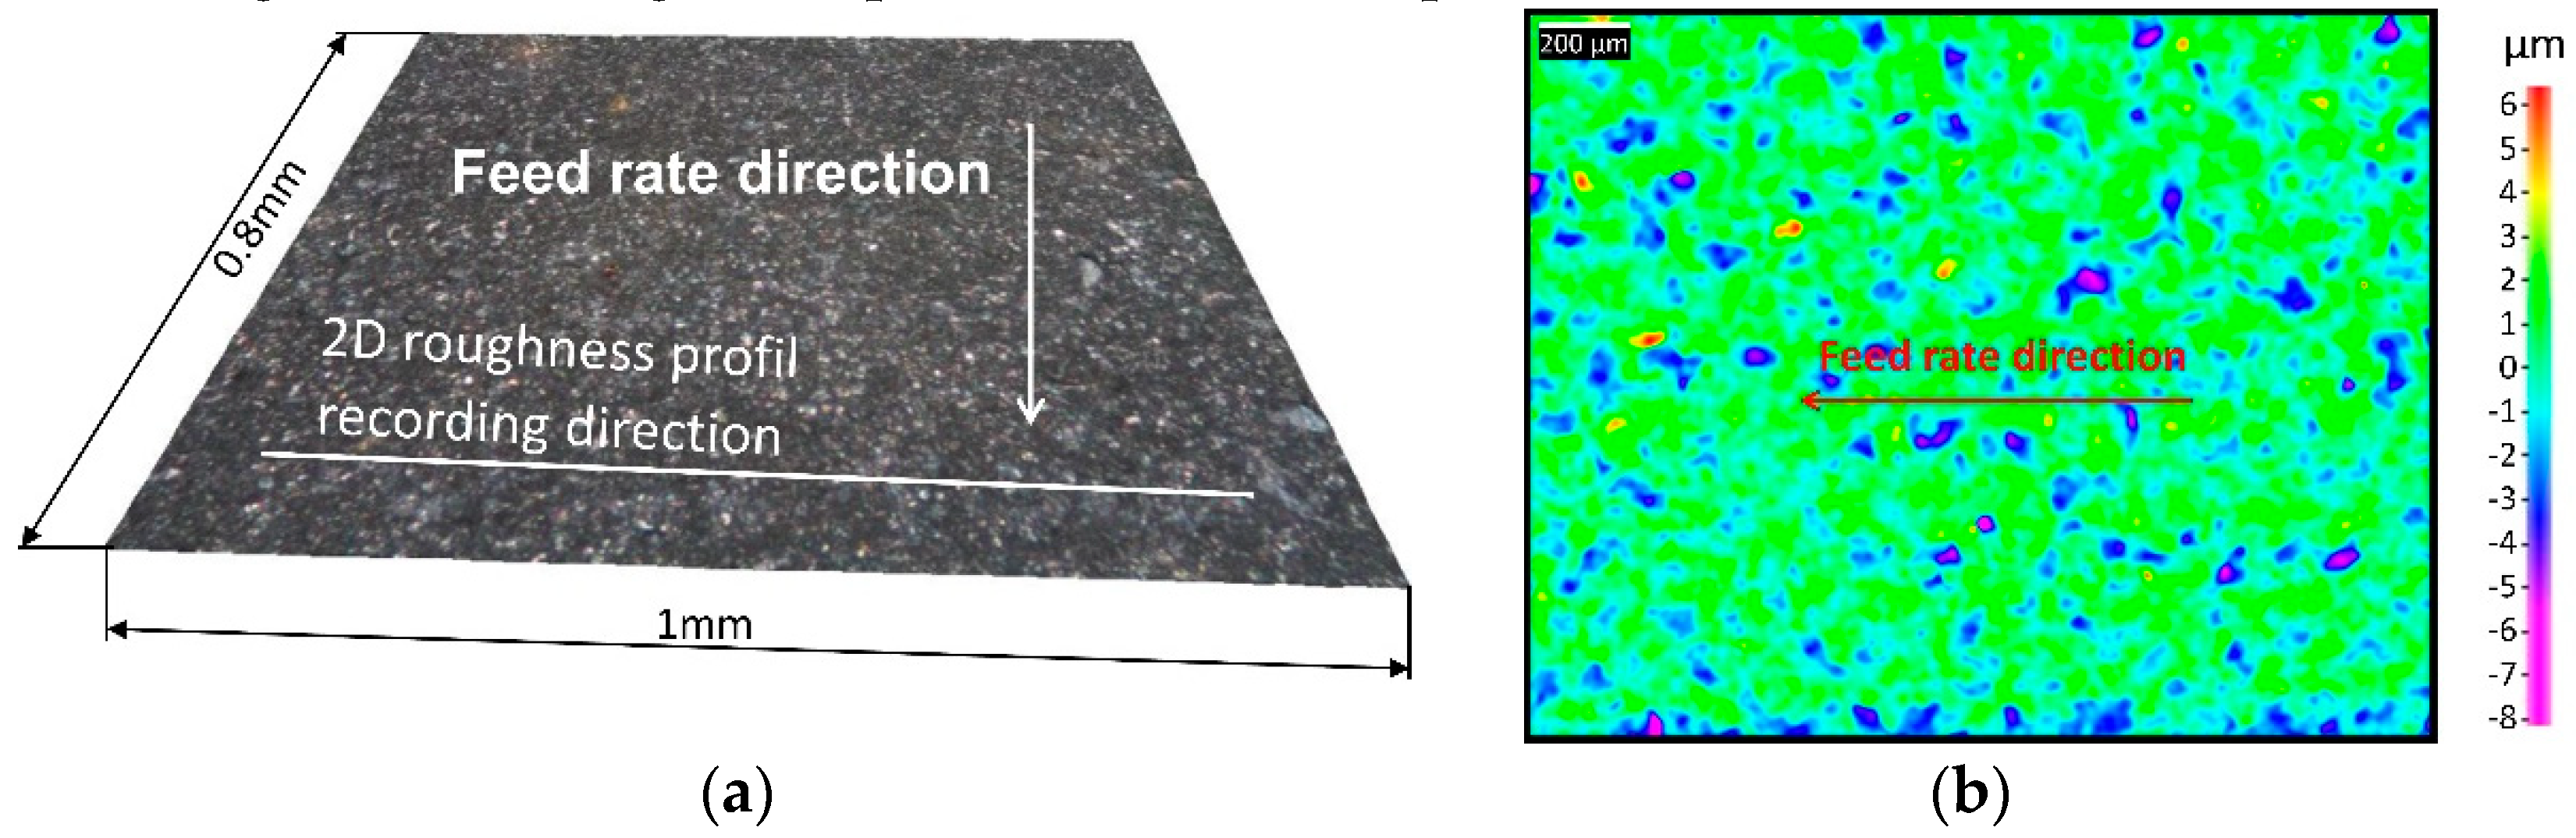
The surface topography is recorded according to the diagram presented in
Figure 3. Each milled surface topology is optically recorded in 3D (
Figure 3, Step B) with a focal variation device (Bruker Alicona, Infinite Focus). Focus variation is a method that allows the measurement of areal surface topography using optics with limited vertical scanning and depths of field. Depth measurement by focus variation is obtained by searching the best focus position of an optical element pointing to a sample. This position in focus field is related to a distance from the sample (depth). This operating principle is in line with the ISO standard 25178 for classifying surface texture method. Two planar surfaces (0.8 × 1 mm
2) per sample are recorded in the middle of each milled surface with a vertical resolution of 110 nm under 20 times magnification.
2.4. Roughness Analysis
2.4.1. Surface Roughness Characterization
Each milled surface roughness is characterized according to the diagram presented in
Figure 3 (
Figure 3, Step B). Two dimensional (2D) and three dimensional (3D) roughnesses are computed according to ISO 4287, 4288 standards [
25,
26] for 2D roughness applications and ISO 25178 standards [
28] for 3D applications. The 3D roughness parameters are computed on 0.8 × 1 mm
2 planar surfaces. Two surfaces per sample are recorded and 3D roughness are computed in the middle of the milled surface. Then, the mean and standard deviation are calculated. In accordance with standard EN 623-4 [
29], aberrant points are excluded from the area, if necessary. From each 3D surface recording, 2D roughness profiles are selected and extracted perpendicularly to the feed rate direction (
Figure 4a). Three profiles (around 1 mm length) per sample are selected in the middle of the milled surface. Then, the mean and standard deviation are calculated.
2.4.2. Surface Roughness Parameters
The observed 2D roughness parameters are Ra (average roughness of profile), Rt (maximum peak to valley height of roughness profile) and Rz (mean peak to valley height of roughness profile) [
25,
26,
27]. The observed 3D roughness parameters are Sa (average height of selected area), Sz (maximum valley depth of selected area) and Sq (root-mean-square height of selected area) [
28]. Ceramic surface roughness is recorded according to standard EN 623-4 [
29].
2.4.3. Statistics
Sa and Ra roughness parameter data are extensively analysed by using Kruskal-Wallis (K-W) non-parametric analysis tests (α = 0.05).
3. Results
First, the six measured roughness parameters (Ra, Rt, Rz, Sa, Sq, Sz) and the recorded surface topology of the machined surfaces of the eight tool-biomaterial couples are determined. Then, according to the results, the relationship between the roughness parameters obtained and the hardness of the machined biomaterial is characterized. Afterwards, the impact of the feed rate on the roughness is defined and, finally, the K-W statistical tests results are taken into account.
3.1. Results of Surface Roughness Experiments
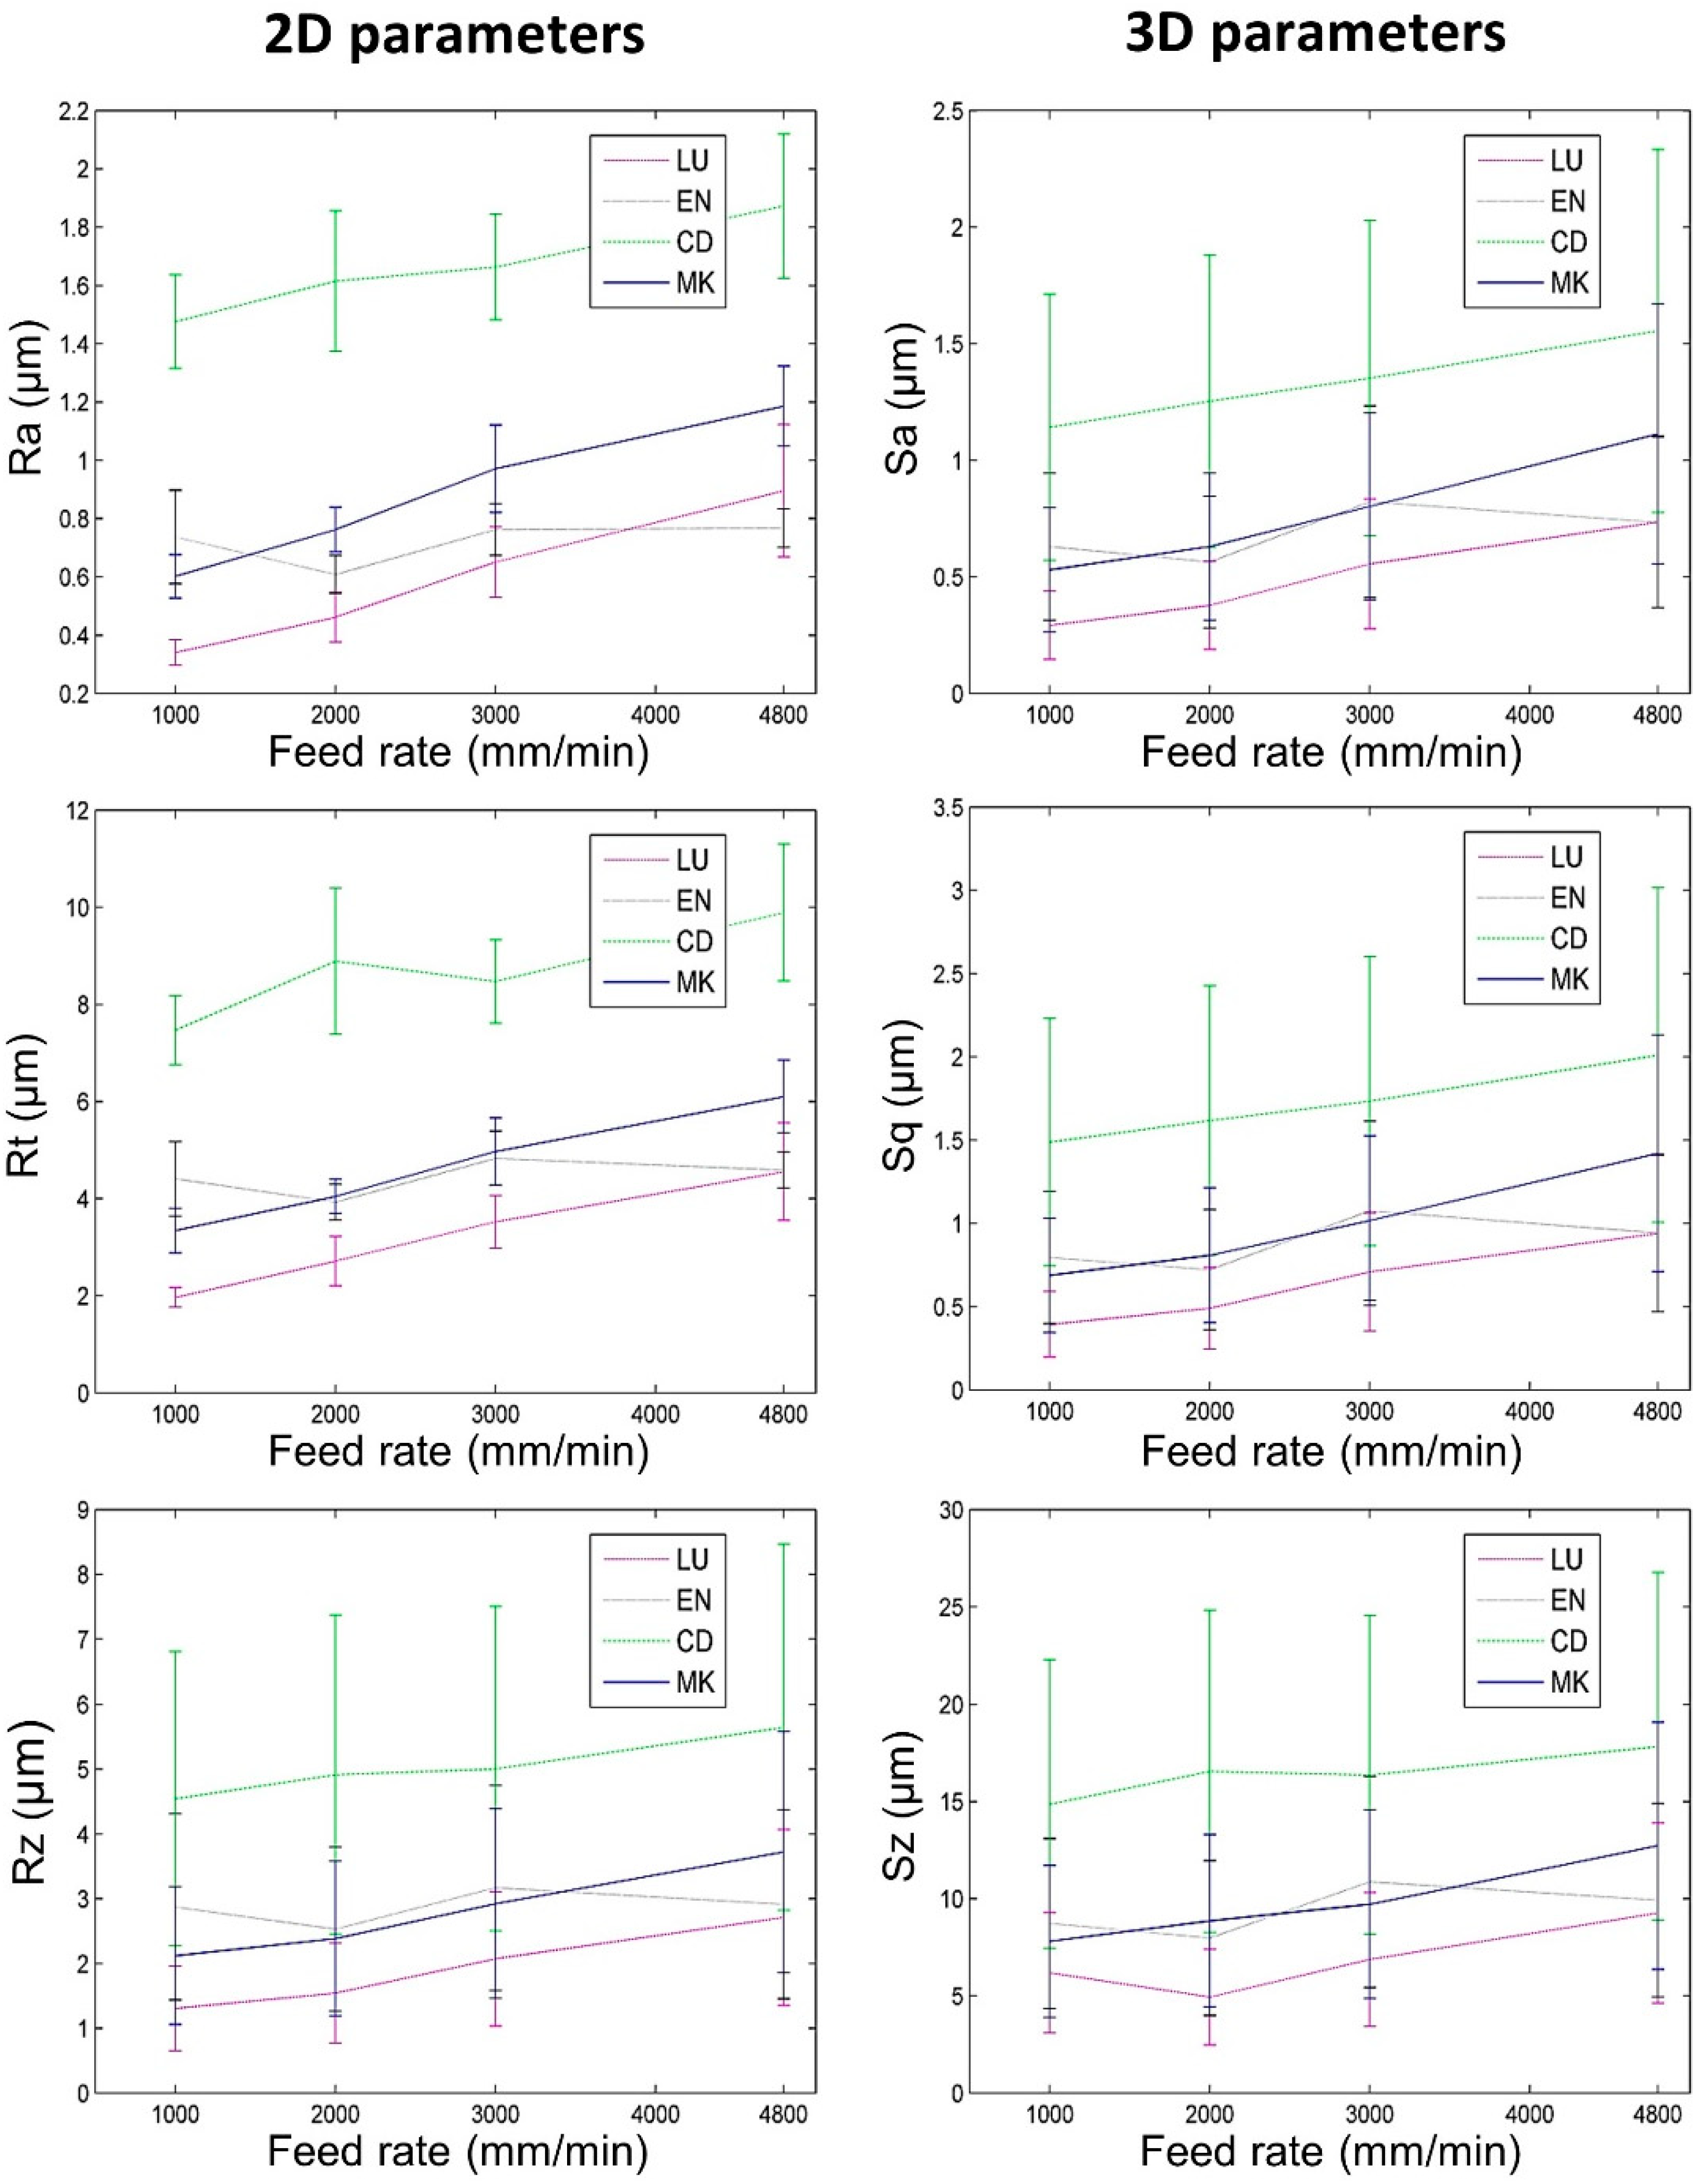
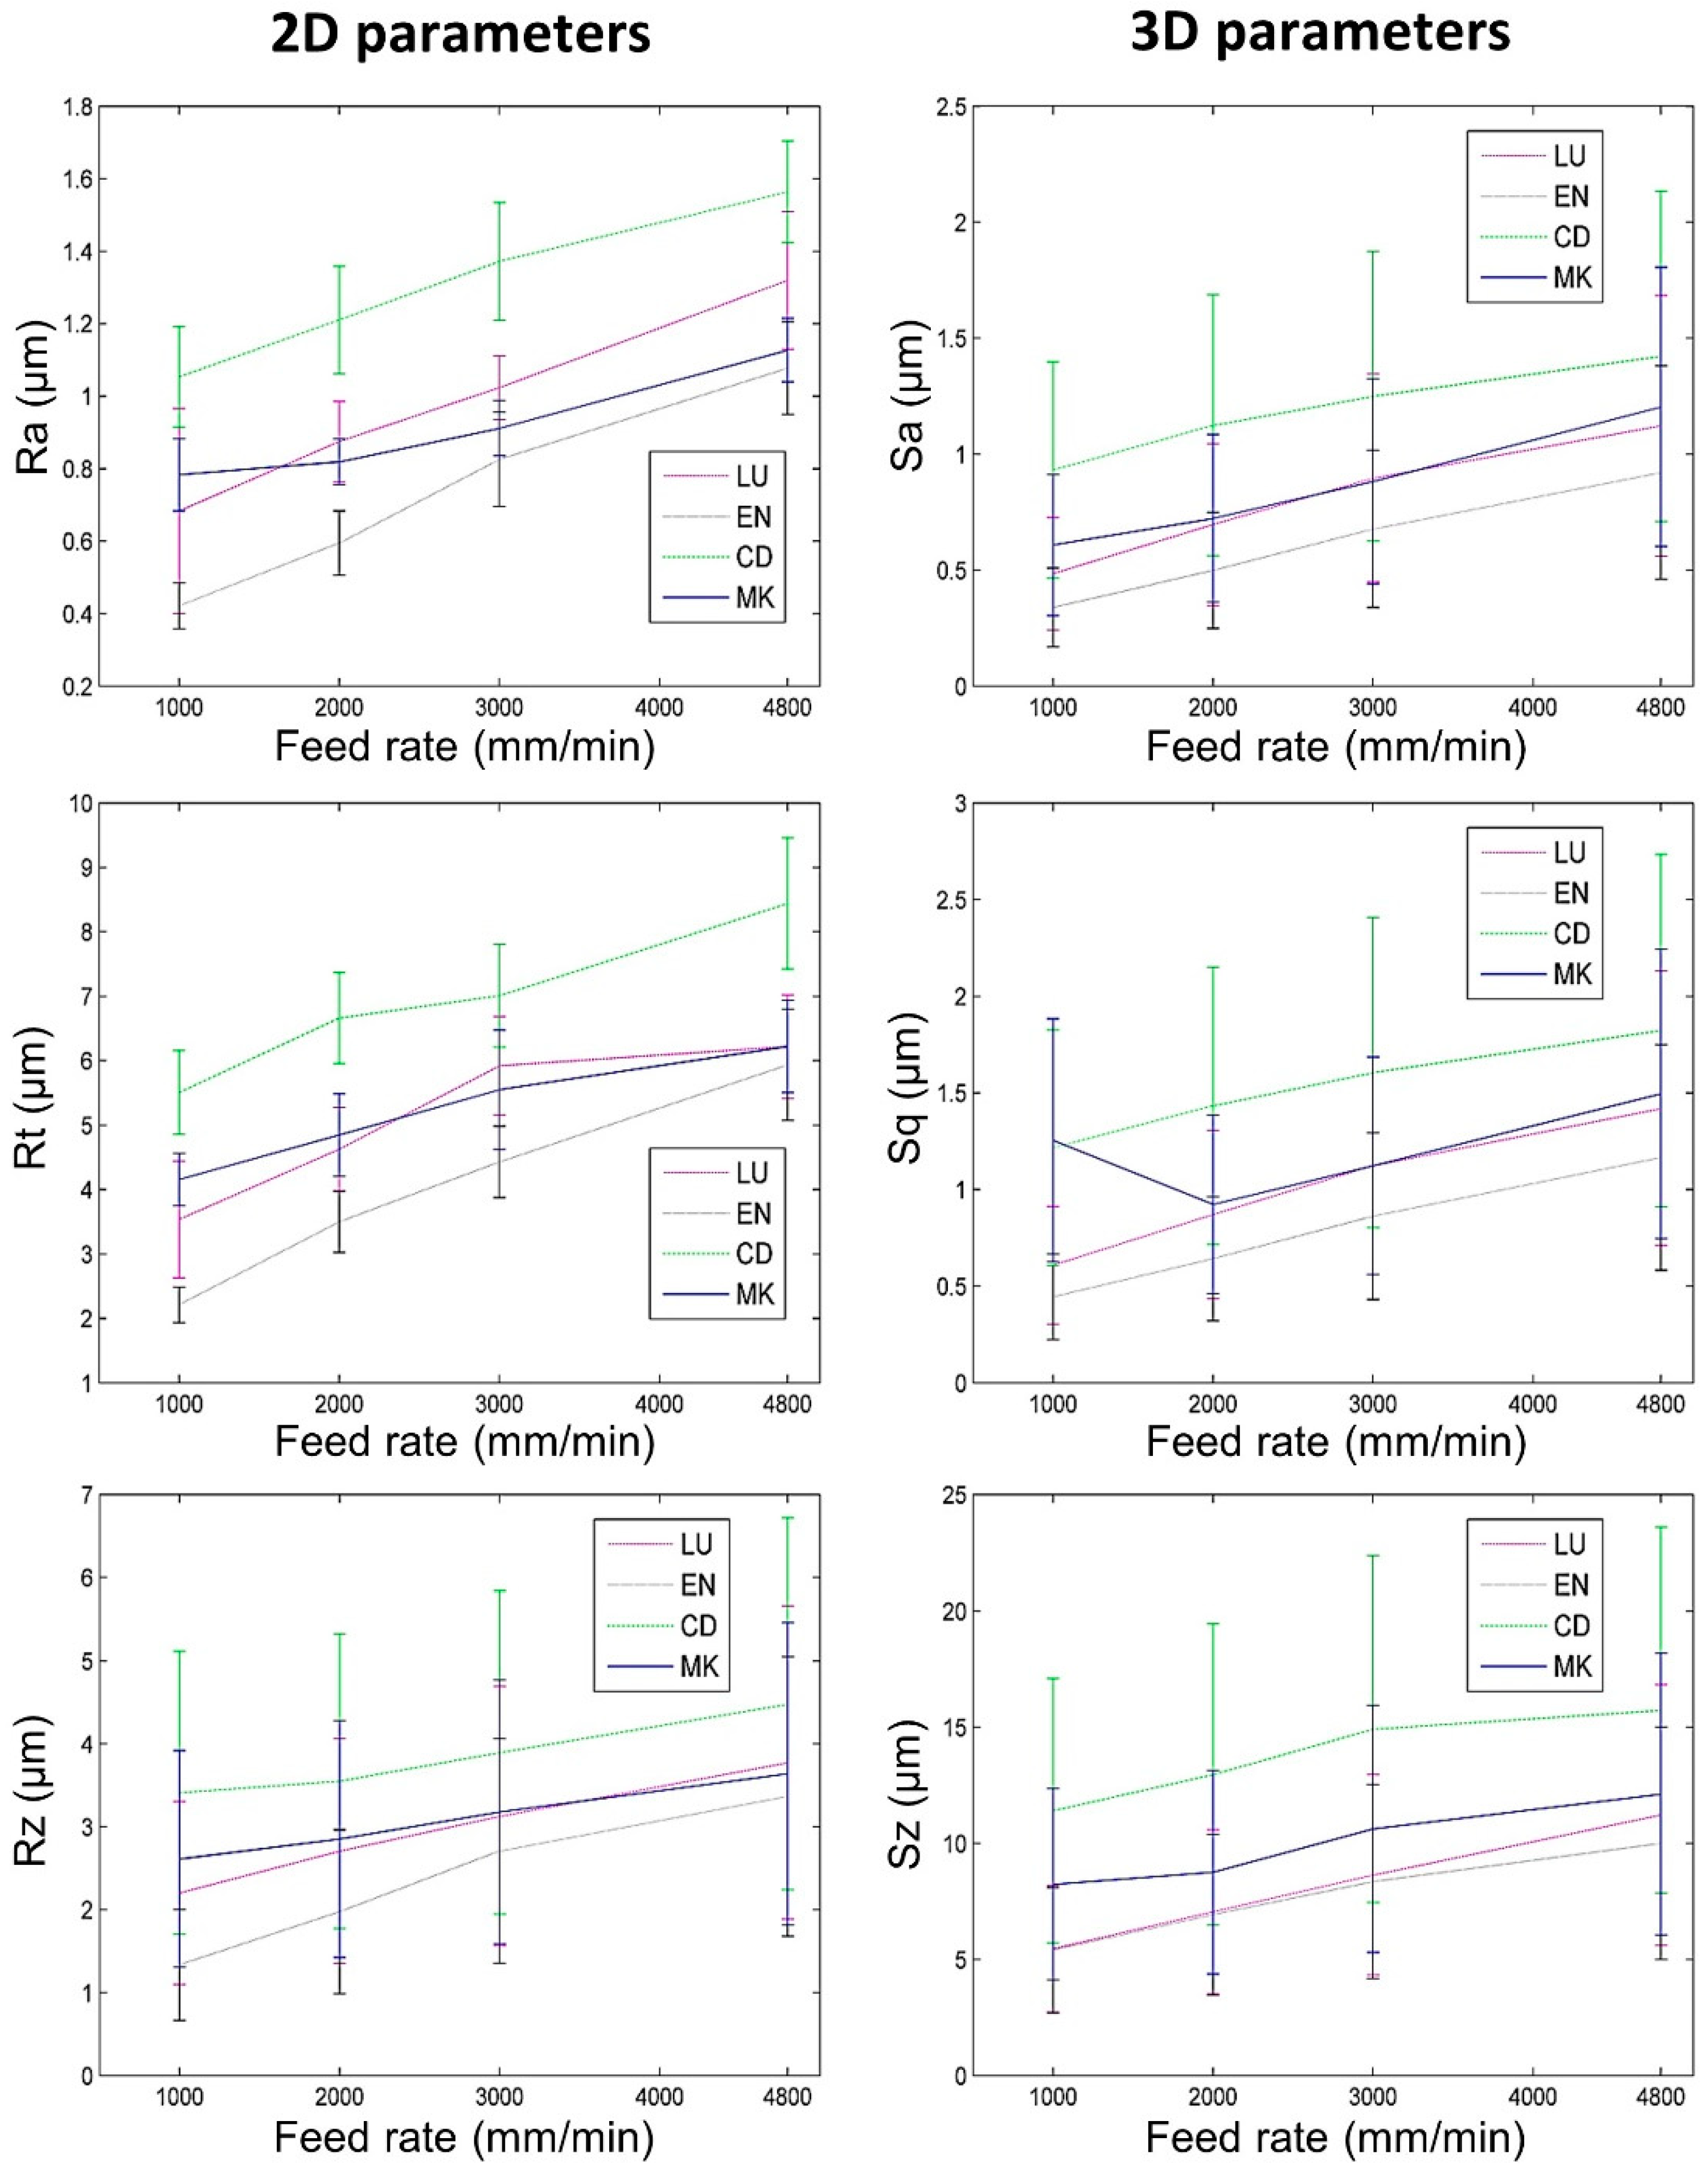
The surfaces of the eight tool-biomaterial couples observed, machined with the two LY and CER tools, showed isotropic surfaces without the presence of pronounced peaks and/or valleys (
Figure 4). The roughness results obtained with the LY and CER tools are shown in
Figure 5 and
Figure 6. The roughness parameters measured with the CER tool were very close to those obtained with the LY tool. We noted that the standard deviations (SD) were lowest for the Ra and Sa roughness parameters. Conversely, the highest SD were observed for the Rt, Rz, Sz, Sq roughness parameters. For both tools, the Ra parameters presented slightly higher values compared to the Sa values. Similarly, the Rt parameters were on average, four times higher than Sq. On the contrary, the 3D parameters Sz were four times higher on average, compared to the 2D Rz parameters.
3.2. Surface Roughness vs. Biomaterial Hardness
For both tools (LY and CER) and all feed rates, the 2D and 3D surface roughnesses of biomaterials CD and MK (hardest biomaterials milled) were rougher than the other biomaterials (
Figure 5 and
Figure 6). The roughness values of biomaterials LU and EN (milled soft and medium biomaterials) were the lowest. For each tool, the Ra and Sa roughnesses were observed to increase from the softest (LU) to the hardest (CD) biomaterial (
Figure 7). The highest slope was observed between the medium (EN) and the hard (CD) biomaterials.
3.3. Surface Roughness vs. Feed Rate
For the eight tool-biomaterial couples, it was observed that 2D and 3D surface roughness seemed to be weakly influenced by the feed rate (
Figure 5 and
Figure 6). Regarding Ra and Sa, a mean increase of respectively 0.46 µm and 0.48 µm was observed when the feed rate ranged from 1000 to 4800 mm/min. Regarding Rz and Sz, a mean increase (1.23 µm and 3.84 µm respectively) was observed when the feed rate ranged from 1000 to 4800 mm/min. Sq increased by 0.54 µm, and Rt increased by 2.42 µm. Nevertheless, whatever the tool and the feed rate, the Sq parameters were equal or slightly higher than Sa.
3.4. Statistics
K-W pairwise correlations of Ra and Sa roughness parameter were obtained and the results are shown in
Table 4 and
Table 5.
Regarding the Ra roughness parameter, with only one exception (ENLY/MKLY), the K-W statistical tests revealed a significant difference in roughness for the same biomaterial machined with the two different tools. However, with only one exception (ENLY/MKLY), two different biomaterials machined with the same milling tool did not reveal any significant difference.
As for the Sa roughness parameter, with only two exceptions (LUCER/MKCER and ENLY/MKLY), the K-W statistical tests revealed a significant difference in roughness for the same biomaterial machined with the two different tools. However, with only two exceptions (LUCER/MKCER and ENLY/MKLY), two different biomaterials machined with the same milling tool did not reveal any significant difference.
4. Discussion
The first null hypothesis that roughness does not vary depending on the tool-biomaterial couple is rejected. The second null hypothesis that roughness does not vary as a function of the feed rate is accepted.
In our study, six roughness parameters (Ra, Rt, Rz, Sa, Sq, Sz) are measured on eight tool-biomaterial couples.
End milling mode is currently used by a CNC chairside milling machine to manufacture the occlusal area (
Figure 8), which plays a major role in many clinical functional requirements. Indeed, functional specifications such as wear, aesthetics, crack initiation, and prosthesis lifetime are located on the occlusal shape [
30]. Antagonist tooth wear is impacted by the roughness of the occlusal prosthesis. Moreover, a rough surface led to poor light reflection and thus ultimately to an aesthetic defect. In addition, a rougher occlusal surface may promote crack initiation. Finally, rougher surfaces facilitate discoloration and decrease the resistance/lifetime of restoration. The clinical machining conditions are, in our study, replicated by machining a planar surface in end milling mode, with two advantages. (1) Roughness measurements are performed on milled planar surfaces, since roughness is not homogenous on complex/curved shapes and cannot be measured with trueness. (2) Reproduce the same CAD/CAM machining conditions as those used in a dental daily practice when milling the occlusal area.
Because the tool total milling time (92 s including the four feed rates) is shorter than its tool life, the same tool was used to experiment with the four feed rates (1000-2000-3000-4800 mm/min) [
31].
4.1. Results of Surface Roughness Experiments
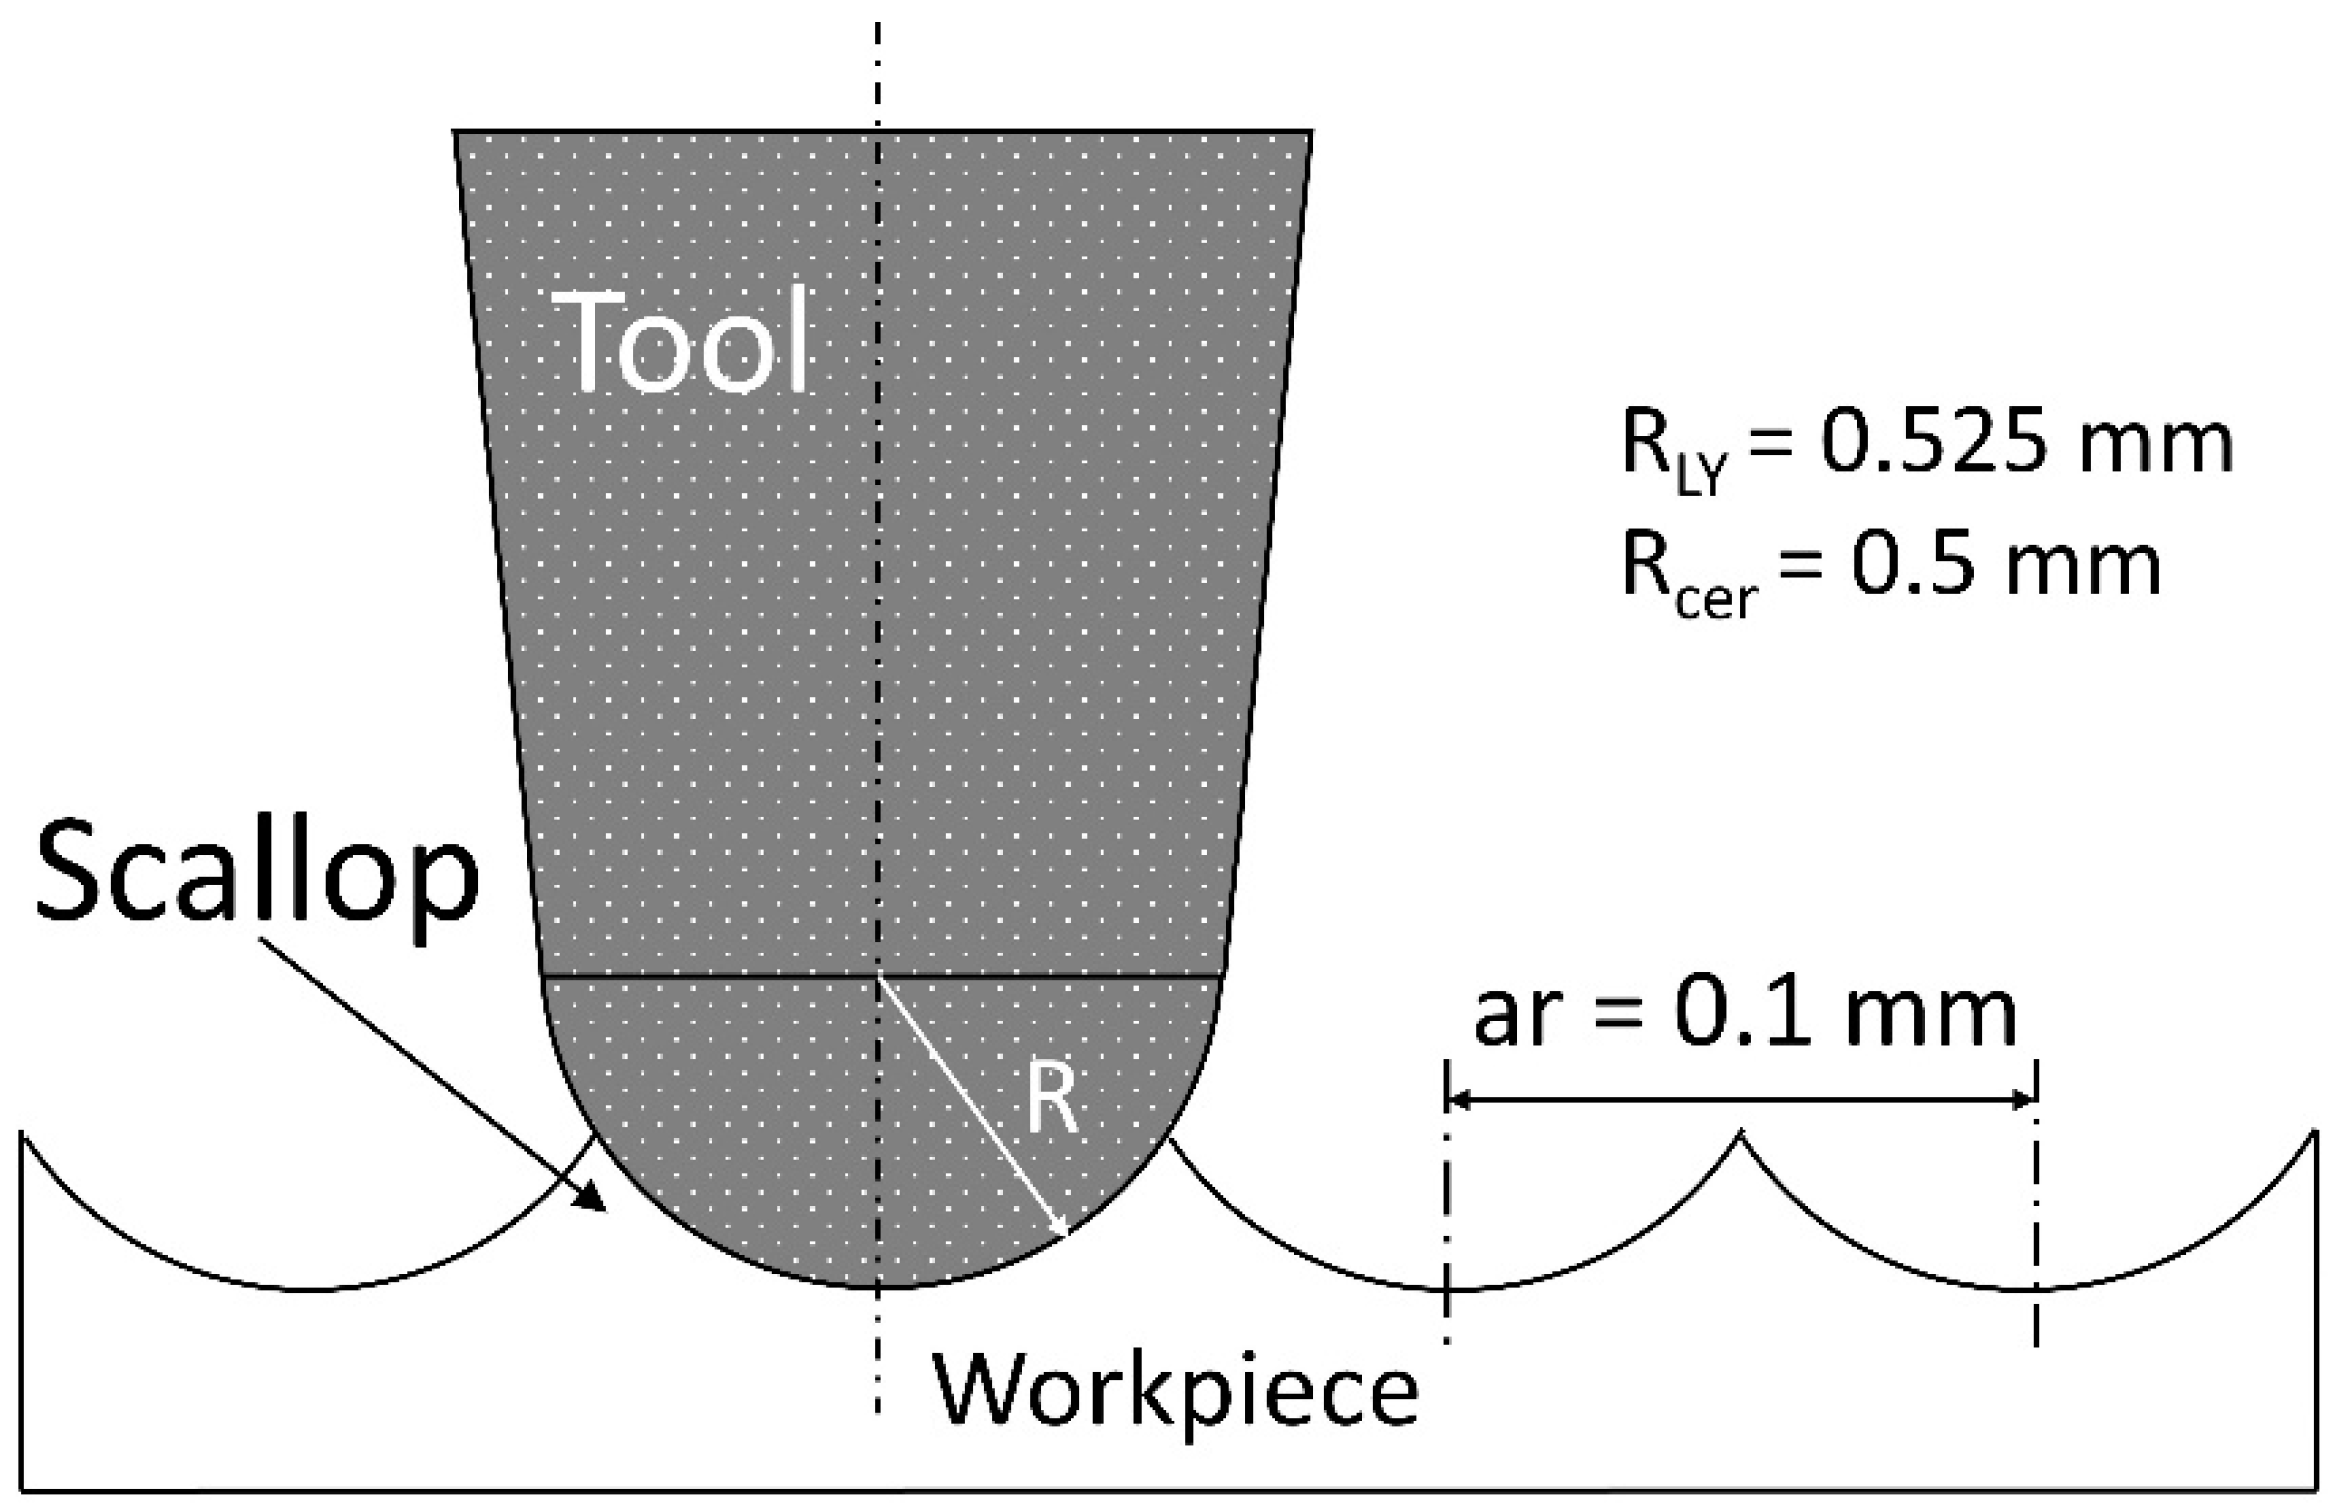
End milling with backwards and forwards sweeping (fifty in our case) using a ball-end tool tip and a constant radial depth (ar) should leave an anisotropic surface signature. This anisotropic signature should be generated by the scallop leaves on the surface by the combination of the tool tip geometry and two consecutive sweeps (
Figure 9). Nevertheless, the milled surface observations (
Figure 4) revealed isotropic surface topologies on all the samples. The isotropic topology was confirmed by additional roughness measurements parallel to the feed rate direction. These results suggest that ball-end tool geometry is not a key parameter that impacts roughness in end milling mode and highlights the importance of the tool diamond grits not taken into account by the geometrical model proposed and described in
Figure 9. In end milling mode, very few diamond grits are in contact with the machined surface and the tool wear is caused by a null cutting speed near the tool axis, increasing the pullout/wear of the grits. This phenomenon can explain the low roughness values observed on the milled surfaces with the two tools. The abrasive grains lost from the tool during milling can be displaced and compressed between the surface to be machined and the tool, causing three-body abrasion. The resulting phenomenon, called lapping [
32], is consistent with our results and leads to low roughness parameters and an isotropic surface topology.
To summarize, the isotropic topology is left by the milling toolpath (backwards and forwards sweeping) associated with the lapping phenomena caused by diamond grits immersed in the coolant.
With both tools, the 3D parameters Sz are four times greater, on average, compared to the 2D Rz parameters. This can be explained by a larger number of extreme values found on surfaces than on linear profiles.
It was also noticed that the standard deviations (SD) were lower for the Ra and Sa parameters. The Ra and Sa parameters are based on an arithmetic mean, so extreme points have a limited influence on Ra and Sa. Rt, Rz, Sq, and Sz are extremum parameters. Due to the intrinsic definition/formula of these roughness parameters, giving a lot of weight to the maximum points, Rt, Rz, Sq, and Sz are very sensitive to these maximum values, which is why there SD values are higher.
4.2. Surface Roughness vs. Biomaterial Hardness
It was observed that the roughness due to CD and MK surface were higher than those due to the LU and EN surface, whatever the tool used and the roughness parameter chosen. Although the milling mode and the machining parameters tested lacked a precise description in their article, Mota et al. also found that EN and LU biomaterials each exhibited a lower roughness than the others after milling [
33].
In our study,
Figure 7 shows that arithmetic roughness depends on the biomaterial’s Vickers hardness (Hv). In the range 107.3 (LU) to 254.9 Hv (EN), arithmetic roughness parameters fluctuate, and no trend can be found. Then, from 254.9 (EN) to 640 Hv (MK) a smooth roughness increase is observed. Finally, up to 737 Hv (CD) a more abrupt increase is observed. In conclusion, the arithmetic roughness is influenced by the biomaterial milled, more specifically its hardness.
4.3. Surface Roughness vs. Feed Rate
For the eight tool-biomaterial couples, it was observed that the 2D and 3D roughness was weakly dependent on the feed rate in end milling, regardless of the standard deviation. The lapping phenomenon seemed to be dependent on the feed rate, thus explaining the slightly higher roughness parameters at high feed rates [
34,
35]. In these conditions, a higher feed rate seems to be a better solution to save manufacturing time, without significantly increasing roughness. Although the milling conditions tested were not representative of CAD/CAM milling, Chavali et al. in their article also found that opportunities may exist for exploring increased feed rates during the milling process when polymer-containing materials (Lava Ultimate and Enamic) are used in an effort to decrease milling times [
36].
It was also noticed that for all the feed rates, the Sq 3D roughness parameters measured on surfaces were equal or slightly higher than the arithmetical average Sa 3D roughness. The 3D Sq parameter represents the standard deviation of roughness. From the point of view of the machined surfaces optical quality, it is better to have surfaces having a Sq equivalent to Sa. The Sq parameter gives more weight to the extremum values, a low Sq reveals the absence of significant peaks and valleys, sources of diffuse light reflection not revealed through the arithmetic Sa parameter.
4.4. Statistics
For the eight tool-biomaterial couples tested and according to the definitions of the roughness parameters, we observed greater sensitivity of parameters Rt, Rz, Sz and Sq to extremum points. As a result, these roughness parameters exhibited higher mean values and higher standard deviations compared to Ra and Sa (arithmetic parameters). Hence, the K-W statistical tests (α = 0.05) were performed only on the arithmetic parameters Ra and Sa which were less sensitive to the extreme values. K-W pairwise correlations of the Ra and Sa roughness parameters were established (
Table 4 and
Table 5).
Except for two Sa parameter statistical comparisons (LULY/LUCER, CDCER/CDLY), the K-W tests revealed the influence of the tool used in end milling mode on the Ra and Sa roughness parameters. This tool influence, not highlighted by the results of the surface roughness experiments (§4.1), was revealed by the K-W statistical tests. One Ra exception (ENLY/MKLY), and four Sa exceptions (ENLY/LULY, MKCER/LUCER, MKLY/ENLY, CDLY/ MKLY) were observed. Each time these exceptions corresponded to different biomaterials machined with the same tool, thus confirming the secondary influence of the milled biomaterial on the roughness parameters during end milling.
To summarize, according to the Ra and Sa K-W statistical results, the tool has first an influence on the roughness obtained by end milling mode. The machined biomaterial secondly influences the roughness.
4.5. Flank Milling Mode vs. End Milling Mode
A previous study [
37] showed that higher roughness and anisotropic topology are generated in flank milling mode compared to the roughness and isotropic topology obtained in end milling mode. However, the flank milling mode is applied on the peripheric areas, while the end milling mode is applied on the occlusal areas. As a result, each area can be milled with the best tool-biomaterial couple able to satisfy the expected local functional specifications.
Although we observed surface topology and measured roughness on surfaces milled in end milling mode, other factors have to be considered for a more comprehensive assessment of the obtained surface integrity. In this regard, the impacts of the coolant and the tool wear were not taken into account in this study. Moreover, further measurements on curved surfaces known to facilitate roughness filtering should be undertaken.
5. Conclusions
The milling mode, the relative orientation between the axis of the diamond rotary cutting instruments and the prosthesis surface have a significant impact on surface integrity and more specifically on roughness. Several prosthesis surface requirements such as aesthetics, biological response (soft tissue response and plaque accumulation) and mechanical behavior are influenced by residual roughness after milling. Therefore, for each clinical requirement, a specific roughness can be manufactured with the appropriate milling mode.
Under the limitations of this study, the following conclusions can be drawn. The tool-material couple must be taken into account when the prosthesis surfaces are manufactured with the end milling mode. Indeed, the milled surface roughness is affected by the biomaterial’s hardness. The roughness also depends on the tool, and less on the feed rate.
Our results suggest that the tool used in end milling mode must be chosen in correlation with the expected surface roughness and the dental biomaterial milled, which both obviously affect the integrity of the surface. High feed rates can be set to save manufacturing time, without significantly increasing roughness.
The lapping phenomenon seems to occur and generate low roughness parameters in end milling mode. According to our results, end milling mode is an obvious choice when producing a dental prosthesis for which low roughness is desired.


